Cities with the Highest Percentage of Population Employed in Legal Services & Support in Connecticut
RELATED REPORTS & OPTIONS
Legal Services & Support
Connecticut
Compare Cities
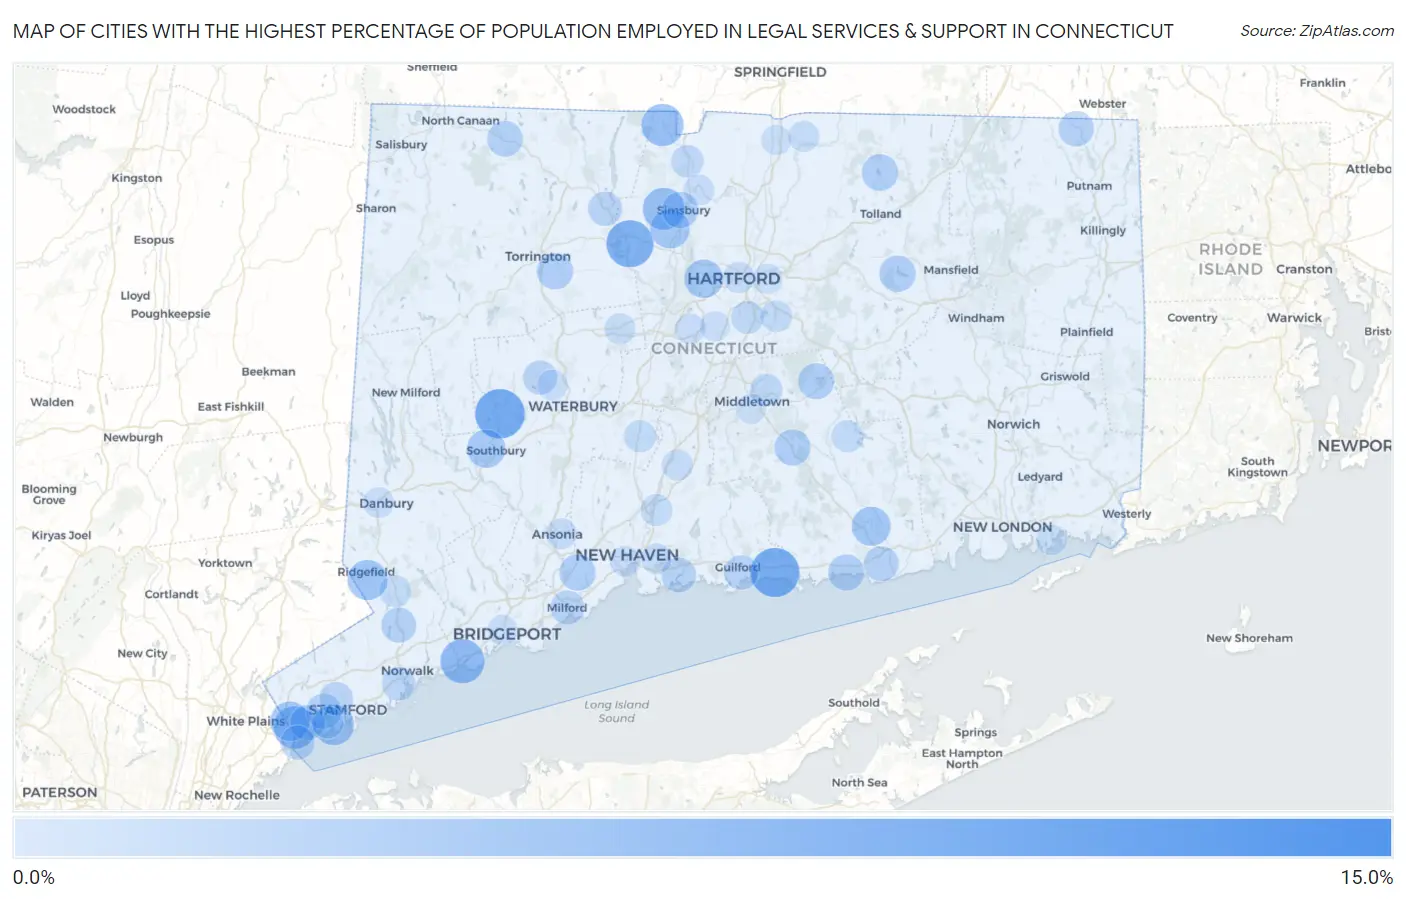
Map of Cities with the Highest Percentage of Population Employed in Legal Services & Support in Connecticut
0.0%
15.0%
Cities with the Highest Percentage of Population Employed in Legal Services & Support in Connecticut
| City | % Employed | vs State | vs National | |
| 1. | Mamanasco Lake | 12.2% | 1.4%(+10.8)#1 | 1.2%(+11.1)#157 |
| 2. | West Mountain | 10.2% | 1.4%(+8.80)#2 | 1.2%(+9.04)#213 |
| 3. | Coleytown | 8.8% | 1.4%(+7.43)#3 | 1.2%(+7.66)#282 |
| 4. | Woodbury Center | 8.3% | 1.4%(+6.92)#4 | 1.2%(+7.15)#317 |
| 5. | Madison Center | 8.2% | 1.4%(+6.75)#5 | 1.2%(+6.99)#330 |
| 6. | Greens Farms | 8.1% | 1.4%(+6.66)#6 | 1.2%(+6.89)#338 |
| 7. | Taylor Corners | 7.8% | 1.4%(+6.34)#7 | 1.2%(+6.57)#355 |
| 8. | Collinsville | 7.4% | 1.4%(+5.97)#8 | 1.2%(+6.20)#391 |
| 9. | Poplar Plains | 6.9% | 1.4%(+5.44)#9 | 1.2%(+5.67)#454 |
| 10. | Southport | 6.2% | 1.4%(+4.76)#10 | 1.2%(+4.99)#568 |
| 11. | Pemberwick | 5.5% | 1.4%(+4.12)#11 | 1.2%(+4.35)#705 |
| 12. | Lordship | 5.5% | 1.4%(+4.12)#12 | 1.2%(+4.35)#707 |
| 13. | North Granby | 5.4% | 1.4%(+3.95)#13 | 1.2%(+4.19)#739 |
| 14. | West Simsbury | 5.3% | 1.4%(+3.87)#14 | 1.2%(+4.10)#757 |
| 15. | New Canaan | 5.1% | 1.4%(+3.72)#15 | 1.2%(+3.95)#809 |
| 16. | Groton Long Point Borough | 5.1% | 1.4%(+3.66)#16 | 1.2%(+3.89)#820 |
| 17. | Staples | 4.9% | 1.4%(+3.53)#17 | 1.2%(+3.76)#857 |
| 18. | Old Greenwich | 4.8% | 1.4%(+3.34)#18 | 1.2%(+3.58)#920 |
| 19. | Ridgefield | 4.5% | 1.4%(+3.05)#19 | 1.2%(+3.29)#1,022 |
| 20. | Glenville | 4.4% | 1.4%(+2.95)#20 | 1.2%(+3.18)#1,056 |
| 21. | Weatogue | 4.3% | 1.4%(+2.85)#21 | 1.2%(+3.08)#1,100 |
| 22. | Jewett City Borough | 4.3% | 1.4%(+2.85)#22 | 1.2%(+3.08)#1,101 |
| 23. | Essex Village | 4.1% | 1.4%(+2.69)#23 | 1.2%(+2.92)#1,178 |
| 24. | West Hartford | 3.9% | 1.4%(+2.50)#24 | 1.2%(+2.74)#1,273 |
| 25. | Heritage Village | 3.8% | 1.4%(+2.42)#25 | 1.2%(+2.66)#1,312 |
| 26. | Lakes West | 3.8% | 1.4%(+2.35)#26 | 1.2%(+2.59)#1,338 |
| 27. | Murray | 3.6% | 1.4%(+2.21)#27 | 1.2%(+2.45)#1,444 |
| 28. | Weston | 3.6% | 1.4%(+2.17)#28 | 1.2%(+2.40)#1,471 |
| 29. | Stonington Borough | 3.6% | 1.4%(+2.16)#29 | 1.2%(+2.40)#1,475 |
| 30. | Tokeneke | 3.5% | 1.4%(+2.07)#30 | 1.2%(+2.31)#1,542 |
| 31. | Stepney | 3.2% | 1.4%(+1.77)#31 | 1.2%(+2.01)#1,762 |
| 32. | Crystal Lake | 3.1% | 1.4%(+1.69)#32 | 1.2%(+1.92)#1,832 |
| 33. | Coventry Lake | 3.1% | 1.4%(+1.68)#33 | 1.2%(+1.91)#1,838 |
| 34. | Simsbury Center | 3.1% | 1.4%(+1.67)#34 | 1.2%(+1.91)#1,844 |
| 35. | Lakes East | 3.1% | 1.4%(+1.64)#35 | 1.2%(+1.87)#1,872 |
| 36. | Orange | 3.1% | 1.4%(+1.64)#36 | 1.2%(+1.87)#1,875 |
| 37. | Woodmont Borough | 3.0% | 1.4%(+1.61)#37 | 1.2%(+1.84)#1,901 |
| 38. | Northwest Harwinton | 3.0% | 1.4%(+1.59)#38 | 1.2%(+1.82)#1,922 |
| 39. | Lake Pocotopaug | 3.0% | 1.4%(+1.59)#39 | 1.2%(+1.82)#1,926 |
| 40. | Higganum | 3.0% | 1.4%(+1.59)#40 | 1.2%(+1.82)#1,929 |
| 41. | Westbrook Center | 3.0% | 1.4%(+1.58)#41 | 1.2%(+1.81)#1,936 |
| 42. | Bigelow Corners | 2.9% | 1.4%(+1.49)#42 | 1.2%(+1.73)#2,020 |
| 43. | Noroton | 2.9% | 1.4%(+1.47)#43 | 1.2%(+1.71)#2,038 |
| 44. | Norfolk | 2.8% | 1.4%(+1.43)#44 | 1.2%(+1.67)#2,073 |
| 45. | Tashua | 2.8% | 1.4%(+1.43)#45 | 1.2%(+1.66)#2,077 |
| 46. | Oronoque | 2.8% | 1.4%(+1.40)#46 | 1.2%(+1.63)#2,112 |
| 47. | Quinebaug | 2.7% | 1.4%(+1.30)#47 | 1.2%(+1.54)#2,222 |
| 48. | Cos Cob | 2.7% | 1.4%(+1.25)#48 | 1.2%(+1.48)#2,270 |
| 49. | Wilton Center | 2.6% | 1.4%(+1.16)#49 | 1.2%(+1.39)#2,378 |
| 50. | Old Saybrook Center | 2.6% | 1.4%(+1.15)#50 | 1.2%(+1.38)#2,385 |
| 51. | Greenwich | 2.5% | 1.4%(+1.11)#51 | 1.2%(+1.34)#2,421 |
| 52. | Branford Center | 2.4% | 1.4%(+1.02)#52 | 1.2%(+1.26)#2,513 |
| 53. | Stratford Downtown | 2.4% | 1.4%(+0.998)#53 | 1.2%(+1.23)#2,563 |
| 54. | Guilford Center | 2.4% | 1.4%(+0.939)#54 | 1.2%(+1.17)#2,641 |
| 55. | Newtown Borough | 2.3% | 1.4%(+0.932)#55 | 1.2%(+1.17)#2,655 |
| 56. | Westport | 2.3% | 1.4%(+0.889)#56 | 1.2%(+1.12)#2,711 |
| 57. | Byram | 2.3% | 1.4%(+0.878)#57 | 1.2%(+1.11)#2,723 |
| 58. | Old Hill | 2.3% | 1.4%(+0.853)#58 | 1.2%(+1.09)#2,762 |
| 59. | New Hartford Center | 2.2% | 1.4%(+0.816)#59 | 1.2%(+1.05)#2,826 |
| 60. | Watertown | 2.2% | 1.4%(+0.781)#60 | 1.2%(+1.02)#2,869 |
| 61. | Milford City Balance | 2.2% | 1.4%(+0.772)#61 | 1.2%(+1.01)#2,889 |
| 62. | Stamford | 2.1% | 1.4%(+0.674)#62 | 1.2%(+0.908)#3,052 |
| 63. | Saugatuck | 2.1% | 1.4%(+0.670)#63 | 1.2%(+0.904)#3,062 |
| 64. | Norwalk | 2.0% | 1.4%(+0.580)#64 | 1.2%(+0.814)#3,219 |
| 65. | Candlewood Orchards | 2.0% | 1.4%(+0.575)#65 | 1.2%(+0.810)#3,226 |
| 66. | Daniels Farm | 1.9% | 1.4%(+0.516)#66 | 1.2%(+0.750)#3,337 |
| 67. | Wethersfield | 1.7% | 1.4%(+0.260)#67 | 1.2%(+0.494)#3,945 |
| 68. | Mill Plain | 1.7% | 1.4%(+0.234)#68 | 1.2%(+0.468)#3,996 |
| 69. | Portland | 1.6% | 1.4%(+0.225)#69 | 1.2%(+0.459)#4,019 |
| 70. | Salmon Brook | 1.6% | 1.4%(+0.179)#70 | 1.2%(+0.413)#4,130 |
| 71. | South Wilton | 1.5% | 1.4%(+0.099)#71 | 1.2%(+0.333)#4,359 |
| 72. | Cheshire Village | 1.5% | 1.4%(+0.082)#72 | 1.2%(+0.316)#4,407 |
| 73. | Moodus | 1.5% | 1.4%(+0.082)#73 | 1.2%(+0.316)#4,408 |
| 74. | Indian Field | 1.5% | 1.4%(+0.060)#74 | 1.2%(+0.294)#4,489 |
| 75. | Riverside | 1.4% | 1.4%(+0.025)#75 | 1.2%(+0.259)#4,600 |
| 76. | North Haven | 1.4% | 1.4%(-0.052)#76 | 1.2%(+0.182)#4,851 |
| 77. | Georgetown | 1.4% | 1.4%(-0.068)#77 | 1.2%(+0.166)#4,901 |
| 78. | Glastonbury Center | 1.3% | 1.4%(-0.152)#78 | 1.2%(+0.082)#5,180 |
| 79. | Litchfield Borough | 1.2% | 1.4%(-0.202)#79 | 1.2%(+0.032)#5,393 |
| 80. | Hartford | 1.1% | 1.4%(-0.276)#80 | 1.2%(-0.042)#5,680 |
| 81. | Wallingford Center | 1.1% | 1.4%(-0.282)#81 | 1.2%(-0.047)#5,704 |
| 82. | Bristol | 1.1% | 1.4%(-0.283)#82 | 1.2%(-0.049)#5,710 |
| 83. | Compo | 1.1% | 1.4%(-0.285)#83 | 1.2%(-0.050)#5,718 |
| 84. | Hazardville | 1.1% | 1.4%(-0.362)#84 | 1.2%(-0.128)#6,084 |
| 85. | Ansonia | 1.0% | 1.4%(-0.387)#85 | 1.2%(-0.153)#6,215 |
| 86. | Tariffville | 1.0% | 1.4%(-0.403)#86 | 1.2%(-0.169)#6,298 |
| 87. | Noroton Heights | 0.95% | 1.4%(-0.468)#87 | 1.2%(-0.234)#6,627 |
| 88. | Oakville | 0.91% | 1.4%(-0.504)#88 | 1.2%(-0.270)#6,815 |
| 89. | Sandy Hook | 0.90% | 1.4%(-0.518)#89 | 1.2%(-0.284)#6,878 |
| 90. | East Haven | 0.89% | 1.4%(-0.527)#90 | 1.2%(-0.293)#6,927 |
| 91. | Danbury | 0.88% | 1.4%(-0.542)#91 | 1.2%(-0.308)#7,005 |
| 92. | New Britain | 0.87% | 1.4%(-0.550)#92 | 1.2%(-0.316)#7,055 |
| 93. | Ball Pond | 0.87% | 1.4%(-0.553)#93 | 1.2%(-0.319)#7,065 |
| 94. | New Haven | 0.86% | 1.4%(-0.562)#94 | 1.2%(-0.328)#7,117 |
| 95. | Noank | 0.83% | 1.4%(-0.591)#95 | 1.2%(-0.357)#7,265 |
| 96. | Newington | 0.79% | 1.4%(-0.630)#96 | 1.2%(-0.396)#7,493 |
| 97. | Thompsonville | 0.77% | 1.4%(-0.649)#97 | 1.2%(-0.415)#7,624 |
| 98. | East Hartford | 0.75% | 1.4%(-0.668)#98 | 1.2%(-0.434)#7,747 |
| 99. | Bridgeport | 0.73% | 1.4%(-0.685)#99 | 1.2%(-0.451)#7,851 |
| 100. | Middletown | 0.73% | 1.4%(-0.690)#100 | 1.2%(-0.456)#7,880 |
Common Questions
What are the Top 10 Cities with the Highest Percentage of Population Employed in Legal Services & Support in Connecticut?
Top 10 Cities with the Highest Percentage of Population Employed in Legal Services & Support in Connecticut are:
#1
8.3%
#2
8.2%
#3
7.4%
#4
6.2%
#5
5.5%
#6
5.4%
#7
5.3%
#8
4.8%
#9
4.5%
#10
4.4%
What city has the Highest Percentage of Population Employed in Legal Services & Support in Connecticut?
Woodbury Center has the Highest Percentage of Population Employed in Legal Services & Support in Connecticut with 8.3%.
What is the Percentage of Population Employed in Legal Services & Support in the State of Connecticut?
Percentage of Population Employed in Legal Services & Support in Connecticut is 1.4%.
What is the Percentage of Population Employed in Legal Services & Support in the United States?
Percentage of Population Employed in Legal Services & Support in the United States is 1.2%.