Del Mar, CA Map & Demographics
Del Mar Map
Del Mar Overview
$135,828
PER CAPITA INCOME
$244,028
AVG FAMILY INCOME
$185,335
AVG HOUSEHOLD INCOME
50.2%
WAGE / INCOME GAP [ % ]
49.8¢/ $1
WAGE / INCOME GAP [ $ ]
0.52
INEQUALITY / GINI INDEX
3,956
TOTAL POPULATION
1,880
MALE POPULATION
2,076
FEMALE POPULATION
90.56
MALES / 100 FEMALES
110.43
FEMALES / 100 MALES
52.0
MEDIAN AGE
2.6
AVG FAMILY SIZE
2.2
AVG HOUSEHOLD SIZE
2,138
LABOR FORCE [ PEOPLE ]
62.3%
PERCENT IN LABOR FORCE
2.0%
UNEMPLOYMENT RATE
Del Mar Zip Codes
Del Mar Area Codes
Income in Del Mar
Income Overview in Del Mar
Per Capita Income in Del Mar is $135,828, while median incomes of families and households are $244,028 and $185,335 respectively.
| Characteristic | Number | Measure |
| Per Capita Income | 3,956 | $135,828 |
| Median Family Income | 1,163 | $244,028 |
| Mean Family Income | 1,163 | $332,537 |
| Median Household Income | 1,822 | $185,335 |
| Mean Household Income | 1,822 | $290,370 |
| Income Deficit | 1,163 | $0 |
| Wage / Income Gap (%) | 3,956 | 50.24% |
| Wage / Income Gap ($) | 3,956 | 49.76¢ per $1 |
| Gini / Inequality Index | 3,956 | 0.52 |
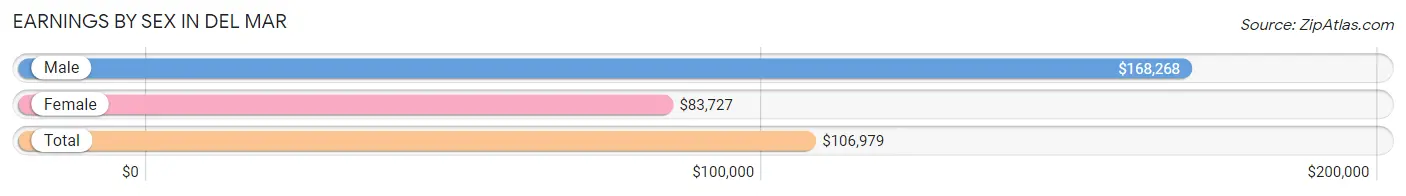
Earnings by Sex in Del Mar
Average Earnings in Del Mar are $106,979, $168,268 for men and $83,727 for women, a difference of 50.2%.
| Sex | Number | Average Earnings |
| Male | 1,219 (51.6%) | $168,268 |
| Female | 1,142 (48.4%) | $83,727 |
| Total | 2,361 (100.0%) | $106,979 |
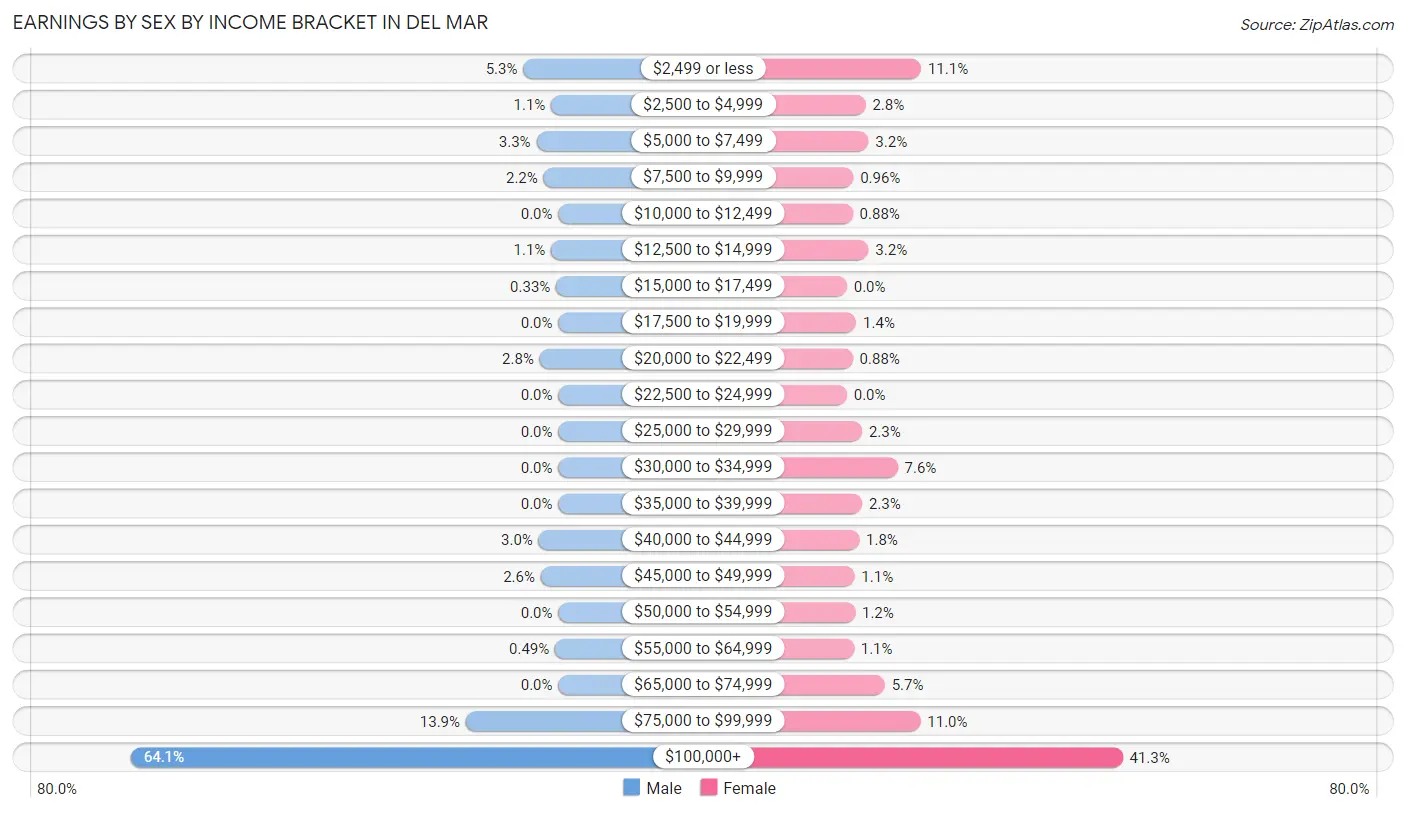
Earnings by Sex by Income Bracket in Del Mar
The most common earnings brackets in Del Mar are $100,000+ for men (781 | 64.1%) and $100,000+ for women (472 | 41.3%).
| Income | Male | Female |
| $2,499 or less | 64 (5.2%) | 127 (11.1%) |
| $2,500 to $4,999 | 13 (1.1%) | 32 (2.8%) |
| $5,000 to $7,499 | 40 (3.3%) | 37 (3.2%) |
| $7,500 to $9,999 | 27 (2.2%) | 11 (1.0%) |
| $10,000 to $12,499 | 0 (0.0%) | 10 (0.9%) |
| $12,500 to $14,999 | 13 (1.1%) | 37 (3.2%) |
| $15,000 to $17,499 | 4 (0.3%) | 0 (0.0%) |
| $17,500 to $19,999 | 0 (0.0%) | 16 (1.4%) |
| $20,000 to $22,499 | 34 (2.8%) | 10 (0.9%) |
| $22,500 to $24,999 | 0 (0.0%) | 0 (0.0%) |
| $25,000 to $29,999 | 0 (0.0%) | 26 (2.3%) |
| $30,000 to $34,999 | 0 (0.0%) | 87 (7.6%) |
| $35,000 to $39,999 | 0 (0.0%) | 26 (2.3%) |
| $40,000 to $44,999 | 36 (2.9%) | 21 (1.8%) |
| $45,000 to $49,999 | 32 (2.6%) | 13 (1.1%) |
| $50,000 to $54,999 | 0 (0.0%) | 14 (1.2%) |
| $55,000 to $64,999 | 6 (0.5%) | 12 (1.1%) |
| $65,000 to $74,999 | 0 (0.0%) | 65 (5.7%) |
| $75,000 to $99,999 | 169 (13.9%) | 126 (11.0%) |
| $100,000+ | 781 (64.1%) | 472 (41.3%) |
| Total | 1,219 (100.0%) | 1,142 (100.0%) |
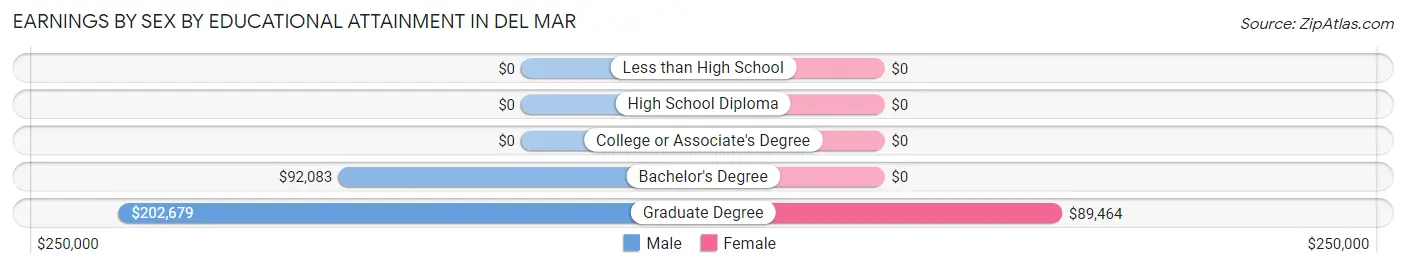
Earnings by Sex by Educational Attainment in Del Mar
Average earnings in Del Mar are $168,906 for men and $87,740 for women, a difference of 48.0%. Men with an educational attainment of graduate degree enjoy the highest average annual earnings of $202,679, while those with bachelor's degree education earn the least with $92,083. Women with an educational attainment of graduate degree earn the most with the average annual earnings of $89,464, while those with graduate degree education have the smallest earnings of $89,464.
| Educational Attainment | Male Income | Female Income |
| Less than High School | - | - |
| High School Diploma | - | - |
| College or Associate's Degree | - | - |
| Bachelor's Degree | $92,083 | $0 |
| Graduate Degree | $202,679 | $89,464 |
| Total | $168,906 | $87,740 |
Family Income in Del Mar
Family Income Brackets in Del Mar
According to the Del Mar family income data, there are 659 families falling into the $200,000+ income range, which is the most common income bracket and makes up 56.7% of all families.
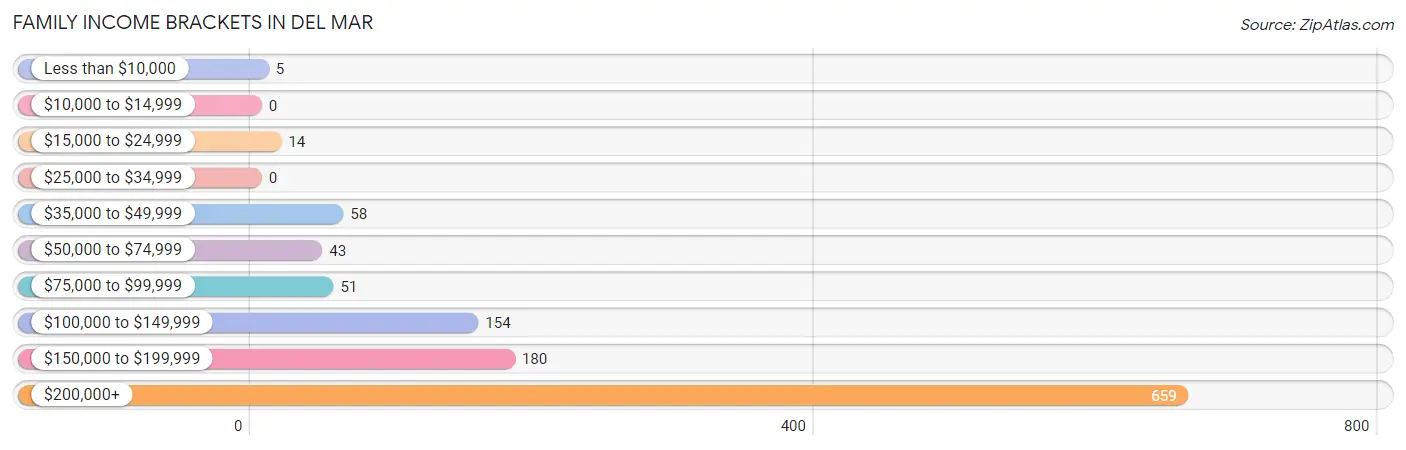
| Income Bracket | # Families | % Families |
| Less than $10,000 | 5 | 0.4% |
| $10,000 to $14,999 | 0 | 0.0% |
| $15,000 to $24,999 | 14 | 1.2% |
| $25,000 to $34,999 | 0 | 0.0% |
| $35,000 to $49,999 | 58 | 5.0% |
| $50,000 to $74,999 | 43 | 3.7% |
| $75,000 to $99,999 | 51 | 4.4% |
| $100,000 to $149,999 | 154 | 13.2% |
| $150,000 to $199,999 | 180 | 15.5% |
| $200,000+ | 659 | 56.7% |
Family Income by Famaliy Size in Del Mar
3-person families (258 | 22.2%) account for the highest median family income in Del Mar with $250,001 per family, while 2-person families (774 | 66.5%) have the highest median income of $106,346 per family member.
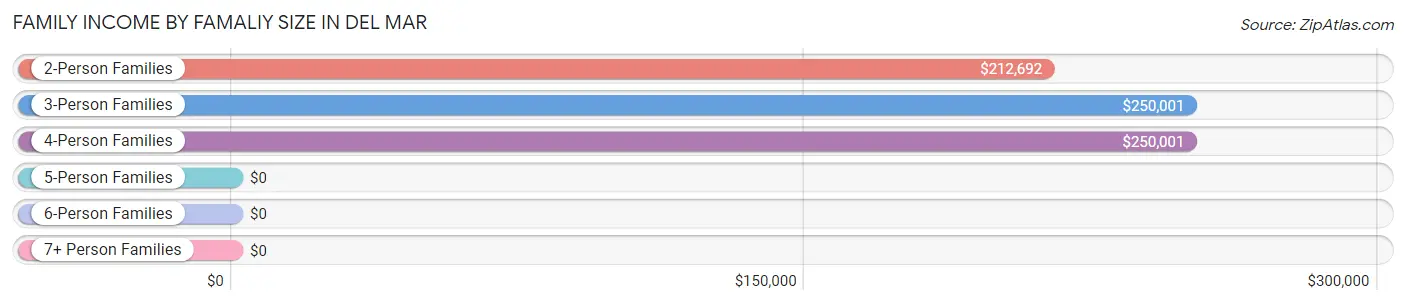
| Income Bracket | # Families | Median Income |
| 2-Person Families | 774 (66.5%) | $212,692 |
| 3-Person Families | 258 (22.2%) | $250,001 |
| 4-Person Families | 104 (8.9%) | $250,001 |
| 5-Person Families | 27 (2.3%) | $0 |
| 6-Person Families | 0 (0.0%) | $0 |
| 7+ Person Families | 0 (0.0%) | $0 |
| Total | 1,163 (100.0%) | $244,028 |
Family Income by Number of Earners in Del Mar
The median family income in Del Mar is $244,028, with families comprising 2 earners (543) having the highest median family income of $250,001, while families with no earners (230) have the lowest median family income of $115,556, accounting for 46.7% and 19.8% of families, respectively.
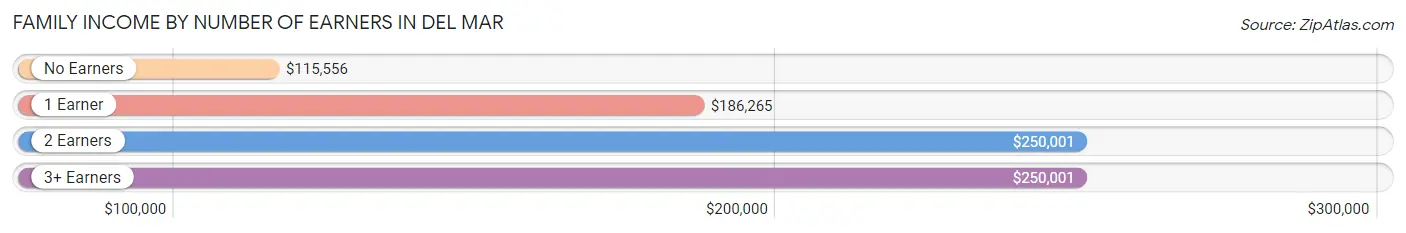
| Number of Earners | # Families | Median Income |
| No Earners | 230 (19.8%) | $115,556 |
| 1 Earner | 323 (27.8%) | $186,265 |
| 2 Earners | 543 (46.7%) | $250,001 |
| 3+ Earners | 67 (5.8%) | $250,001 |
| Total | 1,163 (100.0%) | $244,028 |
Household Income in Del Mar
Household Income Brackets in Del Mar
With 813 households falling in the category, the $200,000+ income range is the most frequent in Del Mar, accounting for 44.6% of all households. In contrast, only 9 households (0.5%) fall into the $10,000 to $14,999 income bracket, making it the least populous group.
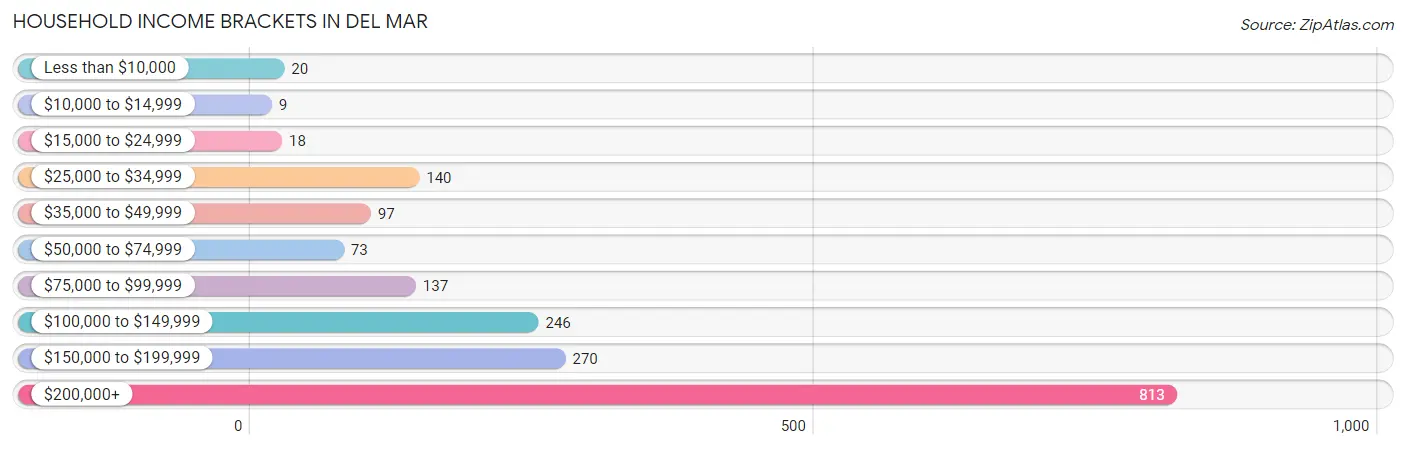
| Income Bracket | # Households | % Households |
| Less than $10,000 | 20 | 1.1% |
| $10,000 to $14,999 | 9 | 0.5% |
| $15,000 to $24,999 | 18 | 1.0% |
| $25,000 to $34,999 | 140 | 7.7% |
| $35,000 to $49,999 | 97 | 5.3% |
| $50,000 to $74,999 | 73 | 4.0% |
| $75,000 to $99,999 | 137 | 7.5% |
| $100,000 to $149,999 | 246 | 13.5% |
| $150,000 to $199,999 | 270 | 14.8% |
| $200,000+ | 813 | 44.6% |
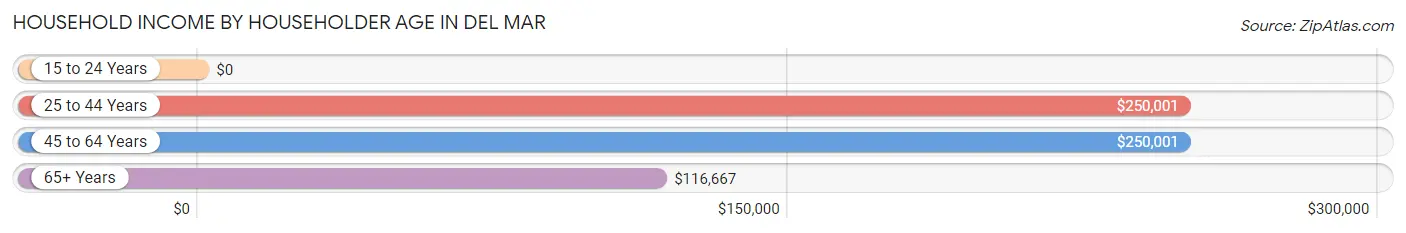
Household Income by Householder Age in Del Mar
The median household income in Del Mar is $185,335, with the highest median household income of $250,001 found in the 25 to 44 years age bracket for the primary householder. A total of 337 households (18.5%) fall into this category.
| Income Bracket | # Households | Median Income |
| 15 to 24 Years | 0 (0.0%) | $0 |
| 25 to 44 Years | 337 (18.5%) | $250,001 |
| 45 to 64 Years | 713 (39.1%) | $250,001 |
| 65+ Years | 772 (42.4%) | $116,667 |
| Total | 1,822 (100.0%) | $185,335 |
Poverty in Del Mar
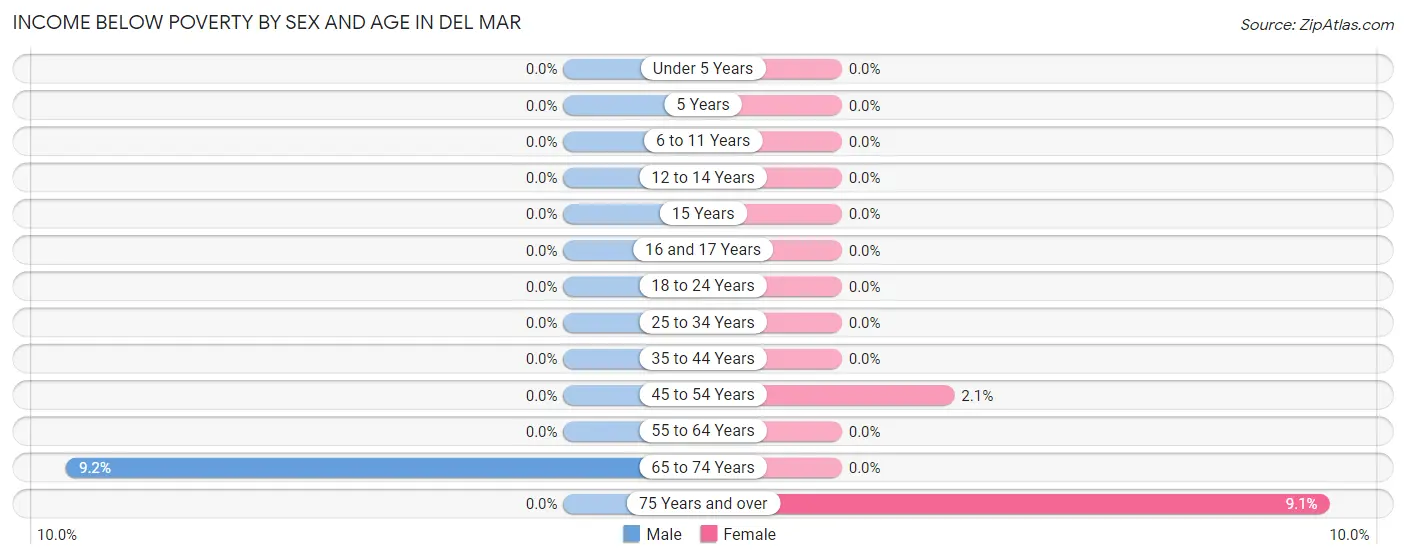
Income Below Poverty by Sex and Age in Del Mar
With 1.9% poverty level for males and 1.5% for females among the residents of Del Mar, 65 to 74 year old males and 75 year old and over females are the most vulnerable to poverty, with 36 males (9.2%) and 20 females (9.0%) in their respective age groups living below the poverty level.
| Age Bracket | Male | Female |
| Under 5 Years | 0 (0.0%) | 0 (0.0%) |
| 5 Years | 0 (0.0%) | 0 (0.0%) |
| 6 to 11 Years | 0 (0.0%) | 0 (0.0%) |
| 12 to 14 Years | 0 (0.0%) | 0 (0.0%) |
| 15 Years | 0 (0.0%) | 0 (0.0%) |
| 16 and 17 Years | 0 (0.0%) | 0 (0.0%) |
| 18 to 24 Years | 0 (0.0%) | 0 (0.0%) |
| 25 to 34 Years | 0 (0.0%) | 0 (0.0%) |
| 35 to 44 Years | 0 (0.0%) | 0 (0.0%) |
| 45 to 54 Years | 0 (0.0%) | 10 (2.1%) |
| 55 to 64 Years | 0 (0.0%) | 0 (0.0%) |
| 65 to 74 Years | 36 (9.2%) | 0 (0.0%) |
| 75 Years and over | 0 (0.0%) | 20 (9.0%) |
| Total | 36 (1.9%) | 30 (1.5%) |
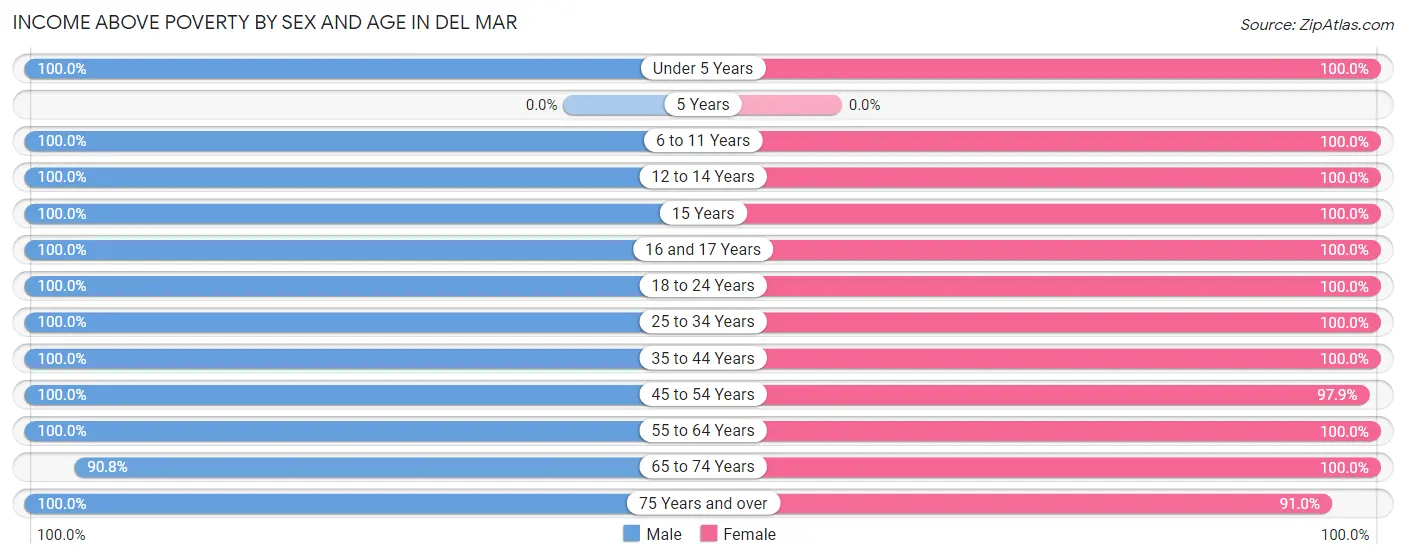
Income Above Poverty by Sex and Age in Del Mar
According to the poverty statistics in Del Mar, males aged under 5 years and females aged under 5 years are the age groups that are most secure financially, with 100.0% of males and 100.0% of females in these age groups living above the poverty line.
| Age Bracket | Male | Female |
| Under 5 Years | 21 (100.0%) | 77 (100.0%) |
| 5 Years | 0 (0.0%) | 0 (0.0%) |
| 6 to 11 Years | 114 (100.0%) | 116 (100.0%) |
| 12 to 14 Years | 36 (100.0%) | 90 (100.0%) |
| 15 Years | 44 (100.0%) | 14 (100.0%) |
| 16 and 17 Years | 10 (100.0%) | 26 (100.0%) |
| 18 to 24 Years | 49 (100.0%) | 54 (100.0%) |
| 25 to 34 Years | 188 (100.0%) | 187 (100.0%) |
| 35 to 44 Years | 188 (100.0%) | 162 (100.0%) |
| 45 to 54 Years | 218 (100.0%) | 469 (97.9%) |
| 55 to 64 Years | 348 (100.0%) | 265 (100.0%) |
| 65 to 74 Years | 354 (90.8%) | 372 (100.0%) |
| 75 Years and over | 274 (100.0%) | 201 (90.9%) |
| Total | 1,844 (98.1%) | 2,033 (98.6%) |
Income Below Poverty Among Married-Couple Families in Del Mar
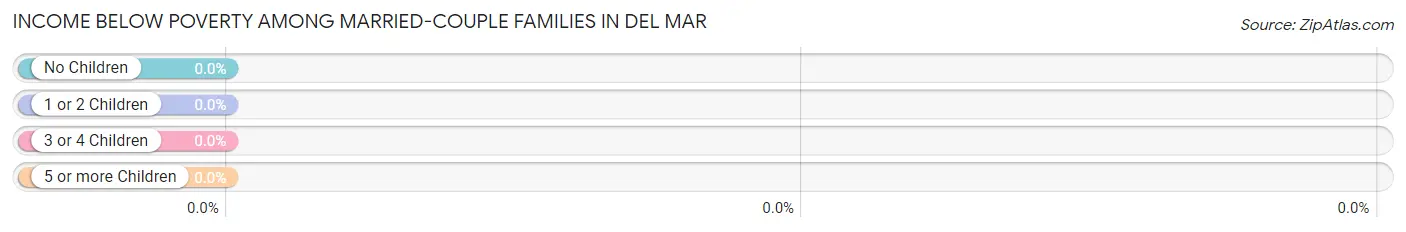
| Children | Above Poverty | Below Poverty |
| No Children | 802 (100.0%) | 0 (0.0%) |
| 1 or 2 Children | 238 (100.0%) | 0 (0.0%) |
| 3 or 4 Children | 27 (100.0%) | 0 (0.0%) |
| 5 or more Children | 0 (0.0%) | 0 (0.0%) |
| Total | 1,067 (100.0%) | 0 (0.0%) |
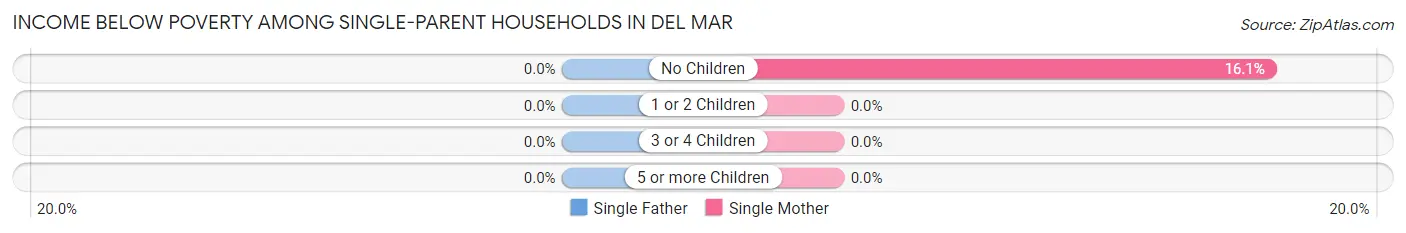
Income Below Poverty Among Single-Parent Households in Del Mar
| Children | Single Father | Single Mother |
| No Children | 0 (0.0%) | 5 (16.1%) |
| 1 or 2 Children | 0 (0.0%) | 0 (0.0%) |
| 3 or 4 Children | 0 (0.0%) | 0 (0.0%) |
| 5 or more Children | 0 (0.0%) | 0 (0.0%) |
| Total | 0 (0.0%) | 5 (9.8%) |
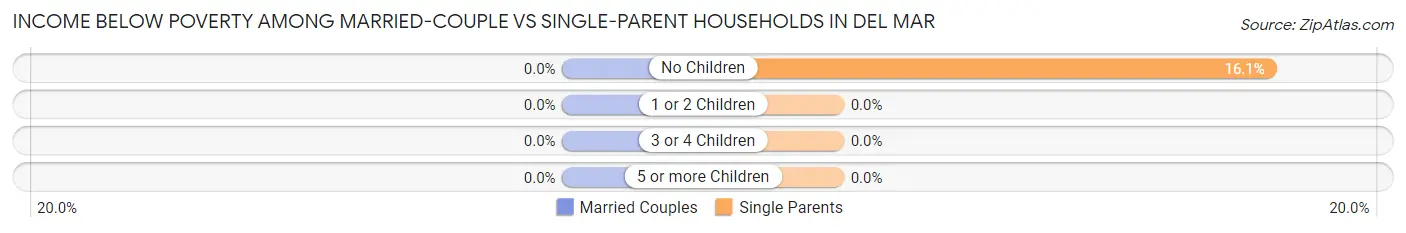
Income Below Poverty Among Married-Couple vs Single-Parent Households in Del Mar
| Children | Married-Couple Families | Single-Parent Households |
| No Children | 0 (0.0%) | 5 (16.1%) |
| 1 or 2 Children | 0 (0.0%) | 0 (0.0%) |
| 3 or 4 Children | 0 (0.0%) | 0 (0.0%) |
| 5 or more Children | 0 (0.0%) | 0 (0.0%) |
| Total | 0 (0.0%) | 5 (5.2%) |
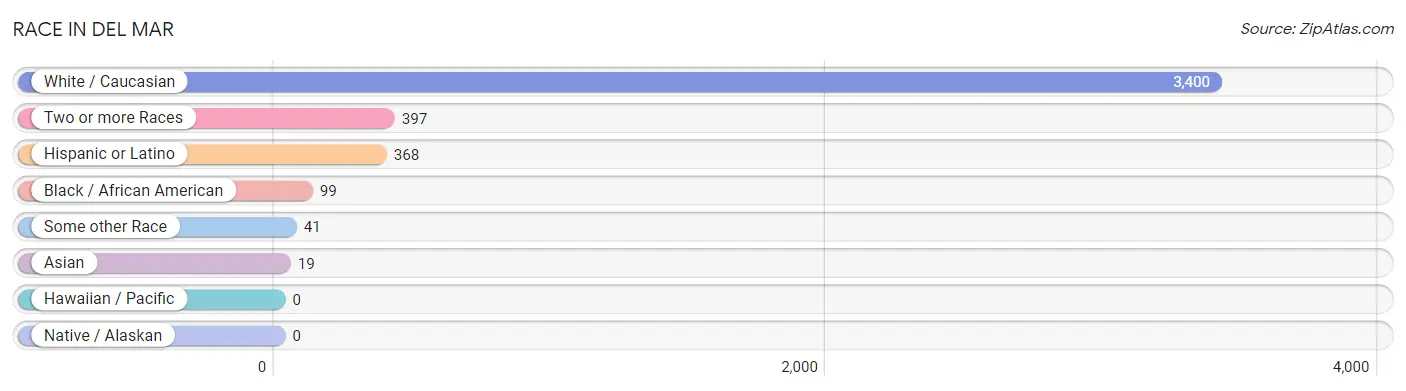
Race in Del Mar
The most populous races in Del Mar are White / Caucasian (3,400 | 86.0%), Two or more Races (397 | 10.0%), and Hispanic or Latino (368 | 9.3%).
| Race | # Population | % Population |
| Asian | 19 | 0.5% |
| Black / African American | 99 | 2.5% |
| Hawaiian / Pacific | 0 | 0.0% |
| Hispanic or Latino | 368 | 9.3% |
| Native / Alaskan | 0 | 0.0% |
| White / Caucasian | 3,400 | 86.0% |
| Two or more Races | 397 | 10.0% |
| Some other Race | 41 | 1.0% |
| Total | 3,956 | 100.0% |
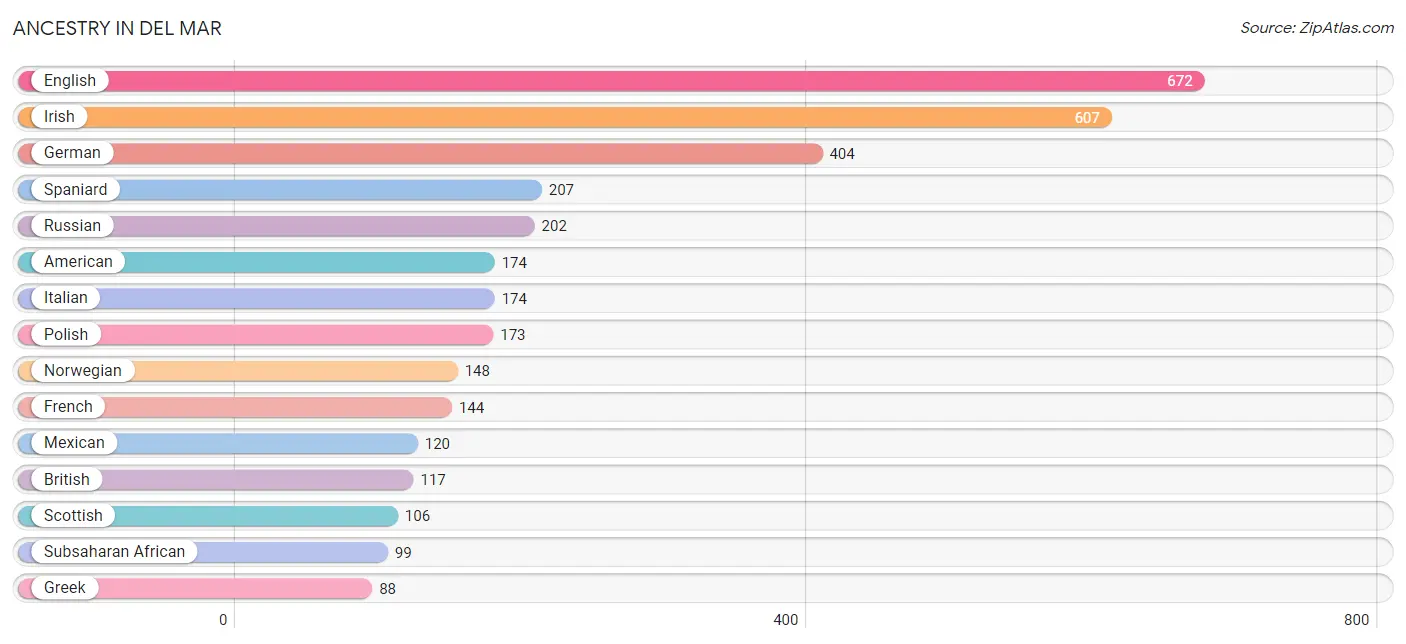
Ancestry in Del Mar
The most populous ancestries reported in Del Mar are English (672 | 17.0%), Irish (607 | 15.3%), German (404 | 10.2%), Spaniard (207 | 5.2%), and Russian (202 | 5.1%), together accounting for 52.9% of all Del Mar residents.
| Ancestry | # Population | % Population |
| African | 14 | 0.4% |
| American | 174 | 4.4% |
| Arab | 18 | 0.5% |
| Bhutanese | 11 | 0.3% |
| British | 117 | 3.0% |
| Canadian | 5 | 0.1% |
| Central American | 41 | 1.0% |
| Cherokee | 12 | 0.3% |
| Danish | 63 | 1.6% |
| Dutch | 60 | 1.5% |
| Eastern European | 21 | 0.5% |
| Egyptian | 12 | 0.3% |
| English | 672 | 17.0% |
| European | 77 | 1.9% |
| Filipino | 51 | 1.3% |
| Finnish | 23 | 0.6% |
| French | 144 | 3.6% |
| German | 404 | 10.2% |
| Greek | 88 | 2.2% |
| Hungarian | 82 | 2.1% |
| Indian (Asian) | 35 | 0.9% |
| Iranian | 69 | 1.7% |
| Iraqi | 6 | 0.2% |
| Irish | 607 | 15.3% |
| Italian | 174 | 4.4% |
| Lithuanian | 11 | 0.3% |
| Macedonian | 5 | 0.1% |
| Mexican | 120 | 3.0% |
| Nigerian | 85 | 2.1% |
| Northern European | 51 | 1.3% |
| Norwegian | 148 | 3.7% |
| Osage | 55 | 1.4% |
| Pakistani | 37 | 0.9% |
| Polish | 173 | 4.4% |
| Russian | 202 | 5.1% |
| Salvadoran | 41 | 1.0% |
| Scotch-Irish | 43 | 1.1% |
| Scottish | 106 | 2.7% |
| Slovak | 60 | 1.5% |
| Slovene | 10 | 0.3% |
| Spaniard | 207 | 5.2% |
| Subsaharan African | 99 | 2.5% |
| Swedish | 63 | 1.6% |
| Swiss | 12 | 0.3% |
| Thai | 55 | 1.4% |
| Turkish | 28 | 0.7% |
| Ukrainian | 15 | 0.4% |
| Welsh | 18 | 0.5% | View All 48 Rows |
Immigrants in Del Mar
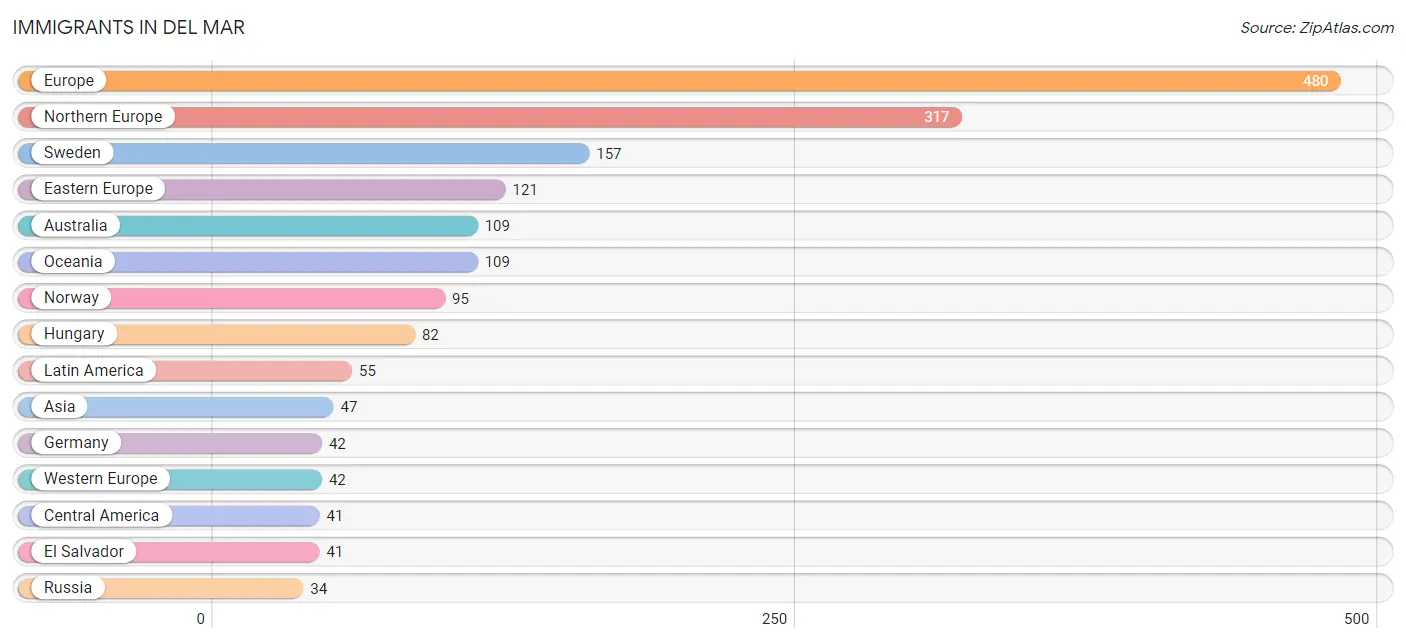
The most numerous immigrant groups reported in Del Mar came from Europe (480 | 12.1%), Northern Europe (317 | 8.0%), Sweden (157 | 4.0%), Eastern Europe (121 | 3.1%), and Australia (109 | 2.8%), together accounting for 29.9% of all Del Mar residents.
| Immigration Origin | # Population | % Population |
| Africa | 17 | 0.4% |
| Asia | 47 | 1.2% |
| Australia | 109 | 2.8% |
| Barbados | 14 | 0.4% |
| Canada | 19 | 0.5% |
| Caribbean | 14 | 0.4% |
| Central America | 41 | 1.0% |
| Denmark | 14 | 0.4% |
| Eastern Europe | 121 | 3.1% |
| El Salvador | 41 | 1.0% |
| England | 29 | 0.7% |
| Europe | 480 | 12.1% |
| Germany | 42 | 1.1% |
| Hungary | 82 | 2.1% |
| India | 14 | 0.4% |
| Ireland | 9 | 0.2% |
| Latin America | 55 | 1.4% |
| North Macedonia | 5 | 0.1% |
| Northern Africa | 6 | 0.2% |
| Northern Europe | 317 | 8.0% |
| Norway | 95 | 2.4% |
| Oceania | 109 | 2.8% |
| Pakistan | 5 | 0.1% |
| Russia | 34 | 0.9% |
| South Africa | 11 | 0.3% |
| South Central Asia | 19 | 0.5% |
| Sweden | 157 | 4.0% |
| Turkey | 28 | 0.7% |
| Western Asia | 28 | 0.7% |
| Western Europe | 42 | 1.1% | View All 30 Rows |
Sex and Age in Del Mar
Sex and Age in Del Mar
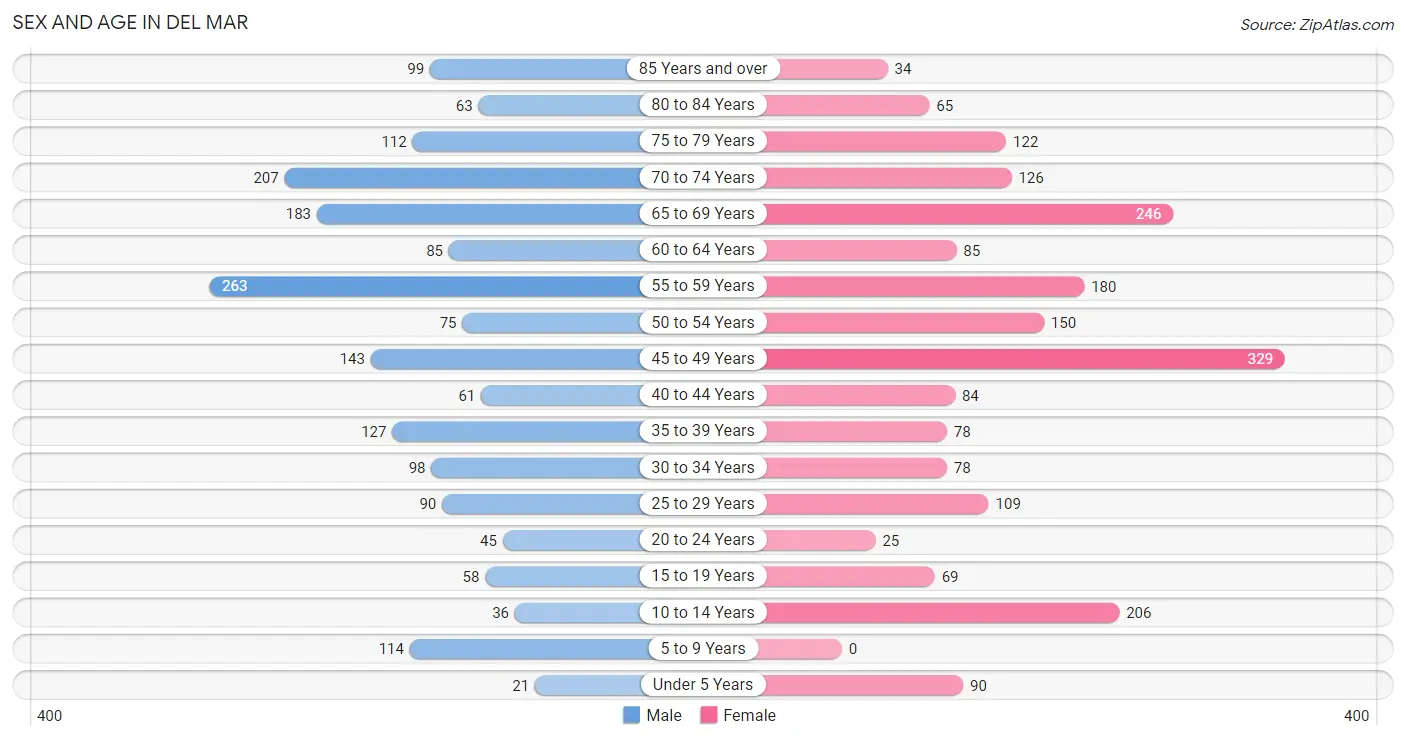
The most populous age groups in Del Mar are 55 to 59 Years (263 | 14.0%) for men and 45 to 49 Years (329 | 15.9%) for women.
| Age Bracket | Male | Female |
| Under 5 Years | 21 (1.1%) | 90 (4.3%) |
| 5 to 9 Years | 114 (6.1%) | 0 (0.0%) |
| 10 to 14 Years | 36 (1.9%) | 206 (9.9%) |
| 15 to 19 Years | 58 (3.1%) | 69 (3.3%) |
| 20 to 24 Years | 45 (2.4%) | 25 (1.2%) |
| 25 to 29 Years | 90 (4.8%) | 109 (5.2%) |
| 30 to 34 Years | 98 (5.2%) | 78 (3.8%) |
| 35 to 39 Years | 127 (6.8%) | 78 (3.8%) |
| 40 to 44 Years | 61 (3.2%) | 84 (4.1%) |
| 45 to 49 Years | 143 (7.6%) | 329 (15.9%) |
| 50 to 54 Years | 75 (4.0%) | 150 (7.2%) |
| 55 to 59 Years | 263 (14.0%) | 180 (8.7%) |
| 60 to 64 Years | 85 (4.5%) | 85 (4.1%) |
| 65 to 69 Years | 183 (9.7%) | 246 (11.8%) |
| 70 to 74 Years | 207 (11.0%) | 126 (6.1%) |
| 75 to 79 Years | 112 (6.0%) | 122 (5.9%) |
| 80 to 84 Years | 63 (3.4%) | 65 (3.1%) |
| 85 Years and over | 99 (5.3%) | 34 (1.6%) |
| Total | 1,880 (100.0%) | 2,076 (100.0%) |
Families and Households in Del Mar
Median Family Size in Del Mar
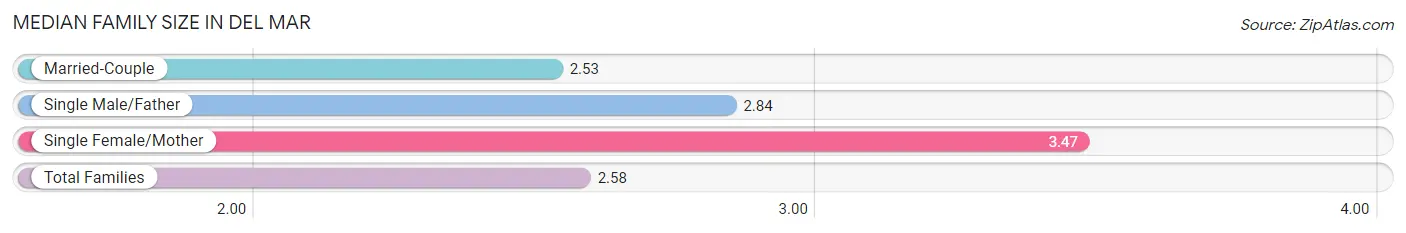
The median family size in Del Mar is 2.58 persons per family, with single female/mother families (51 | 4.4%) accounting for the largest median family size of 3.47 persons per family. On the other hand, married-couple families (1,067 | 91.7%) represent the smallest median family size with 2.53 persons per family.
| Family Type | # Families | Family Size |
| Married-Couple | 1,067 (91.7%) | 2.53 |
| Single Male/Father | 45 (3.9%) | 2.84 |
| Single Female/Mother | 51 (4.4%) | 3.47 |
| Total Families | 1,163 (100.0%) | 2.58 |
Median Household Size in Del Mar
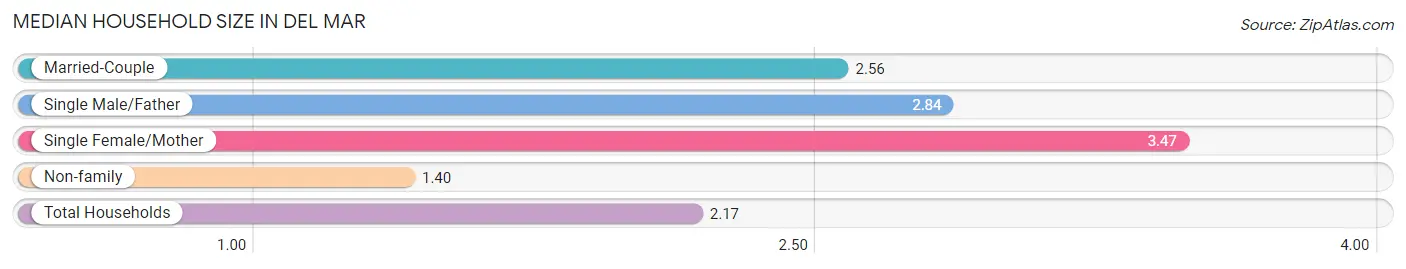
The median household size in Del Mar is 2.17 persons per household, with single female/mother households (51 | 2.8%) accounting for the largest median household size of 3.47 persons per household. non-family households (659 | 36.2%) represent the smallest median household size with 1.40 persons per household.
| Household Type | # Households | Household Size |
| Married-Couple | 1,067 (58.6%) | 2.56 |
| Single Male/Father | 45 (2.5%) | 2.84 |
| Single Female/Mother | 51 (2.8%) | 3.47 |
| Non-family | 659 (36.2%) | 1.40 |
| Total Households | 1,822 (100.0%) | 2.17 |
Household Size by Marriage Status in Del Mar
Out of a total of 1,822 households in Del Mar, 1,163 (63.8%) are family households, while 659 (36.2%) are nonfamily households. The most numerous type of family households are 2-person households, comprising 774, and the most common type of nonfamily households are 1-person households, comprising 445.
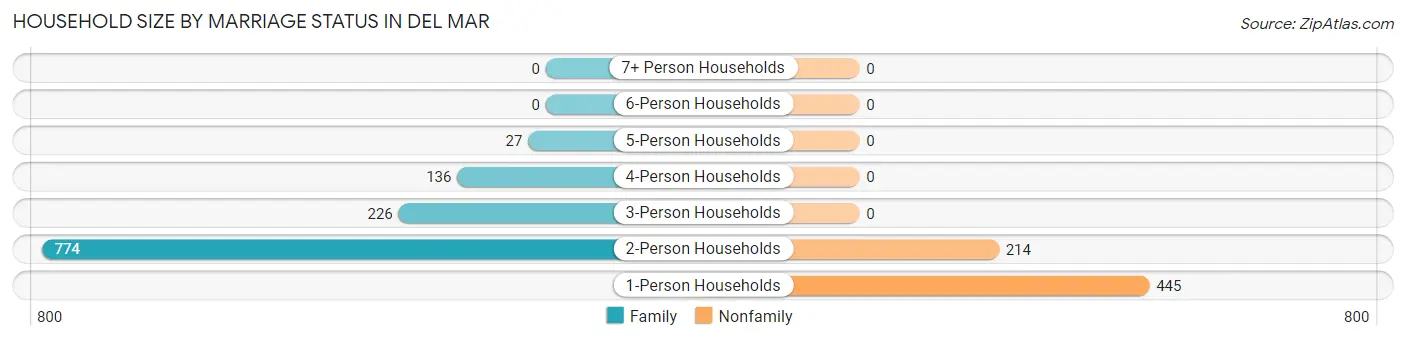
| Household Size | Family Households | Nonfamily Households |
| 1-Person Households | - | 445 (24.4%) |
| 2-Person Households | 774 (42.5%) | 214 (11.7%) |
| 3-Person Households | 226 (12.4%) | 0 (0.0%) |
| 4-Person Households | 136 (7.5%) | 0 (0.0%) |
| 5-Person Households | 27 (1.5%) | 0 (0.0%) |
| 6-Person Households | 0 (0.0%) | 0 (0.0%) |
| 7+ Person Households | 0 (0.0%) | 0 (0.0%) |
| Total | 1,163 (63.8%) | 659 (36.2%) |
Female Fertility in Del Mar
Fertility by Age in Del Mar
Average fertility rate in Del Mar is 7.0 births per 1,000 women. Women in the age bracket of 20 to 34 years have the highest fertility rate with 28.0 births per 1,000 women. Women in the age bracket of 20 to 34 years acount for 100.0% of all women with births.
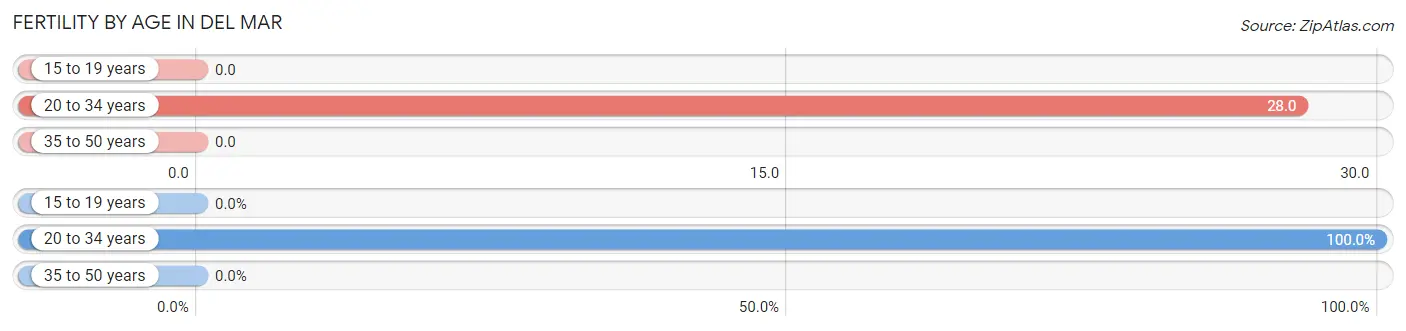
| Age Bracket | Women with Births | Births / 1,000 Women |
| 15 to 19 years | 0 (0.0%) | 0.0 |
| 20 to 34 years | 6 (100.0%) | 28.0 |
| 35 to 50 years | 0 (0.0%) | 0.0 |
| Total | 6 (100.0%) | 7.0 |
Fertility by Age by Marriage Status in Del Mar
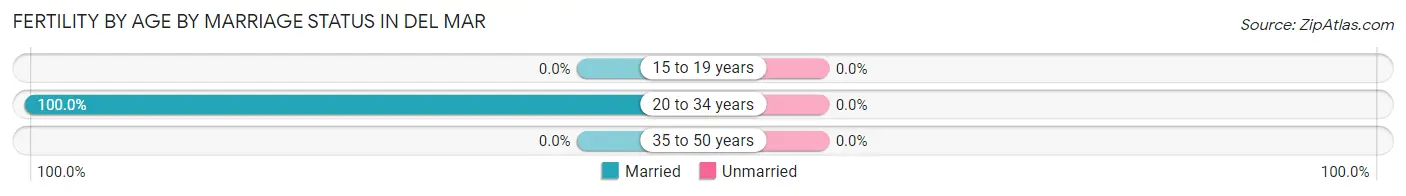
| Age Bracket | Married | Unmarried |
| 15 to 19 years | 0 (0.0%) | 0 (0.0%) |
| 20 to 34 years | 6 (100.0%) | 0 (0.0%) |
| 35 to 50 years | 0 (0.0%) | 0 (0.0%) |
| Total | 6 (100.0%) | 0 (0.0%) |
Fertility by Education in Del Mar
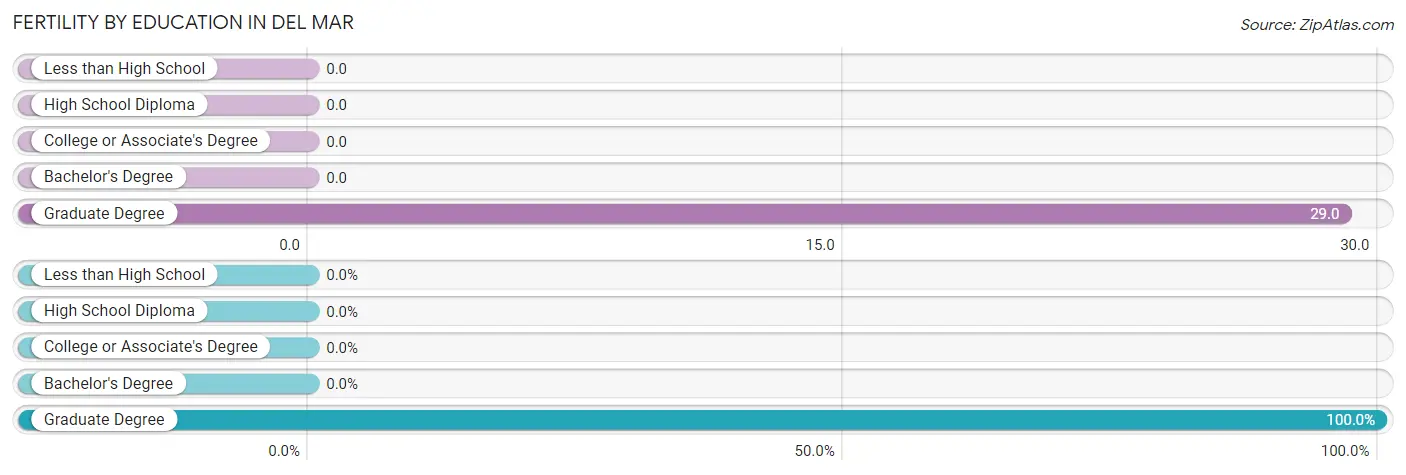
| Educational Attainment | Women with Births | Births / 1,000 Women |
| Less than High School | 0 (0.0%) | 0.0 |
| High School Diploma | 0 (0.0%) | 0.0 |
| College or Associate's Degree | 0 (0.0%) | 0.0 |
| Bachelor's Degree | 0 (0.0%) | 0.0 |
| Graduate Degree | 6 (100.0%) | 29.0 |
| Total | 6 (100.0%) | 7.0 |
Fertility by Education by Marriage Status in Del Mar
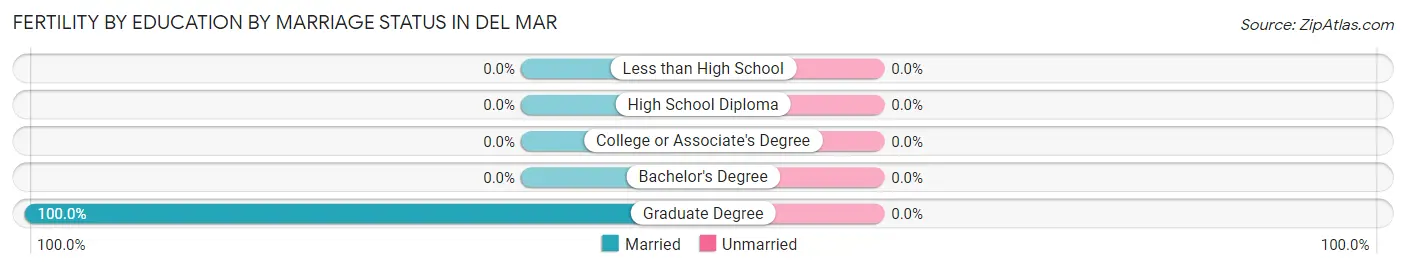
| Educational Attainment | Married | Unmarried |
| Less than High School | 0 (0.0%) | 0 (0.0%) |
| High School Diploma | 0 (0.0%) | 0 (0.0%) |
| College or Associate's Degree | 0 (0.0%) | 0 (0.0%) |
| Bachelor's Degree | 0 (0.0%) | 0 (0.0%) |
| Graduate Degree | 6 (100.0%) | 0 (0.0%) |
| Total | 6 (100.0%) | 0 (0.0%) |
Employment Characteristics in Del Mar
Employment by Class of Employer in Del Mar
Among the 2,021 employed individuals in Del Mar, private company employees (1,009 | 49.9%), self-employed (not incorporated) (364 | 18.0%), and self-employed (incorporated) (303 | 15.0%) make up the most common classes of employment.
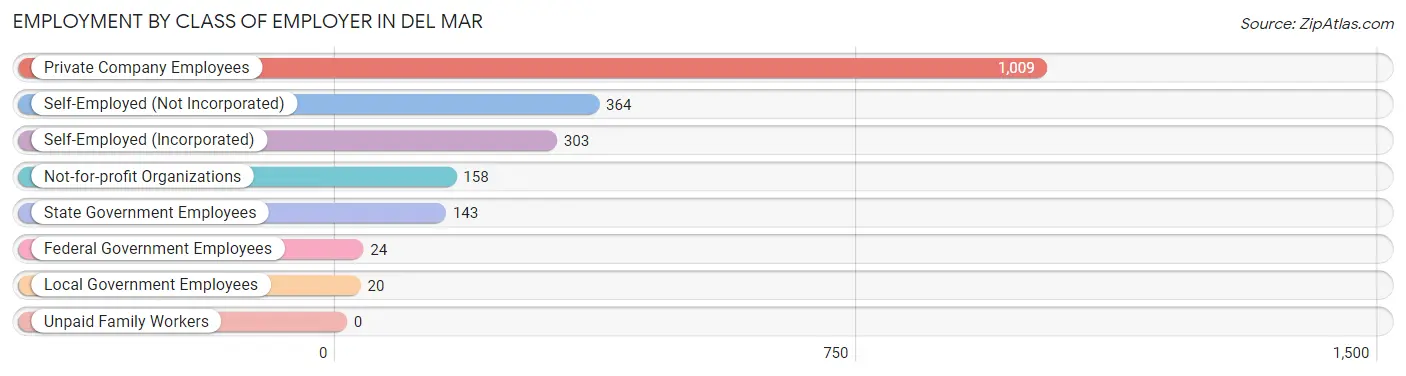
| Employer Class | # Employees | % Employees |
| Private Company Employees | 1,009 | 49.9% |
| Self-Employed (Incorporated) | 303 | 15.0% |
| Self-Employed (Not Incorporated) | 364 | 18.0% |
| Not-for-profit Organizations | 158 | 7.8% |
| Local Government Employees | 20 | 1.0% |
| State Government Employees | 143 | 7.1% |
| Federal Government Employees | 24 | 1.2% |
| Unpaid Family Workers | 0 | 0.0% |
| Total | 2,021 | 100.0% |
Employment Status by Age in Del Mar
According to the labor force statistics for Del Mar, out of the total population over 16 years of age (3,431), 62.3% or 2,138 individuals are in the labor force, with 2.0% or 43 of them unemployed. The age group with the highest labor force participation rate is 30 to 34 years, with 100.0% or 176 individuals in the labor force. Within the labor force, the 35 to 44 years age range has the highest percentage of unemployed individuals, with 4.6% or 14 of them being unemployed.
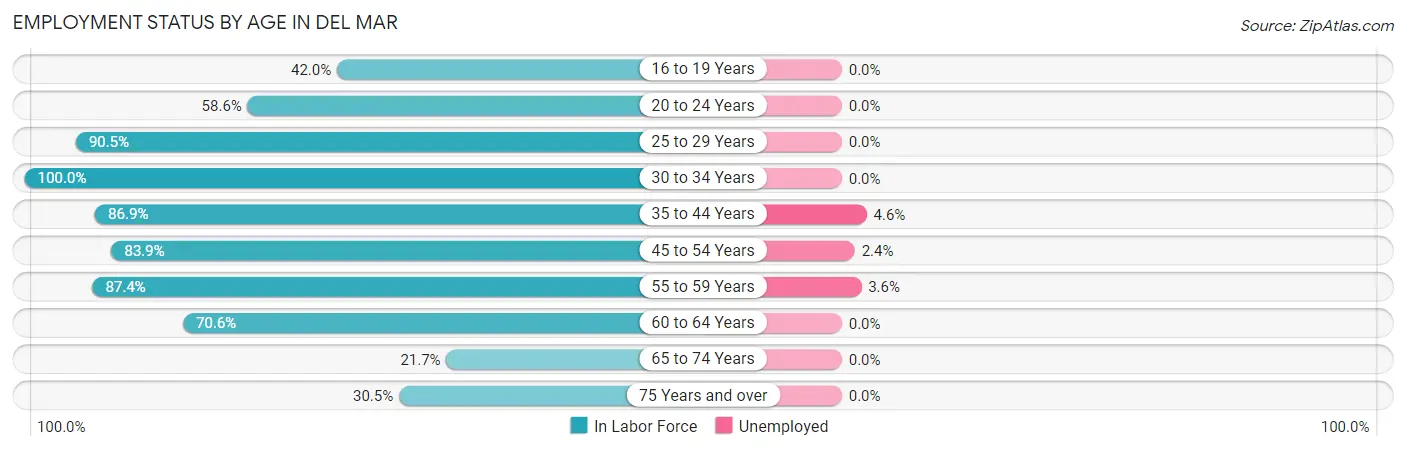
| Age Bracket | In Labor Force | Unemployed |
| 16 to 19 Years | 29 (42.0%) | 0 (0.0%) |
| 20 to 24 Years | 41 (58.6%) | 0 (0.0%) |
| 25 to 29 Years | 180 (90.5%) | 0 (0.0%) |
| 30 to 34 Years | 176 (100.0%) | 0 (0.0%) |
| 35 to 44 Years | 304 (86.9%) | 14 (4.6%) |
| 45 to 54 Years | 585 (83.9%) | 14 (2.4%) |
| 55 to 59 Years | 387 (87.4%) | 14 (3.6%) |
| 60 to 64 Years | 120 (70.6%) | 0 (0.0%) |
| 65 to 74 Years | 165 (21.7%) | 0 (0.0%) |
| 75 Years and over | 151 (30.5%) | 0 (0.0%) |
| Total | 2,138 (62.3%) | 43 (2.0%) |
Employment Status by Educational Attainment in Del Mar
According to labor force statistics for Del Mar, 86.1% of individuals (1,752) out of the total population between 25 and 64 years of age (2,035) are in the labor force, with 2.4% or 42 of them being unemployed. The group with the highest labor force participation rate are those with the educational attainment of bachelor's degree or higher, with 89.5% or 1,655 individuals in the labor force. Within the labor force, individuals with college / associate degree education have the highest percentage of unemployment, with 17.3% or 14 of them being unemployed.
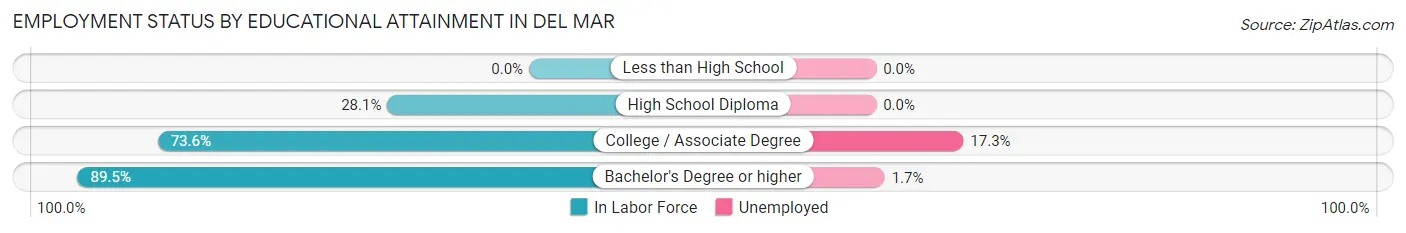
| Educational Attainment | In Labor Force | Unemployed |
| Less than High School | 0 (0.0%) | 0 (0.0%) |
| High School Diploma | 16 (28.1%) | 0 (0.0%) |
| College / Associate Degree | 81 (73.6%) | 19 (17.3%) |
| Bachelor's Degree or higher | 1,655 (89.5%) | 31 (1.7%) |
| Total | 1,752 (86.1%) | 49 (2.4%) |
Employment Occupations by Sex in Del Mar
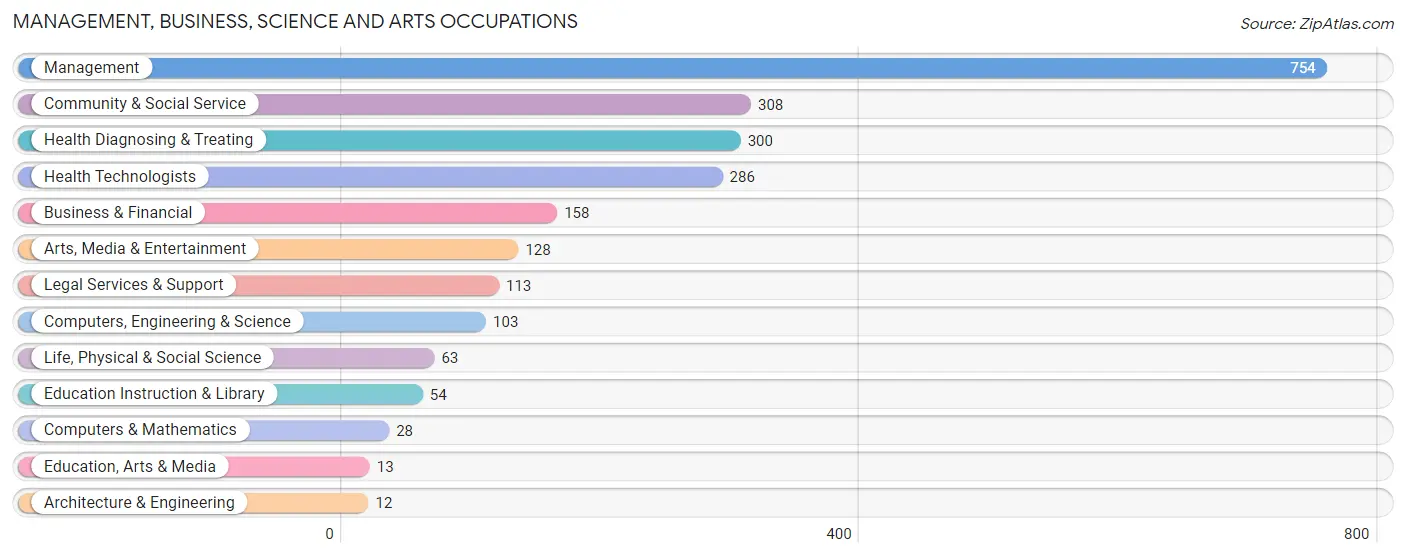
Management, Business, Science and Arts Occupations
The most common Management, Business, Science and Arts occupations in Del Mar are Management (754 | 36.2%), Community & Social Service (308 | 14.8%), Health Diagnosing & Treating (300 | 14.4%), Health Technologists (286 | 13.7%), and Business & Financial (158 | 7.6%).
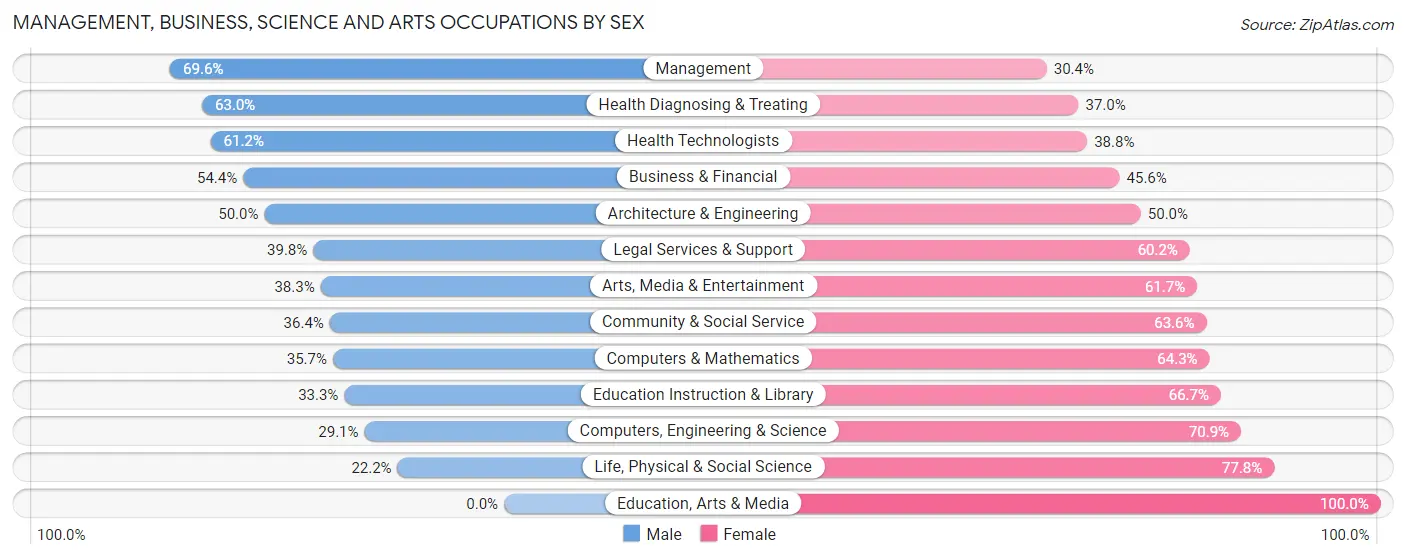
Management, Business, Science and Arts Occupations by Sex
Within the Management, Business, Science and Arts occupations in Del Mar, the most male-oriented occupations are Management (69.6%), Health Diagnosing & Treating (63.0%), and Health Technologists (61.2%), while the most female-oriented occupations are Education, Arts & Media (100.0%), Life, Physical & Social Science (77.8%), and Computers, Engineering & Science (70.9%).
| Occupation | Male | Female |
| Management | 525 (69.6%) | 229 (30.4%) |
| Business & Financial | 86 (54.4%) | 72 (45.6%) |
| Computers, Engineering & Science | 30 (29.1%) | 73 (70.9%) |
| Computers & Mathematics | 10 (35.7%) | 18 (64.3%) |
| Architecture & Engineering | 6 (50.0%) | 6 (50.0%) |
| Life, Physical & Social Science | 14 (22.2%) | 49 (77.8%) |
| Community & Social Service | 112 (36.4%) | 196 (63.6%) |
| Education, Arts & Media | 0 (0.0%) | 13 (100.0%) |
| Legal Services & Support | 45 (39.8%) | 68 (60.2%) |
| Education Instruction & Library | 18 (33.3%) | 36 (66.7%) |
| Arts, Media & Entertainment | 49 (38.3%) | 79 (61.7%) |
| Health Diagnosing & Treating | 189 (63.0%) | 111 (37.0%) |
| Health Technologists | 175 (61.2%) | 111 (38.8%) |
| Total (Category) | 942 (58.0%) | 681 (42.0%) |
| Total (Overall) | 1,092 (52.4%) | 992 (47.6%) |
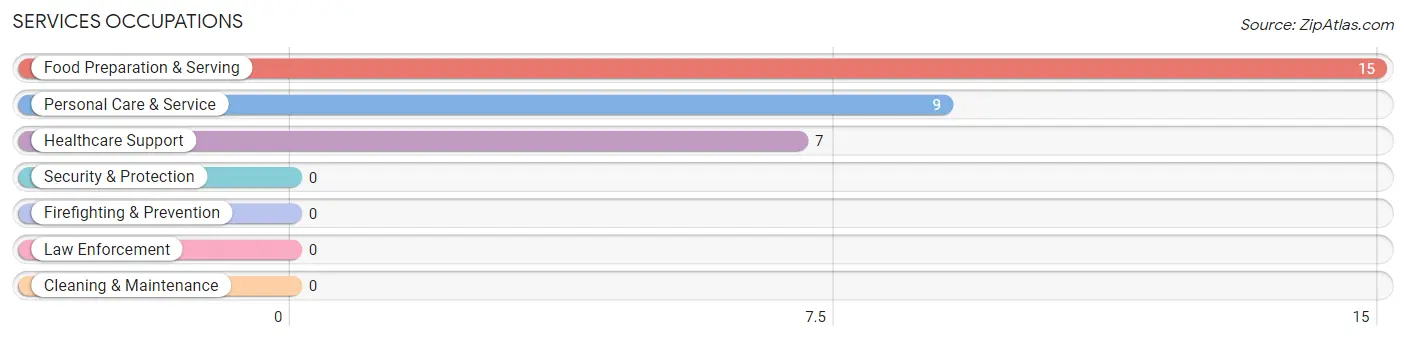
Services Occupations
The most common Services occupations in Del Mar are Food Preparation & Serving (15 | 0.7%), Personal Care & Service (9 | 0.4%), and Healthcare Support (7 | 0.3%).
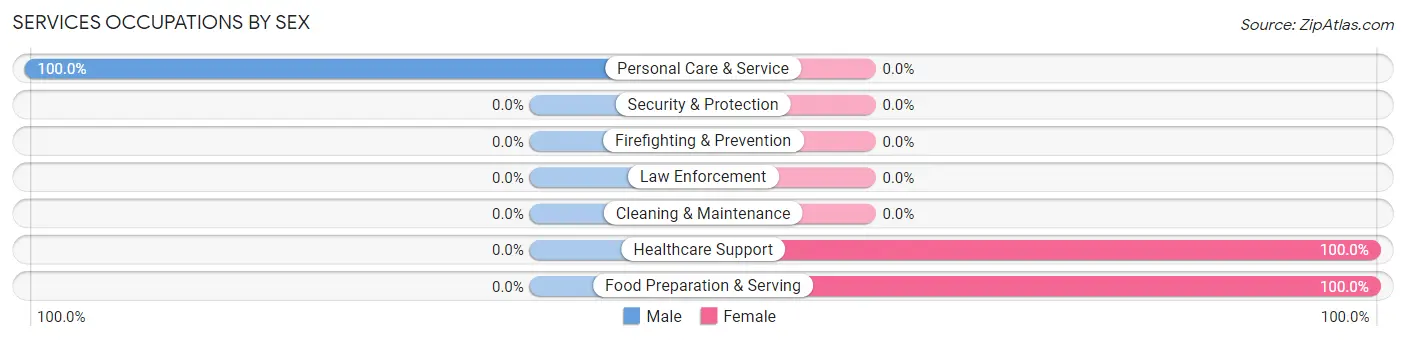
Services Occupations by Sex
| Occupation | Male | Female |
| Healthcare Support | 0 (0.0%) | 7 (100.0%) |
| Security & Protection | 0 (0.0%) | 0 (0.0%) |
| Firefighting & Prevention | 0 (0.0%) | 0 (0.0%) |
| Law Enforcement | 0 (0.0%) | 0 (0.0%) |
| Food Preparation & Serving | 0 (0.0%) | 15 (100.0%) |
| Cleaning & Maintenance | 0 (0.0%) | 0 (0.0%) |
| Personal Care & Service | 9 (100.0%) | 0 (0.0%) |
| Total (Category) | 9 (29.0%) | 22 (71.0%) |
| Total (Overall) | 1,092 (52.4%) | 992 (47.6%) |
Sales and Office Occupations
The most common Sales and Office occupations in Del Mar are Sales & Related (277 | 13.3%), and Office & Administration (75 | 3.6%).
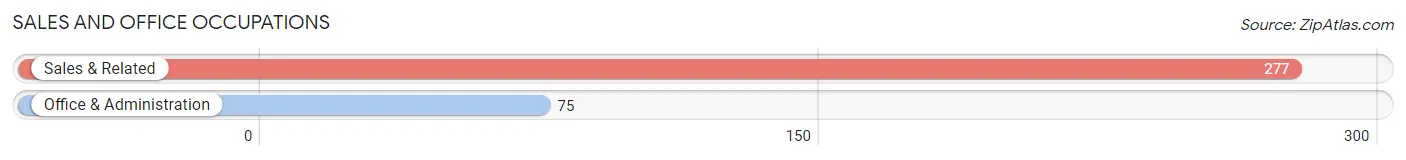
Sales and Office Occupations by Sex
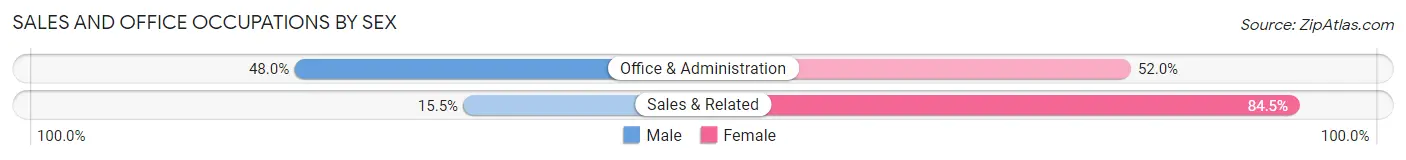
| Occupation | Male | Female |
| Sales & Related | 43 (15.5%) | 234 (84.5%) |
| Office & Administration | 36 (48.0%) | 39 (52.0%) |
| Total (Category) | 79 (22.4%) | 273 (77.6%) |
| Total (Overall) | 1,092 (52.4%) | 992 (47.6%) |
Natural Resources, Construction and Maintenance Occupations
The most common Natural Resources, Construction and Maintenance occupations in Del Mar are Construction & Extraction (27 | 1.3%), and Farming, Fishing & Forestry (16 | 0.8%).
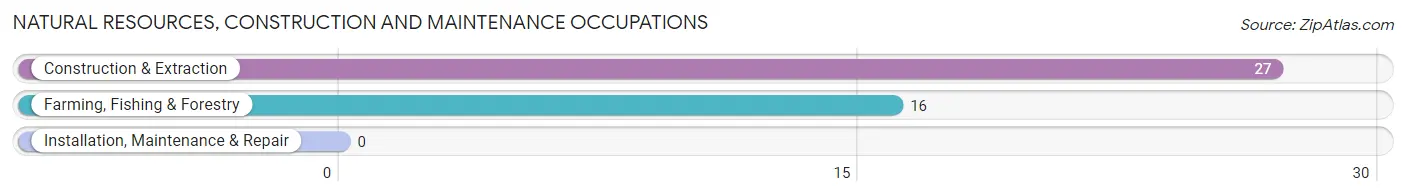
Natural Resources, Construction and Maintenance Occupations by Sex
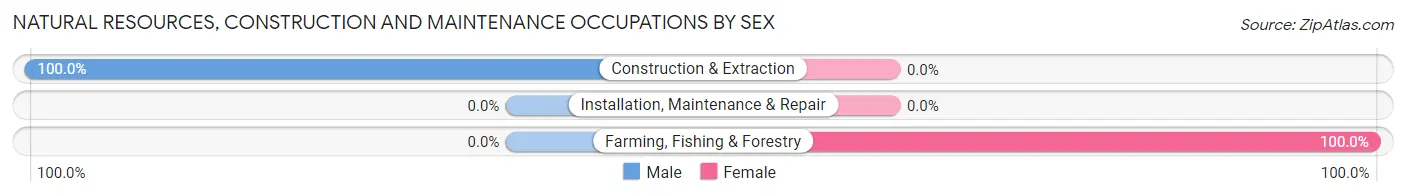
| Occupation | Male | Female |
| Farming, Fishing & Forestry | 0 (0.0%) | 16 (100.0%) |
| Construction & Extraction | 27 (100.0%) | 0 (0.0%) |
| Installation, Maintenance & Repair | 0 (0.0%) | 0 (0.0%) |
| Total (Category) | 27 (62.8%) | 16 (37.2%) |
| Total (Overall) | 1,092 (52.4%) | 992 (47.6%) |
Production, Transportation and Moving Occupations
The most common Production, Transportation and Moving occupations in Del Mar are , and Material Moving (35 | 1.7%).
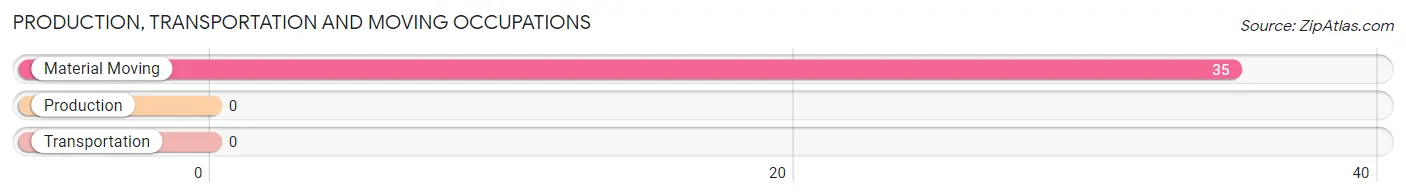
Production, Transportation and Moving Occupations by Sex
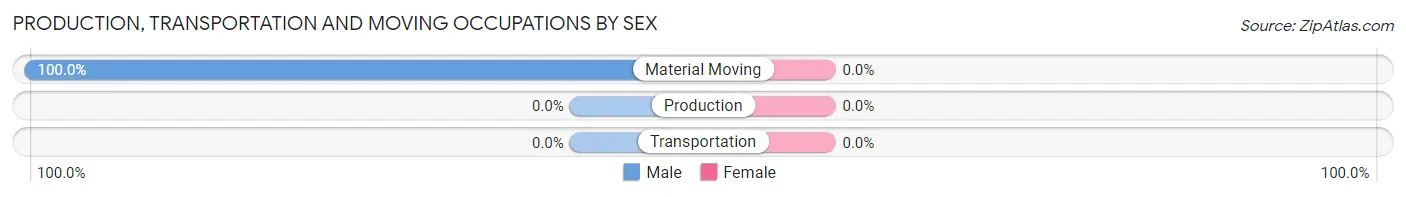
| Occupation | Male | Female |
| Production | 0 (0.0%) | 0 (0.0%) |
| Transportation | 0 (0.0%) | 0 (0.0%) |
| Material Moving | 35 (100.0%) | 0 (0.0%) |
| Total (Category) | 35 (100.0%) | 0 (0.0%) |
| Total (Overall) | 1,092 (52.4%) | 992 (47.6%) |
Employment Industries by Sex in Del Mar
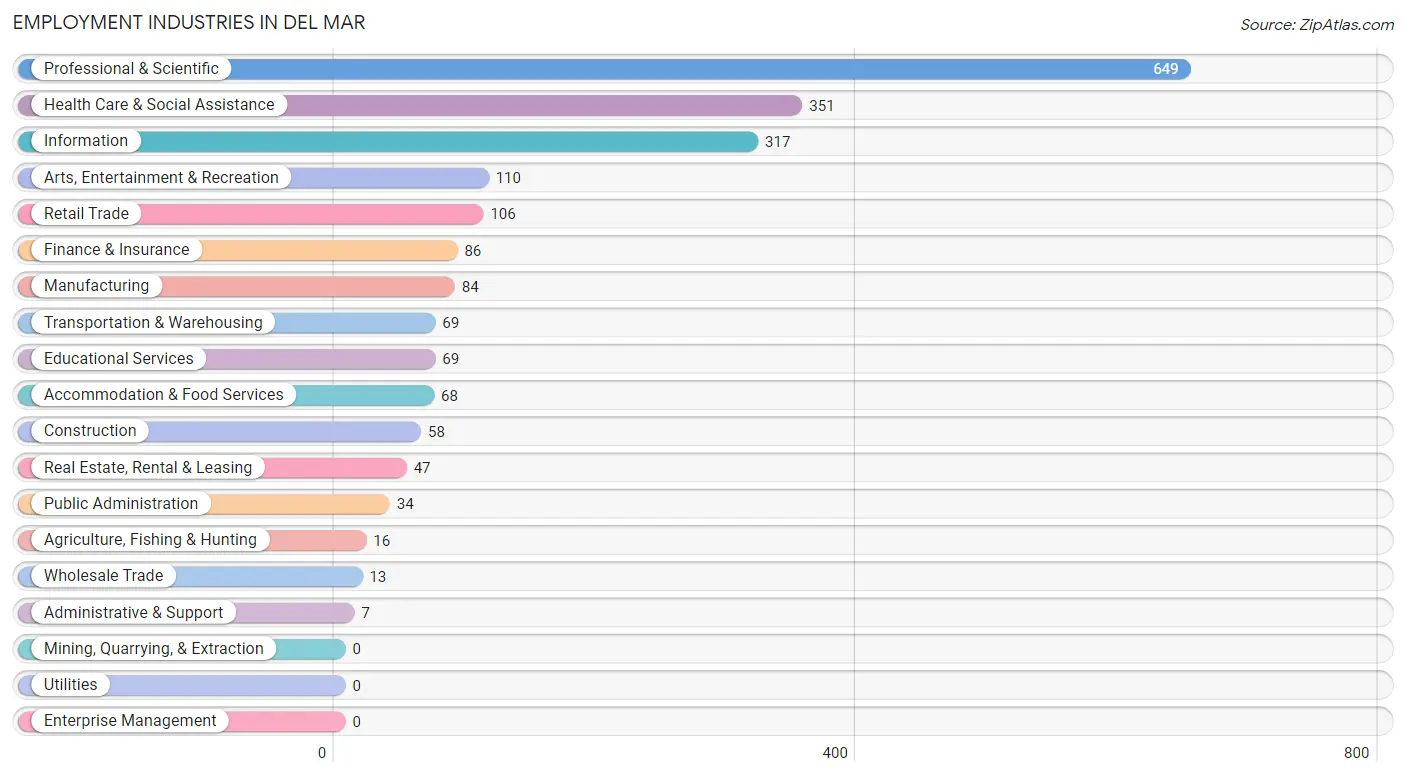
Employment Industries in Del Mar
The major employment industries in Del Mar include Professional & Scientific (649 | 31.1%), Health Care & Social Assistance (351 | 16.8%), Information (317 | 15.2%), Arts, Entertainment & Recreation (110 | 5.3%), and Retail Trade (106 | 5.1%).
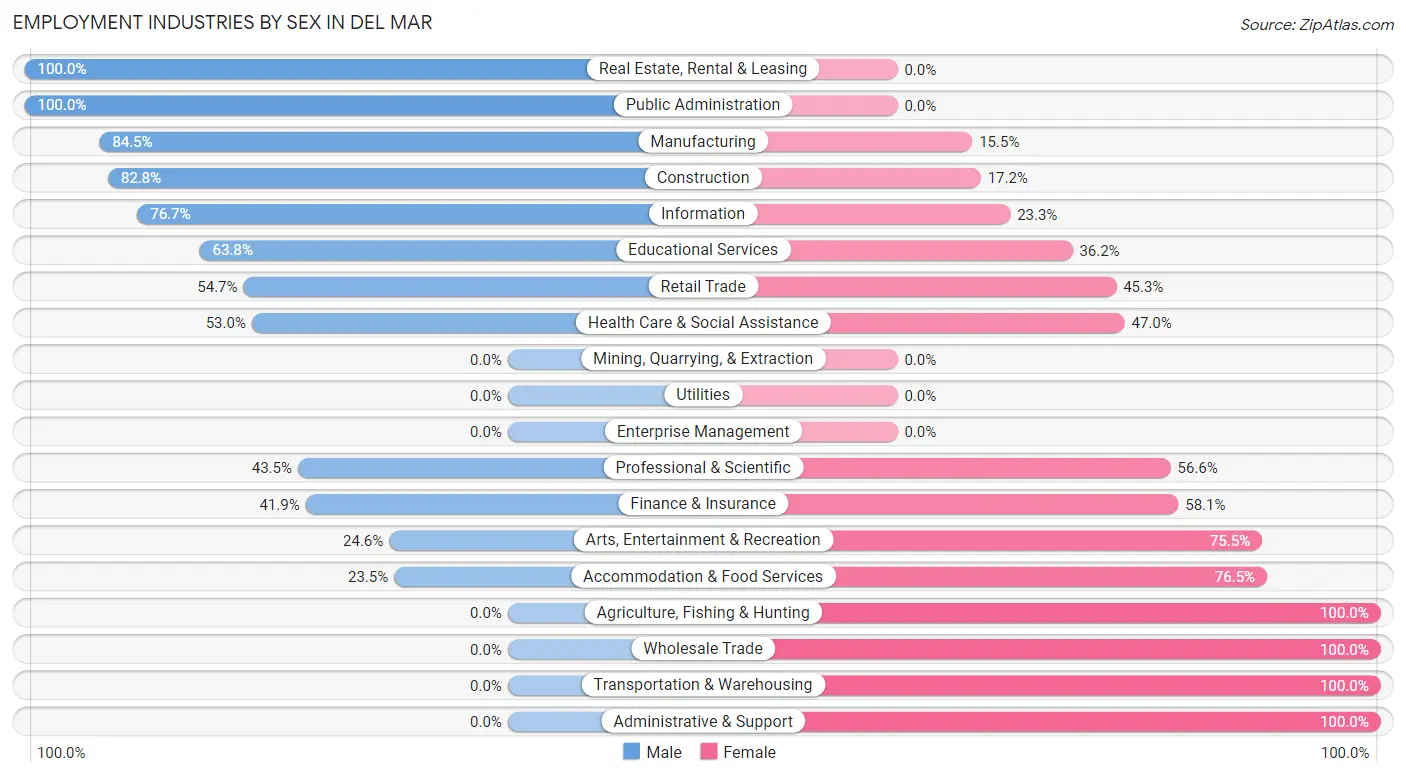
Employment Industries by Sex in Del Mar
The Del Mar industries that see more men than women are Real Estate, Rental & Leasing (100.0%), Public Administration (100.0%), and Manufacturing (84.5%), whereas the industries that tend to have a higher number of women are Agriculture, Fishing & Hunting (100.0%), Wholesale Trade (100.0%), and Transportation & Warehousing (100.0%).
| Industry | Male | Female |
| Agriculture, Fishing & Hunting | 0 (0.0%) | 16 (100.0%) |
| Mining, Quarrying, & Extraction | 0 (0.0%) | 0 (0.0%) |
| Construction | 48 (82.8%) | 10 (17.2%) |
| Manufacturing | 71 (84.5%) | 13 (15.5%) |
| Wholesale Trade | 0 (0.0%) | 13 (100.0%) |
| Retail Trade | 58 (54.7%) | 48 (45.3%) |
| Transportation & Warehousing | 0 (0.0%) | 69 (100.0%) |
| Utilities | 0 (0.0%) | 0 (0.0%) |
| Information | 243 (76.7%) | 74 (23.3%) |
| Finance & Insurance | 36 (41.9%) | 50 (58.1%) |
| Real Estate, Rental & Leasing | 47 (100.0%) | 0 (0.0%) |
| Professional & Scientific | 282 (43.4%) | 367 (56.6%) |
| Enterprise Management | 0 (0.0%) | 0 (0.0%) |
| Administrative & Support | 0 (0.0%) | 7 (100.0%) |
| Educational Services | 44 (63.8%) | 25 (36.2%) |
| Health Care & Social Assistance | 186 (53.0%) | 165 (47.0%) |
| Arts, Entertainment & Recreation | 27 (24.5%) | 83 (75.4%) |
| Accommodation & Food Services | 16 (23.5%) | 52 (76.5%) |
| Public Administration | 34 (100.0%) | 0 (0.0%) |
| Total | 1,092 (52.4%) | 992 (47.6%) |
Education in Del Mar
School Enrollment in Del Mar
The most common levels of schooling among the 560 students in Del Mar are middle school (155 | 27.7%), elementary school (152 | 27.1%), and college / undergraduate (113 | 20.2%).
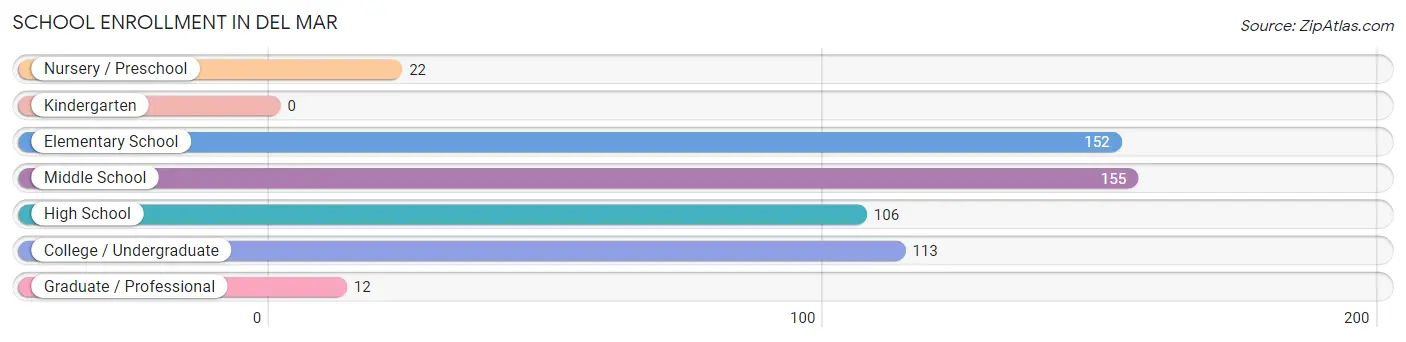
| School Level | # Students | % Students |
| Nursery / Preschool | 22 | 3.9% |
| Kindergarten | 0 | 0.0% |
| Elementary School | 152 | 27.1% |
| Middle School | 155 | 27.7% |
| High School | 106 | 18.9% |
| College / Undergraduate | 113 | 20.2% |
| Graduate / Professional | 12 | 2.1% |
| Total | 560 | 100.0% |
School Enrollment by Age by Funding Source in Del Mar
Out of a total of 560 students who are enrolled in schools in Del Mar, 177 (31.6%) attend a private institution, while the remaining 383 (68.4%) are enrolled in public schools. The age group of 3 to 4 year olds has the highest likelihood of being enrolled in private schools, with 22 (100.0% in the age bracket) enrolled. Conversely, the age group of 18 to 19 year olds has the lowest likelihood of being enrolled in a private school, with 4 (100.0% in the age bracket) attending a public institution.
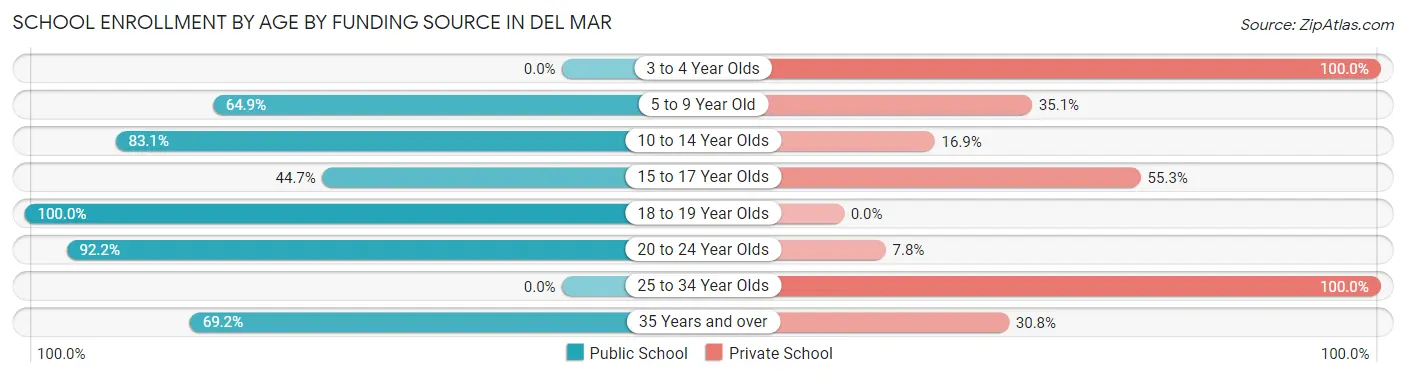
| Age Bracket | Public School | Private School |
| 3 to 4 Year Olds | 0 (0.0%) | 22 (100.0%) |
| 5 to 9 Year Old | 50 (64.9%) | 27 (35.1%) |
| 10 to 14 Year Olds | 201 (83.1%) | 41 (16.9%) |
| 15 to 17 Year Olds | 42 (44.7%) | 52 (55.3%) |
| 18 to 19 Year Olds | 4 (100.0%) | 0 (0.0%) |
| 20 to 24 Year Olds | 59 (92.2%) | 5 (7.8%) |
| 25 to 34 Year Olds | 0 (0.0%) | 18 (100.0%) |
| 35 Years and over | 27 (69.2%) | 12 (30.8%) |
| Total | 383 (68.4%) | 177 (31.6%) |
Educational Attainment by Field of Study in Del Mar
Social sciences (469 | 15.7%), business (444 | 14.9%), communications (334 | 11.2%), psychology (231 | 7.7%), and visual & performing arts (225 | 7.5%) are the most common fields of study among 2,986 individuals in Del Mar who have obtained a bachelor's degree or higher.
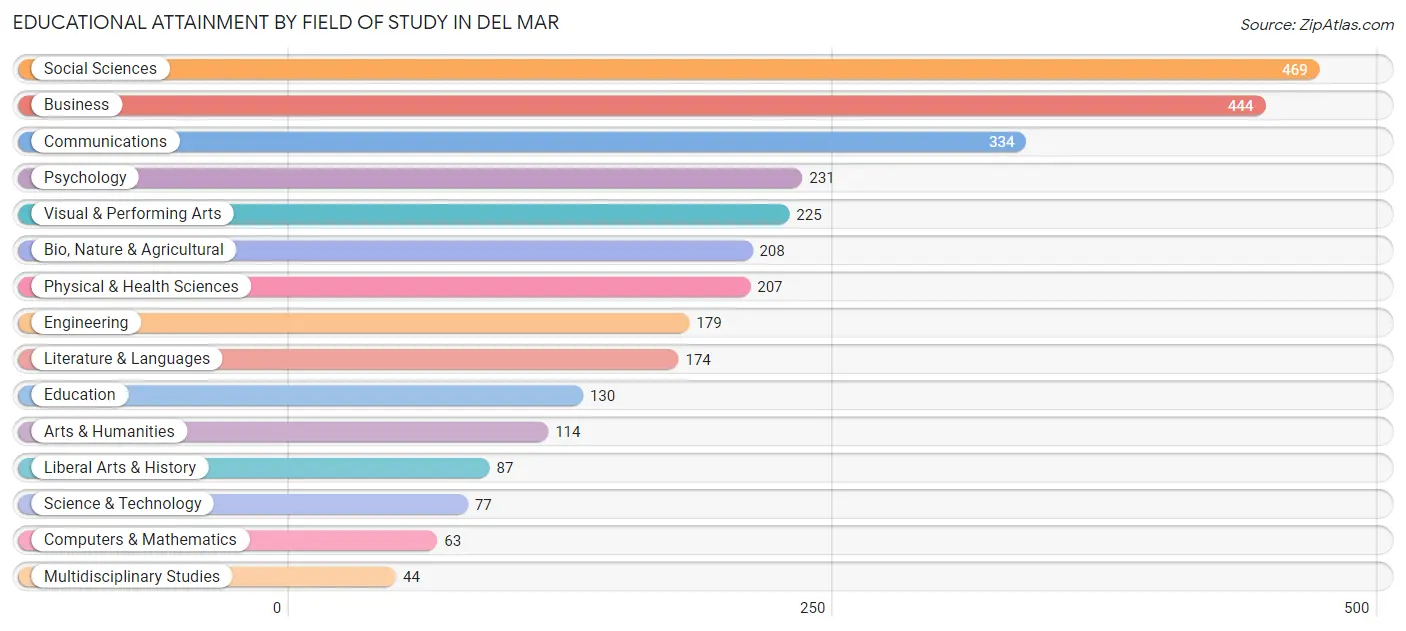
| Field of Study | # Graduates | % Graduates |
| Computers & Mathematics | 63 | 2.1% |
| Bio, Nature & Agricultural | 208 | 7.0% |
| Physical & Health Sciences | 207 | 6.9% |
| Psychology | 231 | 7.7% |
| Social Sciences | 469 | 15.7% |
| Engineering | 179 | 6.0% |
| Multidisciplinary Studies | 44 | 1.5% |
| Science & Technology | 77 | 2.6% |
| Business | 444 | 14.9% |
| Education | 130 | 4.3% |
| Literature & Languages | 174 | 5.8% |
| Liberal Arts & History | 87 | 2.9% |
| Visual & Performing Arts | 225 | 7.5% |
| Communications | 334 | 11.2% |
| Arts & Humanities | 114 | 3.8% |
| Total | 2,986 | 100.0% |
Transportation & Commute in Del Mar
Vehicle Availability by Sex in Del Mar
The most prevalent vehicle ownership categories in Del Mar are males with 2 vehicles (745, accounting for 70.1%) and females with 2 vehicles (596, making up 77.8%).
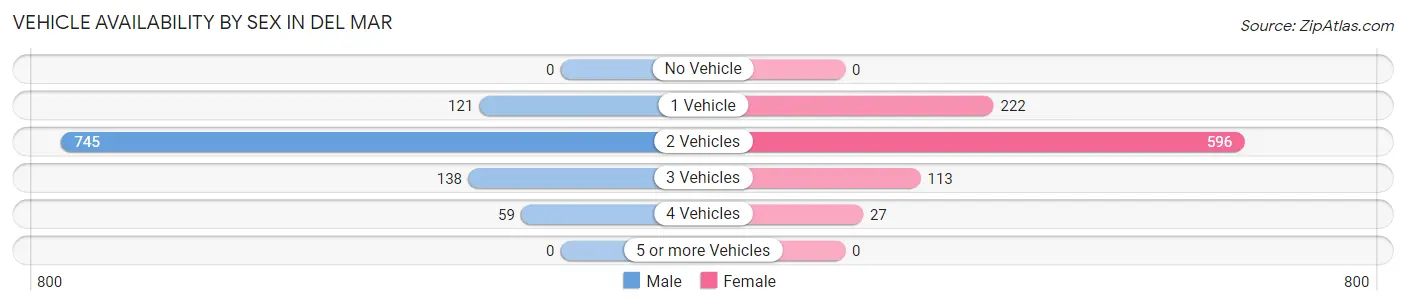
| Vehicles Available | Male | Female |
| No Vehicle | 0 (0.0%) | 0 (0.0%) |
| 1 Vehicle | 121 (11.4%) | 222 (23.2%) |
| 2 Vehicles | 745 (70.1%) | 596 (62.2%) |
| 3 Vehicles | 138 (13.0%) | 113 (11.8%) |
| 4 Vehicles | 59 (5.6%) | 27 (2.8%) |
| 5 or more Vehicles | 0 (0.0%) | 0 (0.0%) |
| Total | 1,063 (100.0%) | 958 (100.0%) |
Commute Time in Del Mar
The most frequently occuring commute durations in Del Mar are 15 to 19 minutes (235 commuters, 22.1%), 20 to 24 minutes (217 commuters, 20.4%), and 30 to 34 minutes (205 commuters, 19.3%).
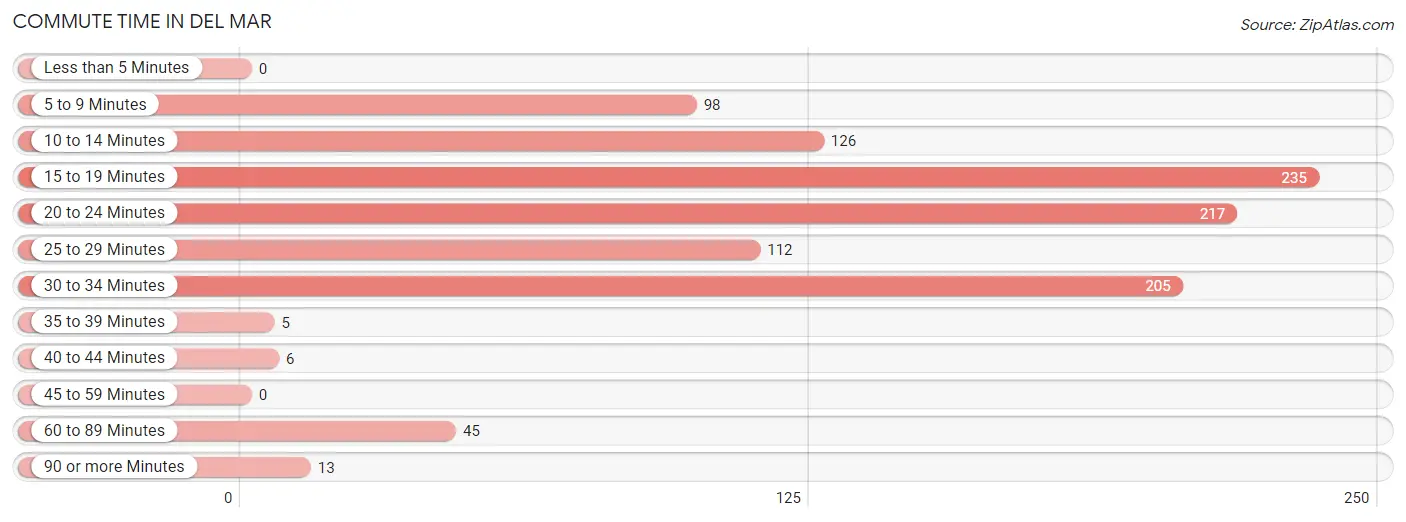
| Commute Time | # Commuters | % Commuters |
| Less than 5 Minutes | 0 | 0.0% |
| 5 to 9 Minutes | 98 | 9.2% |
| 10 to 14 Minutes | 126 | 11.9% |
| 15 to 19 Minutes | 235 | 22.1% |
| 20 to 24 Minutes | 217 | 20.4% |
| 25 to 29 Minutes | 112 | 10.5% |
| 30 to 34 Minutes | 205 | 19.3% |
| 35 to 39 Minutes | 5 | 0.5% |
| 40 to 44 Minutes | 6 | 0.6% |
| 45 to 59 Minutes | 0 | 0.0% |
| 60 to 89 Minutes | 45 | 4.2% |
| 90 or more Minutes | 13 | 1.2% |
Commute Time by Sex in Del Mar
The most common commute times in Del Mar are 30 to 34 minutes (138 commuters, 24.6%) for males and 15 to 19 minutes (198 commuters, 39.5%) for females.
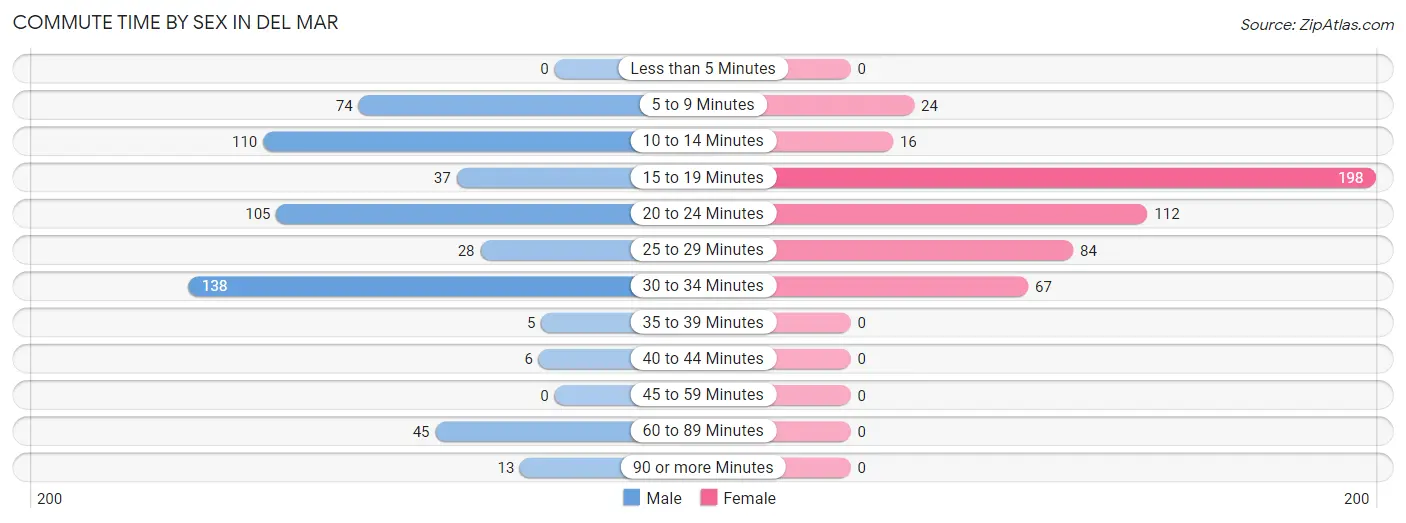
| Commute Time | Male | Female |
| Less than 5 Minutes | 0 (0.0%) | 0 (0.0%) |
| 5 to 9 Minutes | 74 (13.2%) | 24 (4.8%) |
| 10 to 14 Minutes | 110 (19.6%) | 16 (3.2%) |
| 15 to 19 Minutes | 37 (6.6%) | 198 (39.5%) |
| 20 to 24 Minutes | 105 (18.7%) | 112 (22.4%) |
| 25 to 29 Minutes | 28 (5.0%) | 84 (16.8%) |
| 30 to 34 Minutes | 138 (24.6%) | 67 (13.4%) |
| 35 to 39 Minutes | 5 (0.9%) | 0 (0.0%) |
| 40 to 44 Minutes | 6 (1.1%) | 0 (0.0%) |
| 45 to 59 Minutes | 0 (0.0%) | 0 (0.0%) |
| 60 to 89 Minutes | 45 (8.0%) | 0 (0.0%) |
| 90 or more Minutes | 13 (2.3%) | 0 (0.0%) |
Time of Departure to Work by Sex in Del Mar
The most frequent times of departure to work in Del Mar are 7:30 AM to 7:59 AM (175, 31.2%) for males and 7:30 AM to 7:59 AM (125, 24.9%) for females.
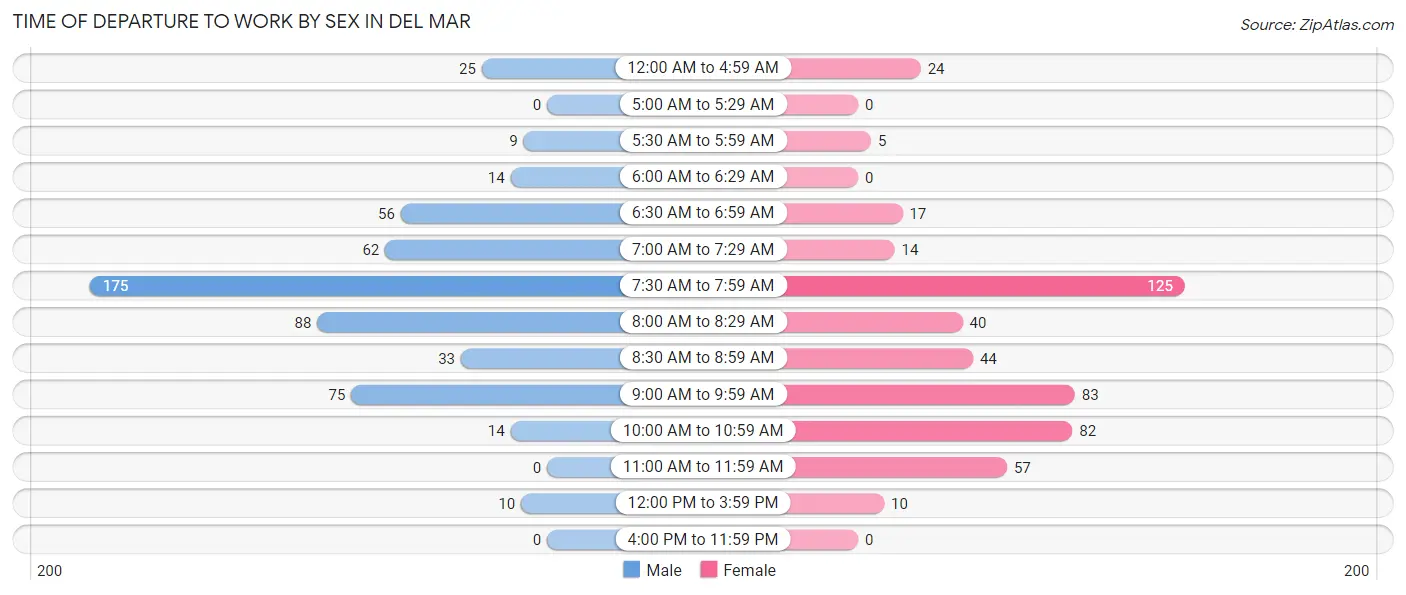
| Time of Departure | Male | Female |
| 12:00 AM to 4:59 AM | 25 (4.5%) | 24 (4.8%) |
| 5:00 AM to 5:29 AM | 0 (0.0%) | 0 (0.0%) |
| 5:30 AM to 5:59 AM | 9 (1.6%) | 5 (1.0%) |
| 6:00 AM to 6:29 AM | 14 (2.5%) | 0 (0.0%) |
| 6:30 AM to 6:59 AM | 56 (10.0%) | 17 (3.4%) |
| 7:00 AM to 7:29 AM | 62 (11.1%) | 14 (2.8%) |
| 7:30 AM to 7:59 AM | 175 (31.2%) | 125 (24.9%) |
| 8:00 AM to 8:29 AM | 88 (15.7%) | 40 (8.0%) |
| 8:30 AM to 8:59 AM | 33 (5.9%) | 44 (8.8%) |
| 9:00 AM to 9:59 AM | 75 (13.4%) | 83 (16.6%) |
| 10:00 AM to 10:59 AM | 14 (2.5%) | 82 (16.4%) |
| 11:00 AM to 11:59 AM | 0 (0.0%) | 57 (11.4%) |
| 12:00 PM to 3:59 PM | 10 (1.8%) | 10 (2.0%) |
| 4:00 PM to 11:59 PM | 0 (0.0%) | 0 (0.0%) |
| Total | 561 (100.0%) | 501 (100.0%) |
Housing Occupancy in Del Mar
Occupancy by Ownership in Del Mar
Of the total 1,822 dwellings in Del Mar, owner-occupied units account for 1,007 (55.3%), while renter-occupied units make up 815 (44.7%).
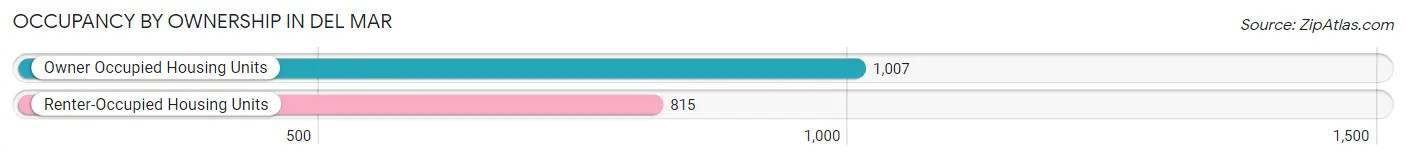
| Occupancy | # Housing Units | % Housing Units |
| Owner Occupied Housing Units | 1,007 | 55.3% |
| Renter-Occupied Housing Units | 815 | 44.7% |
| Total Occupied Housing Units | 1,822 | 100.0% |
Occupancy by Household Size in Del Mar
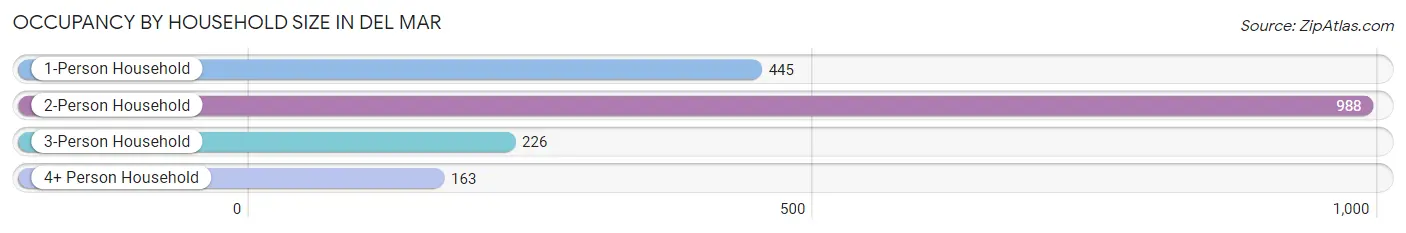
| Household Size | # Housing Units | % Housing Units |
| 1-Person Household | 445 | 24.4% |
| 2-Person Household | 988 | 54.2% |
| 3-Person Household | 226 | 12.4% |
| 4+ Person Household | 163 | 8.9% |
| Total Housing Units | 1,822 | 100.0% |
Occupancy by Ownership by Household Size in Del Mar
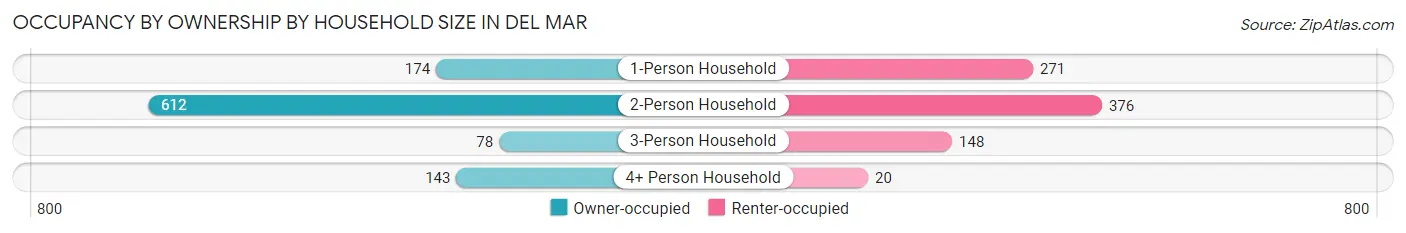
| Household Size | Owner-occupied | Renter-occupied |
| 1-Person Household | 174 (39.1%) | 271 (60.9%) |
| 2-Person Household | 612 (61.9%) | 376 (38.1%) |
| 3-Person Household | 78 (34.5%) | 148 (65.5%) |
| 4+ Person Household | 143 (87.7%) | 20 (12.3%) |
| Total Housing Units | 1,007 (55.3%) | 815 (44.7%) |
Occupancy by Educational Attainment in Del Mar
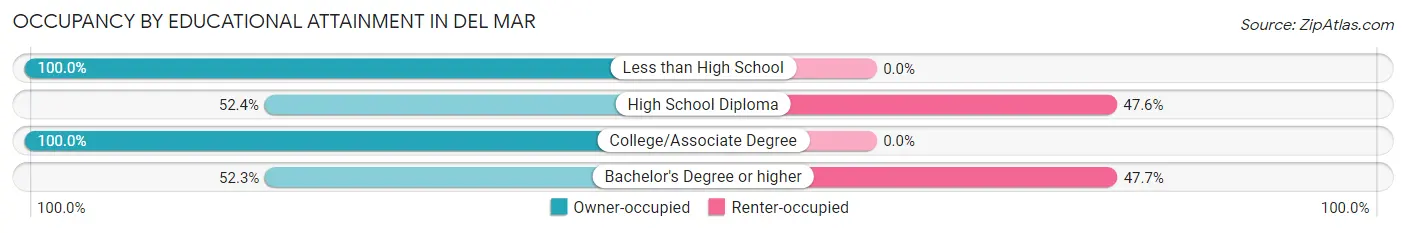
| Household Size | Owner-occupied | Renter-occupied |
| Less than High School | 5 (100.0%) | 0 (0.0%) |
| High School Diploma | 33 (52.4%) | 30 (47.6%) |
| College/Associate Degree | 108 (100.0%) | 0 (0.0%) |
| Bachelor's Degree or higher | 861 (52.3%) | 785 (47.7%) |
Occupancy by Age of Householder in Del Mar
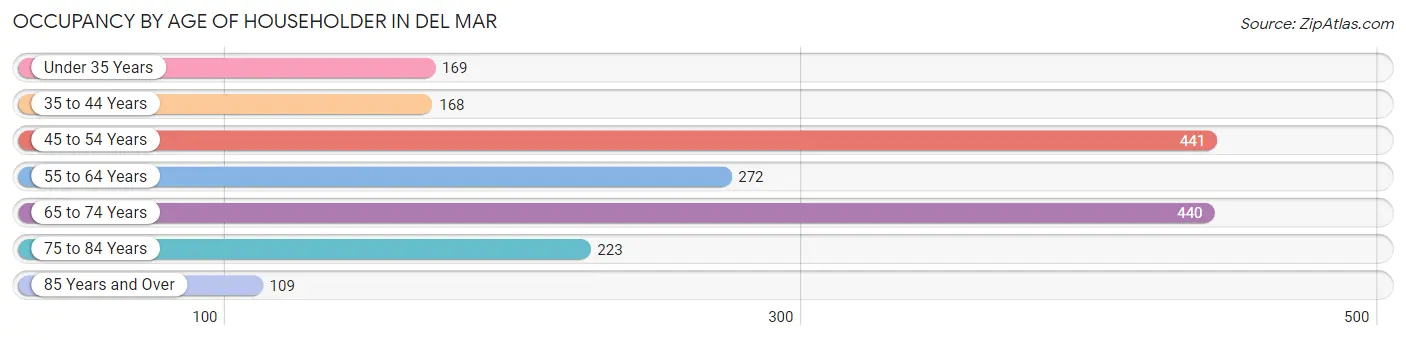
| Age Bracket | # Households | % Households |
| Under 35 Years | 169 | 9.3% |
| 35 to 44 Years | 168 | 9.2% |
| 45 to 54 Years | 441 | 24.2% |
| 55 to 64 Years | 272 | 14.9% |
| 65 to 74 Years | 440 | 24.1% |
| 75 to 84 Years | 223 | 12.2% |
| 85 Years and Over | 109 | 6.0% |
| Total | 1,822 | 100.0% |
Housing Finances in Del Mar
Median Income by Occupancy in Del Mar
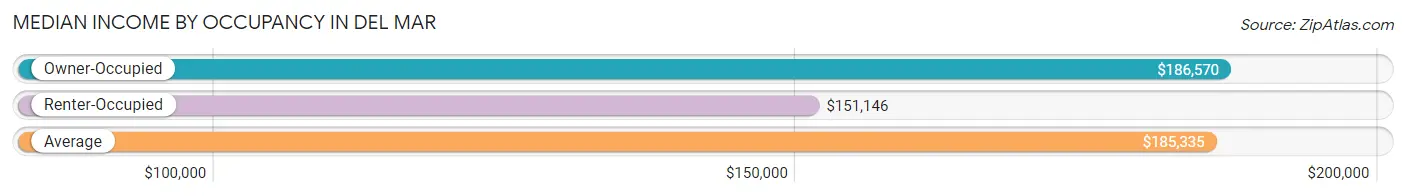
| Occupancy Type | # Households | Median Income |
| Owner-Occupied | 1,007 (55.3%) | $186,570 |
| Renter-Occupied | 815 (44.7%) | $151,146 |
| Average | 1,822 (100.0%) | $185,335 |
Occupancy by Householder Income Bracket in Del Mar
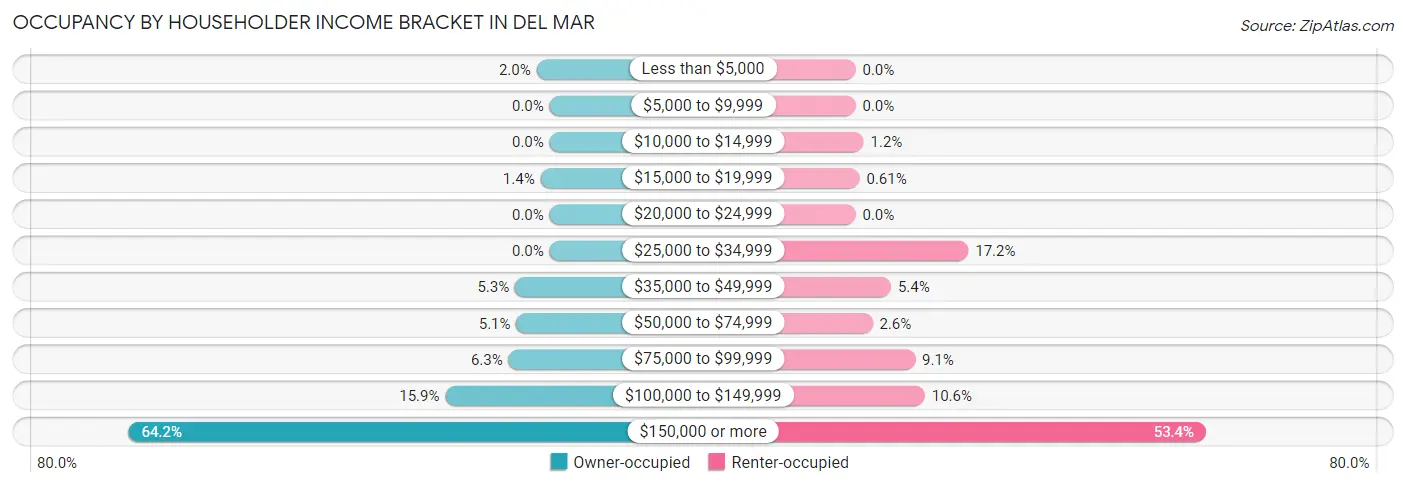
| Income Bracket | Owner-occupied | Renter-occupied |
| Less than $5,000 | 20 (2.0%) | 0 (0.0%) |
| $5,000 to $9,999 | 0 (0.0%) | 0 (0.0%) |
| $10,000 to $14,999 | 0 (0.0%) | 10 (1.2%) |
| $15,000 to $19,999 | 14 (1.4%) | 5 (0.6%) |
| $20,000 to $24,999 | 0 (0.0%) | 0 (0.0%) |
| $25,000 to $34,999 | 0 (0.0%) | 140 (17.2%) |
| $35,000 to $49,999 | 53 (5.3%) | 44 (5.4%) |
| $50,000 to $74,999 | 51 (5.1%) | 21 (2.6%) |
| $75,000 to $99,999 | 63 (6.3%) | 74 (9.1%) |
| $100,000 to $149,999 | 160 (15.9%) | 86 (10.5%) |
| $150,000 or more | 646 (64.1%) | 435 (53.4%) |
| Total | 1,007 (100.0%) | 815 (100.0%) |
Monthly Housing Cost Tiers in Del Mar
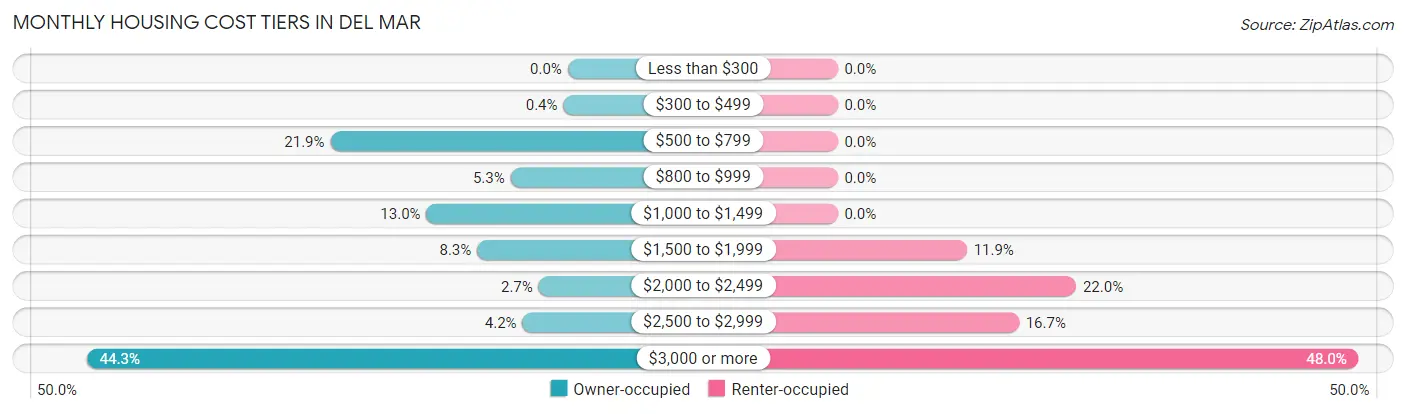
| Monthly Cost | Owner-occupied | Renter-occupied |
| Less than $300 | 0 (0.0%) | 0 (0.0%) |
| $300 to $499 | 4 (0.4%) | 0 (0.0%) |
| $500 to $799 | 220 (21.8%) | 0 (0.0%) |
| $800 to $999 | 53 (5.3%) | 0 (0.0%) |
| $1,000 to $1,499 | 131 (13.0%) | 0 (0.0%) |
| $1,500 to $1,999 | 84 (8.3%) | 97 (11.9%) |
| $2,000 to $2,499 | 27 (2.7%) | 179 (22.0%) |
| $2,500 to $2,999 | 42 (4.2%) | 136 (16.7%) |
| $3,000 or more | 446 (44.3%) | 391 (48.0%) |
| Total | 1,007 (100.0%) | 815 (100.0%) |
Physical Housing Characteristics in Del Mar
Housing Structures in Del Mar
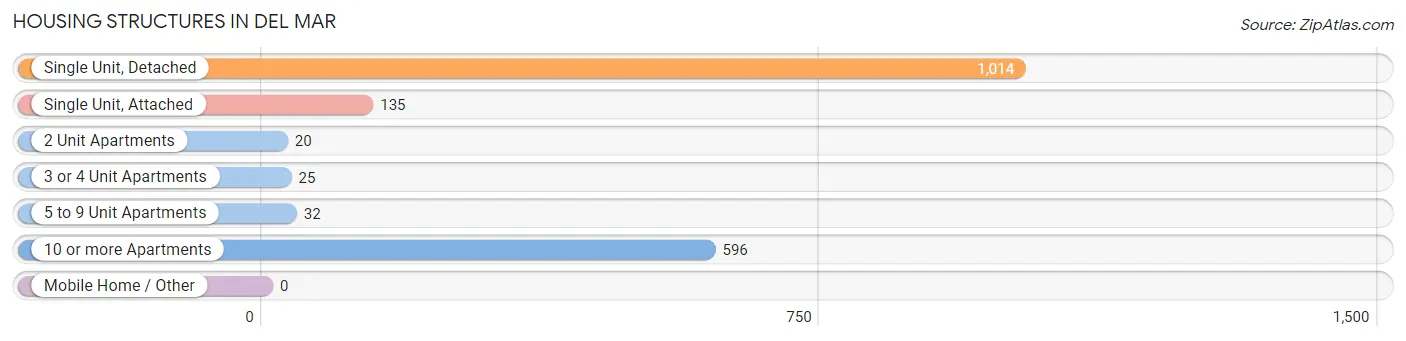
| Structure Type | # Housing Units | % Housing Units |
| Single Unit, Detached | 1,014 | 55.6% |
| Single Unit, Attached | 135 | 7.4% |
| 2 Unit Apartments | 20 | 1.1% |
| 3 or 4 Unit Apartments | 25 | 1.4% |
| 5 to 9 Unit Apartments | 32 | 1.8% |
| 10 or more Apartments | 596 | 32.7% |
| Mobile Home / Other | 0 | 0.0% |
| Total | 1,822 | 100.0% |
Housing Structures by Occupancy in Del Mar
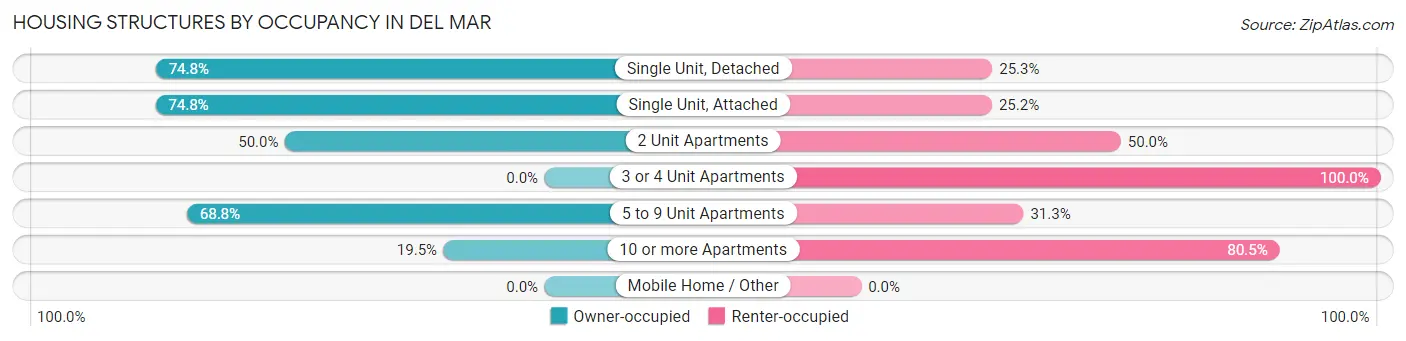
| Structure Type | Owner-occupied | Renter-occupied |
| Single Unit, Detached | 758 (74.8%) | 256 (25.3%) |
| Single Unit, Attached | 101 (74.8%) | 34 (25.2%) |
| 2 Unit Apartments | 10 (50.0%) | 10 (50.0%) |
| 3 or 4 Unit Apartments | 0 (0.0%) | 25 (100.0%) |
| 5 to 9 Unit Apartments | 22 (68.8%) | 10 (31.2%) |
| 10 or more Apartments | 116 (19.5%) | 480 (80.5%) |
| Mobile Home / Other | 0 (0.0%) | 0 (0.0%) |
| Total | 1,007 (55.3%) | 815 (44.7%) |
Housing Structures by Number of Rooms in Del Mar
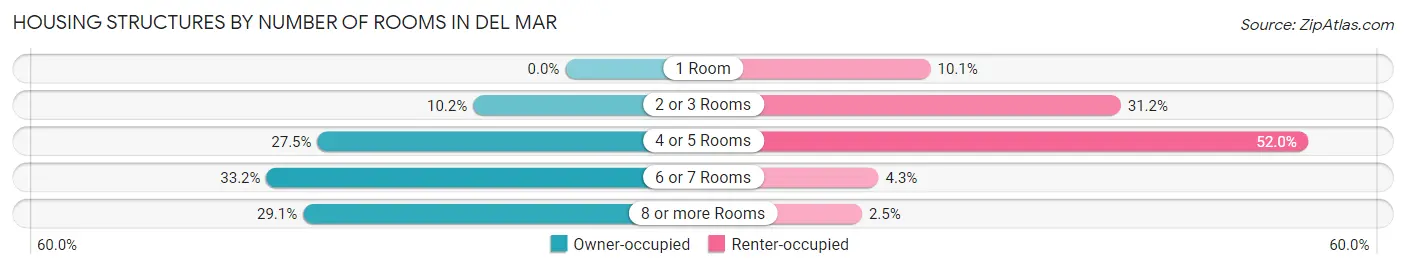
| Number of Rooms | Owner-occupied | Renter-occupied |
| 1 Room | 0 (0.0%) | 82 (10.1%) |
| 2 or 3 Rooms | 103 (10.2%) | 254 (31.2%) |
| 4 or 5 Rooms | 277 (27.5%) | 424 (52.0%) |
| 6 or 7 Rooms | 334 (33.2%) | 35 (4.3%) |
| 8 or more Rooms | 293 (29.1%) | 20 (2.5%) |
| Total | 1,007 (100.0%) | 815 (100.0%) |
Housing Structure by Heating Type in Del Mar
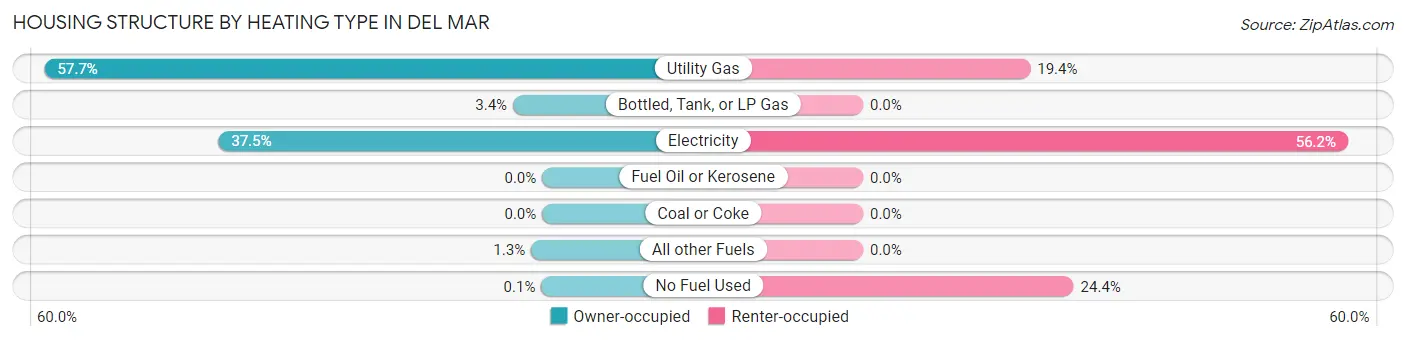
| Heating Type | Owner-occupied | Renter-occupied |
| Utility Gas | 581 (57.7%) | 158 (19.4%) |
| Bottled, Tank, or LP Gas | 34 (3.4%) | 0 (0.0%) |
| Electricity | 378 (37.5%) | 458 (56.2%) |
| Fuel Oil or Kerosene | 0 (0.0%) | 0 (0.0%) |
| Coal or Coke | 0 (0.0%) | 0 (0.0%) |
| All other Fuels | 13 (1.3%) | 0 (0.0%) |
| No Fuel Used | 1 (0.1%) | 199 (24.4%) |
| Total | 1,007 (100.0%) | 815 (100.0%) |
Household Vehicle Usage in Del Mar
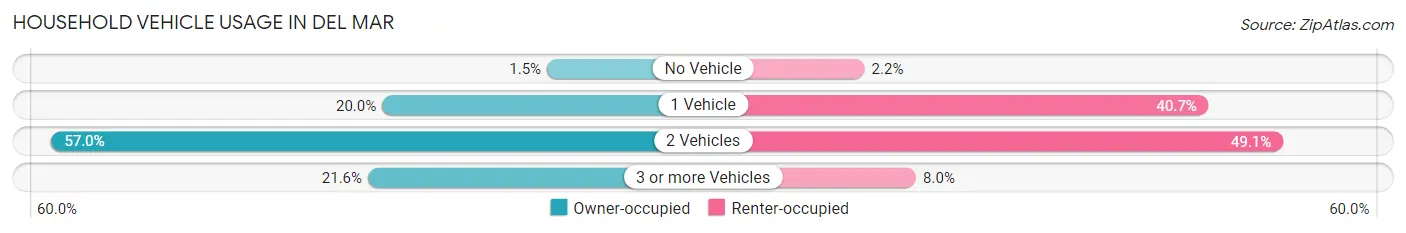
| Vehicles per Household | Owner-occupied | Renter-occupied |
| No Vehicle | 15 (1.5%) | 18 (2.2%) |
| 1 Vehicle | 201 (20.0%) | 332 (40.7%) |
| 2 Vehicles | 574 (57.0%) | 400 (49.1%) |
| 3 or more Vehicles | 217 (21.5%) | 65 (8.0%) |
| Total | 1,007 (100.0%) | 815 (100.0%) |
Real Estate & Mortgages in Del Mar
Real Estate and Mortgage Overview in Del Mar
| Characteristic | Without Mortgage | With Mortgage |
| Housing Units | 501 | 506 |
| Median Property Value | $2,000,001 | $2,000,001 |
| Median Household Income | $167,589 | $373 |
| Monthly Housing Costs | $923 | $433 |
| Real Estate Taxes | $4,597 | $0 |
Property Value by Mortgage Status in Del Mar
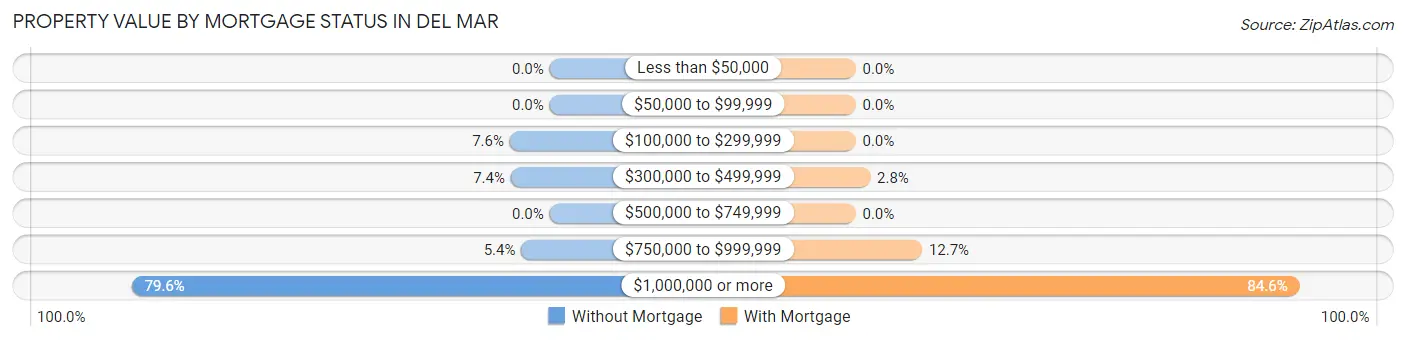
| Property Value | Without Mortgage | With Mortgage |
| Less than $50,000 | 0 (0.0%) | 0 (0.0%) |
| $50,000 to $99,999 | 0 (0.0%) | 0 (0.0%) |
| $100,000 to $299,999 | 38 (7.6%) | 0 (0.0%) |
| $300,000 to $499,999 | 37 (7.4%) | 14 (2.8%) |
| $500,000 to $749,999 | 0 (0.0%) | 0 (0.0%) |
| $750,000 to $999,999 | 27 (5.4%) | 64 (12.7%) |
| $1,000,000 or more | 399 (79.6%) | 428 (84.6%) |
| Total | 501 (100.0%) | 506 (100.0%) |
Household Income by Mortgage Status in Del Mar
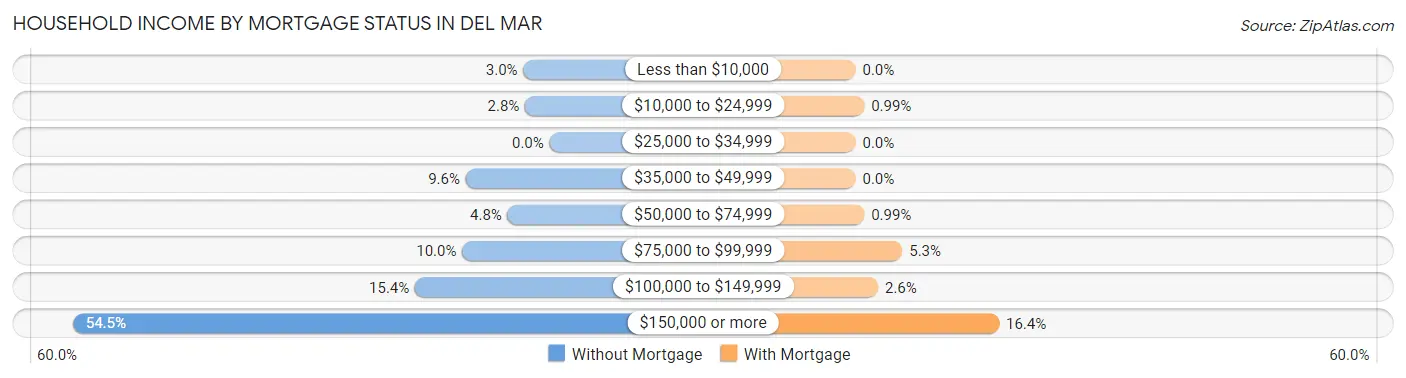
| Household Income | Without Mortgage | With Mortgage |
| Less than $10,000 | 15 (3.0%) | 0 (0.0%) |
| $10,000 to $24,999 | 14 (2.8%) | 5 (1.0%) |
| $25,000 to $34,999 | 0 (0.0%) | 0 (0.0%) |
| $35,000 to $49,999 | 48 (9.6%) | 0 (0.0%) |
| $50,000 to $74,999 | 24 (4.8%) | 5 (1.0%) |
| $75,000 to $99,999 | 50 (10.0%) | 27 (5.3%) |
| $100,000 to $149,999 | 77 (15.4%) | 13 (2.6%) |
| $150,000 or more | 273 (54.5%) | 83 (16.4%) |
| Total | 501 (100.0%) | 506 (100.0%) |
Property Value to Household Income Ratio in Del Mar
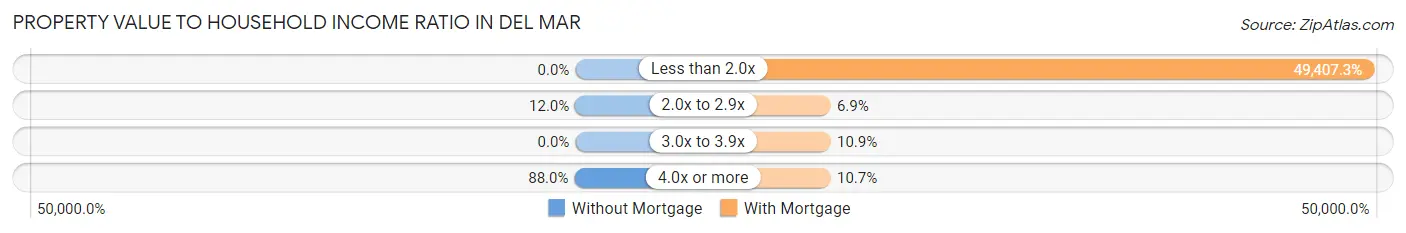
| Value-to-Income Ratio | Without Mortgage | With Mortgage |
| Less than 2.0x | 0 (0.0%) | 250,001 (49,407.3%) |
| 2.0x to 2.9x | 60 (12.0%) | 35 (6.9%) |
| 3.0x to 3.9x | 0 (0.0%) | 55 (10.9%) |
| 4.0x or more | 441 (88.0%) | 54 (10.7%) |
| Total | 501 (100.0%) | 506 (100.0%) |
Real Estate Taxes by Mortgage Status in Del Mar
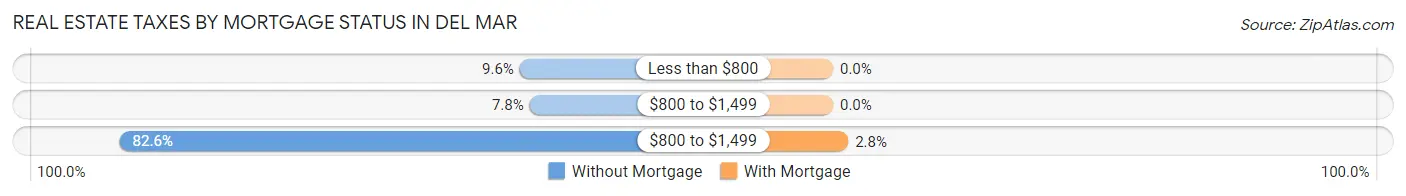
| Property Taxes | Without Mortgage | With Mortgage |
| Less than $800 | 48 (9.6%) | 0 (0.0%) |
| $800 to $1,499 | 39 (7.8%) | 0 (0.0%) |
| $800 to $1,499 | 414 (82.6%) | 14 (2.8%) |
| Total | 501 (100.0%) | 506 (100.0%) |
Health & Disability in Del Mar
Health Insurance Coverage by Age in Del Mar
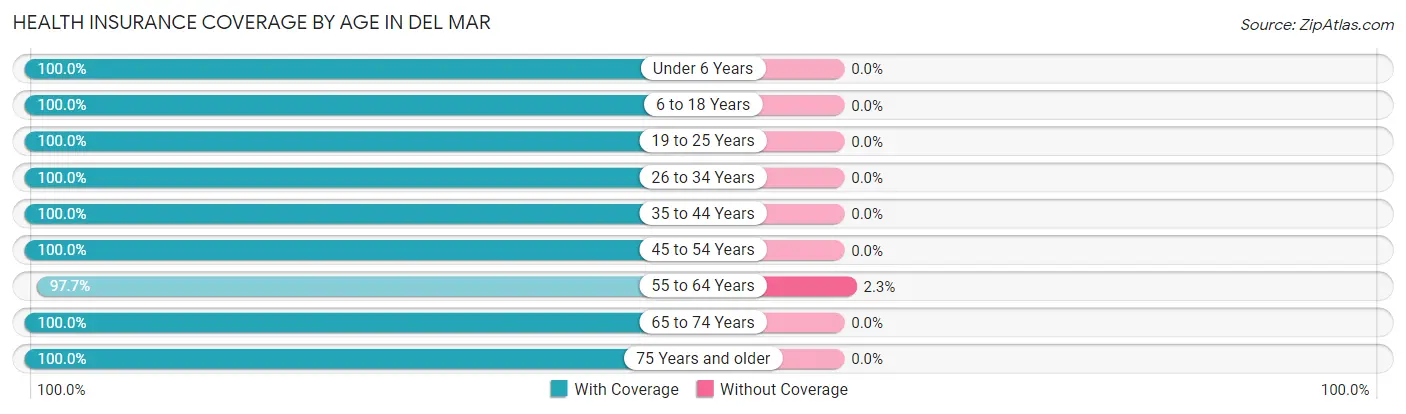
| Age Bracket | With Coverage | Without Coverage |
| Under 6 Years | 111 (100.0%) | 0 (0.0%) |
| 6 to 18 Years | 483 (100.0%) | 0 (0.0%) |
| 19 to 25 Years | 138 (100.0%) | 0 (0.0%) |
| 26 to 34 Years | 295 (100.0%) | 0 (0.0%) |
| 35 to 44 Years | 350 (100.0%) | 0 (0.0%) |
| 45 to 54 Years | 697 (100.0%) | 0 (0.0%) |
| 55 to 64 Years | 599 (97.7%) | 14 (2.3%) |
| 65 to 74 Years | 762 (100.0%) | 0 (0.0%) |
| 75 Years and older | 495 (100.0%) | 0 (0.0%) |
| Total | 3,930 (99.7%) | 14 (0.4%) |
Health Insurance Coverage by Citizenship Status in Del Mar
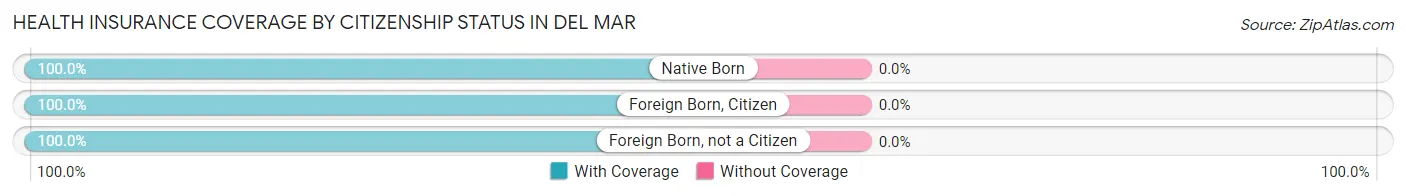
| Citizenship Status | With Coverage | Without Coverage |
| Native Born | 111 (100.0%) | 0 (0.0%) |
| Foreign Born, Citizen | 483 (100.0%) | 0 (0.0%) |
| Foreign Born, not a Citizen | 138 (100.0%) | 0 (0.0%) |
Health Insurance Coverage by Household Income in Del Mar
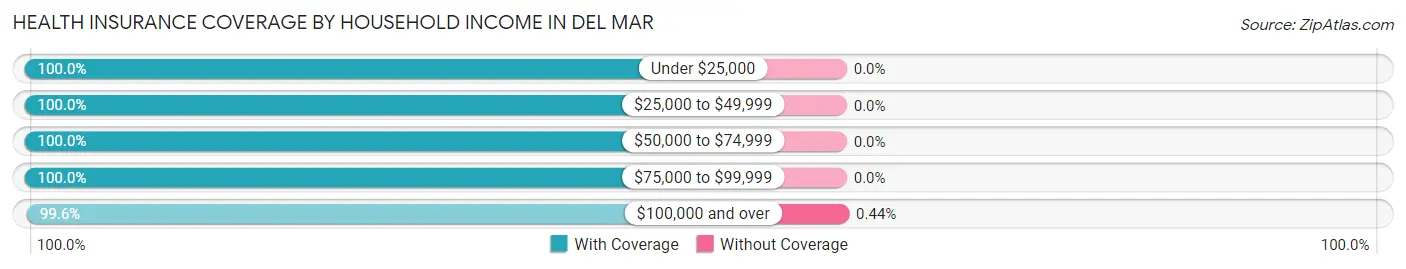
| Household Income | With Coverage | Without Coverage |
| Under $25,000 | 70 (100.0%) | 0 (0.0%) |
| $25,000 to $49,999 | 312 (100.0%) | 0 (0.0%) |
| $50,000 to $74,999 | 159 (100.0%) | 0 (0.0%) |
| $75,000 to $99,999 | 227 (100.0%) | 0 (0.0%) |
| $100,000 and over | 3,162 (99.6%) | 14 (0.4%) |
Public vs Private Health Insurance Coverage by Age in Del Mar
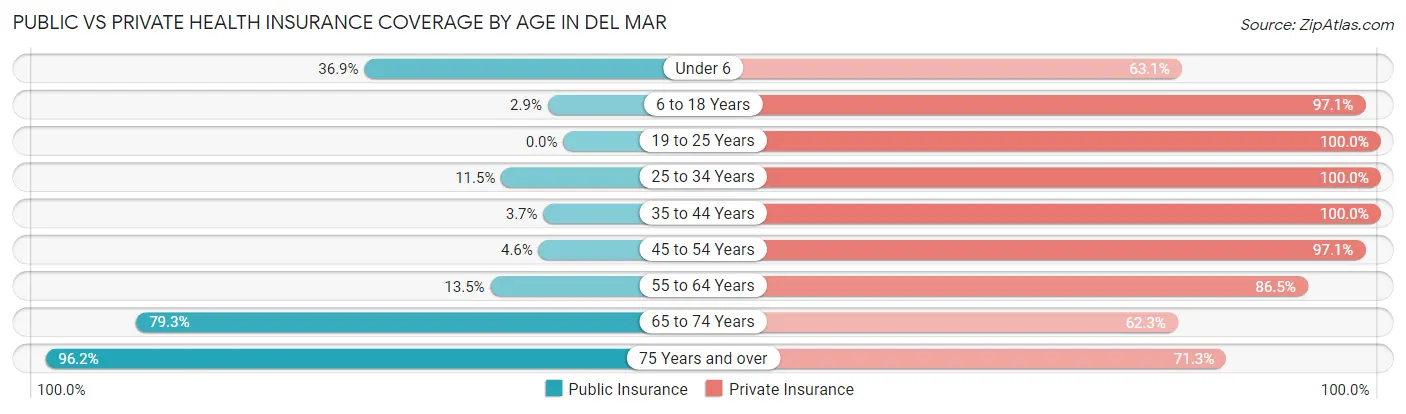
| Age Bracket | Public Insurance | Private Insurance |
| Under 6 | 41 (36.9%) | 70 (63.1%) |
| 6 to 18 Years | 14 (2.9%) | 469 (97.1%) |
| 19 to 25 Years | 0 (0.0%) | 138 (100.0%) |
| 25 to 34 Years | 34 (11.5%) | 295 (100.0%) |
| 35 to 44 Years | 13 (3.7%) | 350 (100.0%) |
| 45 to 54 Years | 32 (4.6%) | 677 (97.1%) |
| 55 to 64 Years | 83 (13.5%) | 530 (86.5%) |
| 65 to 74 Years | 604 (79.3%) | 475 (62.3%) |
| 75 Years and over | 476 (96.2%) | 353 (71.3%) |
| Total | 1,297 (32.9%) | 3,357 (85.1%) |
Disability Status by Sex by Age in Del Mar
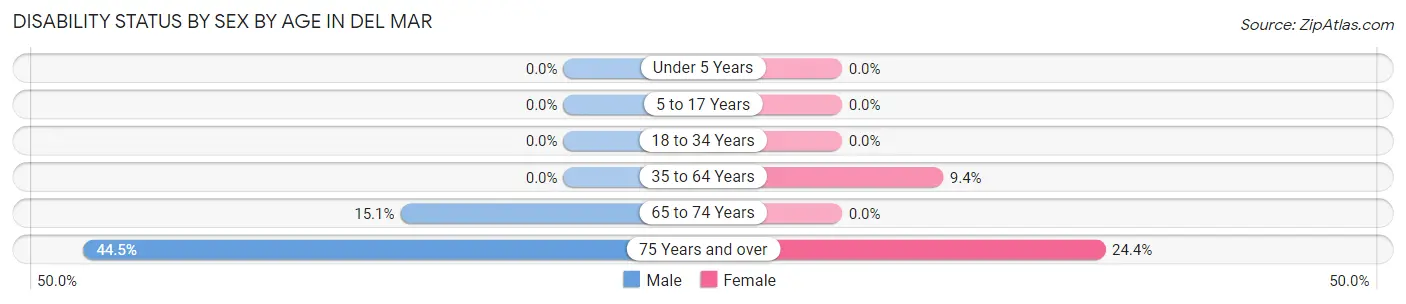
| Age Bracket | Male | Female |
| Under 5 Years | 0 (0.0%) | 0 (0.0%) |
| 5 to 17 Years | 0 (0.0%) | 0 (0.0%) |
| 18 to 34 Years | 0 (0.0%) | 0 (0.0%) |
| 35 to 64 Years | 0 (0.0%) | 85 (9.4%) |
| 65 to 74 Years | 59 (15.1%) | 0 (0.0%) |
| 75 Years and over | 122 (44.5%) | 54 (24.4%) |
Disability Class by Sex by Age in Del Mar
Disability Class: Hearing Difficulty
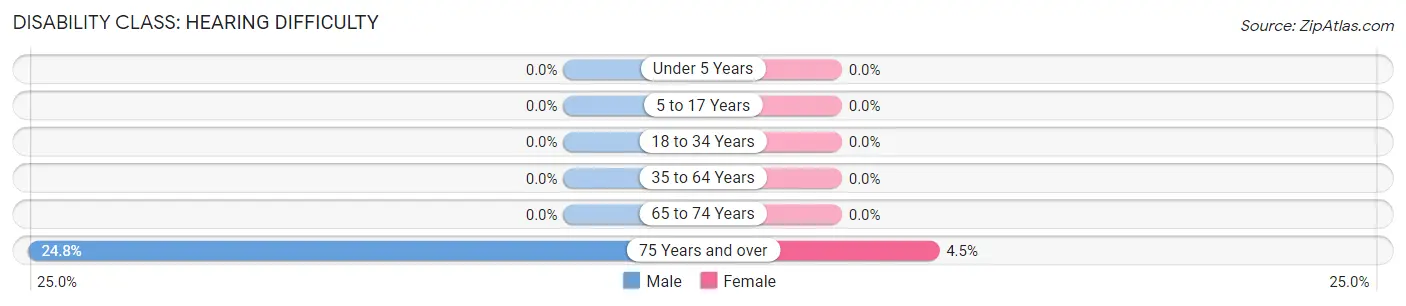
| Age Bracket | Male | Female |
| Under 5 Years | 0 (0.0%) | 0 (0.0%) |
| 5 to 17 Years | 0 (0.0%) | 0 (0.0%) |
| 18 to 34 Years | 0 (0.0%) | 0 (0.0%) |
| 35 to 64 Years | 0 (0.0%) | 0 (0.0%) |
| 65 to 74 Years | 0 (0.0%) | 0 (0.0%) |
| 75 Years and over | 68 (24.8%) | 10 (4.5%) |
Disability Class: Vision Difficulty
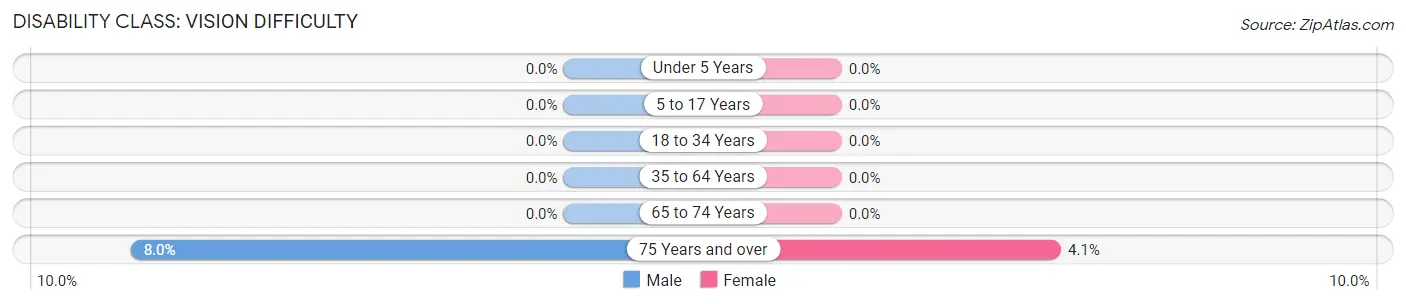
| Age Bracket | Male | Female |
| Under 5 Years | 0 (0.0%) | 0 (0.0%) |
| 5 to 17 Years | 0 (0.0%) | 0 (0.0%) |
| 18 to 34 Years | 0 (0.0%) | 0 (0.0%) |
| 35 to 64 Years | 0 (0.0%) | 0 (0.0%) |
| 65 to 74 Years | 0 (0.0%) | 0 (0.0%) |
| 75 Years and over | 22 (8.0%) | 9 (4.1%) |
Disability Class: Cognitive Difficulty
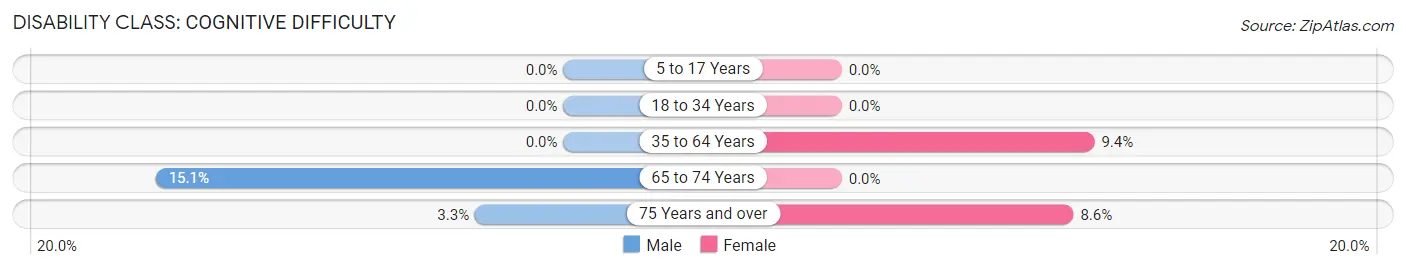
| Age Bracket | Male | Female |
| 5 to 17 Years | 0 (0.0%) | 0 (0.0%) |
| 18 to 34 Years | 0 (0.0%) | 0 (0.0%) |
| 35 to 64 Years | 0 (0.0%) | 85 (9.4%) |
| 65 to 74 Years | 59 (15.1%) | 0 (0.0%) |
| 75 Years and over | 9 (3.3%) | 19 (8.6%) |
Disability Class: Ambulatory Difficulty
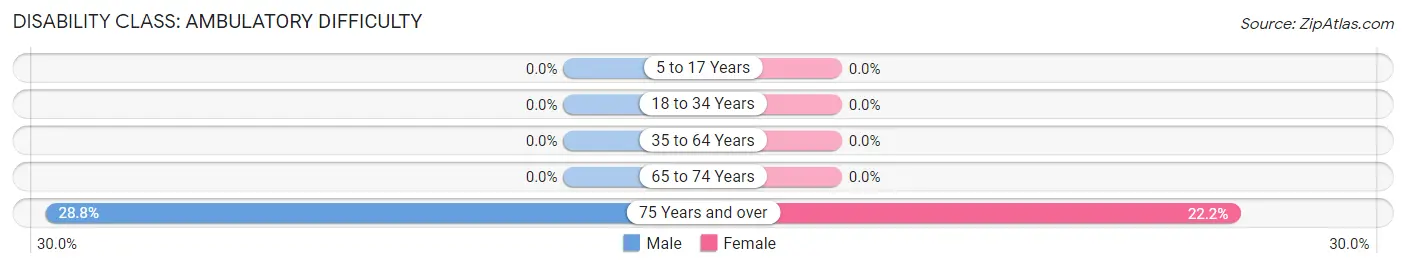
| Age Bracket | Male | Female |
| 5 to 17 Years | 0 (0.0%) | 0 (0.0%) |
| 18 to 34 Years | 0 (0.0%) | 0 (0.0%) |
| 35 to 64 Years | 0 (0.0%) | 0 (0.0%) |
| 65 to 74 Years | 0 (0.0%) | 0 (0.0%) |
| 75 Years and over | 79 (28.8%) | 49 (22.2%) |
Disability Class: Self-Care Difficulty
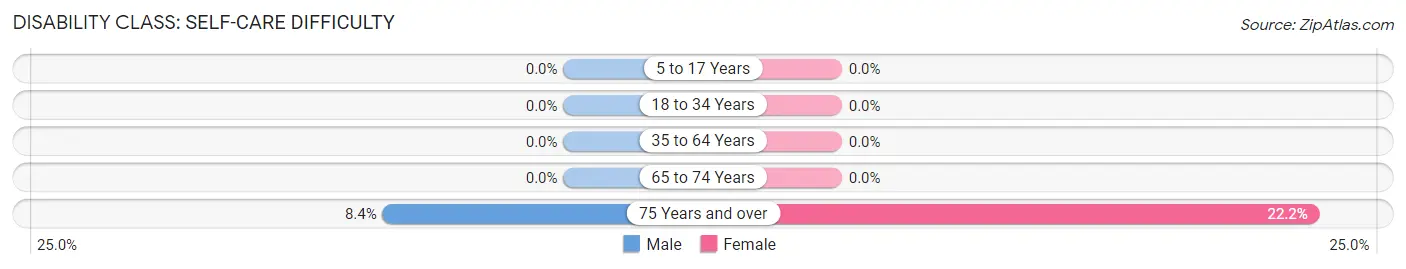
| Age Bracket | Male | Female |
| 5 to 17 Years | 0 (0.0%) | 0 (0.0%) |
| 18 to 34 Years | 0 (0.0%) | 0 (0.0%) |
| 35 to 64 Years | 0 (0.0%) | 0 (0.0%) |
| 65 to 74 Years | 0 (0.0%) | 0 (0.0%) |
| 75 Years and over | 23 (8.4%) | 49 (22.2%) |
Technology Access in Del Mar
Computing Device Access in Del Mar
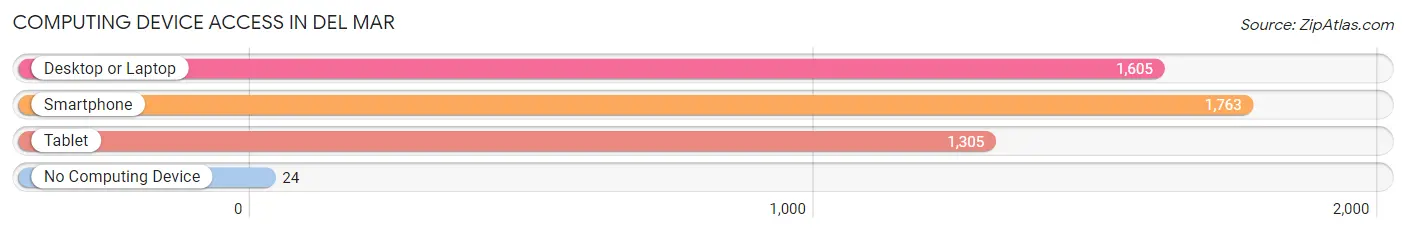
| Device Type | # Households | % Households |
| Desktop or Laptop | 1,605 | 88.1% |
| Smartphone | 1,763 | 96.8% |
| Tablet | 1,305 | 71.6% |
| No Computing Device | 24 | 1.3% |
| Total | 1,822 | 100.0% |
Internet Access in Del Mar
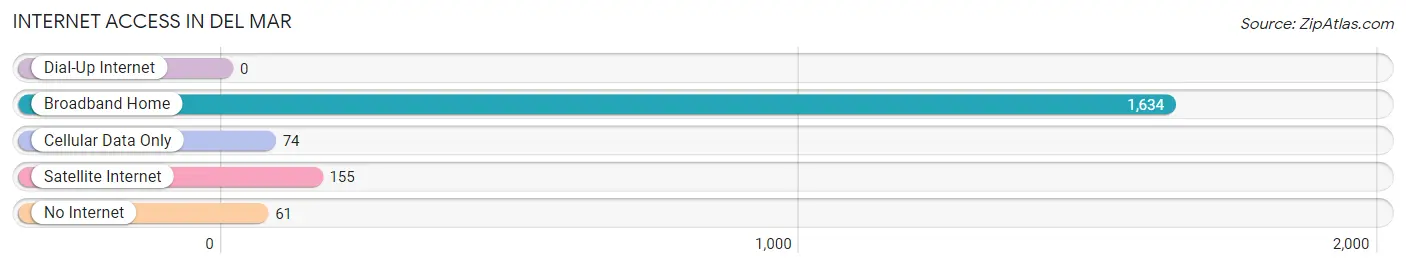
| Internet Type | # Households | % Households |
| Dial-Up Internet | 0 | 0.0% |
| Broadband Home | 1,634 | 89.7% |
| Cellular Data Only | 74 | 4.1% |
| Satellite Internet | 155 | 8.5% |
| No Internet | 61 | 3.4% |
| Total | 1,822 | 100.0% |
Del Mar Summary
Mar Del is a small coastal city located in San Diego County, California. It is situated on the Pacific Ocean, just north of San Diego and south of Orange County. The city is known for its beautiful beaches, world-class surfing, and its laid-back atmosphere.
History
Mar Del was founded in 1885 by a group of investors from San Francisco. The city was named after the Spanish phrase “Mar del Sur” which translates to “Sea of the South”. The city was originally a small fishing village, but it quickly grew in popularity due to its beautiful beaches and mild climate. In the early 1900s, the city began to attract wealthy vacationers from the East Coast and Europe.
In the 1920s, the city was transformed into a resort destination. Hotels, restaurants, and other attractions were built to accommodate the influx of tourists. The city also became a popular destination for Hollywood celebrities, who would often come to Mar Del to escape the hustle and bustle of Los Angeles.
In the 1950s, the city began to experience a decline in tourism due to the rise of air travel. However, the city was able to rebound in the 1960s and 1970s due to the popularity of surfing. The city became a popular destination for surfers from all over the world.
Geography
Mar Del is located on the Pacific Ocean, just north of San Diego and south of Orange County. The city is bordered by the cities of Del Mar, Solana Beach, and Encinitas. The city is situated on a coastal plain, with the San Dieguito River running through the center of the city. The city is home to several beaches, including Del Mar Beach, Torrey Pines Beach, and Moonlight Beach.
The city has a Mediterranean climate, with mild temperatures year-round. The average high temperature in the summer is around 75 degrees Fahrenheit, while the average low temperature in the winter is around 55 degrees Fahrenheit.
Economy
Mar Del’s economy is largely driven by tourism. The city is home to several hotels, restaurants, and other attractions that cater to tourists. The city is also home to several high-end boutiques and shops.
The city is also home to several technology companies, including Qualcomm and Sony. These companies employ thousands of people in the city.
Demographics
As of the 2010 census, the population of Mar Del was 4,161. The population is largely white (83.3%), with a small Hispanic population (7.2%). The median household income is $90,837, and the median age is 44.7 years.
Mar Del is a small city with a laid-back atmosphere. The city is known for its beautiful beaches, world-class surfing, and its vibrant nightlife. The city is a popular destination for tourists and locals alike, and it is a great place to live and visit.
Common Questions
What is Per Capita Income in Del Mar?
Per Capita income in Del Mar is $135,828.
What is the Median Family Income in Del Mar?
Median Family Income in Del Mar is $244,028.
What is the Median Household income in Del Mar?
Median Household Income in Del Mar is $185,335.
What is Income or Wage Gap in Del Mar?
Income or Wage Gap in Del Mar is 50.2%.
Women in Del Mar earn 49.8 cents for every dollar earned by a man.
What is Inequality or Gini Index in Del Mar?
Inequality or Gini Index in Del Mar is 0.52.
What is the Total Population of Del Mar?
Total Population of Del Mar is 3,956.
What is the Total Male Population of Del Mar?
Total Male Population of Del Mar is 1,880.
What is the Total Female Population of Del Mar?
Total Female Population of Del Mar is 2,076.
What is the Ratio of Males per 100 Females in Del Mar?
There are 90.56 Males per 100 Females in Del Mar.
What is the Ratio of Females per 100 Males in Del Mar?
There are 110.43 Females per 100 Males in Del Mar.
What is the Median Population Age in Del Mar?
Median Population Age in Del Mar is 52.0 Years.
What is the Average Family Size in Del Mar
Average Family Size in Del Mar is 2.6 People.
What is the Average Household Size in Del Mar
Average Household Size in Del Mar is 2.2 People.
How Large is the Labor Force in Del Mar?
There are 2,138 People in the Labor Forcein in Del Mar.
What is the Percentage of People in the Labor Force in Del Mar?
62.3% of People are in the Labor Force in Del Mar.
What is the Unemployment Rate in Del Mar?
Unemployment Rate in Del Mar is 2.0%.