Sleepy Hollow, CA Map & Demographics
Sleepy Hollow Map
Sleepy Hollow Overview
$127,770
PER CAPITA INCOME
$208,017
AVG FAMILY INCOME
$207,847
AVG HOUSEHOLD INCOME
62.6%
WAGE / INCOME GAP [ % ]
37.4¢/ $1
WAGE / INCOME GAP [ $ ]
0.54
INEQUALITY / GINI INDEX
2,778
TOTAL POPULATION
1,385
MALE POPULATION
1,393
FEMALE POPULATION
99.43
MALES / 100 FEMALES
100.58
FEMALES / 100 MALES
44.6
MEDIAN AGE
3.2
AVG FAMILY SIZE
3.3
AVG HOUSEHOLD SIZE
1,347
LABOR FORCE [ PEOPLE ]
64.3%
PERCENT IN LABOR FORCE
8.4%
UNEMPLOYMENT RATE
Income in Sleepy Hollow
Income Overview in Sleepy Hollow
Per Capita Income in Sleepy Hollow is $127,770, while median incomes of families and households are $208,017 and $207,847 respectively.
| Characteristic | Number | Measure |
| Per Capita Income | 2,778 | $127,770 |
| Median Family Income | 774 | $208,017 |
| Mean Family Income | 774 | $431,957 |
| Median Household Income | 821 | $207,847 |
| Mean Household Income | 821 | $420,201 |
| Income Deficit | 774 | $0 |
| Wage / Income Gap (%) | 2,778 | 62.63% |
| Wage / Income Gap ($) | 2,778 | 37.37¢ per $1 |
| Gini / Inequality Index | 2,778 | 0.54 |
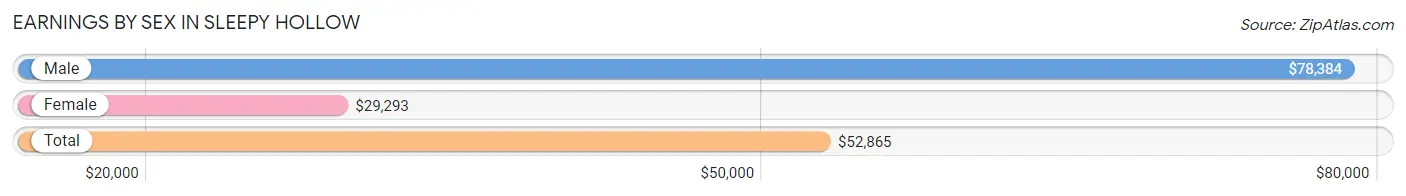
Earnings by Sex in Sleepy Hollow
Average Earnings in Sleepy Hollow are $52,865, $78,384 for men and $29,293 for women, a difference of 62.6%.
| Sex | Number | Average Earnings |
| Male | 747 (48.9%) | $78,384 |
| Female | 779 (51.0%) | $29,293 |
| Total | 1,526 (100.0%) | $52,865 |
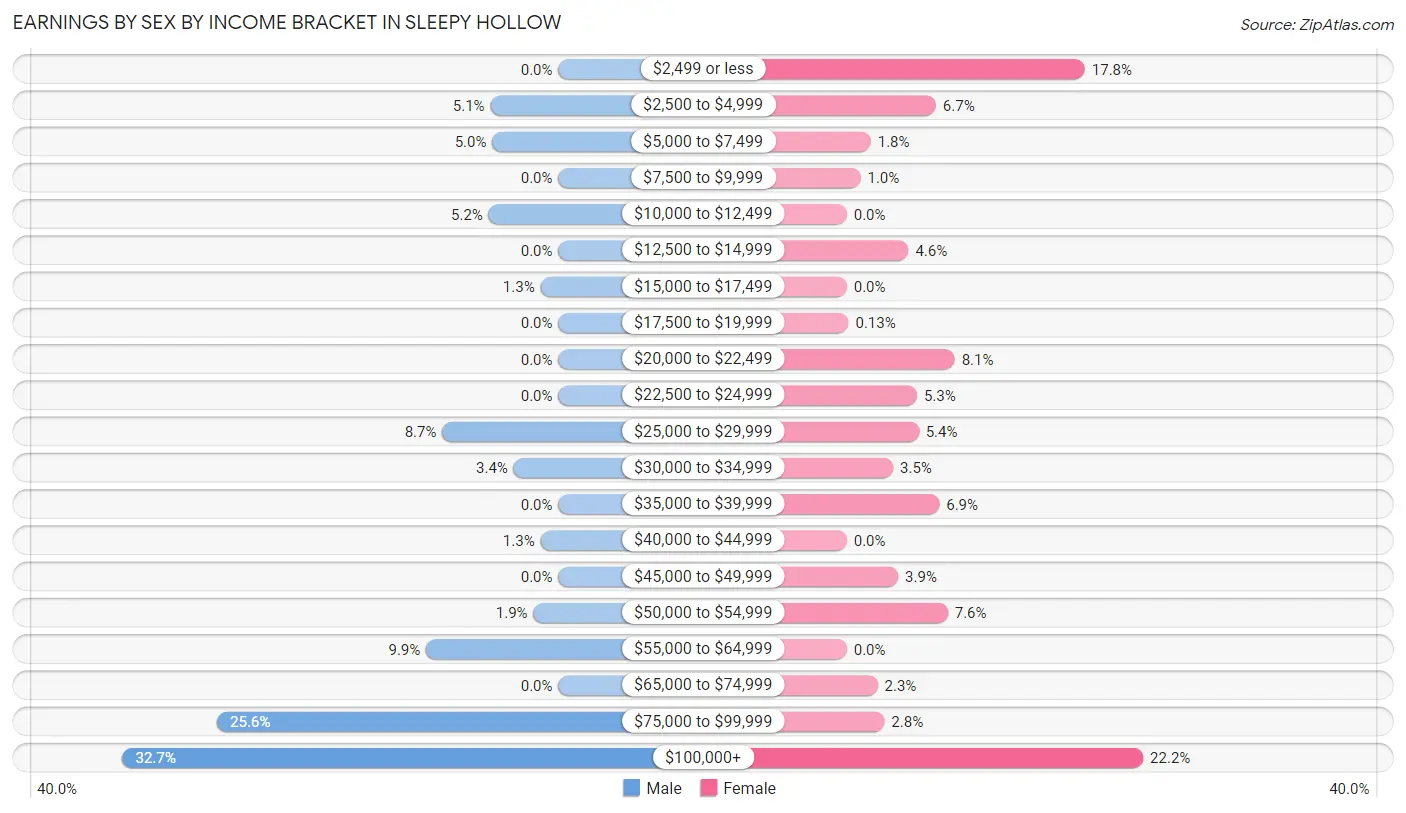
Earnings by Sex by Income Bracket in Sleepy Hollow
The most common earnings brackets in Sleepy Hollow are $100,000+ for men (244 | 32.7%) and $100,000+ for women (173 | 22.2%).
| Income | Male | Female |
| $2,499 or less | 0 (0.0%) | 139 (17.8%) |
| $2,500 to $4,999 | 38 (5.1%) | 52 (6.7%) |
| $5,000 to $7,499 | 37 (5.0%) | 14 (1.8%) |
| $7,500 to $9,999 | 0 (0.0%) | 8 (1.0%) |
| $10,000 to $12,499 | 39 (5.2%) | 0 (0.0%) |
| $12,500 to $14,999 | 0 (0.0%) | 36 (4.6%) |
| $15,000 to $17,499 | 10 (1.3%) | 0 (0.0%) |
| $17,500 to $19,999 | 0 (0.0%) | 1 (0.1%) |
| $20,000 to $22,499 | 0 (0.0%) | 63 (8.1%) |
| $22,500 to $24,999 | 0 (0.0%) | 41 (5.3%) |
| $25,000 to $29,999 | 65 (8.7%) | 42 (5.4%) |
| $30,000 to $34,999 | 25 (3.4%) | 27 (3.5%) |
| $35,000 to $39,999 | 0 (0.0%) | 54 (6.9%) |
| $40,000 to $44,999 | 10 (1.3%) | 0 (0.0%) |
| $45,000 to $49,999 | 0 (0.0%) | 30 (3.8%) |
| $50,000 to $54,999 | 14 (1.9%) | 59 (7.6%) |
| $55,000 to $64,999 | 74 (9.9%) | 0 (0.0%) |
| $65,000 to $74,999 | 0 (0.0%) | 18 (2.3%) |
| $75,000 to $99,999 | 191 (25.6%) | 22 (2.8%) |
| $100,000+ | 244 (32.7%) | 173 (22.2%) |
| Total | 747 (100.0%) | 779 (100.0%) |
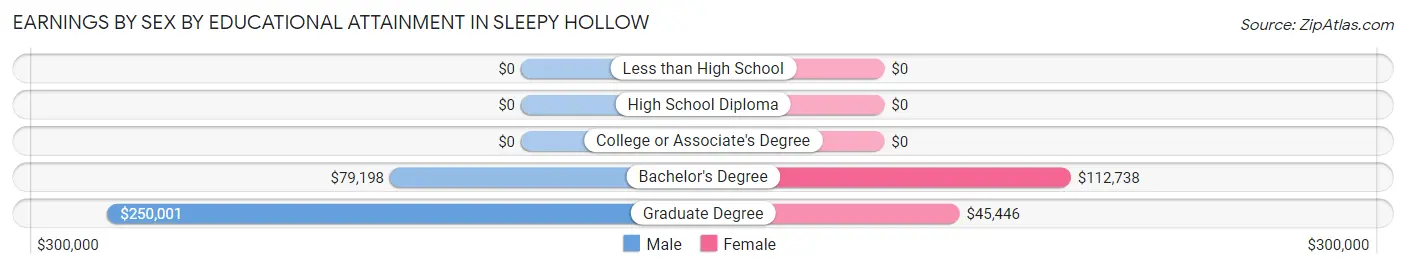
Earnings by Sex by Educational Attainment in Sleepy Hollow
Average earnings in Sleepy Hollow are $79,682 for men and $46,625 for women, a difference of 41.5%. Men with an educational attainment of graduate degree enjoy the highest average annual earnings of $250,001, while those with bachelor's degree education earn the least with $79,198. Women with an educational attainment of bachelor's degree earn the most with the average annual earnings of $112,738, while those with graduate degree education have the smallest earnings of $45,446.
| Educational Attainment | Male Income | Female Income |
| Less than High School | - | - |
| High School Diploma | - | - |
| College or Associate's Degree | - | - |
| Bachelor's Degree | $79,198 | $112,738 |
| Graduate Degree | $250,001 | $45,446 |
| Total | $79,682 | $46,625 |
Family Income in Sleepy Hollow
Family Income Brackets in Sleepy Hollow
According to the Sleepy Hollow family income data, there are 420 families falling into the $200,000+ income range, which is the most common income bracket and makes up 54.3% of all families.
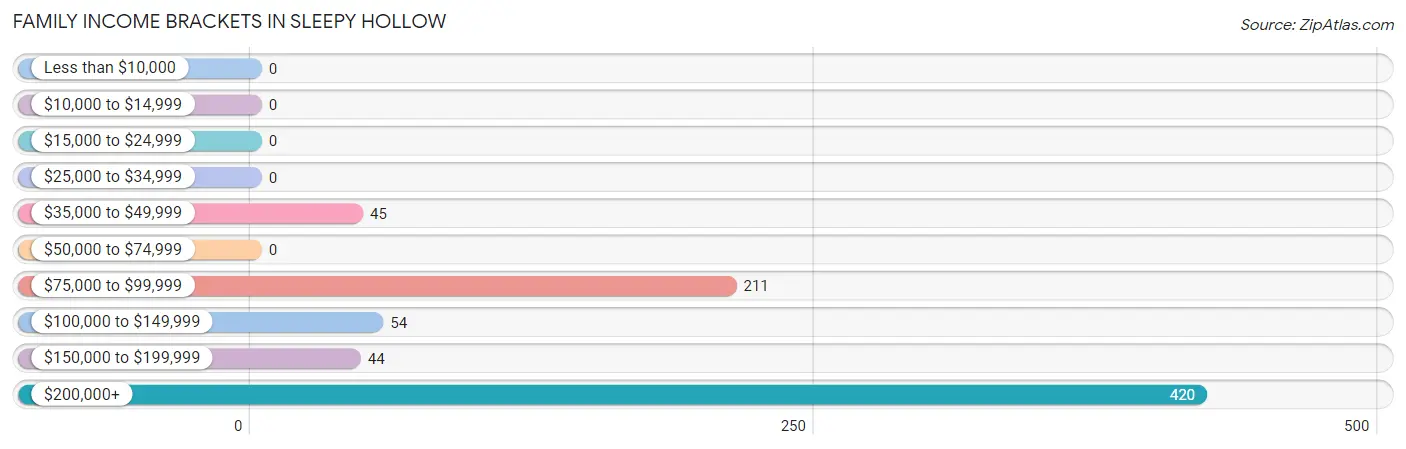
| Income Bracket | # Families | % Families |
| Less than $10,000 | 0 | 0.0% |
| $10,000 to $14,999 | 0 | 0.0% |
| $15,000 to $24,999 | 0 | 0.0% |
| $25,000 to $34,999 | 0 | 0.0% |
| $35,000 to $49,999 | 45 | 5.8% |
| $50,000 to $74,999 | 0 | 0.0% |
| $75,000 to $99,999 | 211 | 27.3% |
| $100,000 to $149,999 | 54 | 7.0% |
| $150,000 to $199,999 | 44 | 5.7% |
| $200,000+ | 420 | 54.3% |
Family Income by Famaliy Size in Sleepy Hollow
4-person families (191 | 24.7%) account for the highest median family income in Sleepy Hollow with $250,001 per family, while 4-person families (191 | 24.7%) have the highest median income of $62,500 per family member.
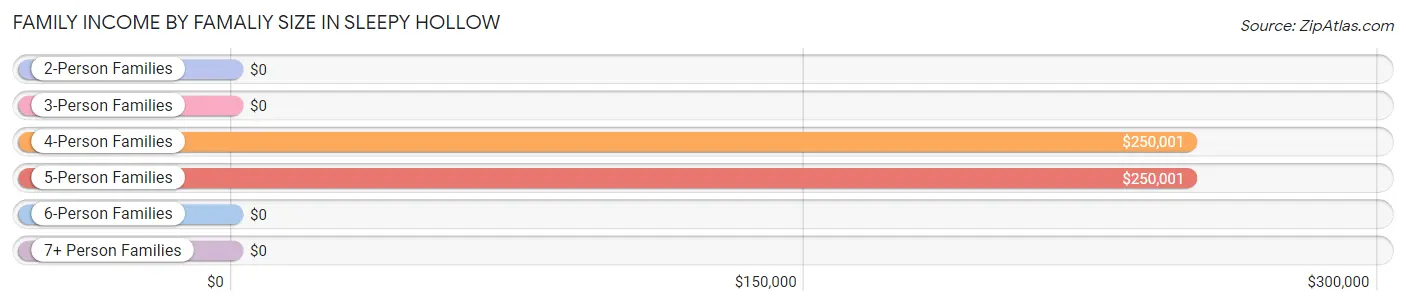
| Income Bracket | # Families | Median Income |
| 2-Person Families | 261 (33.7%) | $0 |
| 3-Person Families | 234 (30.2%) | $0 |
| 4-Person Families | 191 (24.7%) | $250,001 |
| 5-Person Families | 88 (11.4%) | $250,001 |
| 6-Person Families | 0 (0.0%) | $0 |
| 7+ Person Families | 0 (0.0%) | $0 |
| Total | 774 (100.0%) | $208,017 |
Family Income by Number of Earners in Sleepy Hollow
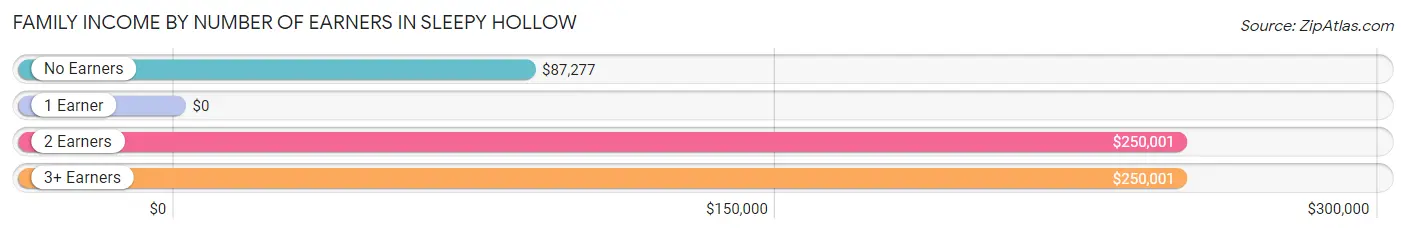
| Number of Earners | # Families | Median Income |
| No Earners | 101 (13.1%) | $87,277 |
| 1 Earner | 279 (36.0%) | $0 |
| 2 Earners | 261 (33.7%) | $250,001 |
| 3+ Earners | 133 (17.2%) | $250,001 |
| Total | 774 (100.0%) | $208,017 |
Household Income in Sleepy Hollow
Household Income Brackets in Sleepy Hollow
With 445 households falling in the category, the $200,000+ income range is the most frequent in Sleepy Hollow, accounting for 54.2% of all households.
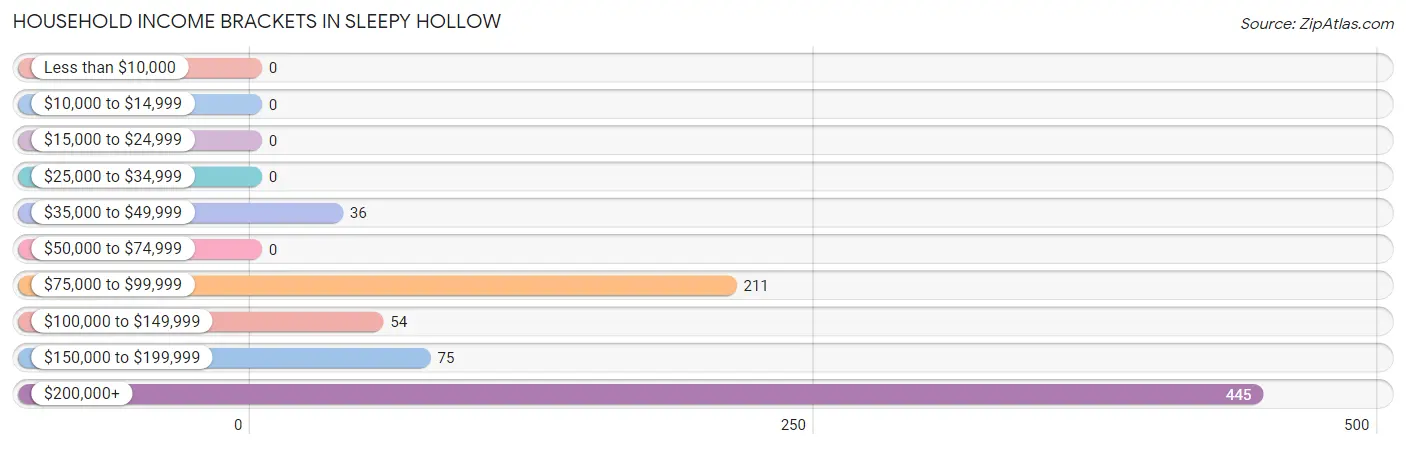
| Income Bracket | # Households | % Households |
| Less than $10,000 | 0 | 0.0% |
| $10,000 to $14,999 | 0 | 0.0% |
| $15,000 to $24,999 | 0 | 0.0% |
| $25,000 to $34,999 | 0 | 0.0% |
| $35,000 to $49,999 | 36 | 4.4% |
| $50,000 to $74,999 | 0 | 0.0% |
| $75,000 to $99,999 | 211 | 25.7% |
| $100,000 to $149,999 | 54 | 6.6% |
| $150,000 to $199,999 | 75 | 9.1% |
| $200,000+ | 445 | 54.2% |
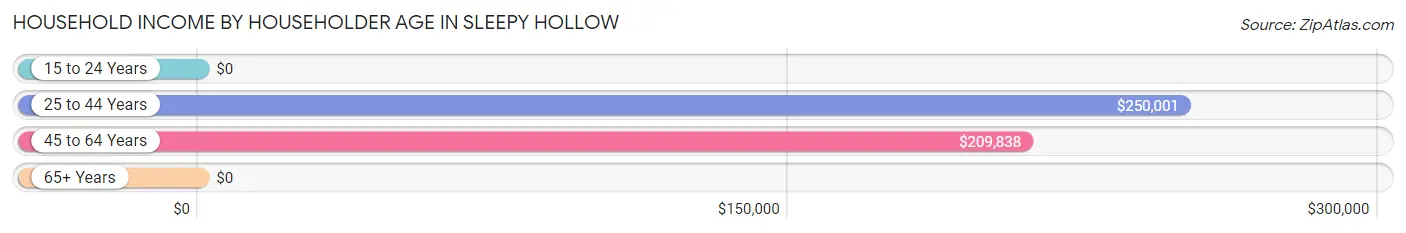
Household Income by Householder Age in Sleepy Hollow
The median household income in Sleepy Hollow is $207,847, with the highest median household income of $250,001 found in the 25 to 44 years age bracket for the primary householder. A total of 98 households (11.9%) fall into this category.
| Income Bracket | # Households | Median Income |
| 15 to 24 Years | 0 (0.0%) | $0 |
| 25 to 44 Years | 98 (11.9%) | $250,001 |
| 45 to 64 Years | 555 (67.6%) | $209,838 |
| 65+ Years | 168 (20.5%) | $0 |
| Total | 821 (100.0%) | $207,847 |
Poverty in Sleepy Hollow
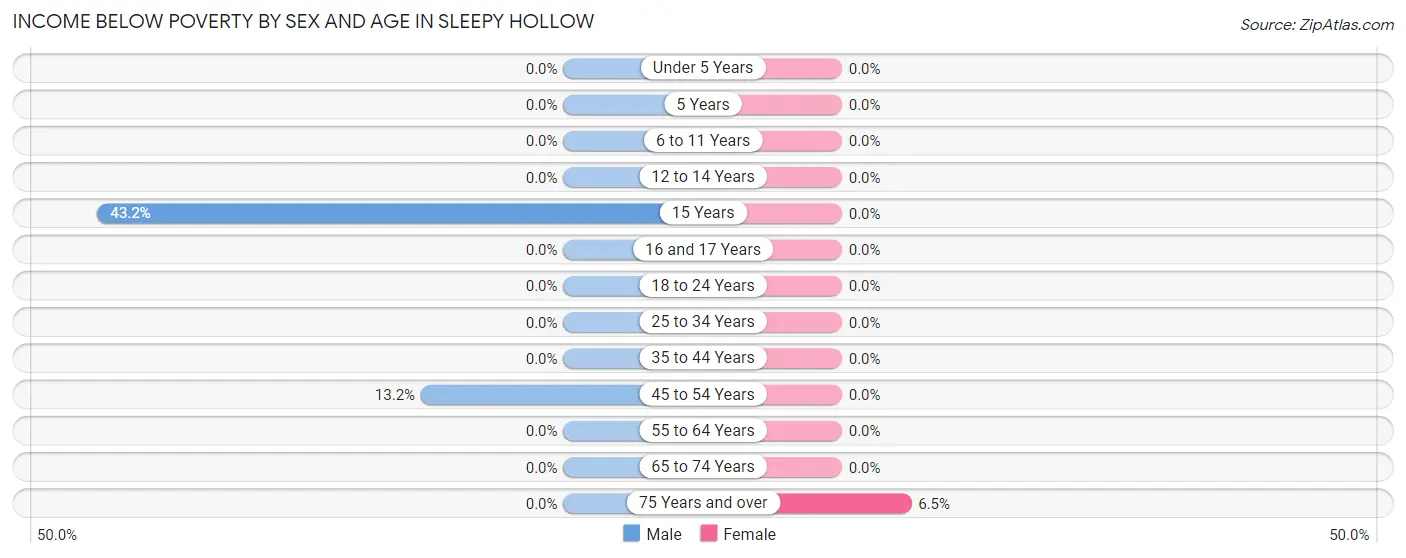
Income Below Poverty by Sex and Age in Sleepy Hollow
With 4.1% poverty level for males and 0.3% for females among the residents of Sleepy Hollow, 15 year old males and 75 year old and over females are the most vulnerable to poverty, with 32 males (43.2%) and 4 females (6.5%) in their respective age groups living below the poverty level.
| Age Bracket | Male | Female |
| Under 5 Years | 0 (0.0%) | 0 (0.0%) |
| 5 Years | 0 (0.0%) | 0 (0.0%) |
| 6 to 11 Years | 0 (0.0%) | 0 (0.0%) |
| 12 to 14 Years | 0 (0.0%) | 0 (0.0%) |
| 15 Years | 32 (43.2%) | 0 (0.0%) |
| 16 and 17 Years | 0 (0.0%) | 0 (0.0%) |
| 18 to 24 Years | 0 (0.0%) | 0 (0.0%) |
| 25 to 34 Years | 0 (0.0%) | 0 (0.0%) |
| 35 to 44 Years | 0 (0.0%) | 0 (0.0%) |
| 45 to 54 Years | 23 (13.2%) | 0 (0.0%) |
| 55 to 64 Years | 0 (0.0%) | 0 (0.0%) |
| 65 to 74 Years | 0 (0.0%) | 0 (0.0%) |
| 75 Years and over | 0 (0.0%) | 4 (6.5%) |
| Total | 55 (4.1%) | 4 (0.3%) |
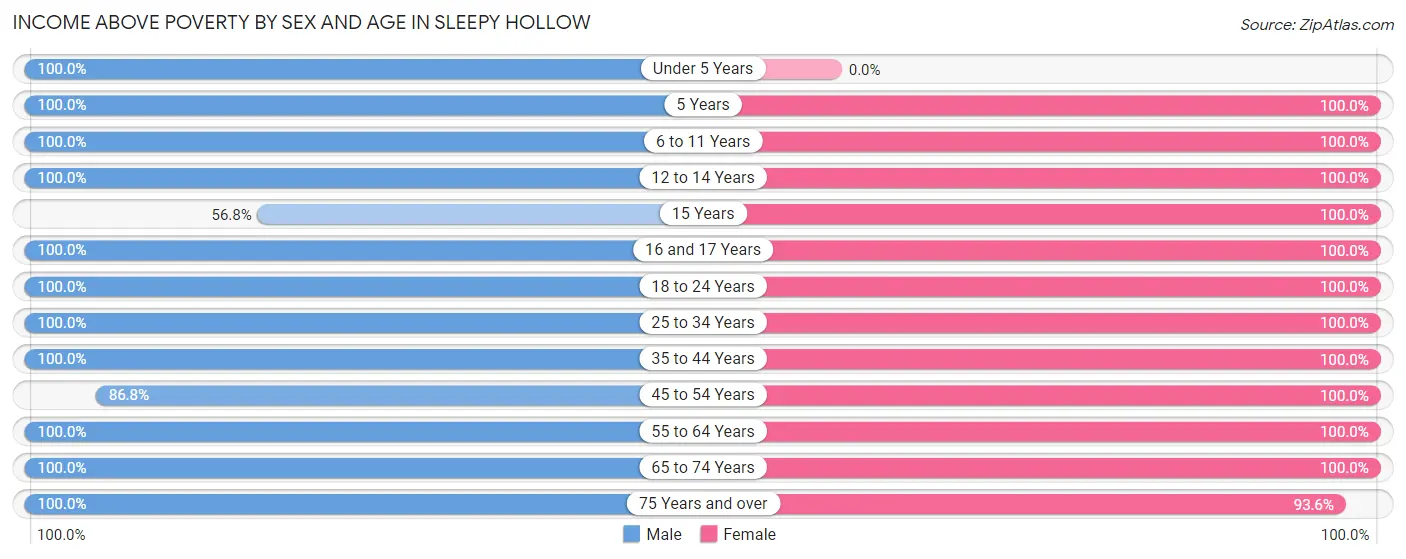
Income Above Poverty by Sex and Age in Sleepy Hollow
According to the poverty statistics in Sleepy Hollow, males aged under 5 years and females aged 5 years are the age groups that are most secure financially, with 100.0% of males and 100.0% of females in these age groups living above the poverty line.
| Age Bracket | Male | Female |
| Under 5 Years | 66 (100.0%) | 0 (0.0%) |
| 5 Years | 16 (100.0%) | 18 (100.0%) |
| 6 to 11 Years | 97 (100.0%) | 120 (100.0%) |
| 12 to 14 Years | 74 (100.0%) | 158 (100.0%) |
| 15 Years | 42 (56.8%) | 29 (100.0%) |
| 16 and 17 Years | 25 (100.0%) | 16 (100.0%) |
| 18 to 24 Years | 99 (100.0%) | 225 (100.0%) |
| 25 to 34 Years | 112 (100.0%) | 18 (100.0%) |
| 35 to 44 Years | 45 (100.0%) | 95 (100.0%) |
| 45 to 54 Years | 151 (86.8%) | 222 (100.0%) |
| 55 to 64 Years | 342 (100.0%) | 241 (100.0%) |
| 65 to 74 Years | 157 (100.0%) | 117 (100.0%) |
| 75 Years and over | 62 (100.0%) | 58 (93.5%) |
| Total | 1,288 (95.9%) | 1,317 (99.7%) |
Income Below Poverty Among Married-Couple Families in Sleepy Hollow
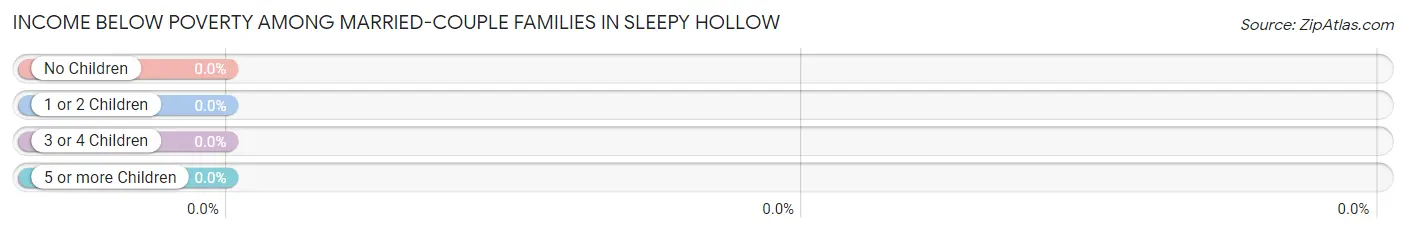
| Children | Above Poverty | Below Poverty |
| No Children | 349 (100.0%) | 0 (0.0%) |
| 1 or 2 Children | 137 (100.0%) | 0 (0.0%) |
| 3 or 4 Children | 70 (100.0%) | 0 (0.0%) |
| 5 or more Children | 0 (0.0%) | 0 (0.0%) |
| Total | 556 (100.0%) | 0 (0.0%) |
Income Below Poverty Among Single-Parent Households in Sleepy Hollow
| Children | Single Father | Single Mother |
| No Children | 0 (0.0%) | 0 (0.0%) |
| 1 or 2 Children | 0 (0.0%) | 0 (0.0%) |
| 3 or 4 Children | 0 (0.0%) | 0 (0.0%) |
| 5 or more Children | 0 (0.0%) | 0 (0.0%) |
| Total | 0 (0.0%) | 0 (0.0%) |
Income Below Poverty Among Married-Couple vs Single-Parent Households in Sleepy Hollow
| Children | Married-Couple Families | Single-Parent Households |
| No Children | 0 (0.0%) | 0 (0.0%) |
| 1 or 2 Children | 0 (0.0%) | 0 (0.0%) |
| 3 or 4 Children | 0 (0.0%) | 0 (0.0%) |
| 5 or more Children | 0 (0.0%) | 0 (0.0%) |
| Total | 0 (0.0%) | 0 (0.0%) |
Race in Sleepy Hollow
The most populous races in Sleepy Hollow are White / Caucasian (2,445 | 88.0%), Hispanic or Latino (201 | 7.2%), and Two or more Races (179 | 6.4%).
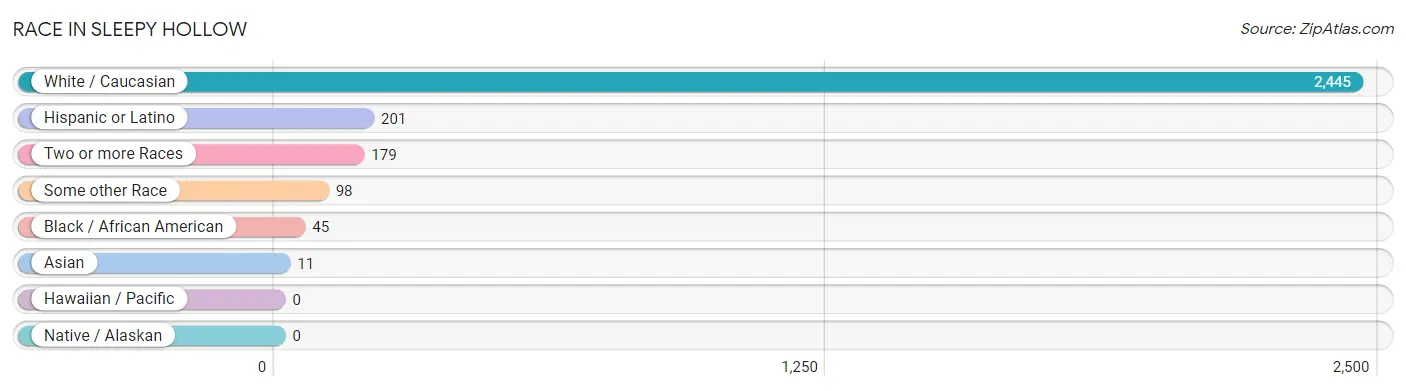
| Race | # Population | % Population |
| Asian | 11 | 0.4% |
| Black / African American | 45 | 1.6% |
| Hawaiian / Pacific | 0 | 0.0% |
| Hispanic or Latino | 201 | 7.2% |
| Native / Alaskan | 0 | 0.0% |
| White / Caucasian | 2,445 | 88.0% |
| Two or more Races | 179 | 6.4% |
| Some other Race | 98 | 3.5% |
| Total | 2,778 | 100.0% |
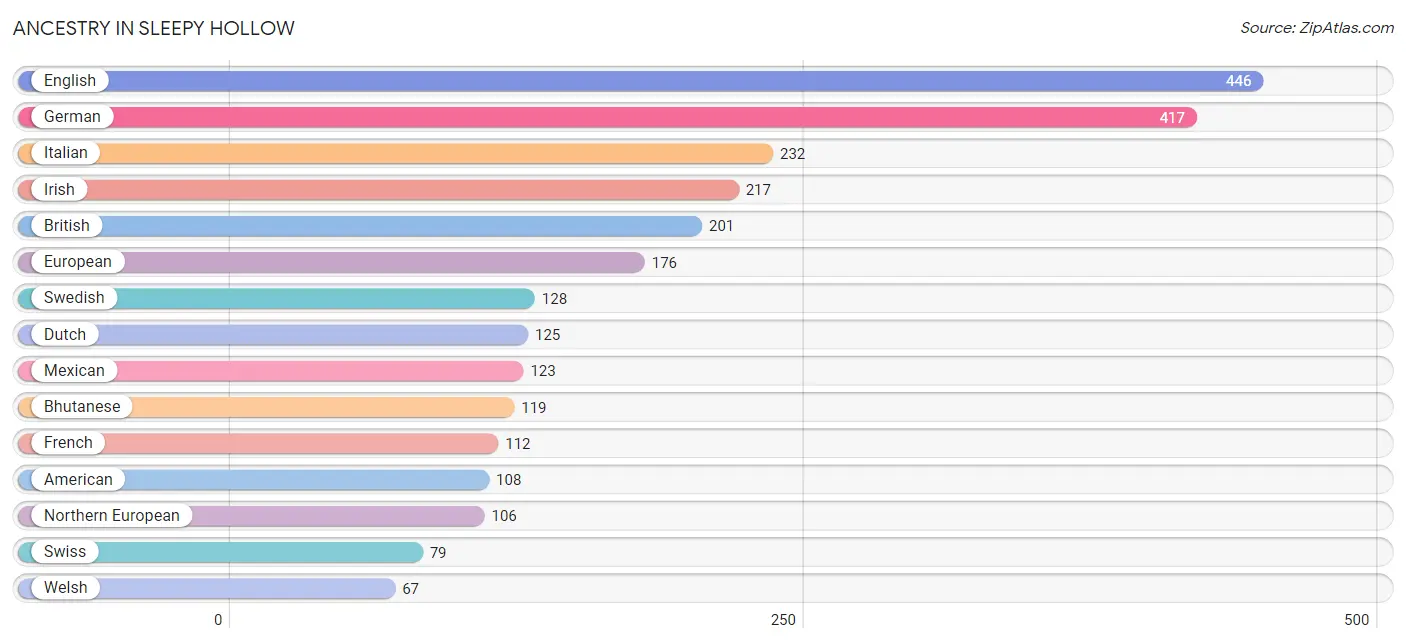
Ancestry in Sleepy Hollow
The most populous ancestries reported in Sleepy Hollow are English (446 | 16.1%), German (417 | 15.0%), Italian (232 | 8.4%), Irish (217 | 7.8%), and British (201 | 7.2%), together accounting for 54.5% of all Sleepy Hollow residents.
| Ancestry | # Population | % Population |
| American | 108 | 3.9% |
| Arab | 25 | 0.9% |
| Argentinean | 22 | 0.8% |
| Belizean | 37 | 1.3% |
| Bhutanese | 119 | 4.3% |
| British | 201 | 7.2% |
| Central American | 15 | 0.5% |
| Danish | 46 | 1.7% |
| Dutch | 125 | 4.5% |
| Eastern European | 20 | 0.7% |
| English | 446 | 16.1% |
| European | 176 | 6.3% |
| French | 112 | 4.0% |
| French Canadian | 25 | 0.9% |
| German | 417 | 15.0% |
| Guatemalan | 15 | 0.5% |
| Indian (Asian) | 5 | 0.2% |
| Irish | 217 | 7.8% |
| Italian | 232 | 8.4% |
| Korean | 4 | 0.1% |
| Lebanese | 25 | 0.9% |
| Mexican | 123 | 4.4% |
| Northern European | 106 | 3.8% |
| Portuguese | 27 | 1.0% |
| Puerto Rican | 9 | 0.3% |
| Russian | 46 | 1.7% |
| Scottish | 66 | 2.4% |
| South American | 22 | 0.8% |
| Swedish | 128 | 4.6% |
| Swiss | 79 | 2.8% |
| Welsh | 67 | 2.4% | View All 31 Rows |
Immigrants in Sleepy Hollow
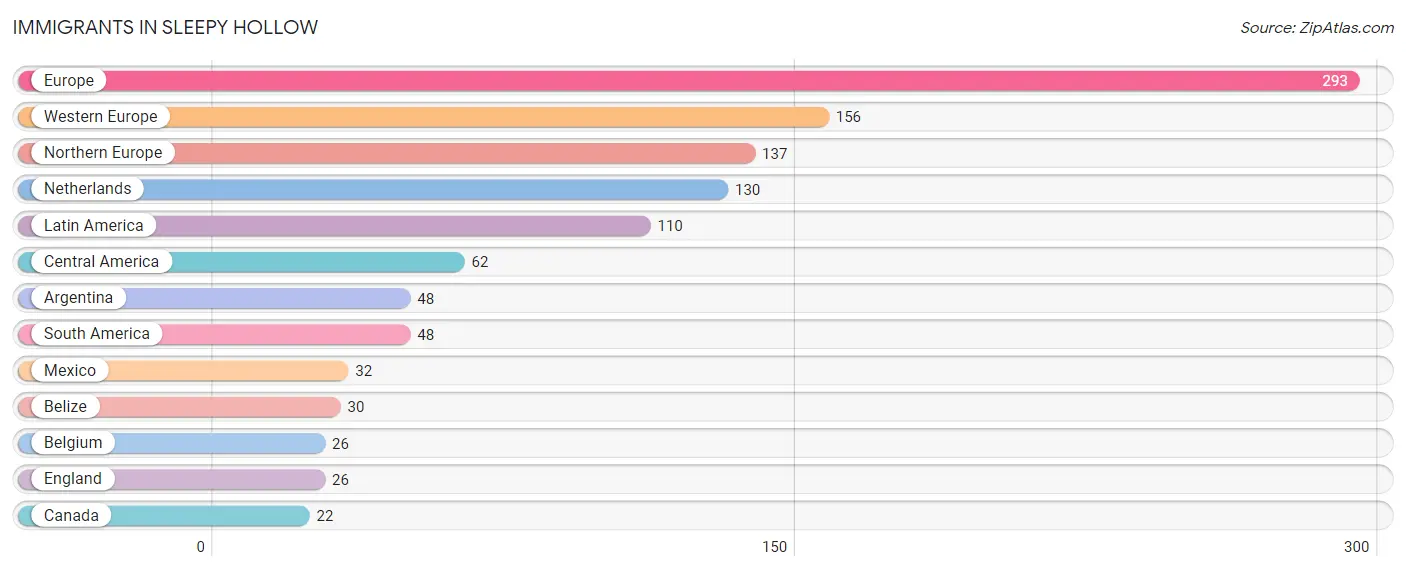
The most numerous immigrant groups reported in Sleepy Hollow came from Europe (293 | 10.5%), Western Europe (156 | 5.6%), Northern Europe (137 | 4.9%), Netherlands (130 | 4.7%), and Latin America (110 | 4.0%), together accounting for 29.7% of all Sleepy Hollow residents.
| Immigration Origin | # Population | % Population |
| Argentina | 48 | 1.7% |
| Belgium | 26 | 0.9% |
| Belize | 30 | 1.1% |
| Canada | 22 | 0.8% |
| Central America | 62 | 2.2% |
| England | 26 | 0.9% |
| Europe | 293 | 10.5% |
| Latin America | 110 | 4.0% |
| Mexico | 32 | 1.1% |
| Netherlands | 130 | 4.7% |
| Northern Europe | 137 | 4.9% |
| South America | 48 | 1.7% |
| Western Europe | 156 | 5.6% | View All 13 Rows |
Sex and Age in Sleepy Hollow
Sex and Age in Sleepy Hollow
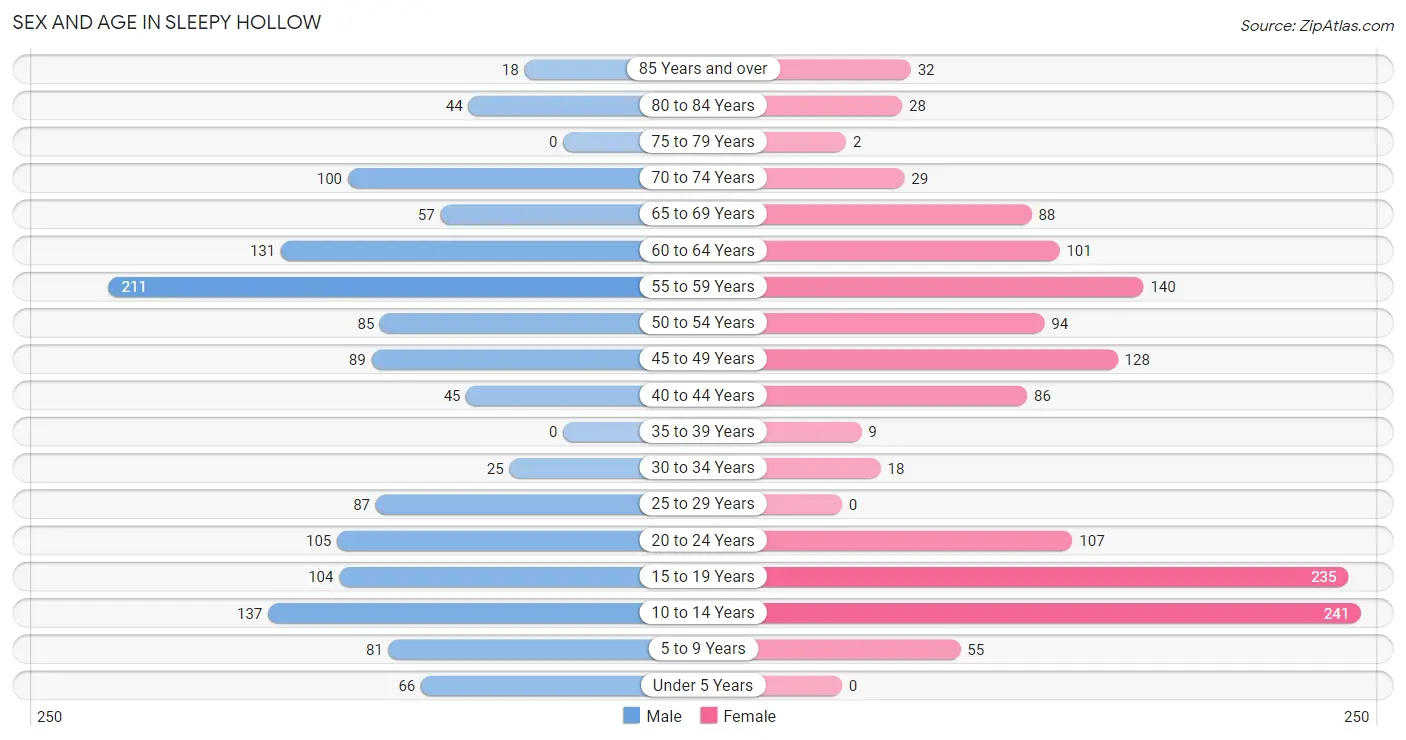
The most populous age groups in Sleepy Hollow are 55 to 59 Years (211 | 15.2%) for men and 10 to 14 Years (241 | 17.3%) for women.
| Age Bracket | Male | Female |
| Under 5 Years | 66 (4.8%) | 0 (0.0%) |
| 5 to 9 Years | 81 (5.9%) | 55 (4.0%) |
| 10 to 14 Years | 137 (9.9%) | 241 (17.3%) |
| 15 to 19 Years | 104 (7.5%) | 235 (16.9%) |
| 20 to 24 Years | 105 (7.6%) | 107 (7.7%) |
| 25 to 29 Years | 87 (6.3%) | 0 (0.0%) |
| 30 to 34 Years | 25 (1.8%) | 18 (1.3%) |
| 35 to 39 Years | 0 (0.0%) | 9 (0.6%) |
| 40 to 44 Years | 45 (3.3%) | 86 (6.2%) |
| 45 to 49 Years | 89 (6.4%) | 128 (9.2%) |
| 50 to 54 Years | 85 (6.1%) | 94 (6.8%) |
| 55 to 59 Years | 211 (15.2%) | 140 (10.1%) |
| 60 to 64 Years | 131 (9.5%) | 101 (7.2%) |
| 65 to 69 Years | 57 (4.1%) | 88 (6.3%) |
| 70 to 74 Years | 100 (7.2%) | 29 (2.1%) |
| 75 to 79 Years | 0 (0.0%) | 2 (0.1%) |
| 80 to 84 Years | 44 (3.2%) | 28 (2.0%) |
| 85 Years and over | 18 (1.3%) | 32 (2.3%) |
| Total | 1,385 (100.0%) | 1,393 (100.0%) |
Families and Households in Sleepy Hollow
Median Family Size in Sleepy Hollow
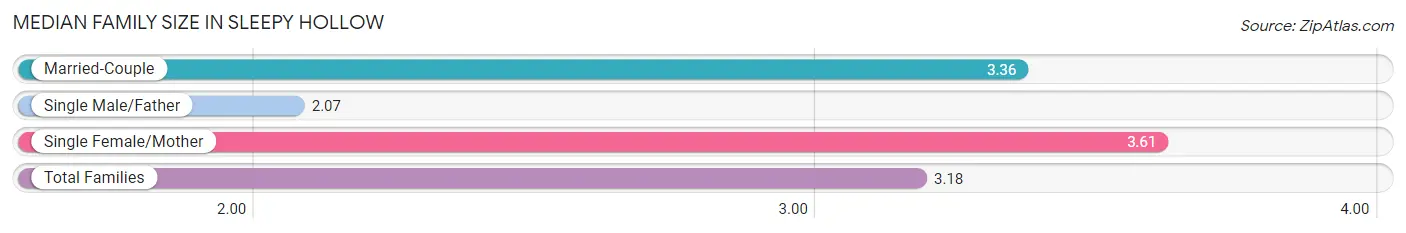
The median family size in Sleepy Hollow is 3.18 persons per family, with single female/mother families (94 | 12.1%) accounting for the largest median family size of 3.61 persons per family. On the other hand, single male/father families (124 | 16.0%) represent the smallest median family size with 2.07 persons per family.
| Family Type | # Families | Family Size |
| Married-Couple | 556 (71.8%) | 3.36 |
| Single Male/Father | 124 (16.0%) | 2.07 |
| Single Female/Mother | 94 (12.1%) | 3.61 |
| Total Families | 774 (100.0%) | 3.18 |
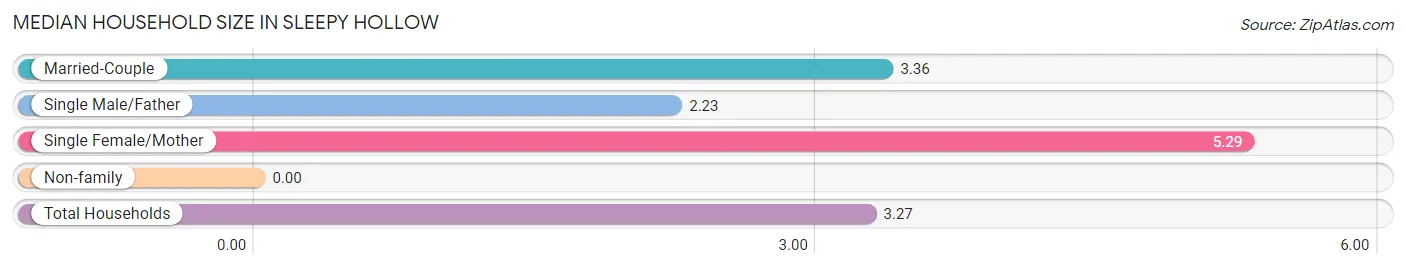
Median Household Size in Sleepy Hollow
| Household Type | # Households | Household Size |
| Married-Couple | 556 (67.7%) | 3.36 |
| Single Male/Father | 124 (15.1%) | 2.23 |
| Single Female/Mother | 94 (11.5%) | 5.29 |
| Non-family | 47 (5.7%) | - |
| Total Households | 821 (100.0%) | 3.27 |
Household Size by Marriage Status in Sleepy Hollow
Out of a total of 821 households in Sleepy Hollow, 774 (94.3%) are family households, while 47 (5.7%) are nonfamily households. The most numerous type of family households are 2-person households, comprising 243, and the most common type of nonfamily households are 1-person households, comprising 47.
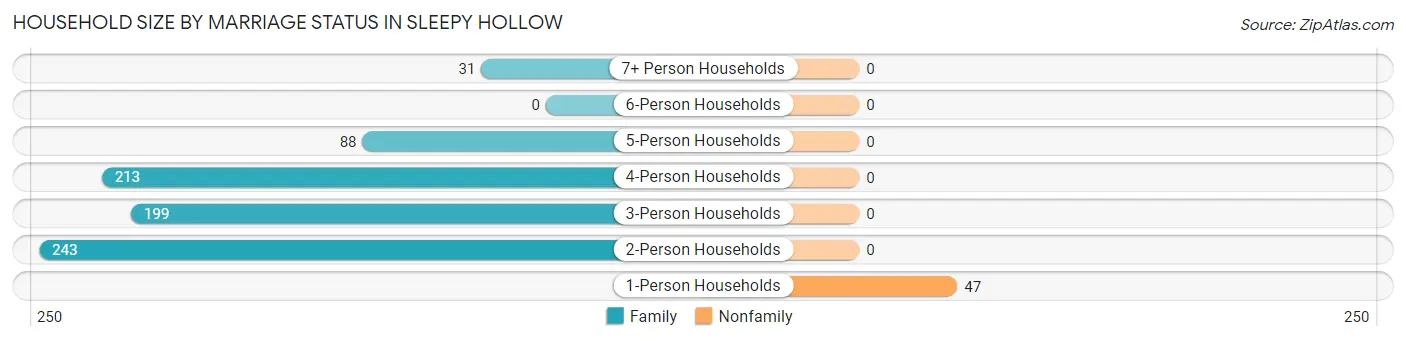
| Household Size | Family Households | Nonfamily Households |
| 1-Person Households | - | 47 (5.7%) |
| 2-Person Households | 243 (29.6%) | 0 (0.0%) |
| 3-Person Households | 199 (24.2%) | 0 (0.0%) |
| 4-Person Households | 213 (25.9%) | 0 (0.0%) |
| 5-Person Households | 88 (10.7%) | 0 (0.0%) |
| 6-Person Households | 0 (0.0%) | 0 (0.0%) |
| 7+ Person Households | 31 (3.8%) | 0 (0.0%) |
| Total | 774 (94.3%) | 47 (5.7%) |
Female Fertility in Sleepy Hollow
Fertility by Age in Sleepy Hollow
Average fertility rate in Sleepy Hollow is 80.0 births per 1,000 women. Women in the age bracket of 20 to 34 years have the highest fertility rate with 272.0 births per 1,000 women. Women in the age bracket of 20 to 34 years acount for 68.0% of all women with births.
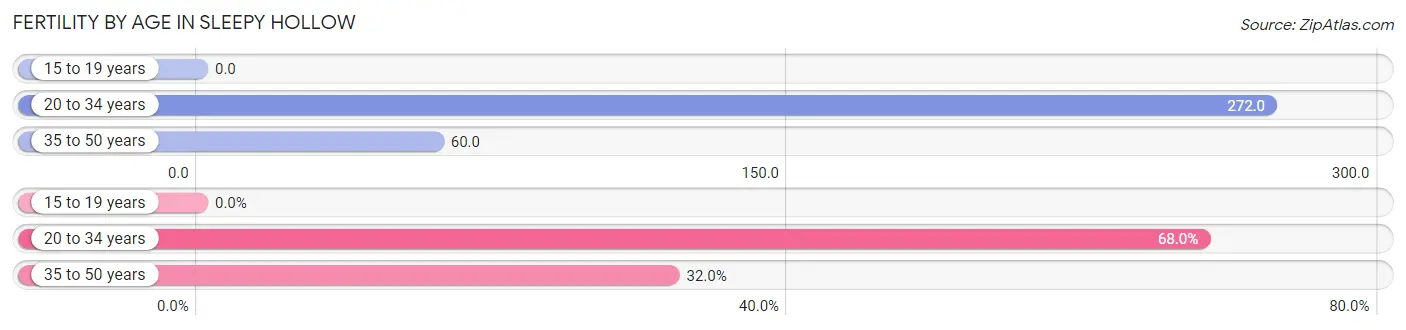
| Age Bracket | Women with Births | Births / 1,000 Women |
| 15 to 19 years | 0 (0.0%) | 0.0 |
| 20 to 34 years | 34 (68.0%) | 272.0 |
| 35 to 50 years | 16 (32.0%) | 60.0 |
| Total | 50 (100.0%) | 80.0 |
Fertility by Age by Marriage Status in Sleepy Hollow
32.0% of women with births (50) in Sleepy Hollow are married. The highest percentage of unmarried women with births falls into 20 to 34 years age bracket with 100.0% of them unmarried at the time of birth, while the lowest percentage of unmarried women with births belong to 35 to 50 years age bracket with 0.0% of them unmarried.
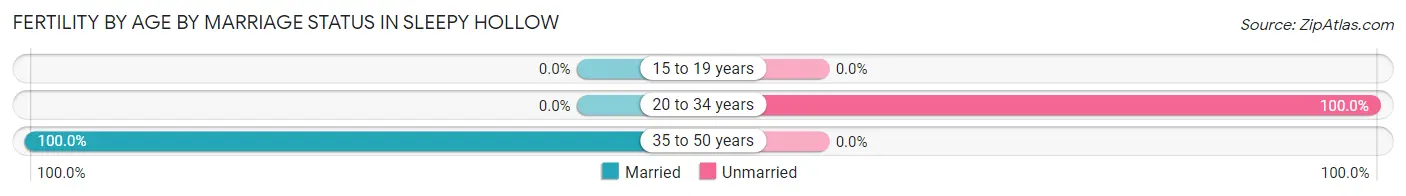
| Age Bracket | Married | Unmarried |
| 15 to 19 years | 0 (0.0%) | 0 (0.0%) |
| 20 to 34 years | 0 (0.0%) | 34 (100.0%) |
| 35 to 50 years | 16 (100.0%) | 0 (0.0%) |
| Total | 16 (32.0%) | 34 (68.0%) |
Fertility by Education in Sleepy Hollow
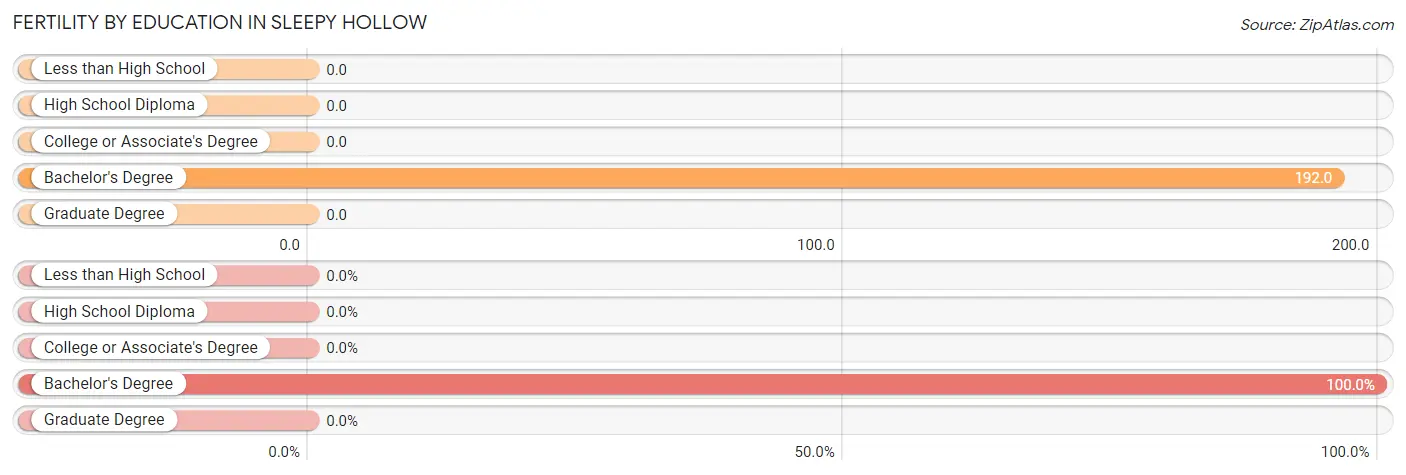
| Educational Attainment | Women with Births | Births / 1,000 Women |
| Less than High School | 0 (0.0%) | 0.0 |
| High School Diploma | 0 (0.0%) | 0.0 |
| College or Associate's Degree | 0 (0.0%) | 0.0 |
| Bachelor's Degree | 50 (100.0%) | 192.0 |
| Graduate Degree | 0 (0.0%) | 0.0 |
| Total | 50 (100.0%) | 80.0 |
Fertility by Education by Marriage Status in Sleepy Hollow
68.0% of women with births in Sleepy Hollow are unmarried. Women with the educational attainment of bachelor's degree are most likely to be married with 32.0% of them married at childbirth, while women with the educational attainment of bachelor's degree are least likely to be married with 68.0% of them unmarried at childbirth.
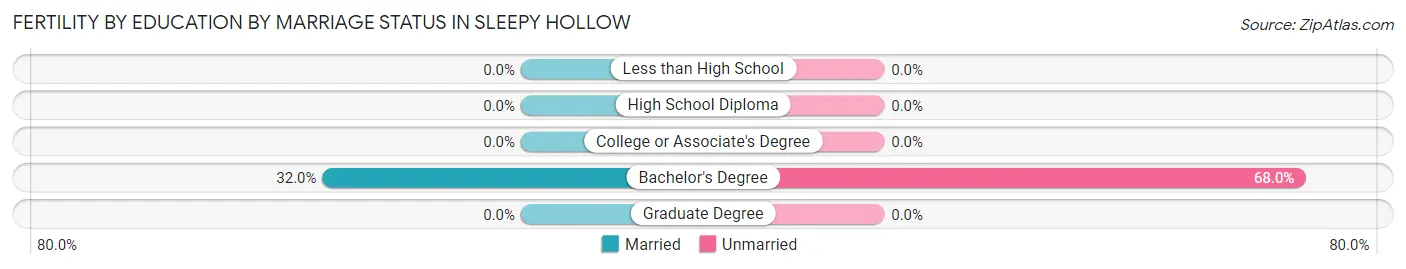
| Educational Attainment | Married | Unmarried |
| Less than High School | 0 (0.0%) | 0 (0.0%) |
| High School Diploma | 0 (0.0%) | 0 (0.0%) |
| College or Associate's Degree | 0 (0.0%) | 0 (0.0%) |
| Bachelor's Degree | 16 (32.0%) | 34 (68.0%) |
| Graduate Degree | 0 (0.0%) | 0 (0.0%) |
| Total | 16 (32.0%) | 34 (68.0%) |
Employment Characteristics in Sleepy Hollow
Employment by Class of Employer in Sleepy Hollow
Among the 1,172 employed individuals in Sleepy Hollow, private company employees (555 | 47.3%), self-employed (incorporated) (281 | 24.0%), and self-employed (not incorporated) (118 | 10.1%) make up the most common classes of employment.
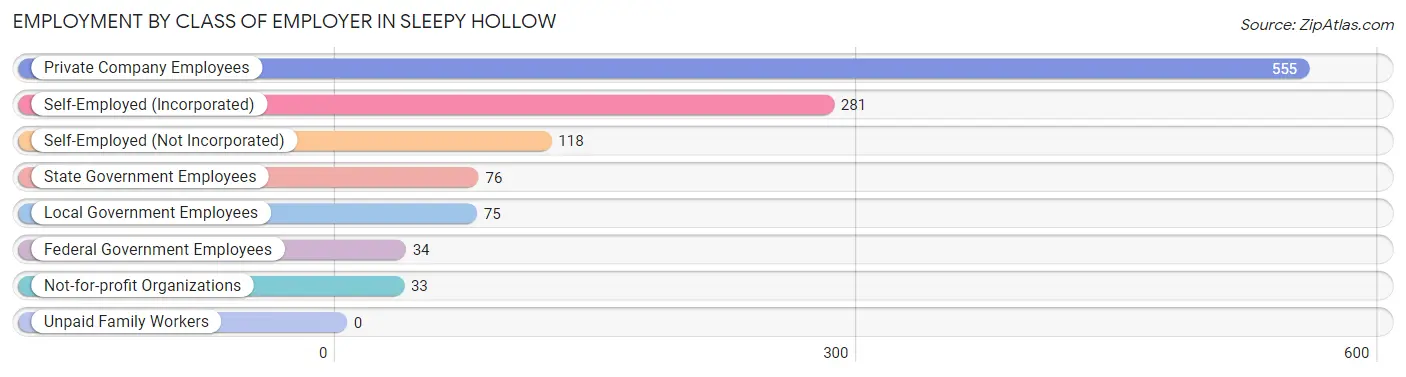
| Employer Class | # Employees | % Employees |
| Private Company Employees | 555 | 47.3% |
| Self-Employed (Incorporated) | 281 | 24.0% |
| Self-Employed (Not Incorporated) | 118 | 10.1% |
| Not-for-profit Organizations | 33 | 2.8% |
| Local Government Employees | 75 | 6.4% |
| State Government Employees | 76 | 6.5% |
| Federal Government Employees | 34 | 2.9% |
| Unpaid Family Workers | 0 | 0.0% |
| Total | 1,172 | 100.0% |
Employment Status by Age in Sleepy Hollow
According to the labor force statistics for Sleepy Hollow, out of the total population over 16 years of age (2,095), 64.3% or 1,347 individuals are in the labor force, with 8.4% or 113 of them unemployed. The age group with the highest labor force participation rate is 20 to 24 years, with 100.0% or 212 individuals in the labor force. Within the labor force, the 45 to 54 years age range has the highest percentage of unemployed individuals, with 15.8% or 52 of them being unemployed.
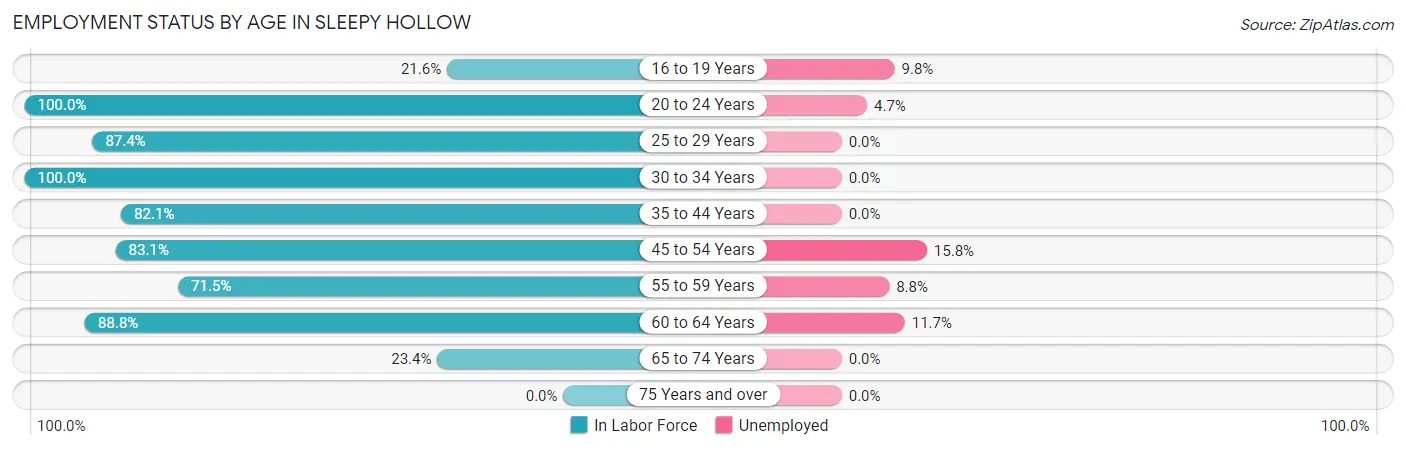
| Age Bracket | In Labor Force | Unemployed |
| 16 to 19 Years | 51 (21.6%) | 5 (9.8%) |
| 20 to 24 Years | 212 (100.0%) | 10 (4.7%) |
| 25 to 29 Years | 76 (87.4%) | 0 (0.0%) |
| 30 to 34 Years | 43 (100.0%) | 0 (0.0%) |
| 35 to 44 Years | 115 (82.1%) | 0 (0.0%) |
| 45 to 54 Years | 329 (83.1%) | 52 (15.8%) |
| 55 to 59 Years | 251 (71.5%) | 22 (8.8%) |
| 60 to 64 Years | 206 (88.8%) | 24 (11.7%) |
| 65 to 74 Years | 64 (23.4%) | 0 (0.0%) |
| 75 Years and over | 0 (0.0%) | 0 (0.0%) |
| Total | 1,347 (64.3%) | 113 (8.4%) |
Employment Status by Educational Attainment in Sleepy Hollow
According to labor force statistics for Sleepy Hollow, 81.7% of individuals (1,020) out of the total population between 25 and 64 years of age (1,249) are in the labor force, with 9.6% or 98 of them being unemployed. The group with the highest labor force participation rate are those with the educational attainment of high school diploma, with 100.0% or 45 individuals in the labor force. Within the labor force, individuals with college / associate degree education have the highest percentage of unemployment, with 43.1% or 22 of them being unemployed.
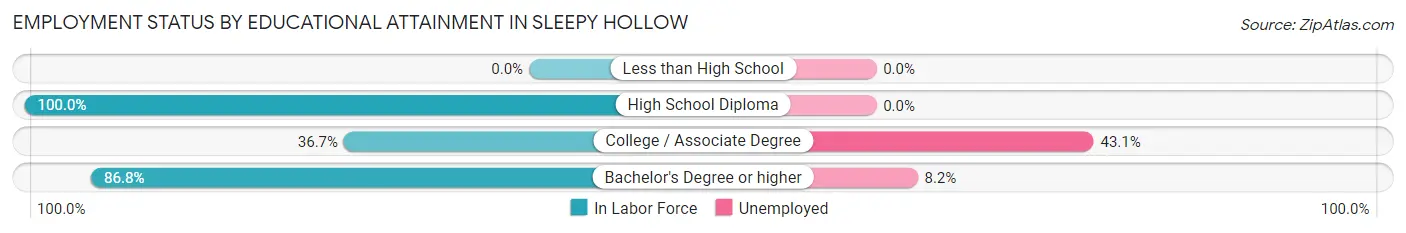
| Educational Attainment | In Labor Force | Unemployed |
| Less than High School | 0 (0.0%) | 0 (0.0%) |
| High School Diploma | 45 (100.0%) | 0 (0.0%) |
| College / Associate Degree | 51 (36.7%) | 60 (43.1%) |
| Bachelor's Degree or higher | 924 (86.8%) | 87 (8.2%) |
| Total | 1,020 (81.7%) | 120 (9.6%) |
Employment Occupations by Sex in Sleepy Hollow
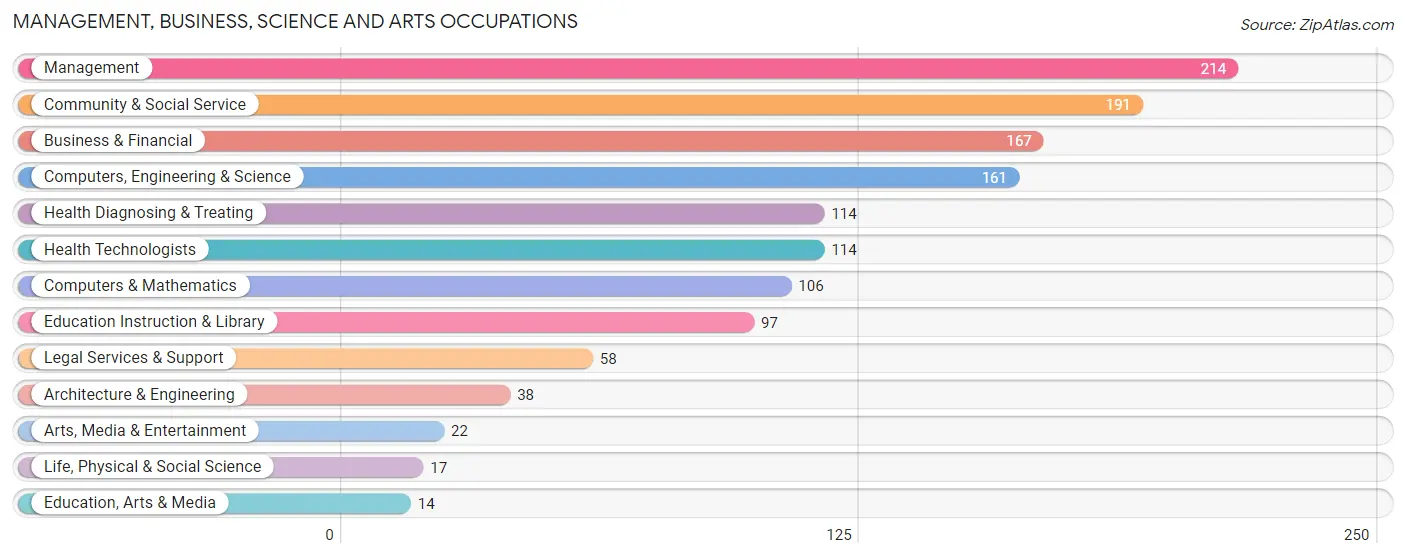
Management, Business, Science and Arts Occupations
The most common Management, Business, Science and Arts occupations in Sleepy Hollow are Management (214 | 17.3%), Community & Social Service (191 | 15.5%), Business & Financial (167 | 13.5%), Computers, Engineering & Science (161 | 13.1%), and Health Diagnosing & Treating (114 | 9.2%).
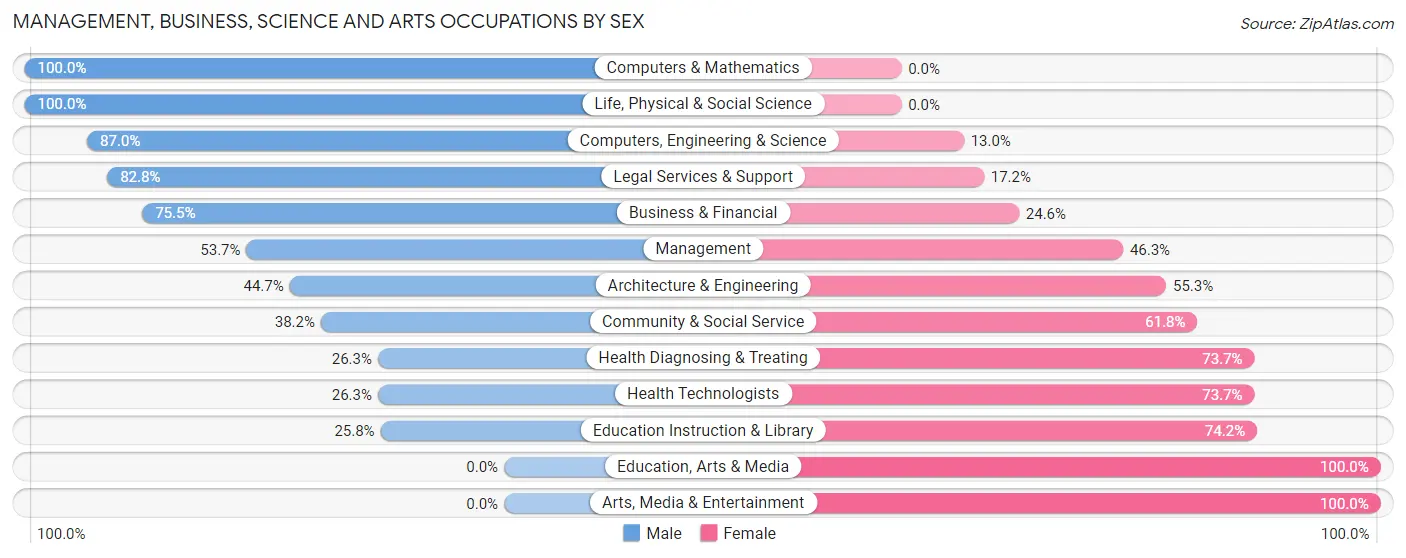
Management, Business, Science and Arts Occupations by Sex
Within the Management, Business, Science and Arts occupations in Sleepy Hollow, the most male-oriented occupations are Computers & Mathematics (100.0%), Life, Physical & Social Science (100.0%), and Computers, Engineering & Science (87.0%), while the most female-oriented occupations are Education, Arts & Media (100.0%), Arts, Media & Entertainment (100.0%), and Education Instruction & Library (74.2%).
| Occupation | Male | Female |
| Management | 115 (53.7%) | 99 (46.3%) |
| Business & Financial | 126 (75.4%) | 41 (24.5%) |
| Computers, Engineering & Science | 140 (87.0%) | 21 (13.0%) |
| Computers & Mathematics | 106 (100.0%) | 0 (0.0%) |
| Architecture & Engineering | 17 (44.7%) | 21 (55.3%) |
| Life, Physical & Social Science | 17 (100.0%) | 0 (0.0%) |
| Community & Social Service | 73 (38.2%) | 118 (61.8%) |
| Education, Arts & Media | 0 (0.0%) | 14 (100.0%) |
| Legal Services & Support | 48 (82.8%) | 10 (17.2%) |
| Education Instruction & Library | 25 (25.8%) | 72 (74.2%) |
| Arts, Media & Entertainment | 0 (0.0%) | 22 (100.0%) |
| Health Diagnosing & Treating | 30 (26.3%) | 84 (73.7%) |
| Health Technologists | 30 (26.3%) | 84 (73.7%) |
| Total (Category) | 484 (57.1%) | 363 (42.9%) |
| Total (Overall) | 677 (54.9%) | 557 (45.1%) |
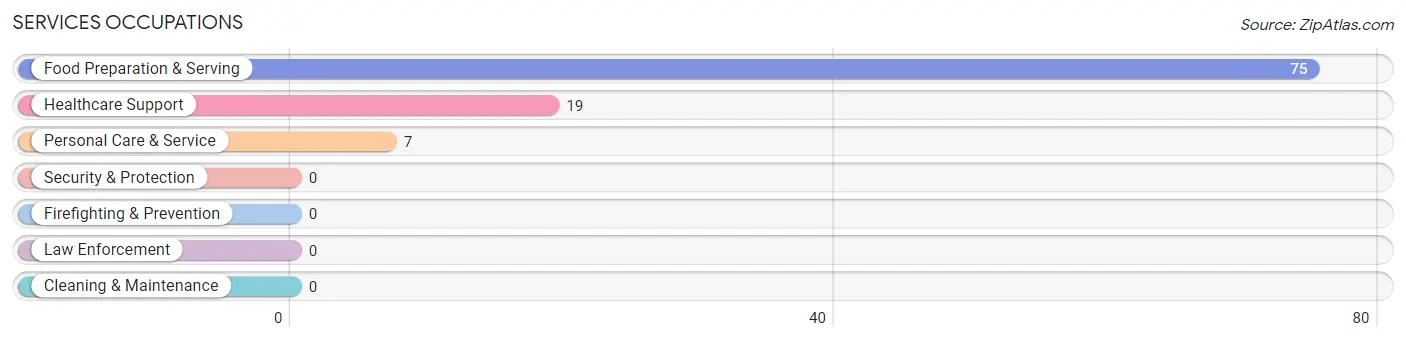
Services Occupations
The most common Services occupations in Sleepy Hollow are Food Preparation & Serving (75 | 6.1%), Healthcare Support (19 | 1.5%), and Personal Care & Service (7 | 0.6%).
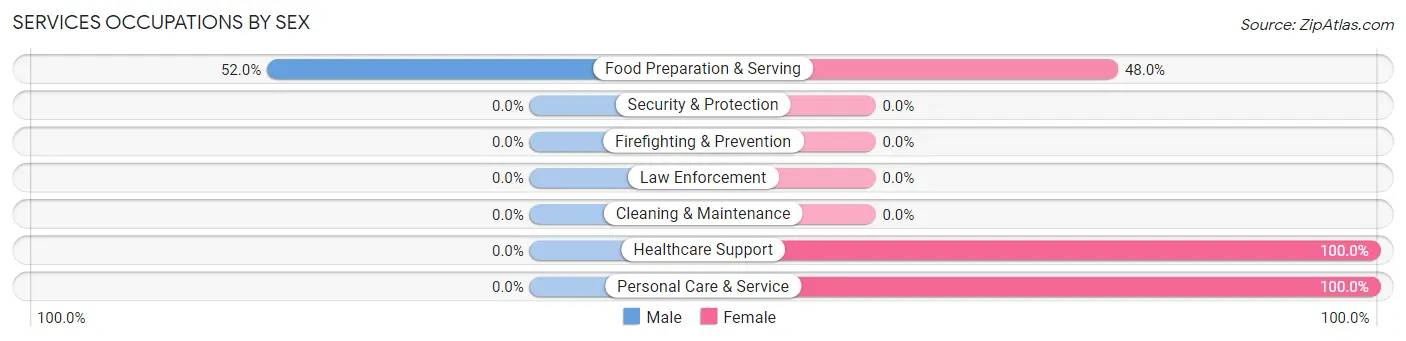
Services Occupations by Sex
| Occupation | Male | Female |
| Healthcare Support | 0 (0.0%) | 19 (100.0%) |
| Security & Protection | 0 (0.0%) | 0 (0.0%) |
| Firefighting & Prevention | 0 (0.0%) | 0 (0.0%) |
| Law Enforcement | 0 (0.0%) | 0 (0.0%) |
| Food Preparation & Serving | 39 (52.0%) | 36 (48.0%) |
| Cleaning & Maintenance | 0 (0.0%) | 0 (0.0%) |
| Personal Care & Service | 0 (0.0%) | 7 (100.0%) |
| Total (Category) | 39 (38.6%) | 62 (61.4%) |
| Total (Overall) | 677 (54.9%) | 557 (45.1%) |
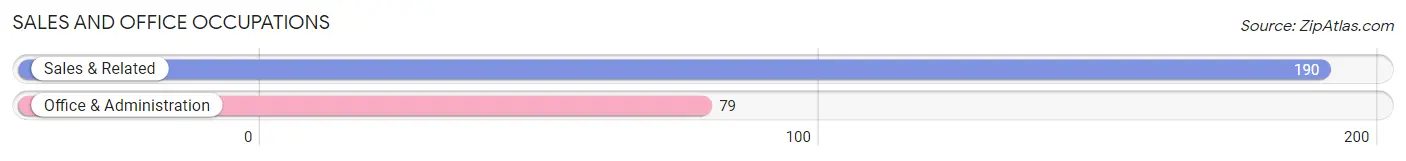
Sales and Office Occupations
The most common Sales and Office occupations in Sleepy Hollow are Sales & Related (190 | 15.4%), and Office & Administration (79 | 6.4%).
Sales and Office Occupations by Sex
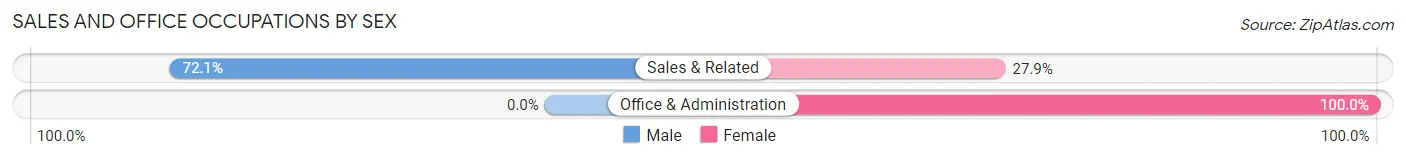
| Occupation | Male | Female |
| Sales & Related | 137 (72.1%) | 53 (27.9%) |
| Office & Administration | 0 (0.0%) | 79 (100.0%) |
| Total (Category) | 137 (50.9%) | 132 (49.1%) |
| Total (Overall) | 677 (54.9%) | 557 (45.1%) |
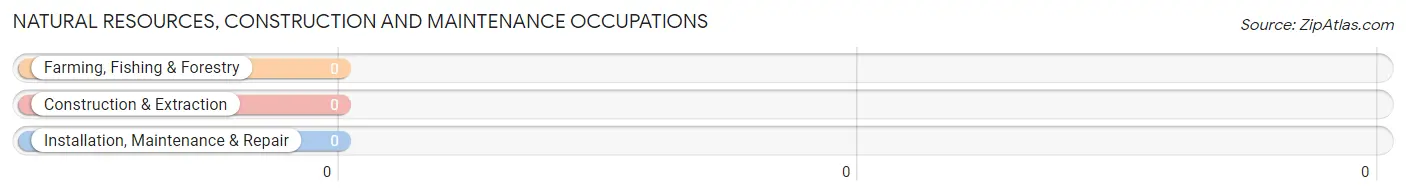
Natural Resources, Construction and Maintenance Occupations
Natural Resources, Construction and Maintenance Occupations by Sex
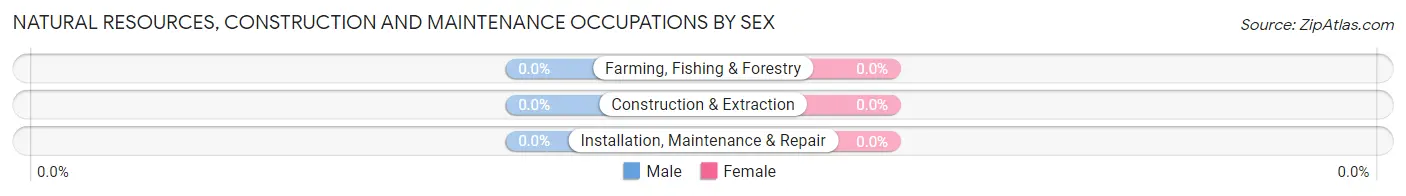
| Occupation | Male | Female |
| Farming, Fishing & Forestry | 0 (0.0%) | 0 (0.0%) |
| Construction & Extraction | 0 (0.0%) | 0 (0.0%) |
| Installation, Maintenance & Repair | 0 (0.0%) | 0 (0.0%) |
| Total (Category) | 0 (0.0%) | 0 (0.0%) |
| Total (Overall) | 677 (54.9%) | 557 (45.1%) |
Production, Transportation and Moving Occupations
The most common Production, Transportation and Moving occupations in Sleepy Hollow are , and Transportation (17 | 1.4%).
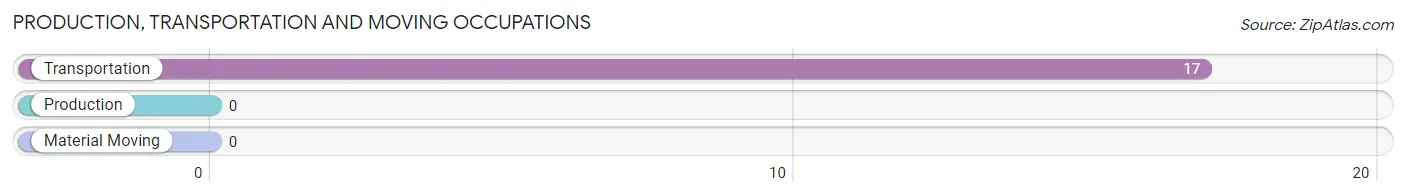
Production, Transportation and Moving Occupations by Sex
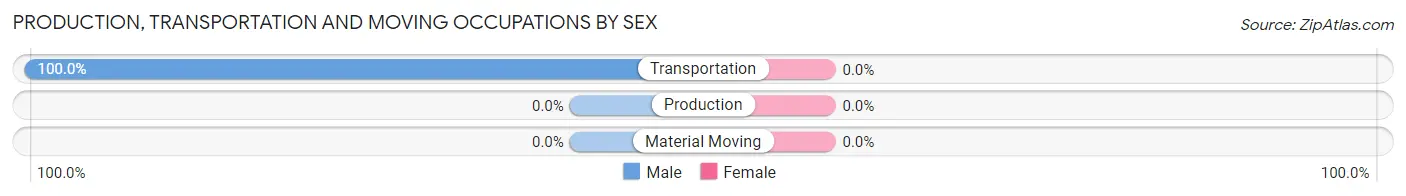
| Occupation | Male | Female |
| Production | 0 (0.0%) | 0 (0.0%) |
| Transportation | 17 (100.0%) | 0 (0.0%) |
| Material Moving | 0 (0.0%) | 0 (0.0%) |
| Total (Category) | 17 (100.0%) | 0 (0.0%) |
| Total (Overall) | 677 (54.9%) | 557 (45.1%) |
Employment Industries by Sex in Sleepy Hollow
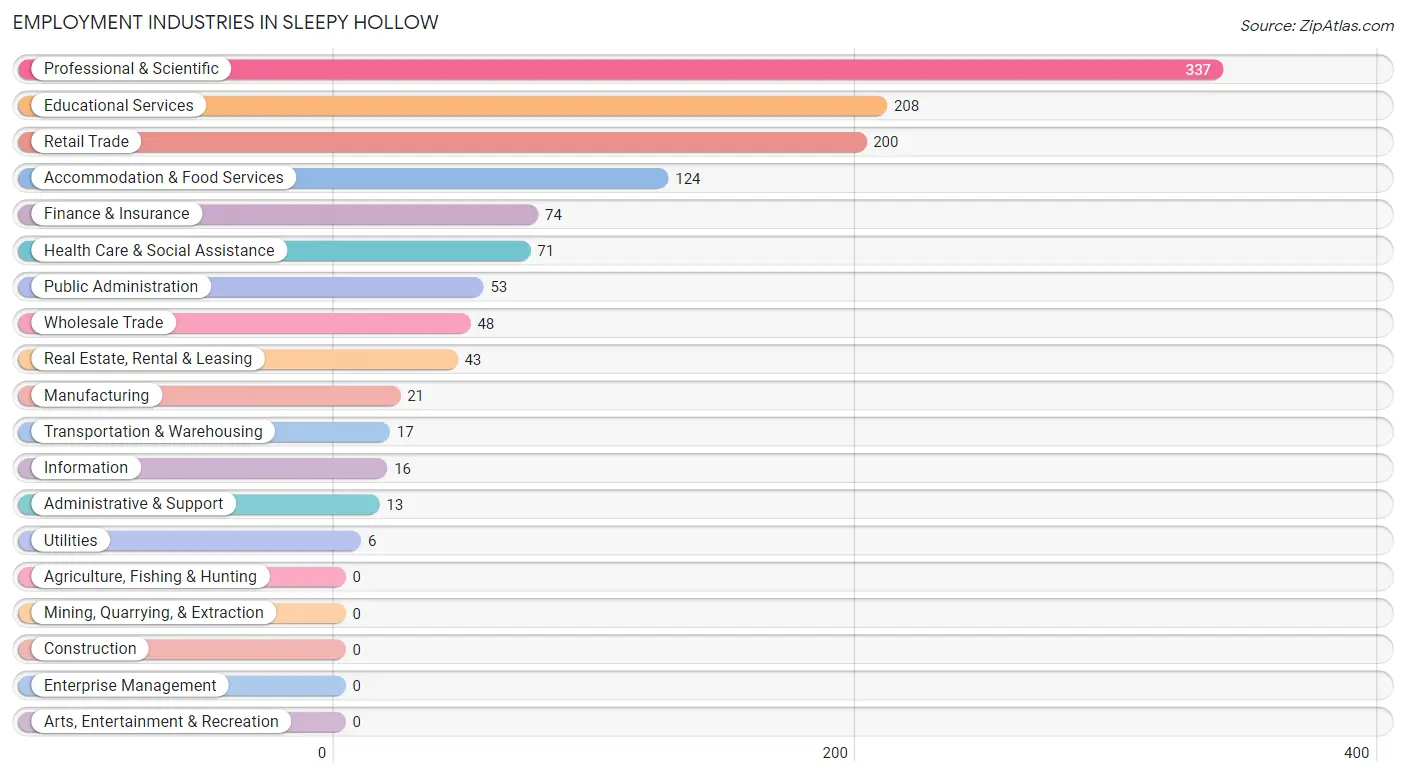
Employment Industries in Sleepy Hollow
The major employment industries in Sleepy Hollow include Professional & Scientific (337 | 27.3%), Educational Services (208 | 16.9%), Retail Trade (200 | 16.2%), Accommodation & Food Services (124 | 10.1%), and Finance & Insurance (74 | 6.0%).
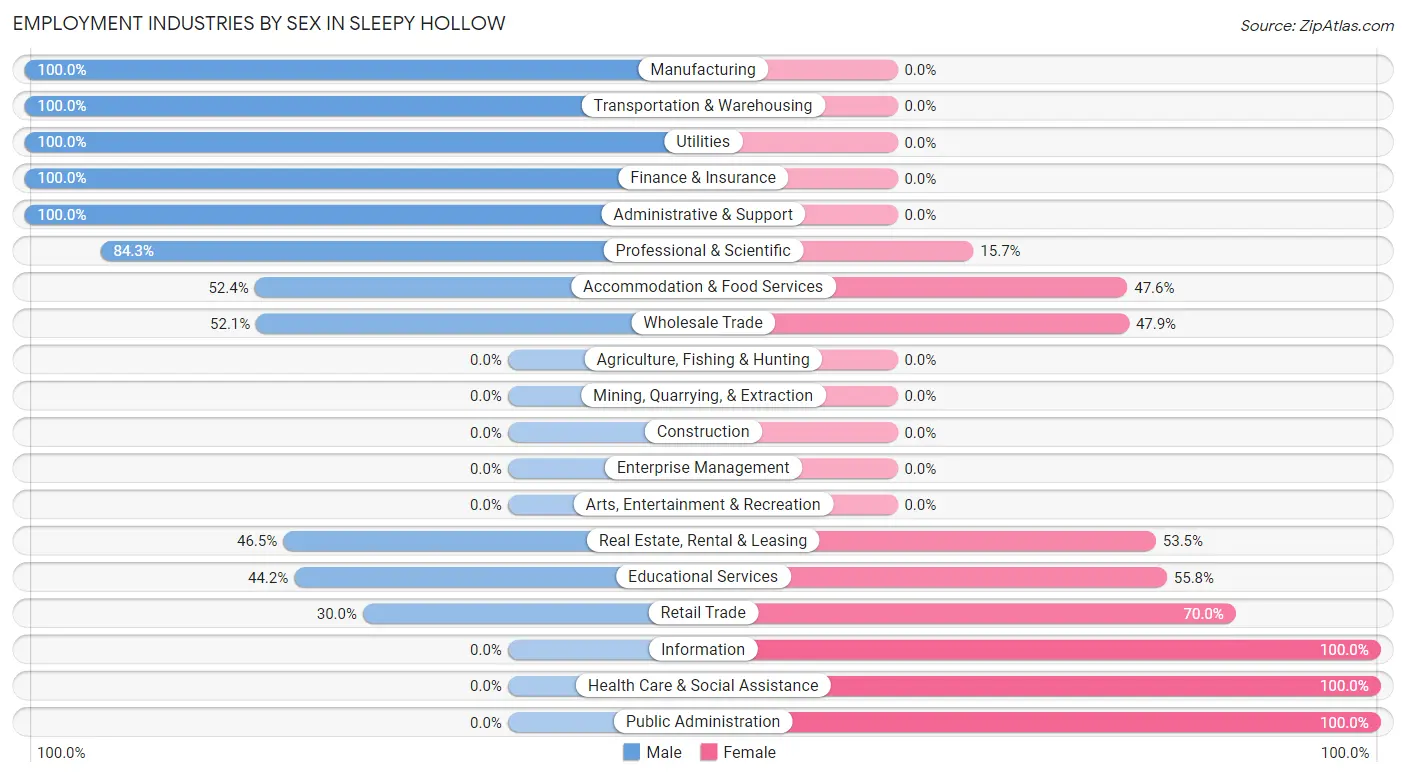
Employment Industries by Sex in Sleepy Hollow
The Sleepy Hollow industries that see more men than women are Manufacturing (100.0%), Transportation & Warehousing (100.0%), and Utilities (100.0%), whereas the industries that tend to have a higher number of women are Information (100.0%), Health Care & Social Assistance (100.0%), and Public Administration (100.0%).
| Industry | Male | Female |
| Agriculture, Fishing & Hunting | 0 (0.0%) | 0 (0.0%) |
| Mining, Quarrying, & Extraction | 0 (0.0%) | 0 (0.0%) |
| Construction | 0 (0.0%) | 0 (0.0%) |
| Manufacturing | 21 (100.0%) | 0 (0.0%) |
| Wholesale Trade | 25 (52.1%) | 23 (47.9%) |
| Retail Trade | 60 (30.0%) | 140 (70.0%) |
| Transportation & Warehousing | 17 (100.0%) | 0 (0.0%) |
| Utilities | 6 (100.0%) | 0 (0.0%) |
| Information | 0 (0.0%) | 16 (100.0%) |
| Finance & Insurance | 74 (100.0%) | 0 (0.0%) |
| Real Estate, Rental & Leasing | 20 (46.5%) | 23 (53.5%) |
| Professional & Scientific | 284 (84.3%) | 53 (15.7%) |
| Enterprise Management | 0 (0.0%) | 0 (0.0%) |
| Administrative & Support | 13 (100.0%) | 0 (0.0%) |
| Educational Services | 92 (44.2%) | 116 (55.8%) |
| Health Care & Social Assistance | 0 (0.0%) | 71 (100.0%) |
| Arts, Entertainment & Recreation | 0 (0.0%) | 0 (0.0%) |
| Accommodation & Food Services | 65 (52.4%) | 59 (47.6%) |
| Public Administration | 0 (0.0%) | 53 (100.0%) |
| Total | 677 (54.9%) | 557 (45.1%) |
Education in Sleepy Hollow
School Enrollment in Sleepy Hollow
The most common levels of schooling among the 1,101 students in Sleepy Hollow are college / undergraduate (388 | 35.2%), middle school (324 | 29.4%), and high school (143 | 13.0%).
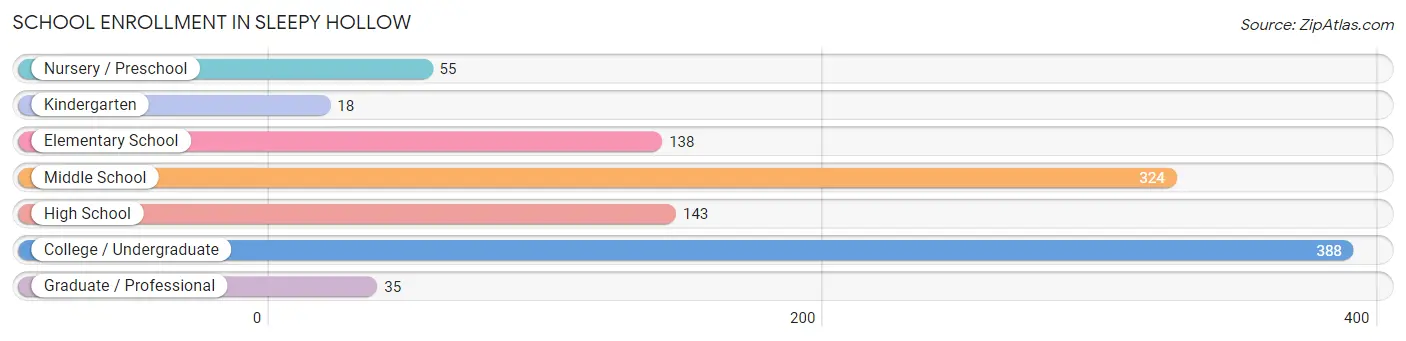
| School Level | # Students | % Students |
| Nursery / Preschool | 55 | 5.0% |
| Kindergarten | 18 | 1.6% |
| Elementary School | 138 | 12.5% |
| Middle School | 324 | 29.4% |
| High School | 143 | 13.0% |
| College / Undergraduate | 388 | 35.2% |
| Graduate / Professional | 35 | 3.2% |
| Total | 1,101 | 100.0% |
School Enrollment by Age by Funding Source in Sleepy Hollow
Out of a total of 1,101 students who are enrolled in schools in Sleepy Hollow, 235 (21.3%) attend a private institution, while the remaining 866 (78.7%) are enrolled in public schools. The age group of 3 to 4 year olds has the highest likelihood of being enrolled in private schools, with 21 (100.0% in the age bracket) enrolled. Conversely, the age group of 25 to 34 year olds has the lowest likelihood of being enrolled in a private school, with 64 (100.0% in the age bracket) attending a public institution.
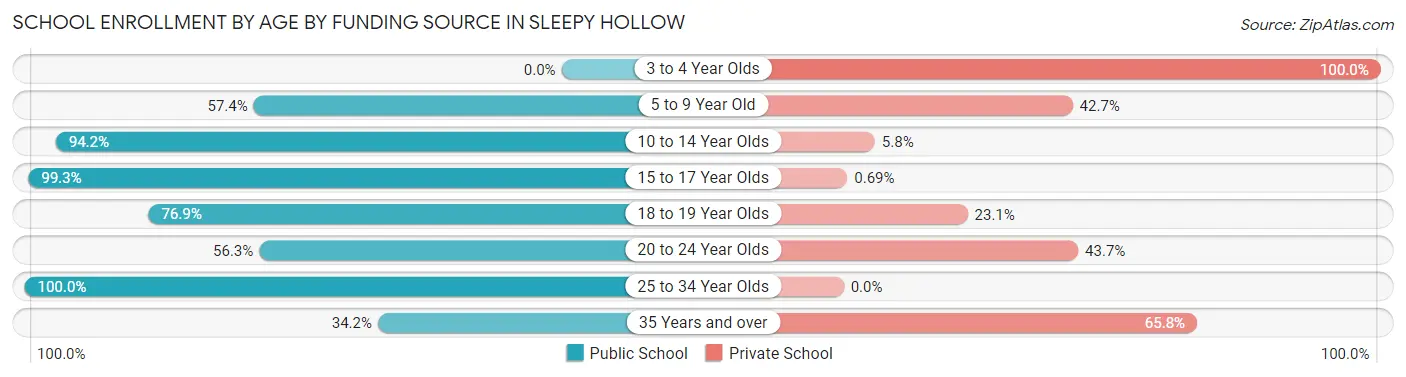
| Age Bracket | Public School | Private School |
| 3 to 4 Year Olds | 0 (0.0%) | 21 (100.0%) |
| 5 to 9 Year Old | 78 (57.4%) | 58 (42.6%) |
| 10 to 14 Year Olds | 356 (94.2%) | 22 (5.8%) |
| 15 to 17 Year Olds | 143 (99.3%) | 1 (0.7%) |
| 18 to 19 Year Olds | 150 (76.9%) | 45 (23.1%) |
| 20 to 24 Year Olds | 49 (56.3%) | 38 (43.7%) |
| 25 to 34 Year Olds | 64 (100.0%) | 0 (0.0%) |
| 35 Years and over | 26 (34.2%) | 50 (65.8%) |
| Total | 866 (78.7%) | 235 (21.3%) |
Educational Attainment by Field of Study in Sleepy Hollow
Business (373 | 25.2%), science & technology (176 | 11.9%), visual & performing arts (140 | 9.5%), communications (137 | 9.3%), and psychology (132 | 8.9%) are the most common fields of study among 1,479 individuals in Sleepy Hollow who have obtained a bachelor's degree or higher.
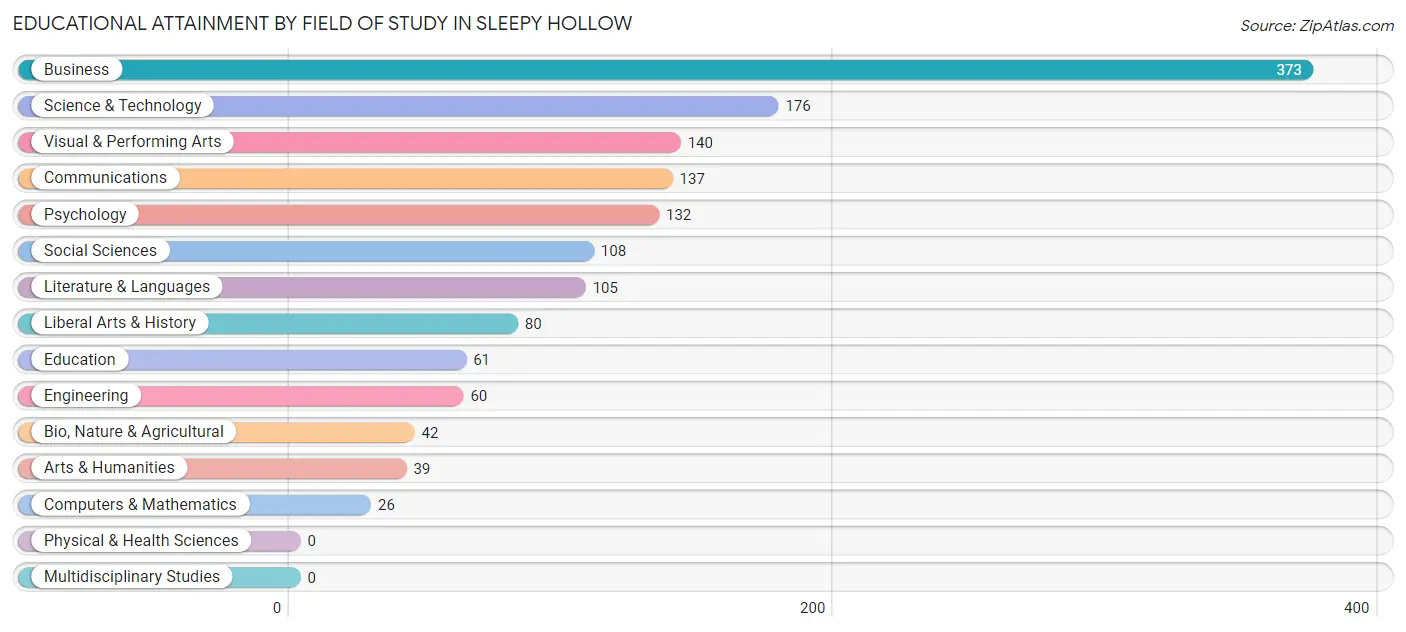
| Field of Study | # Graduates | % Graduates |
| Computers & Mathematics | 26 | 1.8% |
| Bio, Nature & Agricultural | 42 | 2.8% |
| Physical & Health Sciences | 0 | 0.0% |
| Psychology | 132 | 8.9% |
| Social Sciences | 108 | 7.3% |
| Engineering | 60 | 4.1% |
| Multidisciplinary Studies | 0 | 0.0% |
| Science & Technology | 176 | 11.9% |
| Business | 373 | 25.2% |
| Education | 61 | 4.1% |
| Literature & Languages | 105 | 7.1% |
| Liberal Arts & History | 80 | 5.4% |
| Visual & Performing Arts | 140 | 9.5% |
| Communications | 137 | 9.3% |
| Arts & Humanities | 39 | 2.6% |
| Total | 1,479 | 100.0% |
Transportation & Commute in Sleepy Hollow
Vehicle Availability by Sex in Sleepy Hollow
The most prevalent vehicle ownership categories in Sleepy Hollow are males with 2 vehicles (218, accounting for 33.8%) and females with 2 vehicles (189, making up 44.0%).
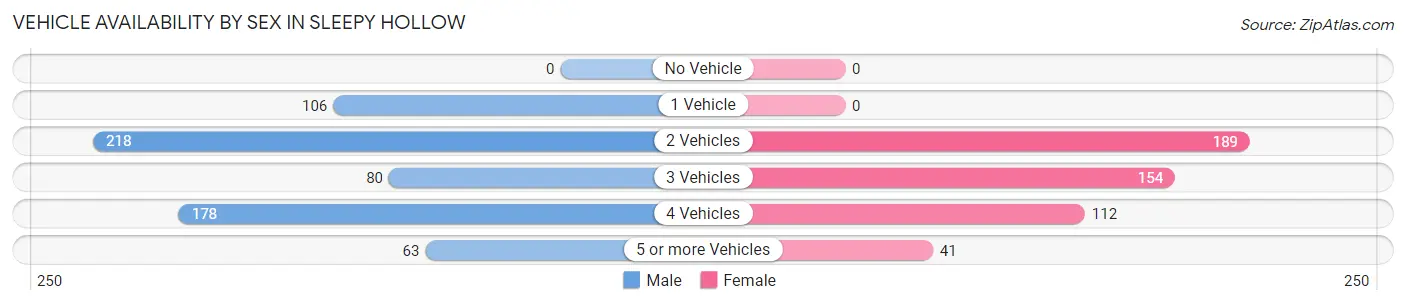
| Vehicles Available | Male | Female |
| No Vehicle | 0 (0.0%) | 0 (0.0%) |
| 1 Vehicle | 106 (16.4%) | 0 (0.0%) |
| 2 Vehicles | 218 (33.8%) | 189 (38.1%) |
| 3 Vehicles | 80 (12.4%) | 154 (31.0%) |
| 4 Vehicles | 178 (27.6%) | 112 (22.6%) |
| 5 or more Vehicles | 63 (9.8%) | 41 (8.3%) |
| Total | 645 (100.0%) | 496 (100.0%) |
Commute Time in Sleepy Hollow
The most frequently occuring commute durations in Sleepy Hollow are 60 to 89 minutes (169 commuters, 20.8%), 30 to 34 minutes (119 commuters, 14.7%), and 20 to 24 minutes (117 commuters, 14.4%).
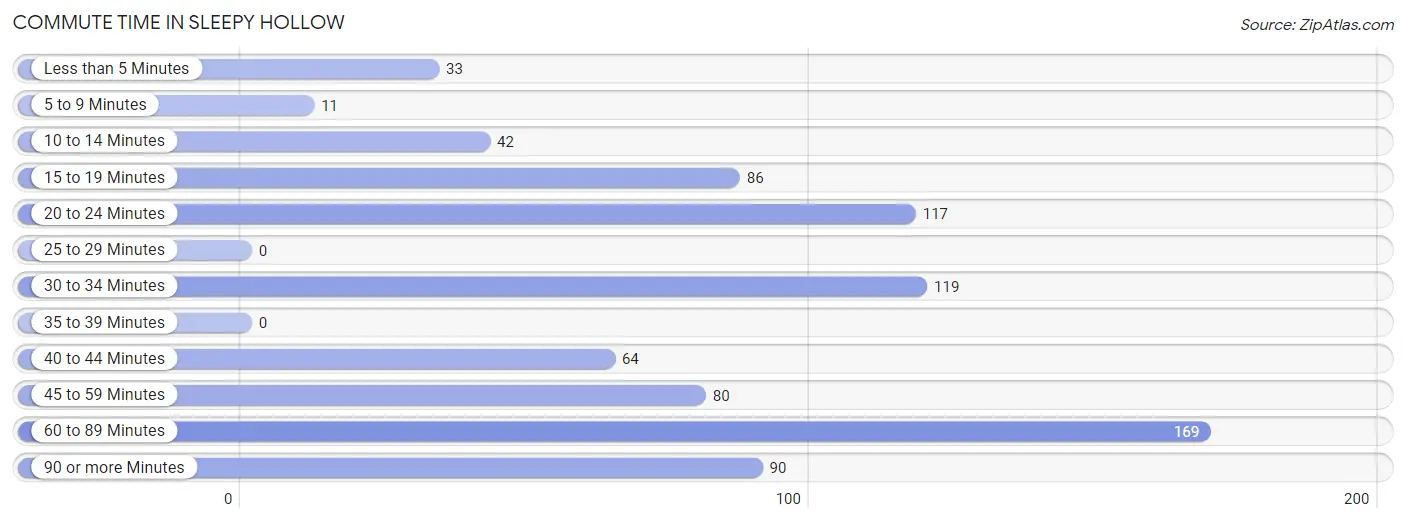
| Commute Time | # Commuters | % Commuters |
| Less than 5 Minutes | 33 | 4.1% |
| 5 to 9 Minutes | 11 | 1.4% |
| 10 to 14 Minutes | 42 | 5.2% |
| 15 to 19 Minutes | 86 | 10.6% |
| 20 to 24 Minutes | 117 | 14.4% |
| 25 to 29 Minutes | 0 | 0.0% |
| 30 to 34 Minutes | 119 | 14.7% |
| 35 to 39 Minutes | 0 | 0.0% |
| 40 to 44 Minutes | 64 | 7.9% |
| 45 to 59 Minutes | 80 | 9.9% |
| 60 to 89 Minutes | 169 | 20.8% |
| 90 or more Minutes | 90 | 11.1% |
Commute Time by Sex in Sleepy Hollow
The most common commute times in Sleepy Hollow are 30 to 34 minutes (119 commuters, 26.0%) for males and 60 to 89 minutes (112 commuters, 31.7%) for females.
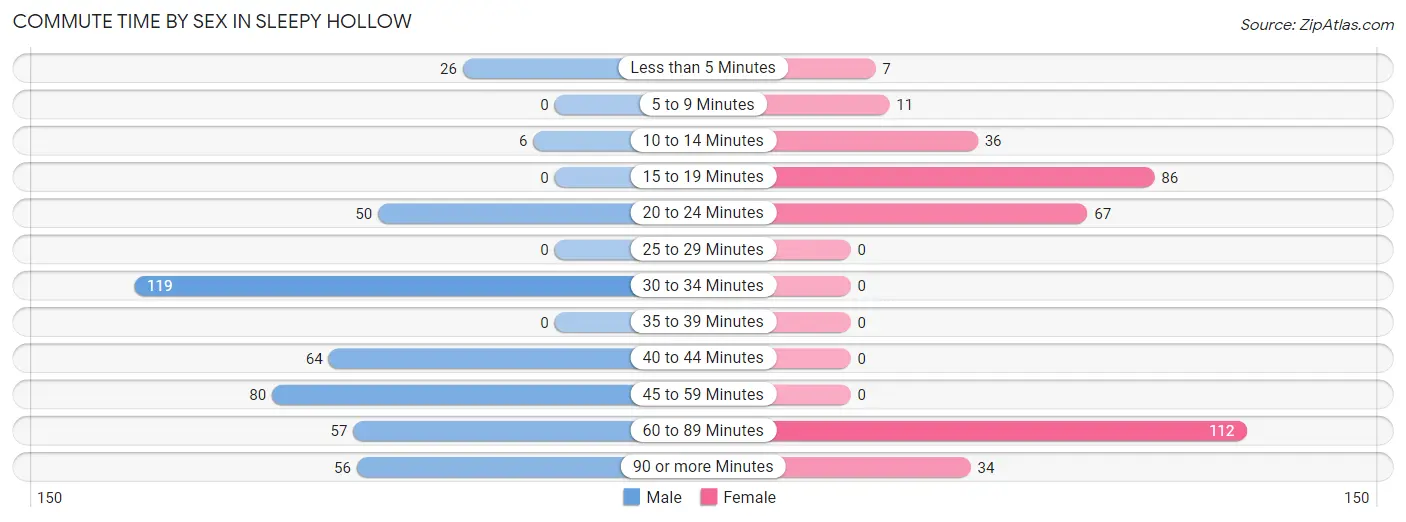
| Commute Time | Male | Female |
| Less than 5 Minutes | 26 (5.7%) | 7 (2.0%) |
| 5 to 9 Minutes | 0 (0.0%) | 11 (3.1%) |
| 10 to 14 Minutes | 6 (1.3%) | 36 (10.2%) |
| 15 to 19 Minutes | 0 (0.0%) | 86 (24.4%) |
| 20 to 24 Minutes | 50 (10.9%) | 67 (19.0%) |
| 25 to 29 Minutes | 0 (0.0%) | 0 (0.0%) |
| 30 to 34 Minutes | 119 (26.0%) | 0 (0.0%) |
| 35 to 39 Minutes | 0 (0.0%) | 0 (0.0%) |
| 40 to 44 Minutes | 64 (14.0%) | 0 (0.0%) |
| 45 to 59 Minutes | 80 (17.5%) | 0 (0.0%) |
| 60 to 89 Minutes | 57 (12.4%) | 112 (31.7%) |
| 90 or more Minutes | 56 (12.2%) | 34 (9.6%) |
Time of Departure to Work by Sex in Sleepy Hollow
The most frequent times of departure to work in Sleepy Hollow are 7:30 AM to 7:59 AM (114, 24.9%) for males and 7:30 AM to 7:59 AM (94, 26.6%) for females.
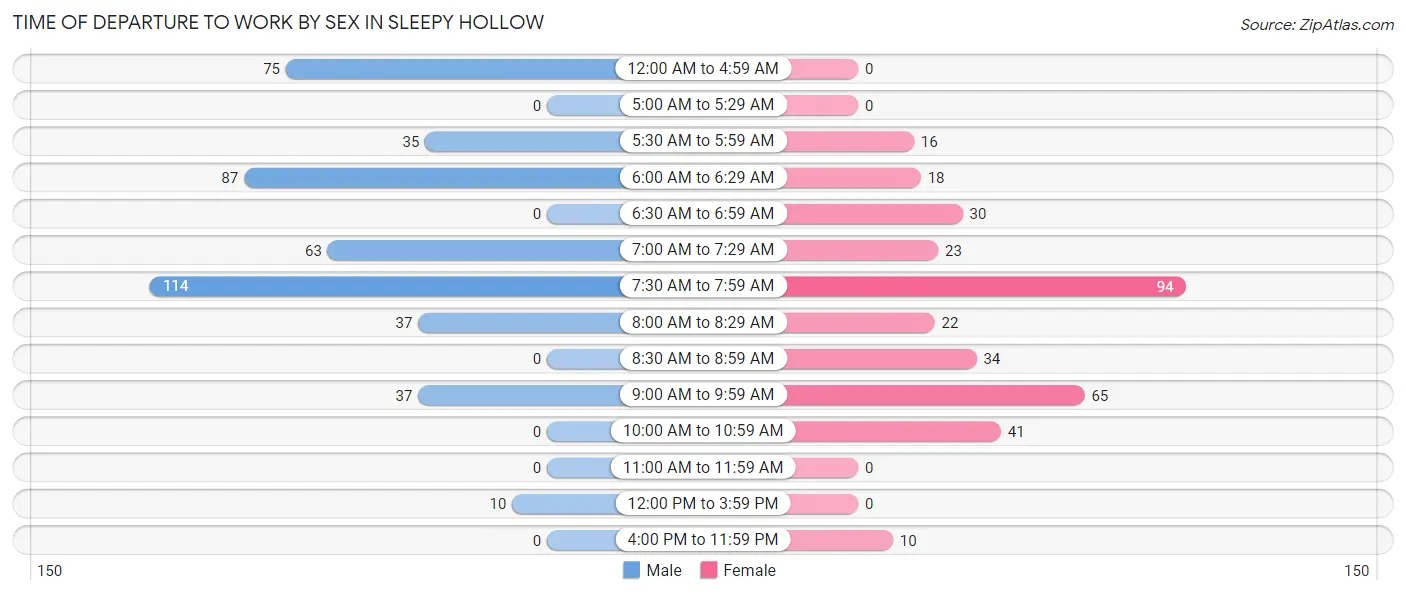
| Time of Departure | Male | Female |
| 12:00 AM to 4:59 AM | 75 (16.4%) | 0 (0.0%) |
| 5:00 AM to 5:29 AM | 0 (0.0%) | 0 (0.0%) |
| 5:30 AM to 5:59 AM | 35 (7.6%) | 16 (4.5%) |
| 6:00 AM to 6:29 AM | 87 (19.0%) | 18 (5.1%) |
| 6:30 AM to 6:59 AM | 0 (0.0%) | 30 (8.5%) |
| 7:00 AM to 7:29 AM | 63 (13.8%) | 23 (6.5%) |
| 7:30 AM to 7:59 AM | 114 (24.9%) | 94 (26.6%) |
| 8:00 AM to 8:29 AM | 37 (8.1%) | 22 (6.2%) |
| 8:30 AM to 8:59 AM | 0 (0.0%) | 34 (9.6%) |
| 9:00 AM to 9:59 AM | 37 (8.1%) | 65 (18.4%) |
| 10:00 AM to 10:59 AM | 0 (0.0%) | 41 (11.6%) |
| 11:00 AM to 11:59 AM | 0 (0.0%) | 0 (0.0%) |
| 12:00 PM to 3:59 PM | 10 (2.2%) | 0 (0.0%) |
| 4:00 PM to 11:59 PM | 0 (0.0%) | 10 (2.8%) |
| Total | 458 (100.0%) | 353 (100.0%) |
Housing Occupancy in Sleepy Hollow
Occupancy by Ownership in Sleepy Hollow
Of the total 821 dwellings in Sleepy Hollow, owner-occupied units account for 674 (82.1%), while renter-occupied units make up 147 (17.9%).
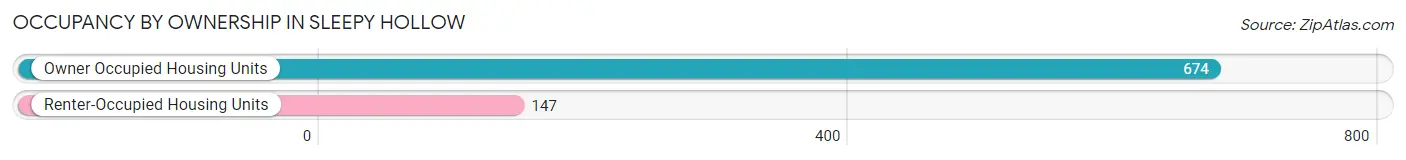
| Occupancy | # Housing Units | % Housing Units |
| Owner Occupied Housing Units | 674 | 82.1% |
| Renter-Occupied Housing Units | 147 | 17.9% |
| Total Occupied Housing Units | 821 | 100.0% |
Occupancy by Household Size in Sleepy Hollow
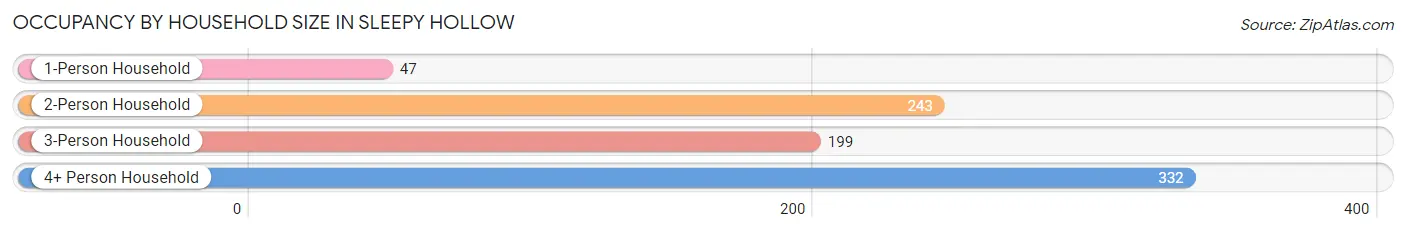
| Household Size | # Housing Units | % Housing Units |
| 1-Person Household | 47 | 5.7% |
| 2-Person Household | 243 | 29.6% |
| 3-Person Household | 199 | 24.2% |
| 4+ Person Household | 332 | 40.4% |
| Total Housing Units | 821 | 100.0% |
Occupancy by Ownership by Household Size in Sleepy Hollow
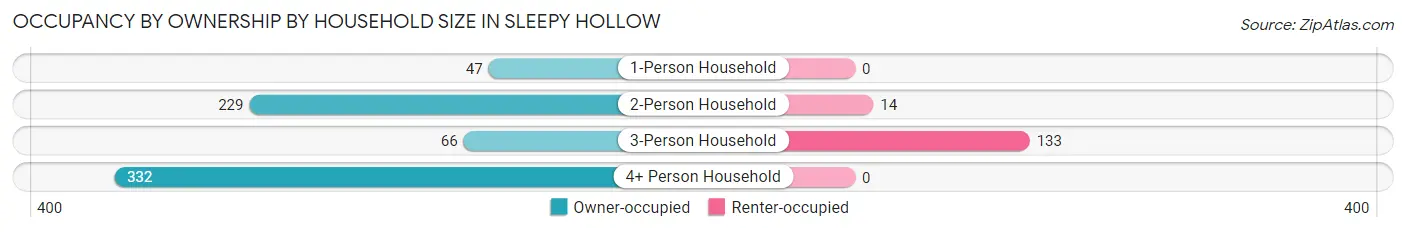
| Household Size | Owner-occupied | Renter-occupied |
| 1-Person Household | 47 (100.0%) | 0 (0.0%) |
| 2-Person Household | 229 (94.2%) | 14 (5.8%) |
| 3-Person Household | 66 (33.2%) | 133 (66.8%) |
| 4+ Person Household | 332 (100.0%) | 0 (0.0%) |
| Total Housing Units | 674 (82.1%) | 147 (17.9%) |
Occupancy by Educational Attainment in Sleepy Hollow
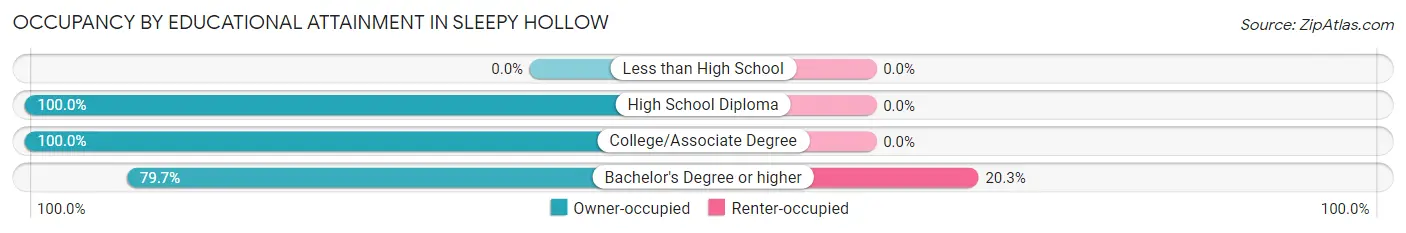
| Household Size | Owner-occupied | Renter-occupied |
| Less than High School | 0 (0.0%) | 0 (0.0%) |
| High School Diploma | 23 (100.0%) | 0 (0.0%) |
| College/Associate Degree | 73 (100.0%) | 0 (0.0%) |
| Bachelor's Degree or higher | 578 (79.7%) | 147 (20.3%) |
Occupancy by Age of Householder in Sleepy Hollow
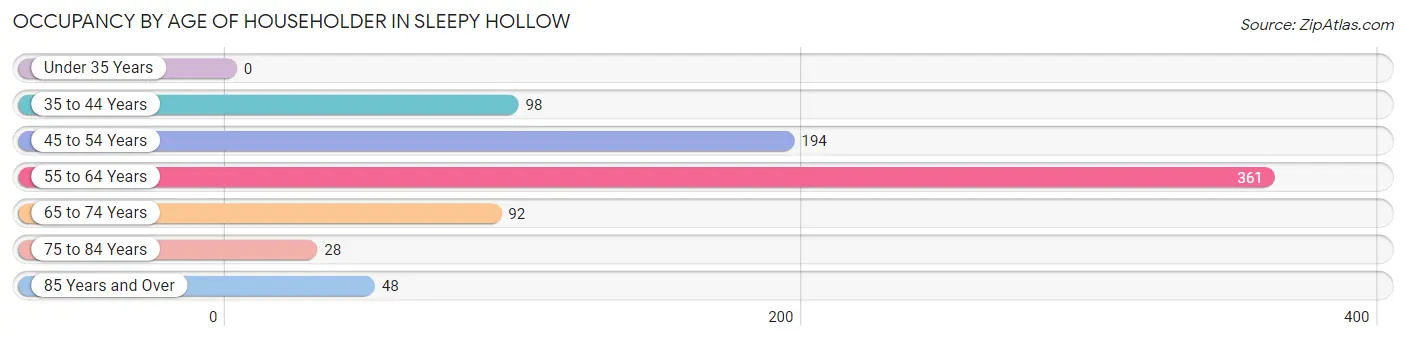
| Age Bracket | # Households | % Households |
| Under 35 Years | 0 | 0.0% |
| 35 to 44 Years | 98 | 11.9% |
| 45 to 54 Years | 194 | 23.6% |
| 55 to 64 Years | 361 | 44.0% |
| 65 to 74 Years | 92 | 11.2% |
| 75 to 84 Years | 28 | 3.4% |
| 85 Years and Over | 48 | 5.9% |
| Total | 821 | 100.0% |
Housing Finances in Sleepy Hollow
Median Income by Occupancy in Sleepy Hollow
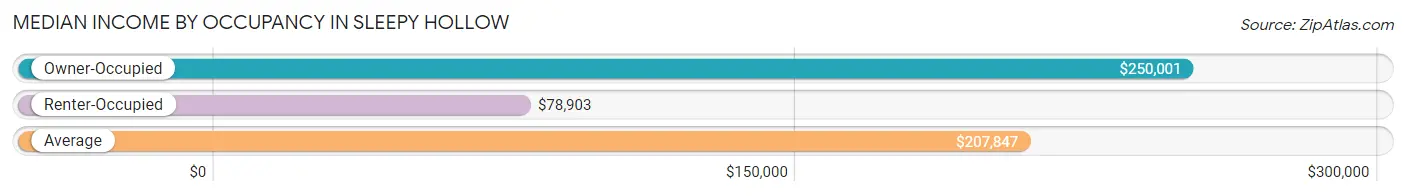
| Occupancy Type | # Households | Median Income |
| Owner-Occupied | 674 (82.1%) | $250,001 |
| Renter-Occupied | 147 (17.9%) | $78,903 |
| Average | 821 (100.0%) | $207,847 |
Occupancy by Householder Income Bracket in Sleepy Hollow
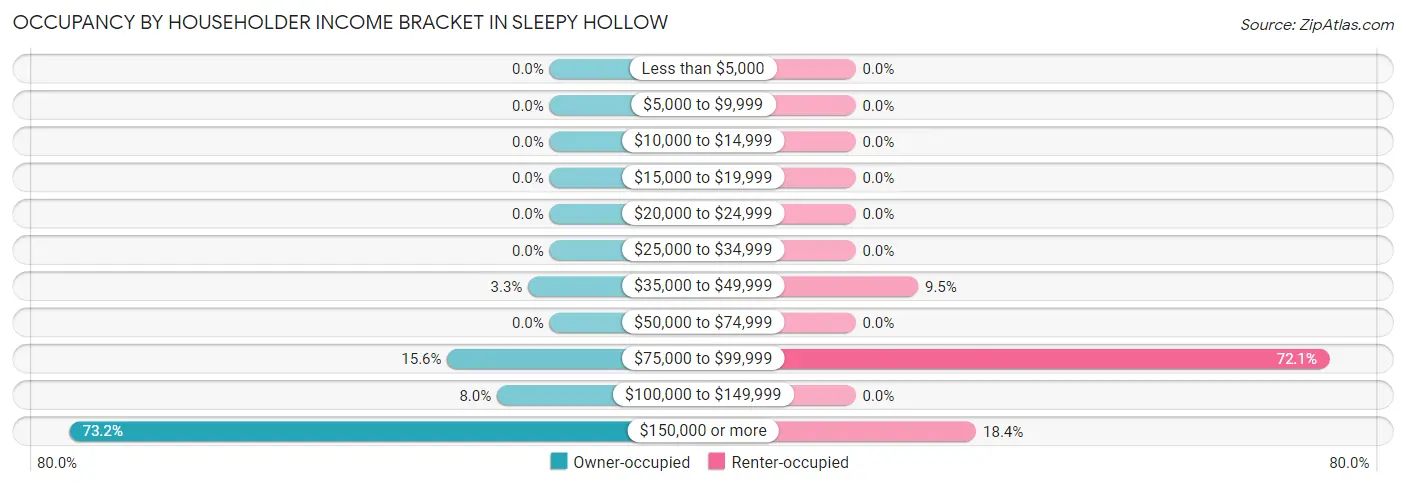
| Income Bracket | Owner-occupied | Renter-occupied |
| Less than $5,000 | 0 (0.0%) | 0 (0.0%) |
| $5,000 to $9,999 | 0 (0.0%) | 0 (0.0%) |
| $10,000 to $14,999 | 0 (0.0%) | 0 (0.0%) |
| $15,000 to $19,999 | 0 (0.0%) | 0 (0.0%) |
| $20,000 to $24,999 | 0 (0.0%) | 0 (0.0%) |
| $25,000 to $34,999 | 0 (0.0%) | 0 (0.0%) |
| $35,000 to $49,999 | 22 (3.3%) | 14 (9.5%) |
| $50,000 to $74,999 | 0 (0.0%) | 0 (0.0%) |
| $75,000 to $99,999 | 105 (15.6%) | 106 (72.1%) |
| $100,000 to $149,999 | 54 (8.0%) | 0 (0.0%) |
| $150,000 or more | 493 (73.2%) | 27 (18.4%) |
| Total | 674 (100.0%) | 147 (100.0%) |
Monthly Housing Cost Tiers in Sleepy Hollow
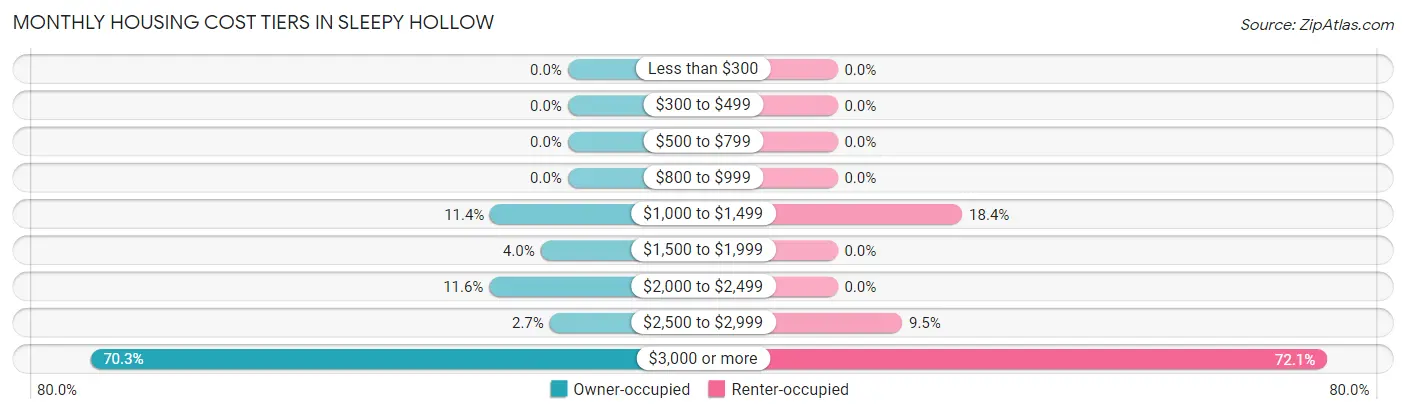
| Monthly Cost | Owner-occupied | Renter-occupied |
| Less than $300 | 0 (0.0%) | 0 (0.0%) |
| $300 to $499 | 0 (0.0%) | 0 (0.0%) |
| $500 to $799 | 0 (0.0%) | 0 (0.0%) |
| $800 to $999 | 0 (0.0%) | 0 (0.0%) |
| $1,000 to $1,499 | 77 (11.4%) | 27 (18.4%) |
| $1,500 to $1,999 | 27 (4.0%) | 0 (0.0%) |
| $2,000 to $2,499 | 78 (11.6%) | 0 (0.0%) |
| $2,500 to $2,999 | 18 (2.7%) | 14 (9.5%) |
| $3,000 or more | 474 (70.3%) | 106 (72.1%) |
| Total | 674 (100.0%) | 147 (100.0%) |
Physical Housing Characteristics in Sleepy Hollow
Housing Structures in Sleepy Hollow
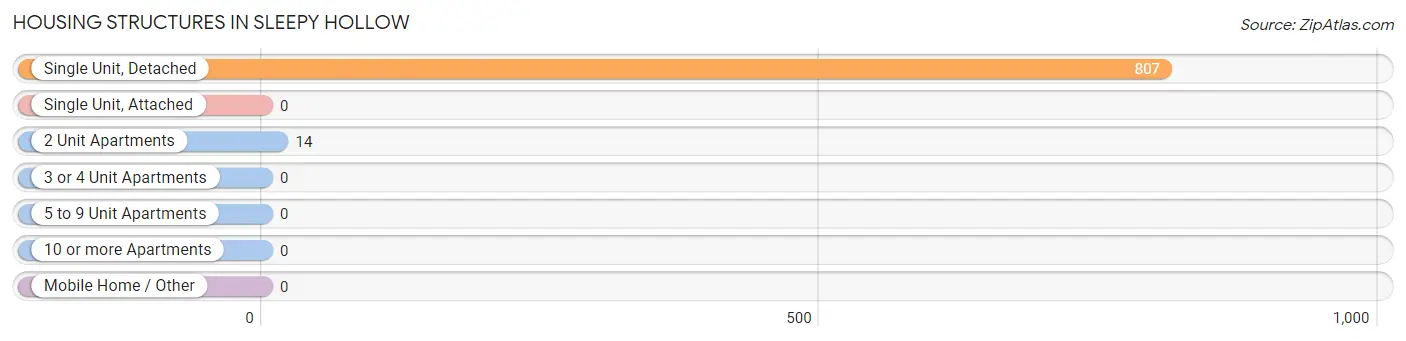
| Structure Type | # Housing Units | % Housing Units |
| Single Unit, Detached | 807 | 98.3% |
| Single Unit, Attached | 0 | 0.0% |
| 2 Unit Apartments | 14 | 1.7% |
| 3 or 4 Unit Apartments | 0 | 0.0% |
| 5 to 9 Unit Apartments | 0 | 0.0% |
| 10 or more Apartments | 0 | 0.0% |
| Mobile Home / Other | 0 | 0.0% |
| Total | 821 | 100.0% |
Housing Structures by Occupancy in Sleepy Hollow
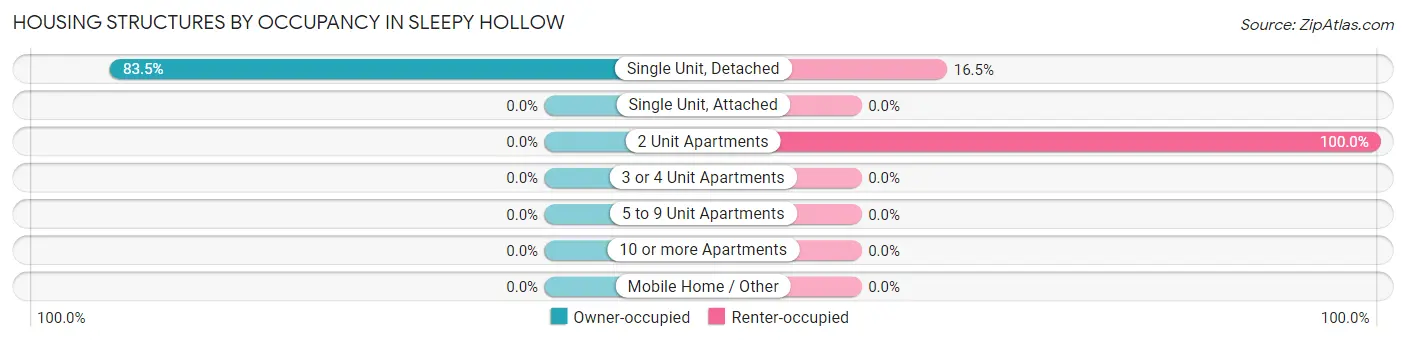
| Structure Type | Owner-occupied | Renter-occupied |
| Single Unit, Detached | 674 (83.5%) | 133 (16.5%) |
| Single Unit, Attached | 0 (0.0%) | 0 (0.0%) |
| 2 Unit Apartments | 0 (0.0%) | 14 (100.0%) |
| 3 or 4 Unit Apartments | 0 (0.0%) | 0 (0.0%) |
| 5 to 9 Unit Apartments | 0 (0.0%) | 0 (0.0%) |
| 10 or more Apartments | 0 (0.0%) | 0 (0.0%) |
| Mobile Home / Other | 0 (0.0%) | 0 (0.0%) |
| Total | 674 (82.1%) | 147 (17.9%) |
Housing Structures by Number of Rooms in Sleepy Hollow
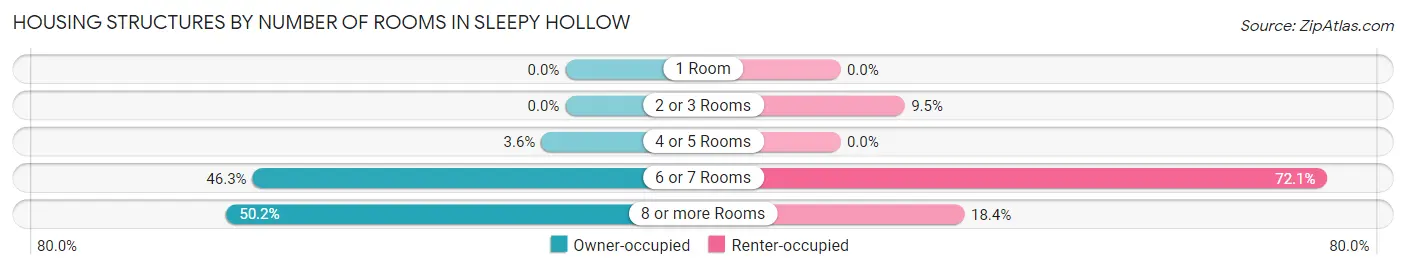
| Number of Rooms | Owner-occupied | Renter-occupied |
| 1 Room | 0 (0.0%) | 0 (0.0%) |
| 2 or 3 Rooms | 0 (0.0%) | 14 (9.5%) |
| 4 or 5 Rooms | 24 (3.6%) | 0 (0.0%) |
| 6 or 7 Rooms | 312 (46.3%) | 106 (72.1%) |
| 8 or more Rooms | 338 (50.1%) | 27 (18.4%) |
| Total | 674 (100.0%) | 147 (100.0%) |
Housing Structure by Heating Type in Sleepy Hollow
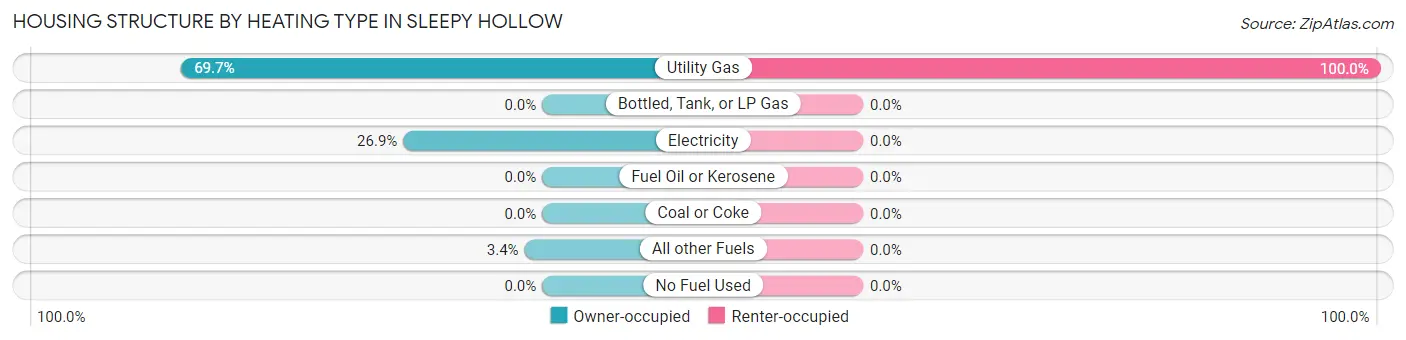
| Heating Type | Owner-occupied | Renter-occupied |
| Utility Gas | 470 (69.7%) | 147 (100.0%) |
| Bottled, Tank, or LP Gas | 0 (0.0%) | 0 (0.0%) |
| Electricity | 181 (26.9%) | 0 (0.0%) |
| Fuel Oil or Kerosene | 0 (0.0%) | 0 (0.0%) |
| Coal or Coke | 0 (0.0%) | 0 (0.0%) |
| All other Fuels | 23 (3.4%) | 0 (0.0%) |
| No Fuel Used | 0 (0.0%) | 0 (0.0%) |
| Total | 674 (100.0%) | 147 (100.0%) |
Household Vehicle Usage in Sleepy Hollow
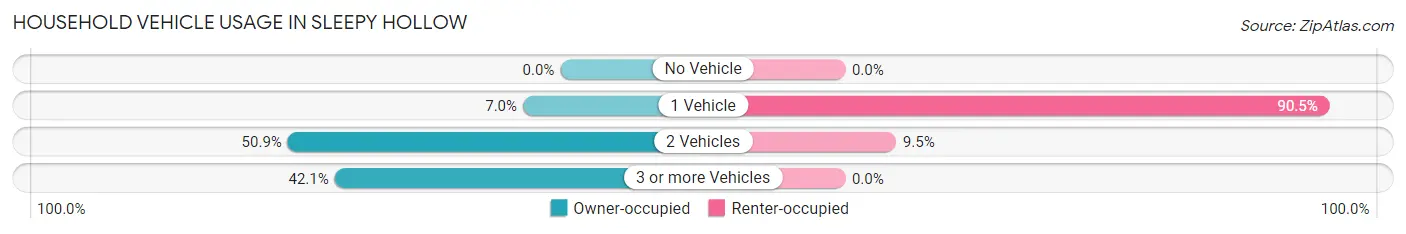
| Vehicles per Household | Owner-occupied | Renter-occupied |
| No Vehicle | 0 (0.0%) | 0 (0.0%) |
| 1 Vehicle | 47 (7.0%) | 133 (90.5%) |
| 2 Vehicles | 343 (50.9%) | 14 (9.5%) |
| 3 or more Vehicles | 284 (42.1%) | 0 (0.0%) |
| Total | 674 (100.0%) | 147 (100.0%) |
Real Estate & Mortgages in Sleepy Hollow
Real Estate and Mortgage Overview in Sleepy Hollow
| Characteristic | Without Mortgage | With Mortgage |
| Housing Units | 207 | 467 |
| Median Property Value | $1,742,500 | $2,000,001 |
| Median Household Income | - | - |
| Monthly Housing Costs | $1,501 | $449 |
| Real Estate Taxes | $10,001 | $0 |
Property Value by Mortgage Status in Sleepy Hollow
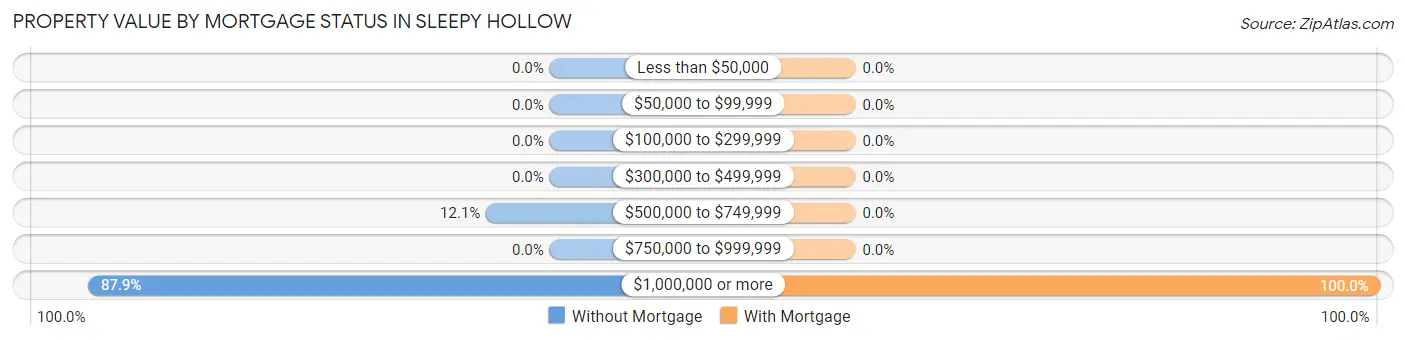
| Property Value | Without Mortgage | With Mortgage |
| Less than $50,000 | 0 (0.0%) | 0 (0.0%) |
| $50,000 to $99,999 | 0 (0.0%) | 0 (0.0%) |
| $100,000 to $299,999 | 0 (0.0%) | 0 (0.0%) |
| $300,000 to $499,999 | 0 (0.0%) | 0 (0.0%) |
| $500,000 to $749,999 | 25 (12.1%) | 0 (0.0%) |
| $750,000 to $999,999 | 0 (0.0%) | 0 (0.0%) |
| $1,000,000 or more | 182 (87.9%) | 467 (100.0%) |
| Total | 207 (100.0%) | 467 (100.0%) |
Household Income by Mortgage Status in Sleepy Hollow
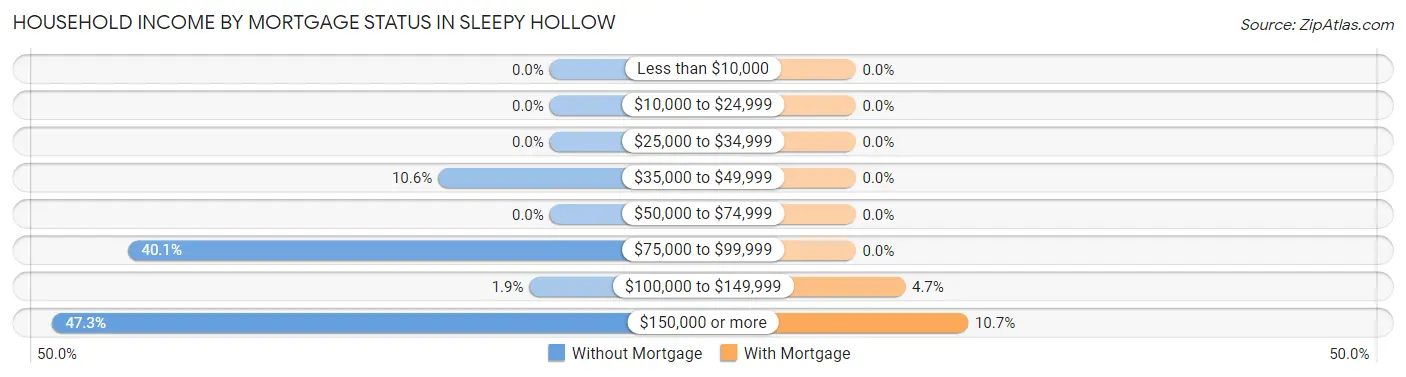
| Household Income | Without Mortgage | With Mortgage |
| Less than $10,000 | 0 (0.0%) | 0 (0.0%) |
| $10,000 to $24,999 | 0 (0.0%) | 0 (0.0%) |
| $25,000 to $34,999 | 0 (0.0%) | 0 (0.0%) |
| $35,000 to $49,999 | 22 (10.6%) | 0 (0.0%) |
| $50,000 to $74,999 | 0 (0.0%) | 0 (0.0%) |
| $75,000 to $99,999 | 83 (40.1%) | 0 (0.0%) |
| $100,000 to $149,999 | 4 (1.9%) | 22 (4.7%) |
| $150,000 or more | 98 (47.3%) | 50 (10.7%) |
| Total | 207 (100.0%) | 467 (100.0%) |
Property Value to Household Income Ratio in Sleepy Hollow
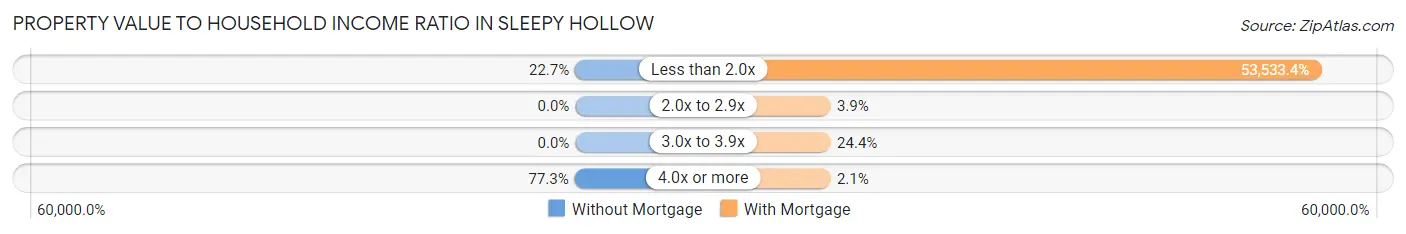
| Value-to-Income Ratio | Without Mortgage | With Mortgage |
| Less than 2.0x | 47 (22.7%) | 250,001 (53,533.4%) |
| 2.0x to 2.9x | 0 (0.0%) | 18 (3.8%) |
| 3.0x to 3.9x | 0 (0.0%) | 114 (24.4%) |
| 4.0x or more | 160 (77.3%) | 10 (2.1%) |
| Total | 207 (100.0%) | 467 (100.0%) |
Real Estate Taxes by Mortgage Status in Sleepy Hollow
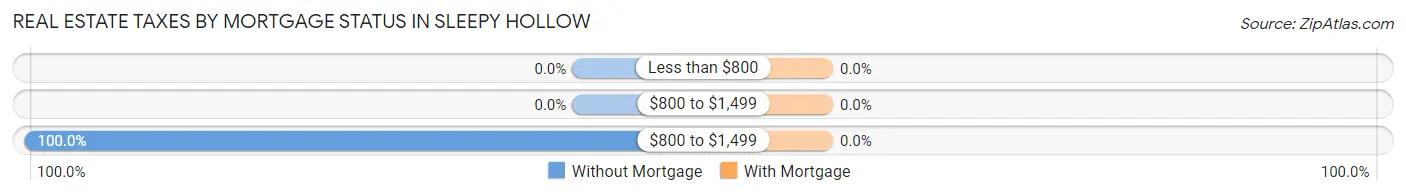
| Property Taxes | Without Mortgage | With Mortgage |
| Less than $800 | 0 (0.0%) | 0 (0.0%) |
| $800 to $1,499 | 0 (0.0%) | 0 (0.0%) |
| $800 to $1,499 | 207 (100.0%) | 0 (0.0%) |
| Total | 207 (100.0%) | 467 (100.0%) |
Health & Disability in Sleepy Hollow
Health Insurance Coverage by Age in Sleepy Hollow
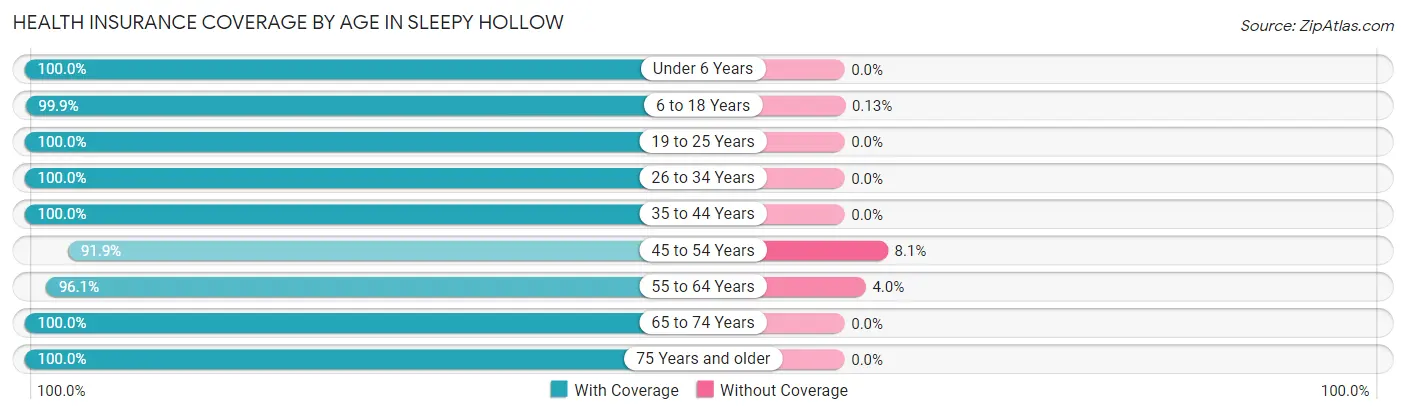
| Age Bracket | With Coverage | Without Coverage |
| Under 6 Years | 100 (100.0%) | 0 (0.0%) |
| 6 to 18 Years | 751 (99.9%) | 1 (0.1%) |
| 19 to 25 Years | 316 (100.0%) | 0 (0.0%) |
| 26 to 34 Years | 93 (100.0%) | 0 (0.0%) |
| 35 to 44 Years | 140 (100.0%) | 0 (0.0%) |
| 45 to 54 Years | 364 (91.9%) | 32 (8.1%) |
| 55 to 64 Years | 560 (96.1%) | 23 (4.0%) |
| 65 to 74 Years | 274 (100.0%) | 0 (0.0%) |
| 75 Years and older | 124 (100.0%) | 0 (0.0%) |
| Total | 2,722 (98.0%) | 56 (2.0%) |
Health Insurance Coverage by Citizenship Status in Sleepy Hollow
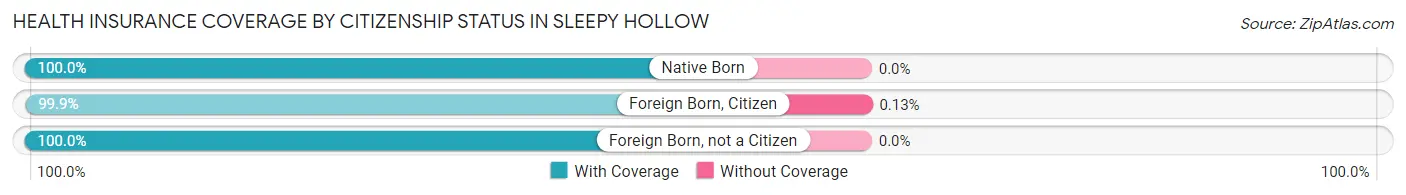
| Citizenship Status | With Coverage | Without Coverage |
| Native Born | 100 (100.0%) | 0 (0.0%) |
| Foreign Born, Citizen | 751 (99.9%) | 1 (0.1%) |
| Foreign Born, not a Citizen | 316 (100.0%) | 0 (0.0%) |
Health Insurance Coverage by Household Income in Sleepy Hollow
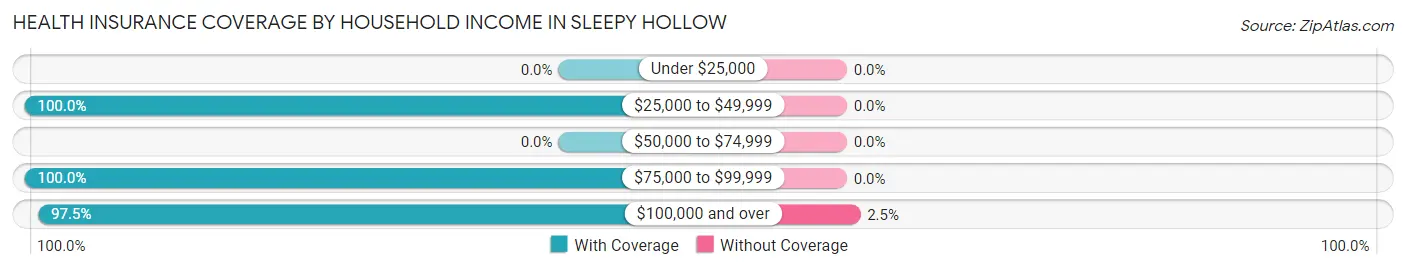
| Household Income | With Coverage | Without Coverage |
| Under $25,000 | 0 (0.0%) | 0 (0.0%) |
| $25,000 to $49,999 | 50 (100.0%) | 0 (0.0%) |
| $50,000 to $74,999 | 0 (0.0%) | 0 (0.0%) |
| $75,000 to $99,999 | 454 (100.0%) | 0 (0.0%) |
| $100,000 and over | 2,129 (97.5%) | 55 (2.5%) |
Public vs Private Health Insurance Coverage by Age in Sleepy Hollow
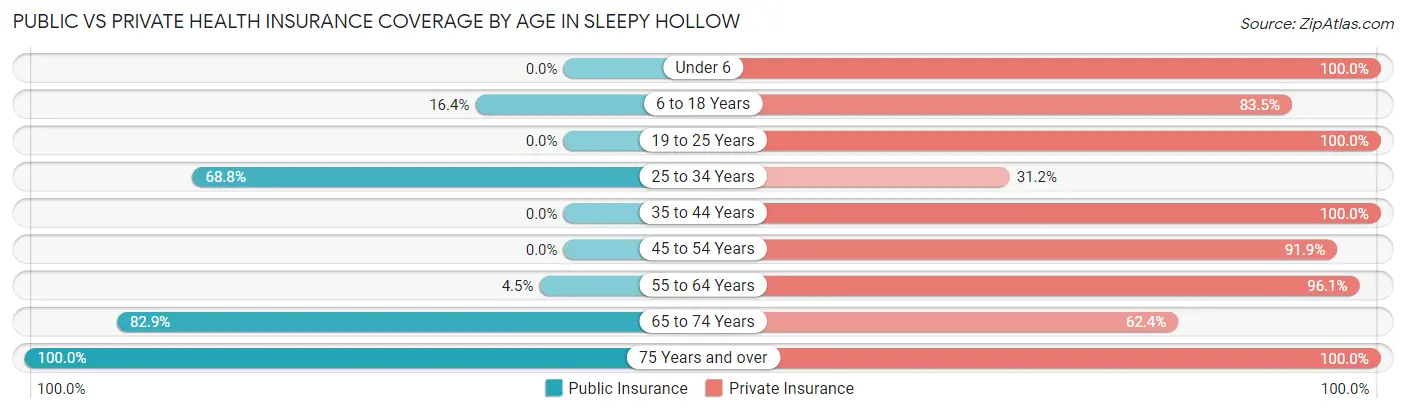
| Age Bracket | Public Insurance | Private Insurance |
| Under 6 | 0 (0.0%) | 100 (100.0%) |
| 6 to 18 Years | 123 (16.4%) | 628 (83.5%) |
| 19 to 25 Years | 0 (0.0%) | 316 (100.0%) |
| 25 to 34 Years | 64 (68.8%) | 29 (31.2%) |
| 35 to 44 Years | 0 (0.0%) | 140 (100.0%) |
| 45 to 54 Years | 0 (0.0%) | 364 (91.9%) |
| 55 to 64 Years | 26 (4.5%) | 560 (96.1%) |
| 65 to 74 Years | 227 (82.9%) | 171 (62.4%) |
| 75 Years and over | 124 (100.0%) | 124 (100.0%) |
| Total | 564 (20.3%) | 2,432 (87.5%) |
Disability Status by Sex by Age in Sleepy Hollow
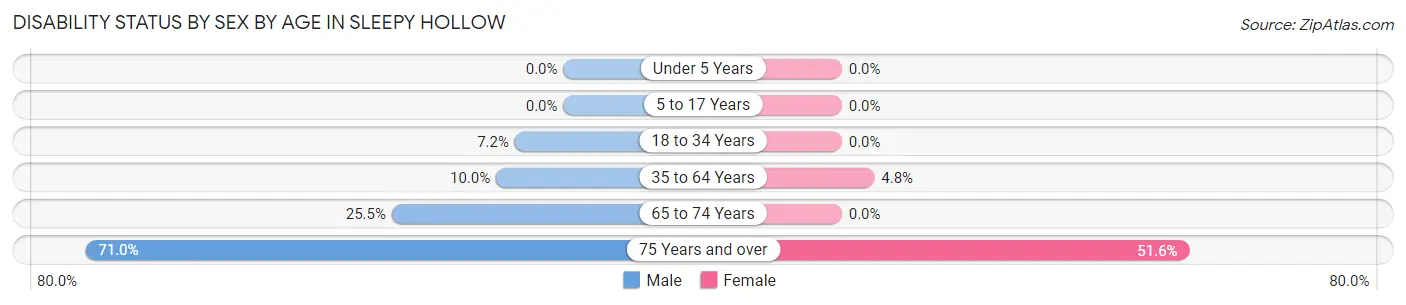
| Age Bracket | Male | Female |
| Under 5 Years | 0 (0.0%) | 0 (0.0%) |
| 5 to 17 Years | 0 (0.0%) | 0 (0.0%) |
| 18 to 34 Years | 16 (7.2%) | 0 (0.0%) |
| 35 to 64 Years | 56 (10.0%) | 27 (4.8%) |
| 65 to 74 Years | 40 (25.5%) | 0 (0.0%) |
| 75 Years and over | 44 (71.0%) | 32 (51.6%) |
Disability Class by Sex by Age in Sleepy Hollow
Disability Class: Hearing Difficulty
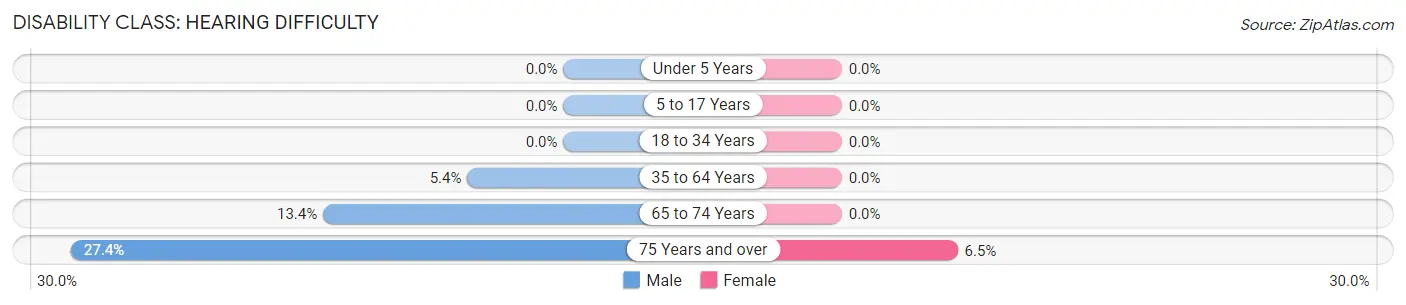
| Age Bracket | Male | Female |
| Under 5 Years | 0 (0.0%) | 0 (0.0%) |
| 5 to 17 Years | 0 (0.0%) | 0 (0.0%) |
| 18 to 34 Years | 0 (0.0%) | 0 (0.0%) |
| 35 to 64 Years | 30 (5.3%) | 0 (0.0%) |
| 65 to 74 Years | 21 (13.4%) | 0 (0.0%) |
| 75 Years and over | 17 (27.4%) | 4 (6.5%) |
Disability Class: Vision Difficulty
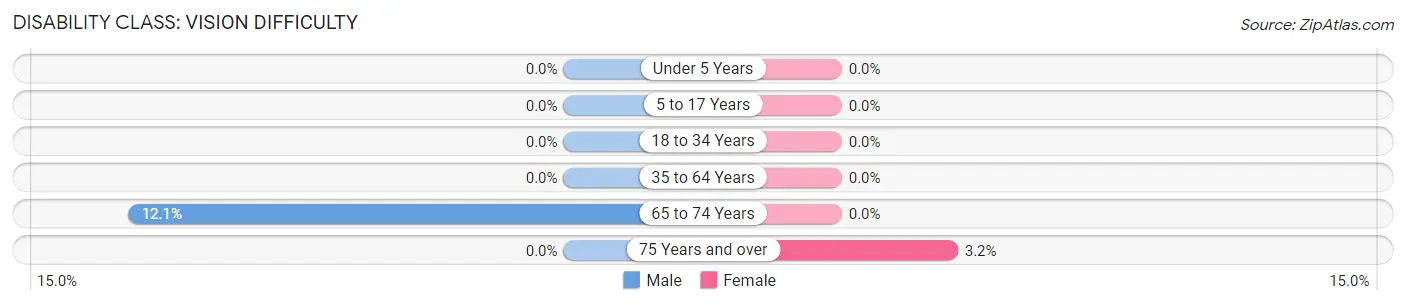
| Age Bracket | Male | Female |
| Under 5 Years | 0 (0.0%) | 0 (0.0%) |
| 5 to 17 Years | 0 (0.0%) | 0 (0.0%) |
| 18 to 34 Years | 0 (0.0%) | 0 (0.0%) |
| 35 to 64 Years | 0 (0.0%) | 0 (0.0%) |
| 65 to 74 Years | 19 (12.1%) | 0 (0.0%) |
| 75 Years and over | 0 (0.0%) | 2 (3.2%) |
Disability Class: Cognitive Difficulty
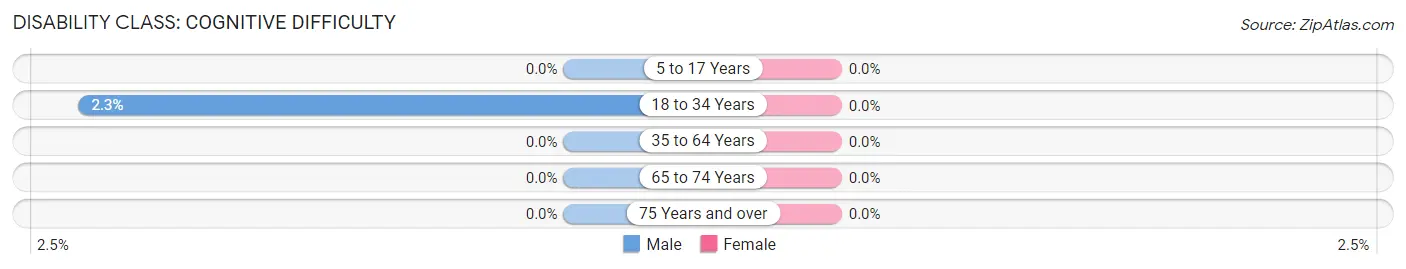
| Age Bracket | Male | Female |
| 5 to 17 Years | 0 (0.0%) | 0 (0.0%) |
| 18 to 34 Years | 5 (2.2%) | 0 (0.0%) |
| 35 to 64 Years | 0 (0.0%) | 0 (0.0%) |
| 65 to 74 Years | 0 (0.0%) | 0 (0.0%) |
| 75 Years and over | 0 (0.0%) | 0 (0.0%) |
Disability Class: Ambulatory Difficulty
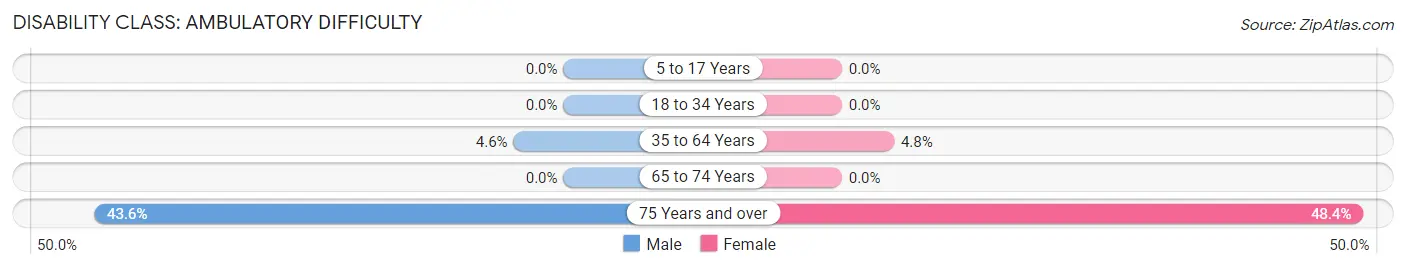
| Age Bracket | Male | Female |
| 5 to 17 Years | 0 (0.0%) | 0 (0.0%) |
| 18 to 34 Years | 0 (0.0%) | 0 (0.0%) |
| 35 to 64 Years | 26 (4.6%) | 27 (4.8%) |
| 65 to 74 Years | 0 (0.0%) | 0 (0.0%) |
| 75 Years and over | 27 (43.5%) | 30 (48.4%) |
Disability Class: Self-Care Difficulty
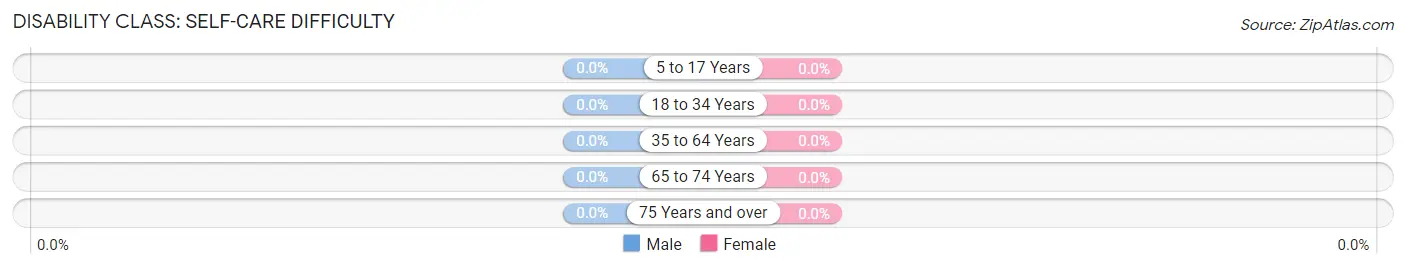
| Age Bracket | Male | Female |
| 5 to 17 Years | 0 (0.0%) | 0 (0.0%) |
| 18 to 34 Years | 0 (0.0%) | 0 (0.0%) |
| 35 to 64 Years | 0 (0.0%) | 0 (0.0%) |
| 65 to 74 Years | 0 (0.0%) | 0 (0.0%) |
| 75 Years and over | 0 (0.0%) | 0 (0.0%) |
Technology Access in Sleepy Hollow
Computing Device Access in Sleepy Hollow
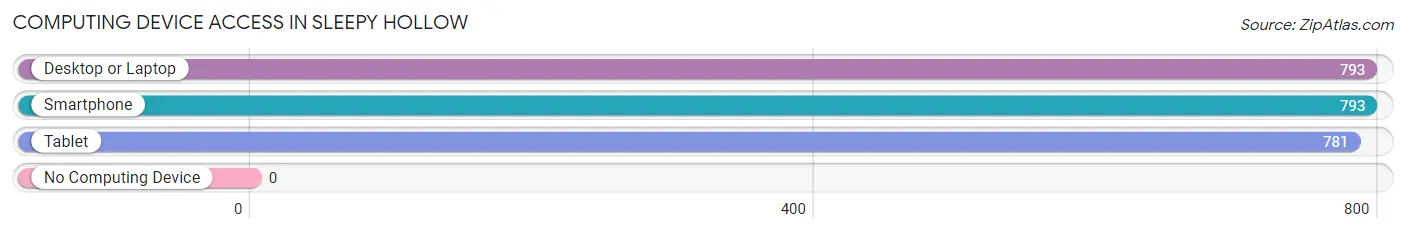
| Device Type | # Households | % Households |
| Desktop or Laptop | 793 | 96.6% |
| Smartphone | 793 | 96.6% |
| Tablet | 781 | 95.1% |
| No Computing Device | 0 | 0.0% |
| Total | 821 | 100.0% |
Internet Access in Sleepy Hollow
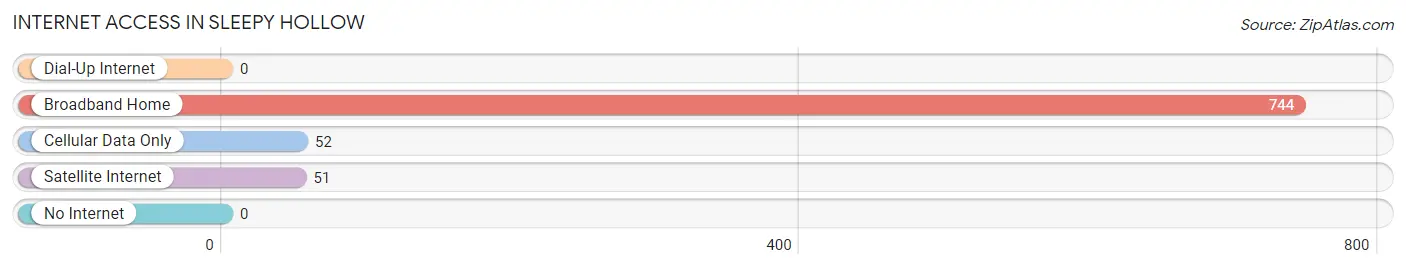
| Internet Type | # Households | % Households |
| Dial-Up Internet | 0 | 0.0% |
| Broadband Home | 744 | 90.6% |
| Cellular Data Only | 52 | 6.3% |
| Satellite Internet | 51 | 6.2% |
| No Internet | 0 | 0.0% |
| Total | 821 | 100.0% |
Sleepy Hollow Summary
Sleepy Hollow is a small unincorporated community located in Marin County, California. It is situated in the San Francisco Bay Area, just north of San Rafael and south of Novato. The community is bordered by the San Francisco Bay to the east, the San Rafael Canal to the south, and the hills of the Marin Headlands to the west.
History
The area now known as Sleepy Hollow was originally inhabited by the Coast Miwok Native American tribe. The first European settlers arrived in the area in the late 1800s, and the community was officially established in 1876. The name Sleepy Hollow was chosen by the first postmaster, who was inspired by the Washington Irving story of the same name.
In the early 1900s, the area was primarily used for farming and ranching. The Sleepy Hollow Dairy was established in the area in the 1920s, and the dairy was a major employer in the community for many years.
Geography
Sleepy Hollow is located in Marin County, California, in the San Francisco Bay Area. It is situated just north of San Rafael and south of Novato. The community is bordered by the San Francisco Bay to the east, the San Rafael Canal to the south, and the hills of the Marin Headlands to the west.
The area is characterized by rolling hills and valleys, with the highest point in the community being the summit of Mount Burdell, which rises to an elevation of 1,890 feet. The area is also home to several creeks and streams, including San Anselmo Creek, which flows through the community.
Economy
The economy of Sleepy Hollow is largely based on agriculture and tourism. The area is home to several wineries and vineyards, as well as a number of farms and ranches. The Sleepy Hollow Dairy, which was established in the 1920s, is still in operation today.
The community is also a popular tourist destination, with many visitors coming to explore the area’s natural beauty and to visit the local wineries and vineyards.
Demographics
As of the 2010 census, the population of Sleepy Hollow was 1,845. The racial makeup of the community was 79.3% White, 0.7% African American, 0.3% Native American, 11.2% Asian, 0.1% Pacific Islander, 5.2% from other races, and 3.2% from two or more races. Hispanic or Latino of any race were 11.2% of the population.
The median household income in Sleepy Hollow was $90,917, and the median family income was $103,917. The per capita income for the community was $45,917. About 4.3% of families and 5.7% of the population were below the poverty line, including 6.3% of those under age 18 and 4.3% of those age 65 or over.
Common Questions
What is Per Capita Income in Sleepy Hollow?
Per Capita income in Sleepy Hollow is $127,770.
What is the Median Family Income in Sleepy Hollow?
Median Family Income in Sleepy Hollow is $208,017.
What is the Median Household income in Sleepy Hollow?
Median Household Income in Sleepy Hollow is $207,847.
What is Income or Wage Gap in Sleepy Hollow?
Income or Wage Gap in Sleepy Hollow is 62.6%.
Women in Sleepy Hollow earn 37.4 cents for every dollar earned by a man.
What is Inequality or Gini Index in Sleepy Hollow?
Inequality or Gini Index in Sleepy Hollow is 0.54.
What is the Total Population of Sleepy Hollow?
Total Population of Sleepy Hollow is 2,778.
What is the Total Male Population of Sleepy Hollow?
Total Male Population of Sleepy Hollow is 1,385.
What is the Total Female Population of Sleepy Hollow?
Total Female Population of Sleepy Hollow is 1,393.
What is the Ratio of Males per 100 Females in Sleepy Hollow?
There are 99.43 Males per 100 Females in Sleepy Hollow.
What is the Ratio of Females per 100 Males in Sleepy Hollow?
There are 100.58 Females per 100 Males in Sleepy Hollow.
What is the Median Population Age in Sleepy Hollow?
Median Population Age in Sleepy Hollow is 44.6 Years.
What is the Average Family Size in Sleepy Hollow
Average Family Size in Sleepy Hollow is 3.2 People.
What is the Average Household Size in Sleepy Hollow
Average Household Size in Sleepy Hollow is 3.3 People.
How Large is the Labor Force in Sleepy Hollow?
There are 1,347 People in the Labor Forcein in Sleepy Hollow.
What is the Percentage of People in the Labor Force in Sleepy Hollow?
64.3% of People are in the Labor Force in Sleepy Hollow.
What is the Unemployment Rate in Sleepy Hollow?
Unemployment Rate in Sleepy Hollow is 8.4%.