Cities with the Highest Percentage of Population Employed in Legal Services & Support in New York
RELATED REPORTS & OPTIONS
Legal Services & Support
New York
Compare Cities
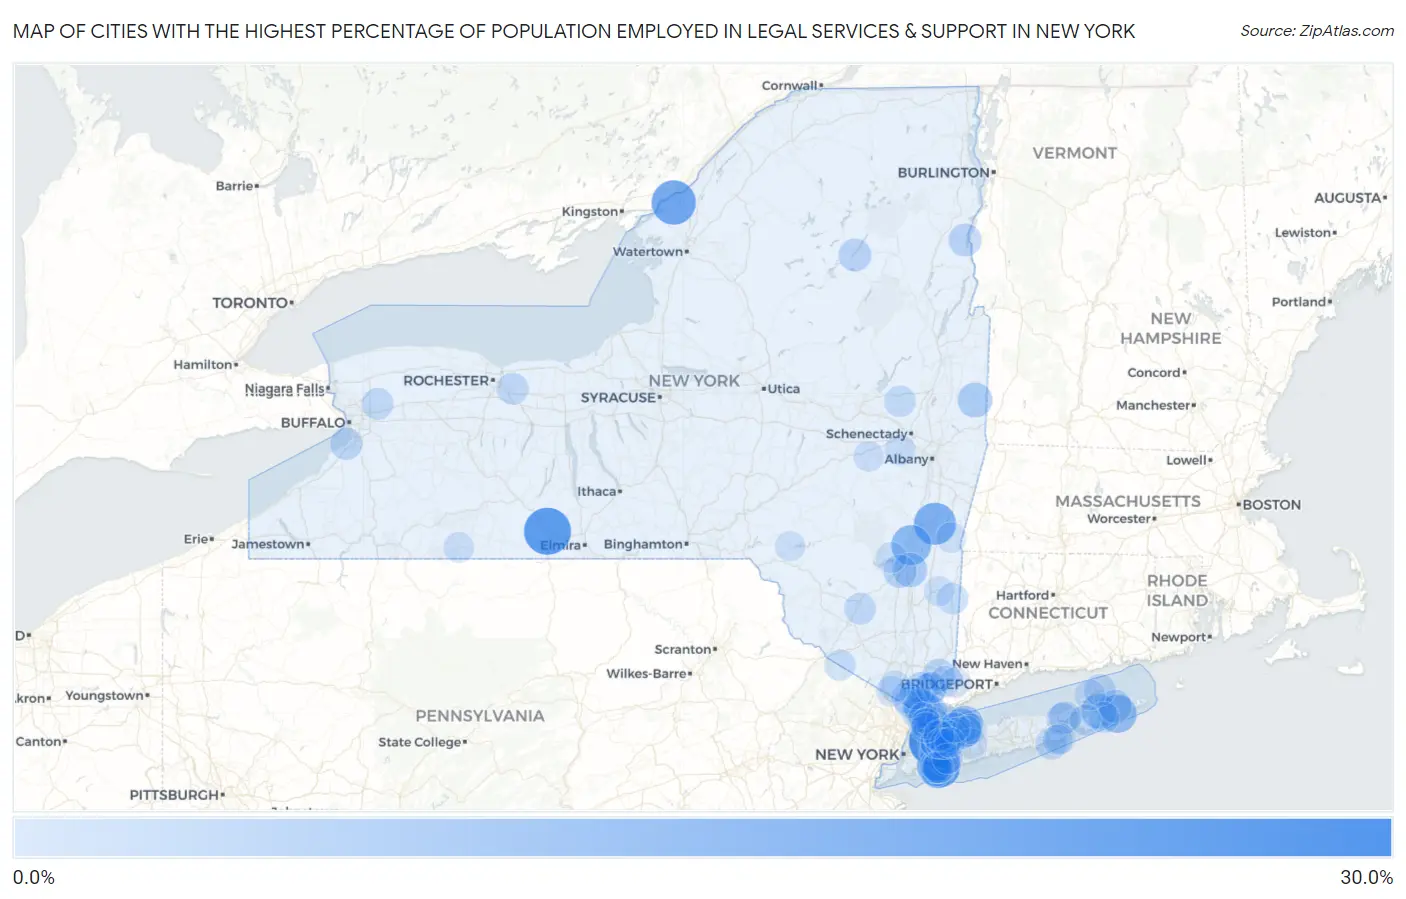
Map of Cities with the Highest Percentage of Population Employed in Legal Services & Support in New York
0.0%
30.0%
Cities with the Highest Percentage of Population Employed in Legal Services & Support in New York
| City | % Employed | vs State | vs National | |
| 1. | Saddle Rock Estates | 28.2% | 1.9%(+26.3)#1 | 1.2%(+27.0)#28 |
| 2. | Coopers Plains | 25.2% | 1.9%(+23.3)#2 | 1.2%(+24.0)#34 |
| 3. | Lake Huntington | 24.5% | 1.9%(+22.6)#3 | 1.2%(+23.3)#37 |
| 4. | Thousand Island Park | 21.8% | 1.9%(+19.9)#4 | 1.2%(+20.6)#49 |
| 5. | Hewlett Bay Park | 20.3% | 1.9%(+18.4)#5 | 1.2%(+19.1)#55 |
| 6. | Claverack Red Mills | 19.1% | 1.9%(+17.2)#6 | 1.2%(+17.9)#65 |
| 7. | Cove Neck | 16.8% | 1.9%(+14.9)#7 | 1.2%(+15.6)#85 |
| 8. | Malden On Hudson | 16.5% | 1.9%(+14.7)#8 | 1.2%(+15.3)#87 |
| 9. | Amagansett | 14.6% | 1.9%(+12.8)#9 | 1.2%(+13.5)#108 |
| 10. | Plandome | 12.7% | 1.9%(+10.9)#10 | 1.2%(+11.6)#145 |
| 11. | Lloyd Harbor | 12.0% | 1.9%(+10.1)#11 | 1.2%(+10.8)#159 |
| 12. | Ardsley | 11.5% | 1.9%(+9.63)#12 | 1.2%(+10.3)#168 |
| 13. | Sag Harbor | 11.0% | 1.9%(+9.14)#13 | 1.2%(+9.82)#183 |
| 14. | Cambridge | 10.5% | 1.9%(+8.61)#14 | 1.2%(+9.29)#200 |
| 15. | Scarsdale | 10.4% | 1.9%(+8.50)#15 | 1.2%(+9.18)#206 |
| 16. | Rhinecliff | 10.1% | 1.9%(+8.27)#16 | 1.2%(+8.95)#217 |
| 17. | Crest View Heights | 10.0% | 1.9%(+8.13)#17 | 1.2%(+8.81)#224 |
| 18. | Sands Point | 10.0% | 1.9%(+8.10)#18 | 1.2%(+8.78)#226 |
| 19. | Pleasantville | 9.9% | 1.9%(+8.00)#19 | 1.2%(+8.68)#232 |
| 20. | Roslyn Estates | 9.8% | 1.9%(+7.90)#20 | 1.2%(+8.58)#239 |
| 21. | Great Neck Plaza | 9.7% | 1.9%(+7.86)#21 | 1.2%(+8.54)#242 |
| 22. | Harbor Isle | 9.0% | 1.9%(+7.14)#22 | 1.2%(+7.82)#273 |
| 23. | Briarcliff Manor | 8.8% | 1.9%(+6.96)#23 | 1.2%(+7.64)#284 |
| 24. | Hewlett Harbor | 8.8% | 1.9%(+6.95)#24 | 1.2%(+7.63)#285 |
| 25. | Irvington | 8.7% | 1.9%(+6.84)#25 | 1.2%(+7.52)#292 |
| 26. | Springs | 8.6% | 1.9%(+6.73)#26 | 1.2%(+7.41)#297 |
| 27. | Hillside | 8.5% | 1.9%(+6.62)#27 | 1.2%(+7.30)#308 |
| 28. | Roslyn Harbor | 8.4% | 1.9%(+6.49)#28 | 1.2%(+7.17)#315 |
| 29. | Port Henry | 8.3% | 1.9%(+6.47)#29 | 1.2%(+7.15)#316 |
| 30. | Long Lake | 8.2% | 1.9%(+6.38)#30 | 1.2%(+7.06)#324 |
| 31. | Bedford Hills | 8.2% | 1.9%(+6.32)#31 | 1.2%(+7.00)#328 |
| 32. | Bellerose | 8.1% | 1.9%(+6.24)#32 | 1.2%(+6.92)#336 |
| 33. | East Atlantic Beach | 7.8% | 1.9%(+5.95)#33 | 1.2%(+6.63)#352 |
| 34. | Munsey Park | 7.8% | 1.9%(+5.92)#34 | 1.2%(+6.60)#353 |
| 35. | Lawrence | 7.8% | 1.9%(+5.89)#35 | 1.2%(+6.57)#356 |
| 36. | Wanakah | 7.6% | 1.9%(+5.75)#36 | 1.2%(+6.43)#366 |
| 37. | Kensington | 7.6% | 1.9%(+5.70)#37 | 1.2%(+6.38)#369 |
| 38. | Aquebogue | 7.5% | 1.9%(+5.68)#38 | 1.2%(+6.36)#373 |
| 39. | Jamesport | 7.5% | 1.9%(+5.64)#39 | 1.2%(+6.32)#377 |
| 40. | Bronxville | 7.5% | 1.9%(+5.63)#40 | 1.2%(+6.31)#378 |
| 41. | Larchmont | 7.5% | 1.9%(+5.62)#41 | 1.2%(+6.30)#382 |
| 42. | Garden City | 7.4% | 1.9%(+5.57)#42 | 1.2%(+6.25)#387 |
| 43. | Rye | 7.4% | 1.9%(+5.49)#43 | 1.2%(+6.17)#396 |
| 44. | Fairport | 7.2% | 1.9%(+5.37)#44 | 1.2%(+6.05)#412 |
| 45. | Woodmere | 7.2% | 1.9%(+5.35)#45 | 1.2%(+6.03)#416 |
| 46. | Hastings On Hudson | 7.2% | 1.9%(+5.34)#46 | 1.2%(+6.02)#420 |
| 47. | Upper Brookville | 7.2% | 1.9%(+5.29)#47 | 1.2%(+5.97)#424 |
| 48. | West Nyack | 7.1% | 1.9%(+5.22)#48 | 1.2%(+5.90)#432 |
| 49. | Clarence Center | 7.0% | 1.9%(+5.16)#49 | 1.2%(+5.84)#437 |
| 50. | Cragsmoor | 7.0% | 1.9%(+5.15)#50 | 1.2%(+5.83)#439 |
| 51. | Orient | 7.0% | 1.9%(+5.15)#51 | 1.2%(+5.83)#441 |
| 52. | West Hampton Dunes | 6.9% | 1.9%(+5.08)#52 | 1.2%(+5.76)#447 |
| 53. | Port Washington | 6.9% | 1.9%(+5.02)#53 | 1.2%(+5.70)#453 |
| 54. | Hurleyville | 6.9% | 1.9%(+4.99)#54 | 1.2%(+5.67)#455 |
| 55. | Rockville Centre | 6.9% | 1.9%(+4.99)#55 | 1.2%(+5.67)#456 |
| 56. | Galway | 6.8% | 1.9%(+4.99)#56 | 1.2%(+5.67)#457 |
| 57. | Greenville Cdp Westchester County | 6.8% | 1.9%(+4.92)#57 | 1.2%(+5.60)#462 |
| 58. | Hewlett Neck | 6.8% | 1.9%(+4.90)#58 | 1.2%(+5.58)#465 |
| 59. | Orangeburg | 6.7% | 1.9%(+4.86)#59 | 1.2%(+5.54)#469 |
| 60. | Dover Plains | 6.6% | 1.9%(+4.78)#60 | 1.2%(+5.46)#485 |
| 61. | East Hills | 6.6% | 1.9%(+4.70)#61 | 1.2%(+5.38)#498 |
| 62. | Cedarhurst | 6.5% | 1.9%(+4.69)#62 | 1.2%(+5.36)#500 |
| 63. | Woodsburgh | 6.5% | 1.9%(+4.64)#63 | 1.2%(+5.32)#508 |
| 64. | Oyster Bay Cove | 6.5% | 1.9%(+4.64)#64 | 1.2%(+5.32)#510 |
| 65. | Thomaston | 6.5% | 1.9%(+4.61)#65 | 1.2%(+5.29)#516 |
| 66. | Wainscott | 6.5% | 1.9%(+4.60)#66 | 1.2%(+5.28)#520 |
| 67. | Unionville | 6.4% | 1.9%(+4.52)#67 | 1.2%(+5.20)#532 |
| 68. | Sea Cliff | 6.4% | 1.9%(+4.50)#68 | 1.2%(+5.18)#536 |
| 69. | Upper Nyack | 6.3% | 1.9%(+4.48)#69 | 1.2%(+5.16)#540 |
| 70. | Wesley Hills | 6.3% | 1.9%(+4.47)#70 | 1.2%(+5.15)#541 |
| 71. | Chappaqua | 6.3% | 1.9%(+4.47)#71 | 1.2%(+5.15)#542 |
| 72. | North Sea | 6.3% | 1.9%(+4.46)#72 | 1.2%(+5.14)#543 |
| 73. | Old Brookville | 6.3% | 1.9%(+4.42)#73 | 1.2%(+5.10)#550 |
| 74. | Melville | 6.3% | 1.9%(+4.39)#74 | 1.2%(+5.07)#556 |
| 75. | Cold Spring Harbor | 6.2% | 1.9%(+4.37)#75 | 1.2%(+5.05)#564 |
| 76. | West Hurley | 6.2% | 1.9%(+4.30)#76 | 1.2%(+4.98)#573 |
| 77. | Port Washington North | 6.1% | 1.9%(+4.27)#77 | 1.2%(+4.95)#575 |
| 78. | Altamont | 6.0% | 1.9%(+4.09)#78 | 1.2%(+4.77)#611 |
| 79. | Greenport West | 5.9% | 1.9%(+4.01)#79 | 1.2%(+4.69)#627 |
| 80. | Baxter Estates | 5.9% | 1.9%(+4.00)#80 | 1.2%(+4.68)#629 |
| 81. | Bedford | 5.9% | 1.9%(+3.99)#81 | 1.2%(+4.67)#633 |
| 82. | Scotts Corners | 5.8% | 1.9%(+3.91)#82 | 1.2%(+4.59)#646 |
| 83. | Tuckahoe | 5.8% | 1.9%(+3.91)#83 | 1.2%(+4.58)#647 |
| 84. | Pelham | 5.7% | 1.9%(+3.88)#84 | 1.2%(+4.56)#651 |
| 85. | Quiogue | 5.7% | 1.9%(+3.88)#85 | 1.2%(+4.56)#652 |
| 86. | North Hills | 5.7% | 1.9%(+3.84)#86 | 1.2%(+4.52)#662 |
| 87. | Montebello | 5.6% | 1.9%(+3.76)#87 | 1.2%(+4.44)#675 |
| 88. | Stannards | 5.6% | 1.9%(+3.76)#88 | 1.2%(+4.44)#678 |
| 89. | Westhampton Beach | 5.6% | 1.9%(+3.74)#89 | 1.2%(+4.42)#685 |
| 90. | Roslyn Heights | 5.6% | 1.9%(+3.70)#90 | 1.2%(+4.38)#699 |
| 91. | Schoharie | 5.6% | 1.9%(+3.69)#91 | 1.2%(+4.37)#700 |
| 92. | South Hempstead | 5.4% | 1.9%(+3.58)#92 | 1.2%(+4.26)#719 |
| 93. | Huntington | 5.4% | 1.9%(+3.57)#93 | 1.2%(+4.24)#723 |
| 94. | Copake Lake | 5.4% | 1.9%(+3.53)#94 | 1.2%(+4.21)#732 |
| 95. | Loudonville | 5.4% | 1.9%(+3.51)#95 | 1.2%(+4.19)#736 |
| 96. | Downsville | 5.3% | 1.9%(+3.48)#96 | 1.2%(+4.16)#746 |
| 97. | Pelham Manor | 5.3% | 1.9%(+3.44)#97 | 1.2%(+4.12)#755 |
| 98. | Old Westbury | 5.3% | 1.9%(+3.42)#98 | 1.2%(+4.09)#759 |
| 99. | Millbrook | 5.2% | 1.9%(+3.36)#99 | 1.2%(+4.04)#775 |
| 100. | Mill Neck | 5.2% | 1.9%(+3.36)#100 | 1.2%(+4.04)#777 |
Common Questions
What are the Top 10 Cities with the Highest Percentage of Population Employed in Legal Services & Support in New York?
Top 10 Cities with the Highest Percentage of Population Employed in Legal Services & Support in New York are:
#1
28.2%
#2
25.2%
#3
21.8%
#4
20.3%
#5
19.1%
#6
16.8%
#7
16.5%
#8
14.6%
#9
12.7%
#10
12.0%
What city has the Highest Percentage of Population Employed in Legal Services & Support in New York?
Saddle Rock Estates has the Highest Percentage of Population Employed in Legal Services & Support in New York with 28.2%.
What is the Percentage of Population Employed in Legal Services & Support in the State of New York?
Percentage of Population Employed in Legal Services & Support in New York is 1.9%.
What is the Percentage of Population Employed in Legal Services & Support in the United States?
Percentage of Population Employed in Legal Services & Support in the United States is 1.2%.