West Menlo Park, CA Map & Demographics
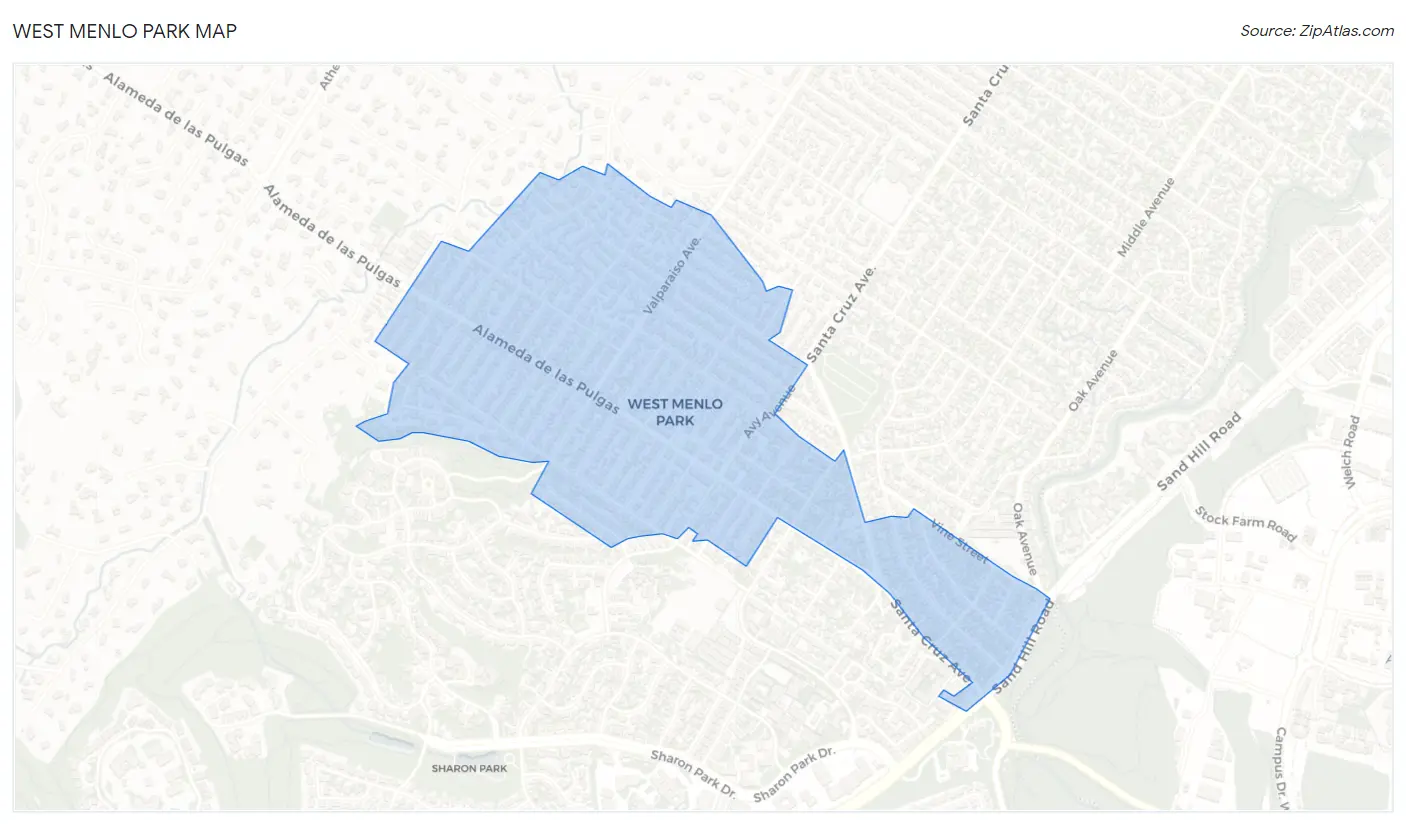
West Menlo Park Map
West Menlo Park Overview
$153,054
PER CAPITA INCOME
$250,001
AVG FAMILY INCOME
$250,001
AVG HOUSEHOLD INCOME
54.2%
WAGE / INCOME GAP [ % ]
45.8¢/ $1
WAGE / INCOME GAP [ $ ]
0.46
INEQUALITY / GINI INDEX
3,401
TOTAL POPULATION
1,579
MALE POPULATION
1,822
FEMALE POPULATION
86.66
MALES / 100 FEMALES
115.39
FEMALES / 100 MALES
39.4
MEDIAN AGE
3.2
AVG FAMILY SIZE
2.8
AVG HOUSEHOLD SIZE
1,693
LABOR FORCE [ PEOPLE ]
69.2%
PERCENT IN LABOR FORCE
4.1%
UNEMPLOYMENT RATE
West Menlo Park Area Codes
Income in West Menlo Park
Income Overview in West Menlo Park
Per Capita Income in West Menlo Park is $153,054, while median incomes of families and households are $250,001 and $250,001 respectively.
| Characteristic | Number | Measure |
| Per Capita Income | 3,401 | $153,054 |
| Median Family Income | 939 | $250,001 |
| Mean Family Income | 939 | $478,684 |
| Median Household Income | 1,193 | $250,001 |
| Mean Household Income | 1,193 | $435,397 |
| Income Deficit | 939 | $0 |
| Wage / Income Gap (%) | 3,401 | 54.21% |
| Wage / Income Gap ($) | 3,401 | 45.79¢ per $1 |
| Gini / Inequality Index | 3,401 | 0.46 |
Earnings by Sex in West Menlo Park
Average Earnings in West Menlo Park are $153,910, $250,001 for men and $114,464 for women, a difference of 54.2%.
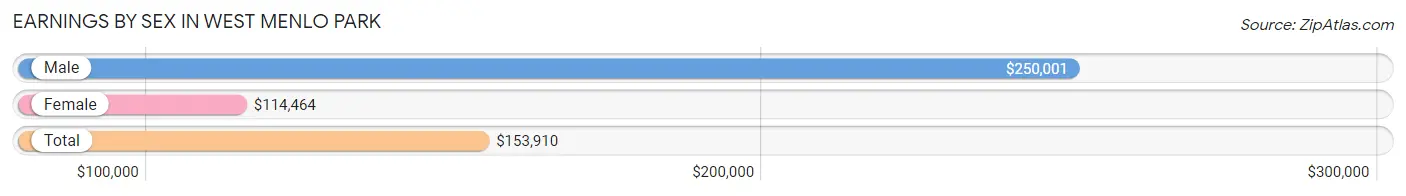
| Sex | Number | Average Earnings |
| Male | 924 (53.1%) | $250,001 |
| Female | 816 (46.9%) | $114,464 |
| Total | 1,740 (100.0%) | $153,910 |
Earnings by Sex by Income Bracket in West Menlo Park
The most common earnings brackets in West Menlo Park are $100,000+ for men (723 | 78.2%) and $100,000+ for women (431 | 52.8%).
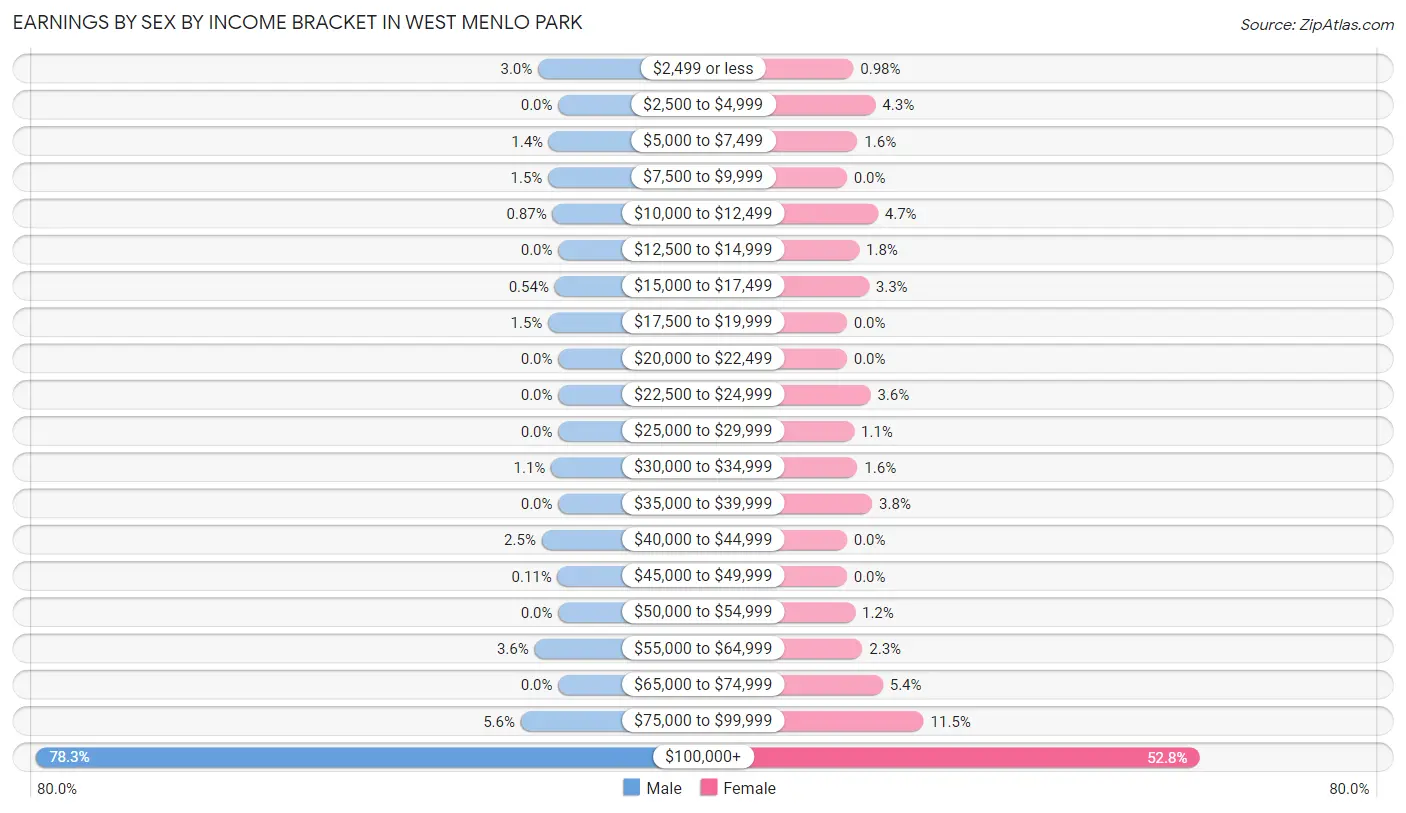
| Income | Male | Female |
| $2,499 or less | 28 (3.0%) | 8 (1.0%) |
| $2,500 to $4,999 | 0 (0.0%) | 35 (4.3%) |
| $5,000 to $7,499 | 13 (1.4%) | 13 (1.6%) |
| $7,500 to $9,999 | 14 (1.5%) | 0 (0.0%) |
| $10,000 to $12,499 | 8 (0.9%) | 38 (4.7%) |
| $12,500 to $14,999 | 0 (0.0%) | 15 (1.8%) |
| $15,000 to $17,499 | 5 (0.5%) | 27 (3.3%) |
| $17,500 to $19,999 | 14 (1.5%) | 0 (0.0%) |
| $20,000 to $22,499 | 0 (0.0%) | 0 (0.0%) |
| $22,500 to $24,999 | 0 (0.0%) | 29 (3.5%) |
| $25,000 to $29,999 | 0 (0.0%) | 9 (1.1%) |
| $30,000 to $34,999 | 10 (1.1%) | 13 (1.6%) |
| $35,000 to $39,999 | 0 (0.0%) | 31 (3.8%) |
| $40,000 to $44,999 | 23 (2.5%) | 0 (0.0%) |
| $45,000 to $49,999 | 1 (0.1%) | 0 (0.0%) |
| $50,000 to $54,999 | 0 (0.0%) | 10 (1.2%) |
| $55,000 to $64,999 | 33 (3.6%) | 19 (2.3%) |
| $65,000 to $74,999 | 0 (0.0%) | 44 (5.4%) |
| $75,000 to $99,999 | 52 (5.6%) | 94 (11.5%) |
| $100,000+ | 723 (78.2%) | 431 (52.8%) |
| Total | 924 (100.0%) | 816 (100.0%) |
Earnings by Sex by Educational Attainment in West Menlo Park
Average earnings in West Menlo Park are $250,001 for men and $116,595 for women, a difference of 53.4%. Men with an educational attainment of graduate degree enjoy the highest average annual earnings of $250,001, while those with college or associate's degree education earn the least with $102,083. Women with an educational attainment of graduate degree earn the most with the average annual earnings of $165,313, while those with bachelor's degree education have the smallest earnings of $99,583.
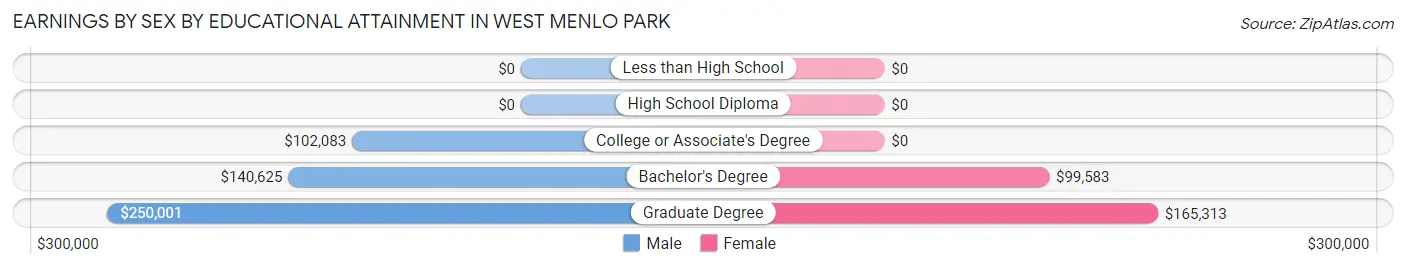
| Educational Attainment | Male Income | Female Income |
| Less than High School | - | - |
| High School Diploma | - | - |
| College or Associate's Degree | $102,083 | $0 |
| Bachelor's Degree | $140,625 | $99,583 |
| Graduate Degree | $250,001 | $165,313 |
| Total | $250,001 | $116,595 |
Family Income in West Menlo Park
Family Income Brackets in West Menlo Park
According to the West Menlo Park family income data, there are 674 families falling into the $200,000+ income range, which is the most common income bracket and makes up 71.8% of all families.
| Income Bracket | # Families | % Families |
| Less than $10,000 | 10 | 1.1% |
| $10,000 to $14,999 | 0 | 0.0% |
| $15,000 to $24,999 | 0 | 0.0% |
| $25,000 to $34,999 | 0 | 0.0% |
| $35,000 to $49,999 | 0 | 0.0% |
| $50,000 to $74,999 | 11 | 1.2% |
| $75,000 to $99,999 | 61 | 6.5% |
| $100,000 to $149,999 | 71 | 7.6% |
| $150,000 to $199,999 | 112 | 11.9% |
| $200,000+ | 674 | 71.8% |
Family Income by Famaliy Size in West Menlo Park
2-person families (309 | 32.9%) account for the highest median family income in West Menlo Park with $250,001 per family, while 2-person families (309 | 32.9%) have the highest median income of $125,000 per family member.
| Income Bracket | # Families | Median Income |
| 2-Person Families | 309 (32.9%) | $250,001 |
| 3-Person Families | 248 (26.4%) | $250,001 |
| 4-Person Families | 339 (36.1%) | $250,001 |
| 5-Person Families | 29 (3.1%) | $0 |
| 6-Person Families | 14 (1.5%) | $0 |
| 7+ Person Families | 0 (0.0%) | $0 |
| Total | 939 (100.0%) | $250,001 |
Family Income by Number of Earners in West Menlo Park
The median family income in West Menlo Park is $250,001, with families comprising no earners (83) having the highest median family income of $250,001, while families with 1 earner (337) have the lowest median family income of $195,469, accounting for 8.8% and 35.9% of families, respectively.
| Number of Earners | # Families | Median Income |
| No Earners | 83 (8.8%) | $250,001 |
| 1 Earner | 337 (35.9%) | $195,469 |
| 2 Earners | 464 (49.4%) | $250,001 |
| 3+ Earners | 55 (5.9%) | $224,886 |
| Total | 939 (100.0%) | $250,001 |
Household Income in West Menlo Park
Household Income Brackets in West Menlo Park
With 771 households falling in the category, the $200,000+ income range is the most frequent in West Menlo Park, accounting for 64.6% of all households.
| Income Bracket | # Households | % Households |
| Less than $10,000 | 10 | 0.8% |
| $10,000 to $14,999 | 38 | 3.2% |
| $15,000 to $24,999 | 7 | 0.6% |
| $25,000 to $34,999 | 0 | 0.0% |
| $35,000 to $49,999 | 27 | 2.3% |
| $50,000 to $74,999 | 47 | 3.9% |
| $75,000 to $99,999 | 72 | 6.0% |
| $100,000 to $149,999 | 113 | 9.5% |
| $150,000 to $199,999 | 109 | 9.1% |
| $200,000+ | 771 | 64.6% |
Household Income by Householder Age in West Menlo Park
The median household income in West Menlo Park is $250,001, with the highest median household income of $250,001 found in the 25 to 44 years age bracket for the primary householder. A total of 365 households (30.6%) fall into this category.
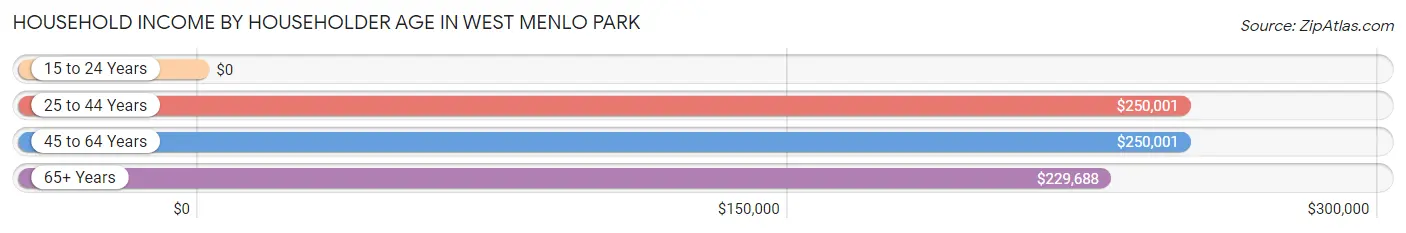
| Income Bracket | # Households | Median Income |
| 15 to 24 Years | 0 (0.0%) | $0 |
| 25 to 44 Years | 365 (30.6%) | $250,001 |
| 45 to 64 Years | 626 (52.5%) | $250,001 |
| 65+ Years | 202 (16.9%) | $229,688 |
| Total | 1,193 (100.0%) | $250,001 |
Poverty in West Menlo Park
Income Below Poverty by Sex and Age in West Menlo Park
With 0.8% poverty level for males and 7.0% for females among the residents of West Menlo Park, 55 to 64 year old males and 15 year old females are the most vulnerable to poverty, with 13 males (6.7%) and 12 females (66.7%) in their respective age groups living below the poverty level.
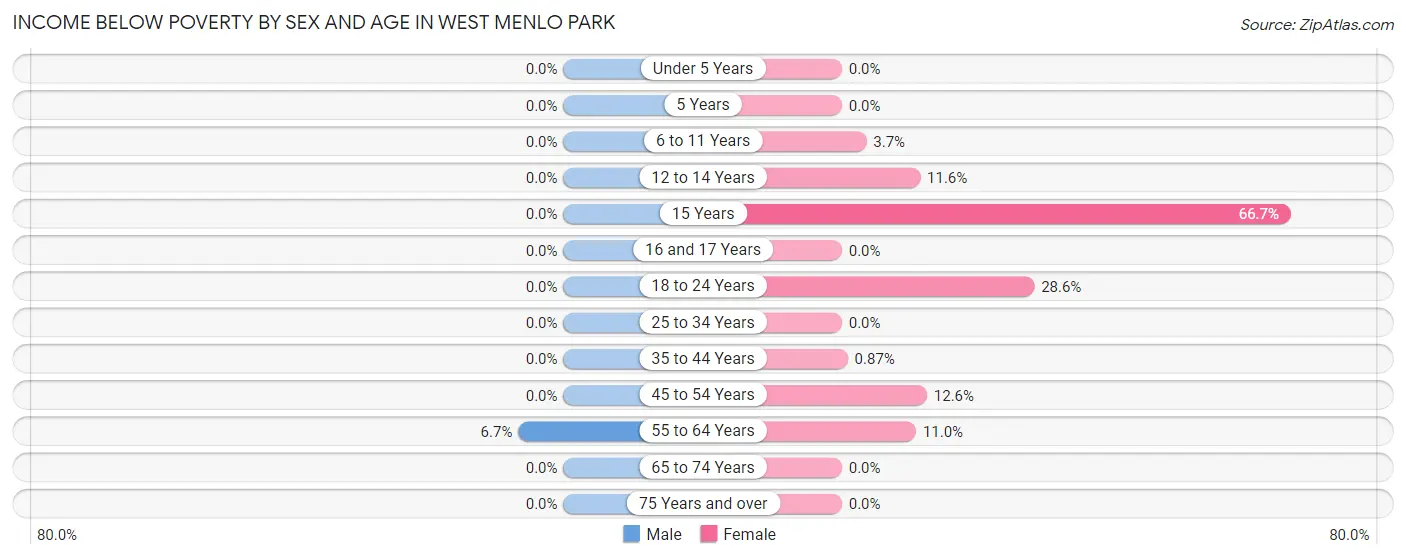
| Age Bracket | Male | Female |
| Under 5 Years | 0 (0.0%) | 0 (0.0%) |
| 5 Years | 0 (0.0%) | 0 (0.0%) |
| 6 to 11 Years | 0 (0.0%) | 11 (3.6%) |
| 12 to 14 Years | 0 (0.0%) | 10 (11.6%) |
| 15 Years | 0 (0.0%) | 12 (66.7%) |
| 16 and 17 Years | 0 (0.0%) | 0 (0.0%) |
| 18 to 24 Years | 0 (0.0%) | 18 (28.6%) |
| 25 to 34 Years | 0 (0.0%) | 0 (0.0%) |
| 35 to 44 Years | 0 (0.0%) | 2 (0.9%) |
| 45 to 54 Years | 0 (0.0%) | 49 (12.6%) |
| 55 to 64 Years | 13 (6.7%) | 25 (11.0%) |
| 65 to 74 Years | 0 (0.0%) | 0 (0.0%) |
| 75 Years and over | 0 (0.0%) | 0 (0.0%) |
| Total | 13 (0.8%) | 127 (7.0%) |
Income Above Poverty by Sex and Age in West Menlo Park
According to the poverty statistics in West Menlo Park, males aged under 5 years and females aged under 5 years are the age groups that are most secure financially, with 100.0% of males and 100.0% of females in these age groups living above the poverty line.
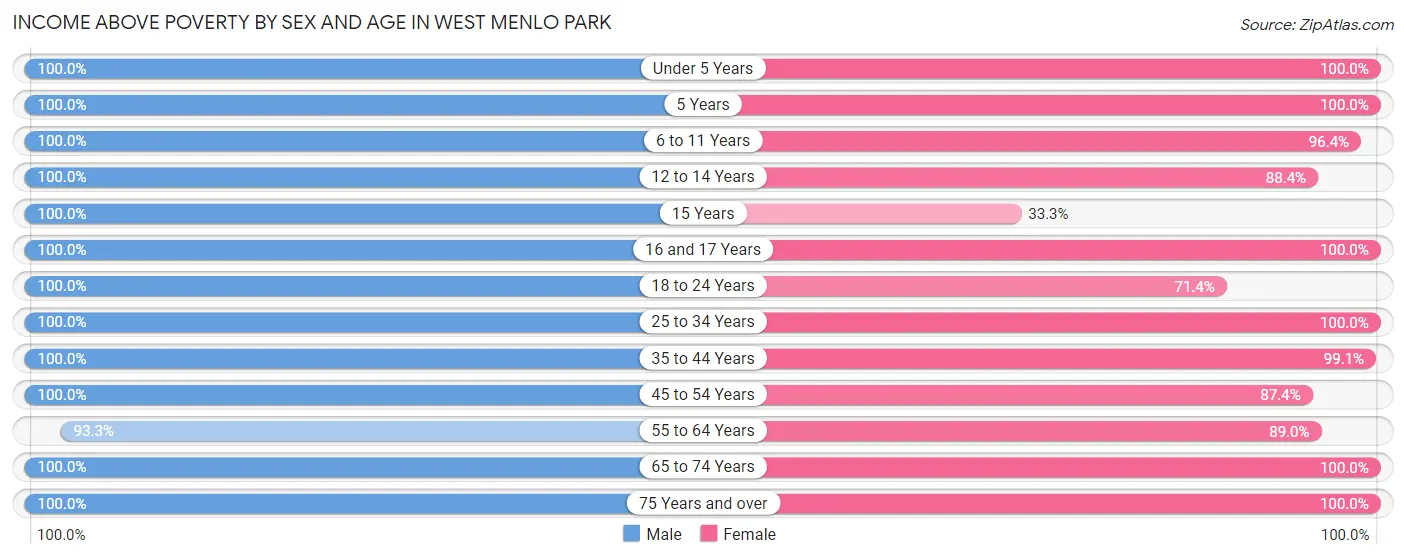
| Age Bracket | Male | Female |
| Under 5 Years | 123 (100.0%) | 93 (100.0%) |
| 5 Years | 36 (100.0%) | 18 (100.0%) |
| 6 to 11 Years | 174 (100.0%) | 290 (96.4%) |
| 12 to 14 Years | 75 (100.0%) | 76 (88.4%) |
| 15 Years | 29 (100.0%) | 6 (33.3%) |
| 16 and 17 Years | 58 (100.0%) | 58 (100.0%) |
| 18 to 24 Years | 73 (100.0%) | 45 (71.4%) |
| 25 to 34 Years | 150 (100.0%) | 146 (100.0%) |
| 35 to 44 Years | 176 (100.0%) | 228 (99.1%) |
| 45 to 54 Years | 331 (100.0%) | 339 (87.4%) |
| 55 to 64 Years | 181 (93.3%) | 202 (89.0%) |
| 65 to 74 Years | 100 (100.0%) | 97 (100.0%) |
| 75 Years and over | 60 (100.0%) | 92 (100.0%) |
| Total | 1,566 (99.2%) | 1,690 (93.0%) |
Income Below Poverty Among Married-Couple Families in West Menlo Park
The poverty statistics for married-couple families in West Menlo Park show that 1.3% or 10 of the total 796 families live below the poverty line. Families with 3 or 4 children have the highest poverty rate of 38.5%, comprising of 10 families. On the other hand, families with no children have the lowest poverty rate of 0.0%, which includes 0 families.
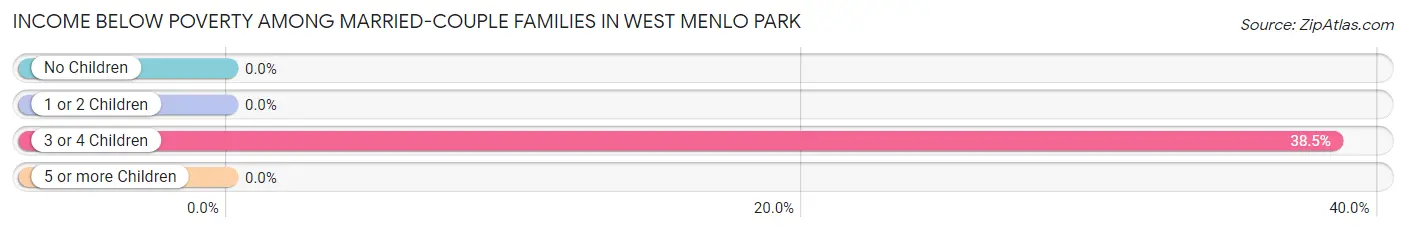
| Children | Above Poverty | Below Poverty |
| No Children | 307 (100.0%) | 0 (0.0%) |
| 1 or 2 Children | 463 (100.0%) | 0 (0.0%) |
| 3 or 4 Children | 16 (61.5%) | 10 (38.5%) |
| 5 or more Children | 0 (0.0%) | 0 (0.0%) |
| Total | 786 (98.7%) | 10 (1.3%) |
Income Below Poverty Among Single-Parent Households in West Menlo Park
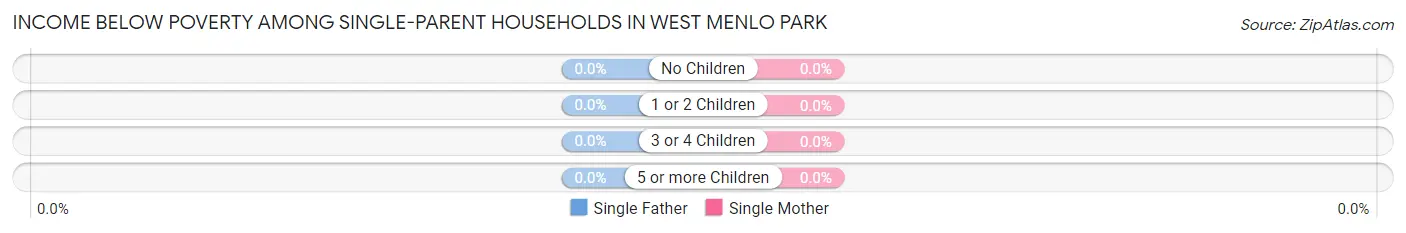
| Children | Single Father | Single Mother |
| No Children | 0 (0.0%) | 0 (0.0%) |
| 1 or 2 Children | 0 (0.0%) | 0 (0.0%) |
| 3 or 4 Children | 0 (0.0%) | 0 (0.0%) |
| 5 or more Children | 0 (0.0%) | 0 (0.0%) |
| Total | 0 (0.0%) | 0 (0.0%) |
Income Below Poverty Among Married-Couple vs Single-Parent Households in West Menlo Park
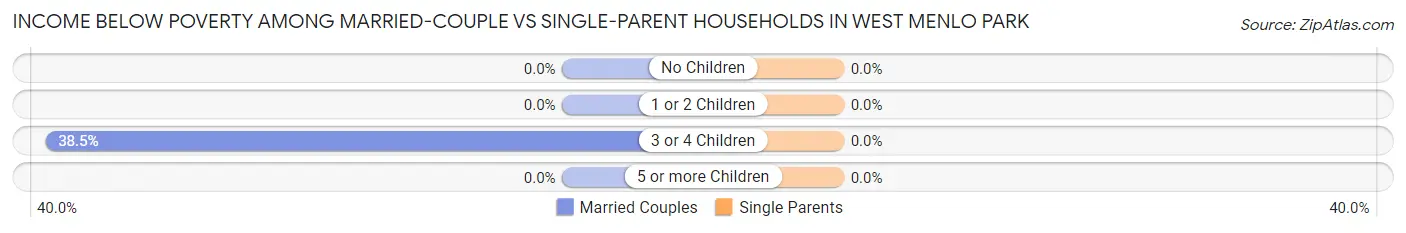
| Children | Married-Couple Families | Single-Parent Households |
| No Children | 0 (0.0%) | 0 (0.0%) |
| 1 or 2 Children | 0 (0.0%) | 0 (0.0%) |
| 3 or 4 Children | 10 (38.5%) | 0 (0.0%) |
| 5 or more Children | 0 (0.0%) | 0 (0.0%) |
| Total | 10 (1.3%) | 0 (0.0%) |
Race in West Menlo Park
The most populous races in West Menlo Park are White / Caucasian (2,540 | 74.7%), Asian (571 | 16.8%), and Two or more Races (276 | 8.1%).
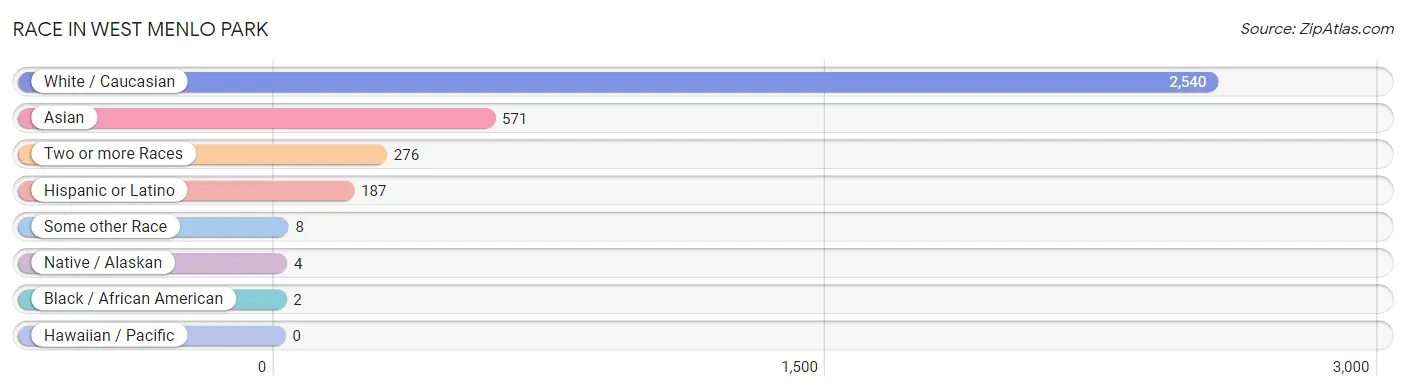
| Race | # Population | % Population |
| Asian | 571 | 16.8% |
| Black / African American | 2 | 0.1% |
| Hawaiian / Pacific | 0 | 0.0% |
| Hispanic or Latino | 187 | 5.5% |
| Native / Alaskan | 4 | 0.1% |
| White / Caucasian | 2,540 | 74.7% |
| Two or more Races | 276 | 8.1% |
| Some other Race | 8 | 0.2% |
| Total | 3,401 | 100.0% |
Ancestry in West Menlo Park
The most populous ancestries reported in West Menlo Park are German (587 | 17.3%), English (548 | 16.1%), Irish (465 | 13.7%), Indian (Asian) (376 | 11.1%), and Italian (311 | 9.1%), together accounting for 67.2% of all West Menlo Park residents.
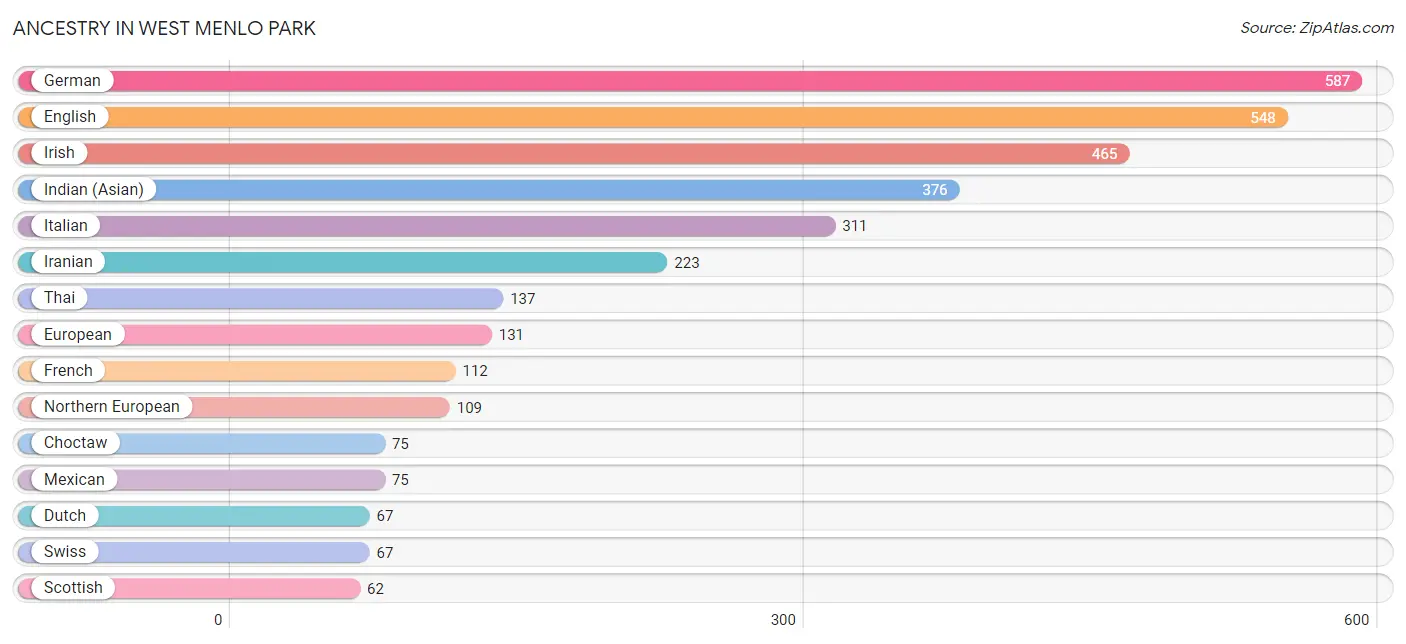
| Ancestry | # Population | % Population |
| Alsatian | 11 | 0.3% |
| American | 7 | 0.2% |
| Argentinean | 27 | 0.8% |
| Bhutanese | 13 | 0.4% |
| British | 37 | 1.1% |
| Bulgarian | 38 | 1.1% |
| Burmese | 31 | 0.9% |
| Central American | 7 | 0.2% |
| Cherokee | 13 | 0.4% |
| Chippewa | 14 | 0.4% |
| Choctaw | 75 | 2.2% |
| Czech | 14 | 0.4% |
| Danish | 11 | 0.3% |
| Dutch | 67 | 2.0% |
| Eastern European | 6 | 0.2% |
| English | 548 | 16.1% |
| European | 131 | 3.8% |
| Filipino | 36 | 1.1% |
| Finnish | 14 | 0.4% |
| French | 112 | 3.3% |
| French Canadian | 15 | 0.4% |
| German | 587 | 17.3% |
| Honduran | 7 | 0.2% |
| Indian (Asian) | 376 | 11.1% |
| Iranian | 223 | 6.6% |
| Irish | 465 | 13.7% |
| Israeli | 13 | 0.4% |
| Italian | 311 | 9.1% |
| Korean | 49 | 1.4% |
| Mexican | 75 | 2.2% |
| Northern European | 109 | 3.2% |
| Norwegian | 37 | 1.1% |
| Ottawa | 4 | 0.1% |
| Pakistani | 19 | 0.6% |
| Polish | 55 | 1.6% |
| Portuguese | 48 | 1.4% |
| Russian | 58 | 1.7% |
| Scotch-Irish | 41 | 1.2% |
| Scottish | 62 | 1.8% |
| Slovak | 8 | 0.2% |
| South American | 27 | 0.8% |
| Spaniard | 41 | 1.2% |
| Spanish | 36 | 1.1% |
| Swedish | 50 | 1.5% |
| Swiss | 67 | 2.0% |
| Thai | 137 | 4.0% |
| Turkish | 11 | 0.3% |
| Ukrainian | 10 | 0.3% |
| Welsh | 11 | 0.3% | View All 49 Rows |
Immigrants in West Menlo Park
The most numerous immigrant groups reported in West Menlo Park came from Asia (478 | 14.1%), South Central Asia (232 | 6.8%), China (202 | 5.9%), Eastern Asia (202 | 5.9%), and Europe (139 | 4.1%), together accounting for 36.8% of all West Menlo Park residents.
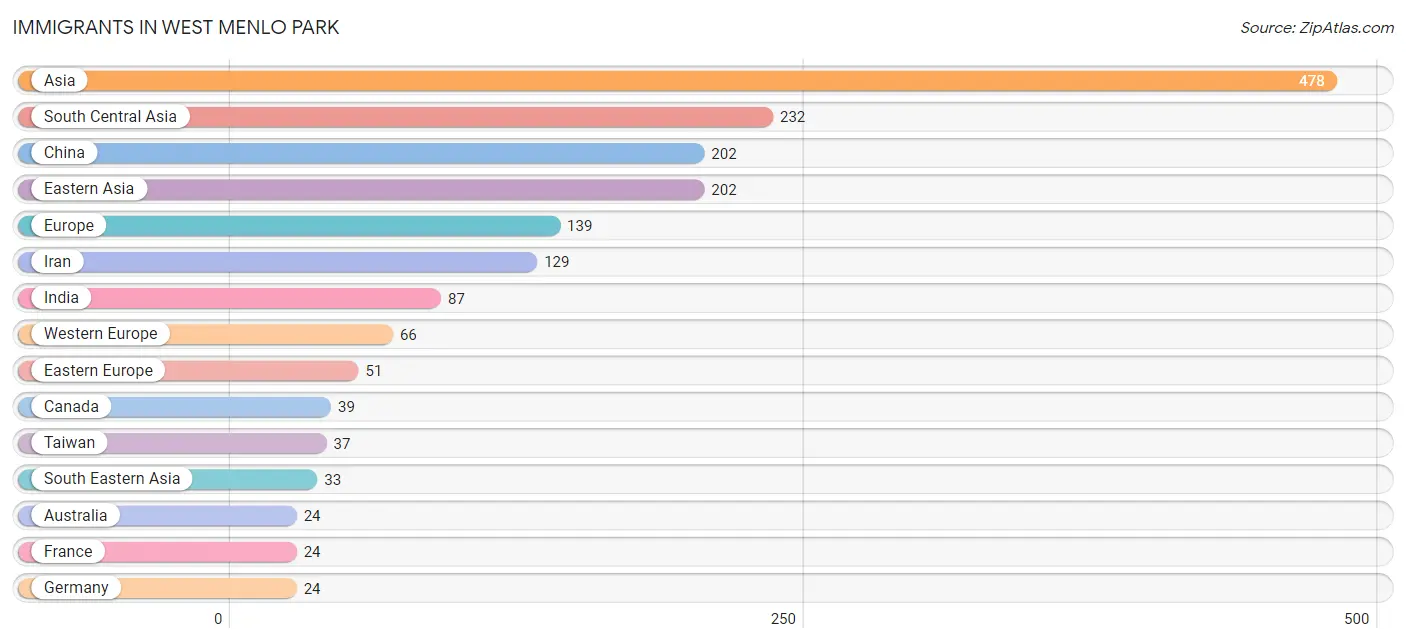
| Immigration Origin | # Population | % Population |
| Asia | 478 | 14.1% |
| Australia | 24 | 0.7% |
| Bulgaria | 19 | 0.6% |
| Canada | 39 | 1.1% |
| Central America | 7 | 0.2% |
| China | 202 | 5.9% |
| Czechoslovakia | 8 | 0.2% |
| Eastern Asia | 202 | 5.9% |
| Eastern Europe | 51 | 1.5% |
| Europe | 139 | 4.1% |
| France | 24 | 0.7% |
| Germany | 24 | 0.7% |
| Honduras | 7 | 0.2% |
| Hong Kong | 16 | 0.5% |
| India | 87 | 2.6% |
| Iran | 129 | 3.8% |
| Latin America | 7 | 0.2% |
| Northern Europe | 22 | 0.6% |
| Oceania | 24 | 0.7% |
| Pakistan | 16 | 0.5% |
| Philippines | 19 | 0.6% |
| Poland | 10 | 0.3% |
| Russia | 10 | 0.3% |
| Singapore | 14 | 0.4% |
| South Central Asia | 232 | 6.8% |
| South Eastern Asia | 33 | 1.0% |
| Switzerland | 18 | 0.5% |
| Taiwan | 37 | 1.1% |
| Turkey | 11 | 0.3% |
| Western Asia | 11 | 0.3% |
| Western Europe | 66 | 1.9% | View All 31 Rows |
Sex and Age in West Menlo Park
Sex and Age in West Menlo Park
The most populous age groups in West Menlo Park are 50 to 54 Years (200 | 12.7%) for men and 45 to 49 Years (229 | 12.6%) for women.
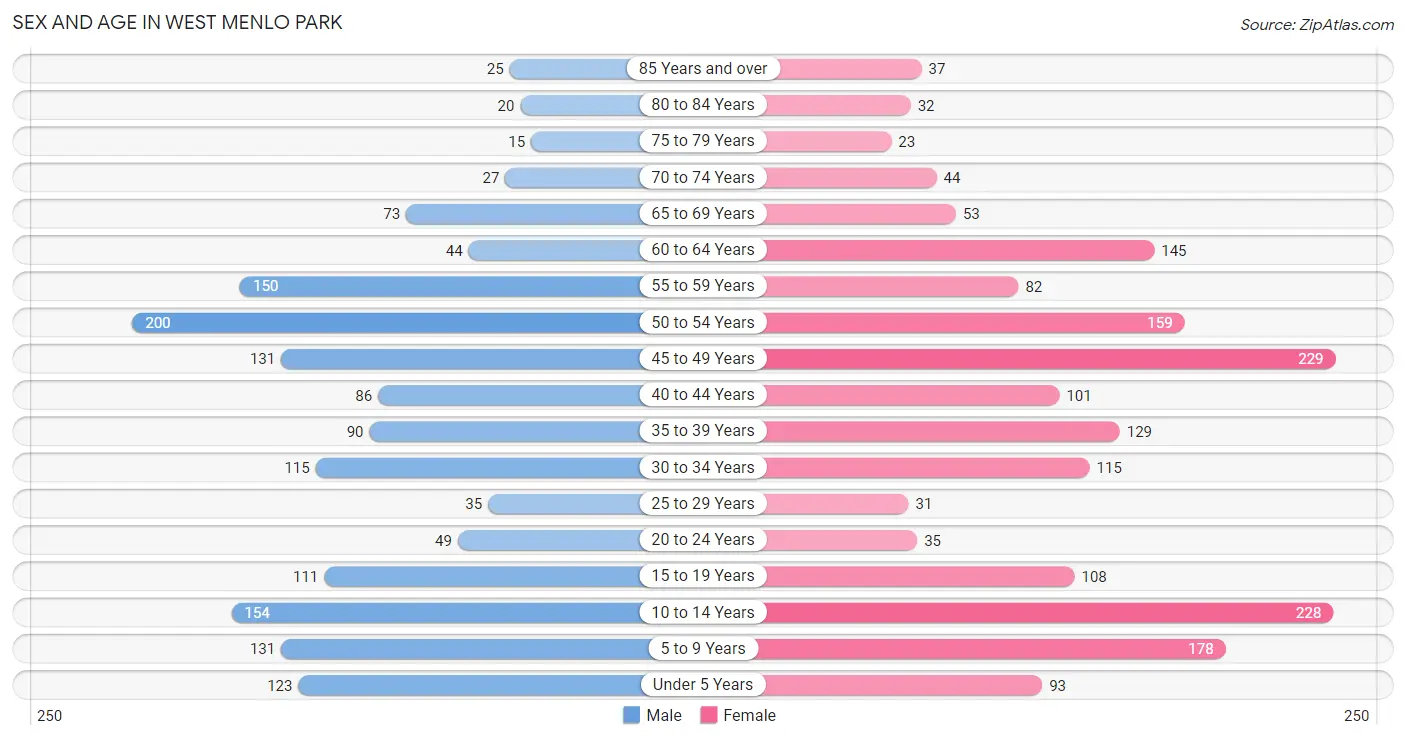
| Age Bracket | Male | Female |
| Under 5 Years | 123 (7.8%) | 93 (5.1%) |
| 5 to 9 Years | 131 (8.3%) | 178 (9.8%) |
| 10 to 14 Years | 154 (9.8%) | 228 (12.5%) |
| 15 to 19 Years | 111 (7.0%) | 108 (5.9%) |
| 20 to 24 Years | 49 (3.1%) | 35 (1.9%) |
| 25 to 29 Years | 35 (2.2%) | 31 (1.7%) |
| 30 to 34 Years | 115 (7.3%) | 115 (6.3%) |
| 35 to 39 Years | 90 (5.7%) | 129 (7.1%) |
| 40 to 44 Years | 86 (5.4%) | 101 (5.5%) |
| 45 to 49 Years | 131 (8.3%) | 229 (12.6%) |
| 50 to 54 Years | 200 (12.7%) | 159 (8.7%) |
| 55 to 59 Years | 150 (9.5%) | 82 (4.5%) |
| 60 to 64 Years | 44 (2.8%) | 145 (8.0%) |
| 65 to 69 Years | 73 (4.6%) | 53 (2.9%) |
| 70 to 74 Years | 27 (1.7%) | 44 (2.4%) |
| 75 to 79 Years | 15 (0.9%) | 23 (1.3%) |
| 80 to 84 Years | 20 (1.3%) | 32 (1.8%) |
| 85 Years and over | 25 (1.6%) | 37 (2.0%) |
| Total | 1,579 (100.0%) | 1,822 (100.0%) |
Families and Households in West Menlo Park
Median Family Size in West Menlo Park
The median family size in West Menlo Park is 3.24 persons per family, with married-couple families (796 | 84.8%) accounting for the largest median family size of 3.27 persons per family. On the other hand, single male/father families (39 | 4.2%) represent the smallest median family size with 2.67 persons per family.
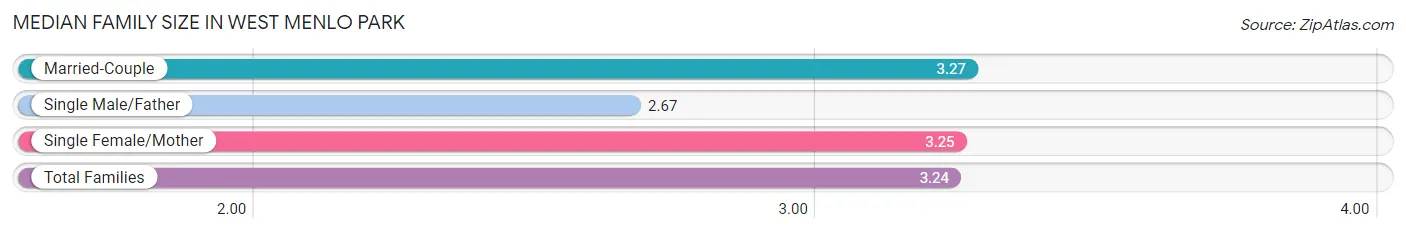
| Family Type | # Families | Family Size |
| Married-Couple | 796 (84.8%) | 3.27 |
| Single Male/Father | 39 (4.2%) | 2.67 |
| Single Female/Mother | 104 (11.1%) | 3.25 |
| Total Families | 939 (100.0%) | 3.24 |
Median Household Size in West Menlo Park
The median household size in West Menlo Park is 2.84 persons per household, with married-couple households (796 | 66.7%) accounting for the largest median household size of 3.32 persons per household. non-family households (254 | 21.3%) represent the smallest median household size with 1.13 persons per household.
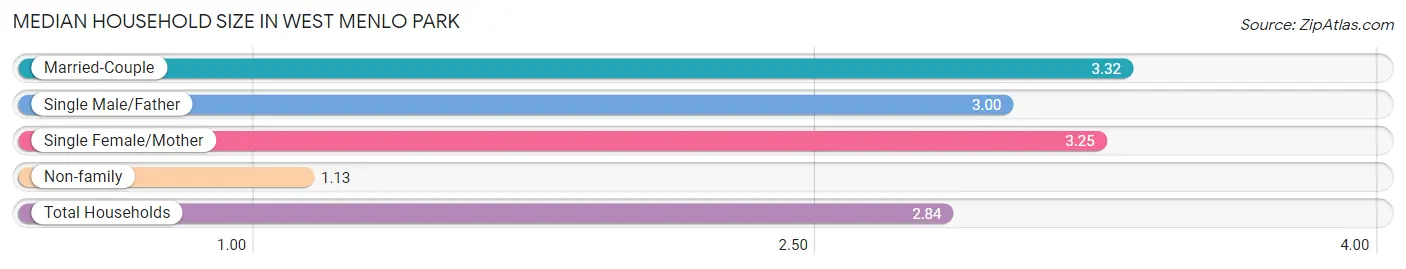
| Household Type | # Households | Household Size |
| Married-Couple | 796 (66.7%) | 3.32 |
| Single Male/Father | 39 (3.3%) | 3.00 |
| Single Female/Mother | 104 (8.7%) | 3.25 |
| Non-family | 254 (21.3%) | 1.13 |
| Total Households | 1,193 (100.0%) | 2.84 |
Household Size by Marriage Status in West Menlo Park
Out of a total of 1,193 households in West Menlo Park, 939 (78.7%) are family households, while 254 (21.3%) are nonfamily households. The most numerous type of family households are 4-person households, comprising 322, and the most common type of nonfamily households are 1-person households, comprising 223.
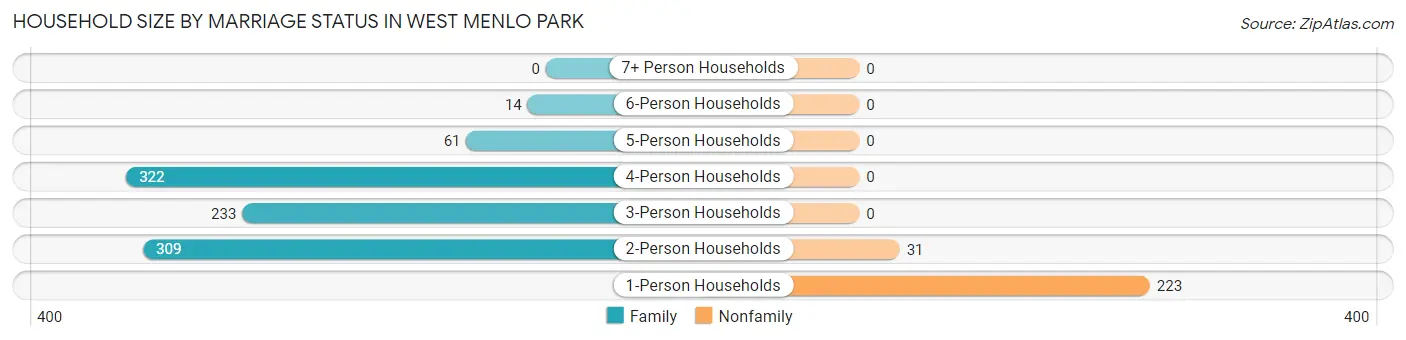
| Household Size | Family Households | Nonfamily Households |
| 1-Person Households | - | 223 (18.7%) |
| 2-Person Households | 309 (25.9%) | 31 (2.6%) |
| 3-Person Households | 233 (19.5%) | 0 (0.0%) |
| 4-Person Households | 322 (27.0%) | 0 (0.0%) |
| 5-Person Households | 61 (5.1%) | 0 (0.0%) |
| 6-Person Households | 14 (1.2%) | 0 (0.0%) |
| 7+ Person Households | 0 (0.0%) | 0 (0.0%) |
| Total | 939 (78.7%) | 254 (21.3%) |
Female Fertility in West Menlo Park
Fertility by Age in West Menlo Park
Average fertility rate in West Menlo Park is 51.0 births per 1,000 women. Women in the age bracket of 35 to 50 years have the highest fertility rate with 68.0 births per 1,000 women. Women in the age bracket of 35 to 50 years acount for 82.1% of all women with births.
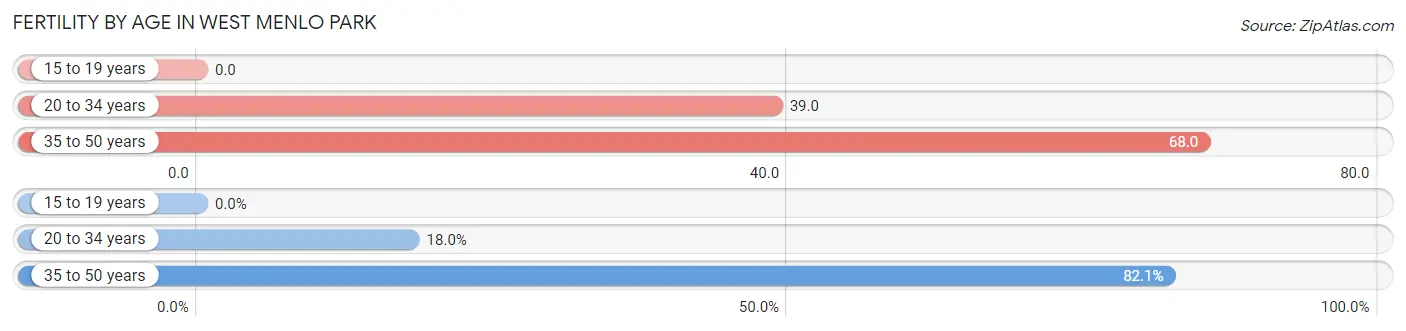
| Age Bracket | Women with Births | Births / 1,000 Women |
| 15 to 19 years | 0 (0.0%) | 0.0 |
| 20 to 34 years | 7 (17.9%) | 39.0 |
| 35 to 50 years | 32 (82.1%) | 68.0 |
| Total | 39 (100.0%) | 51.0 |
Fertility by Age by Marriage Status in West Menlo Park
66.7% of women with births (39) in West Menlo Park are married. The highest percentage of unmarried women with births falls into 35 to 50 years age bracket with 40.6% of them unmarried at the time of birth, while the lowest percentage of unmarried women with births belong to 20 to 34 years age bracket with 0.0% of them unmarried.
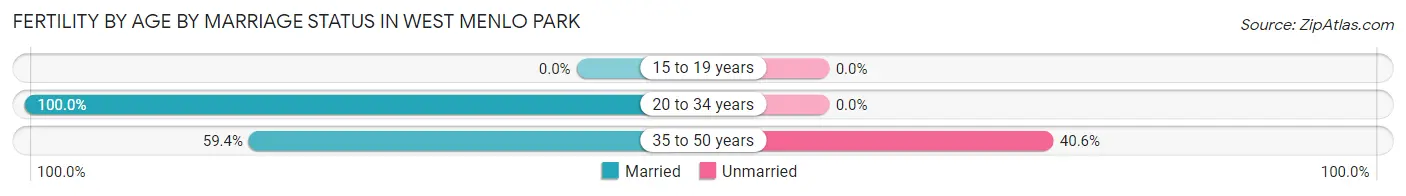
| Age Bracket | Married | Unmarried |
| 15 to 19 years | 0 (0.0%) | 0 (0.0%) |
| 20 to 34 years | 7 (100.0%) | 0 (0.0%) |
| 35 to 50 years | 19 (59.4%) | 13 (40.6%) |
| Total | 26 (66.7%) | 13 (33.3%) |
Fertility by Education in West Menlo Park
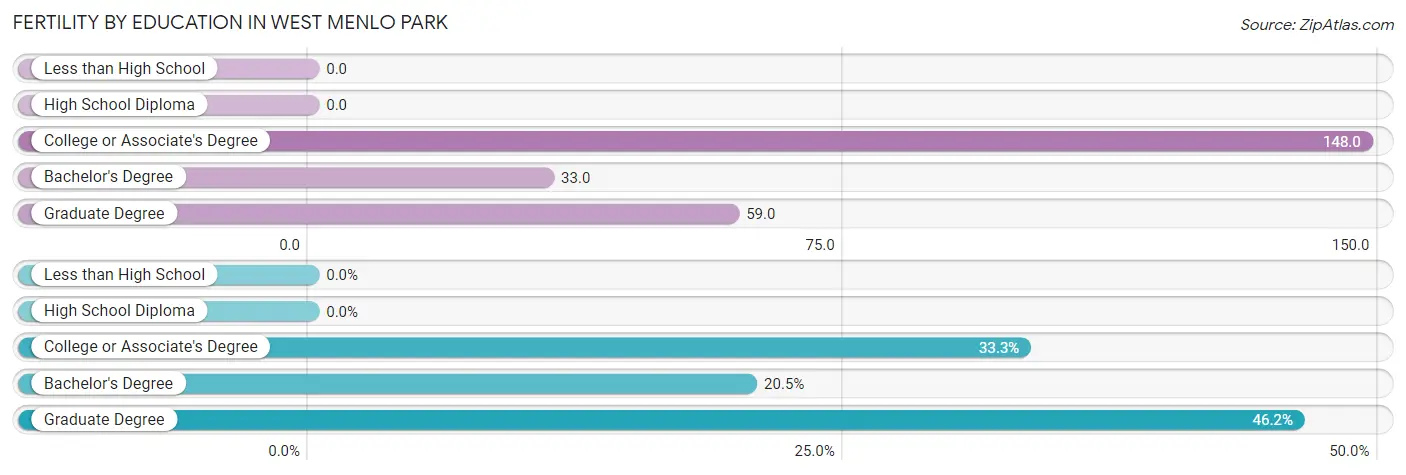
| Educational Attainment | Women with Births | Births / 1,000 Women |
| Less than High School | 0 (0.0%) | 0.0 |
| High School Diploma | 0 (0.0%) | 0.0 |
| College or Associate's Degree | 13 (33.3%) | 148.0 |
| Bachelor's Degree | 8 (20.5%) | 33.0 |
| Graduate Degree | 18 (46.2%) | 59.0 |
| Total | 39 (100.0%) | 51.0 |
Fertility by Education by Marriage Status in West Menlo Park
33.3% of women with births in West Menlo Park are unmarried. Women with the educational attainment of bachelor's degree are most likely to be married with 100.0% of them married at childbirth, while women with the educational attainment of college or associate's degree are least likely to be married with 100.0% of them unmarried at childbirth.
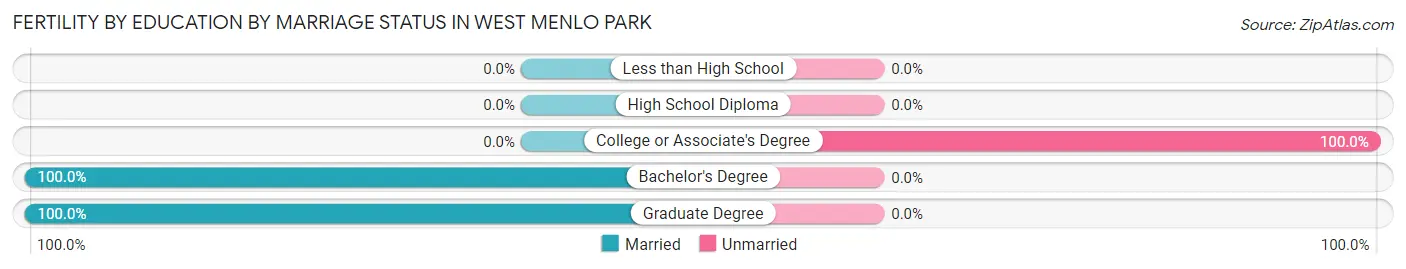
| Educational Attainment | Married | Unmarried |
| Less than High School | 0 (0.0%) | 0 (0.0%) |
| High School Diploma | 0 (0.0%) | 0 (0.0%) |
| College or Associate's Degree | 0 (0.0%) | 13 (100.0%) |
| Bachelor's Degree | 8 (100.0%) | 0 (0.0%) |
| Graduate Degree | 18 (100.0%) | 0 (0.0%) |
| Total | 26 (66.7%) | 13 (33.3%) |
Employment Characteristics in West Menlo Park
Employment by Class of Employer in West Menlo Park
Among the 1,573 employed individuals in West Menlo Park, private company employees (1,129 | 71.8%), not-for-profit organizations (181 | 11.5%), and self-employed (not incorporated) (106 | 6.7%) make up the most common classes of employment.
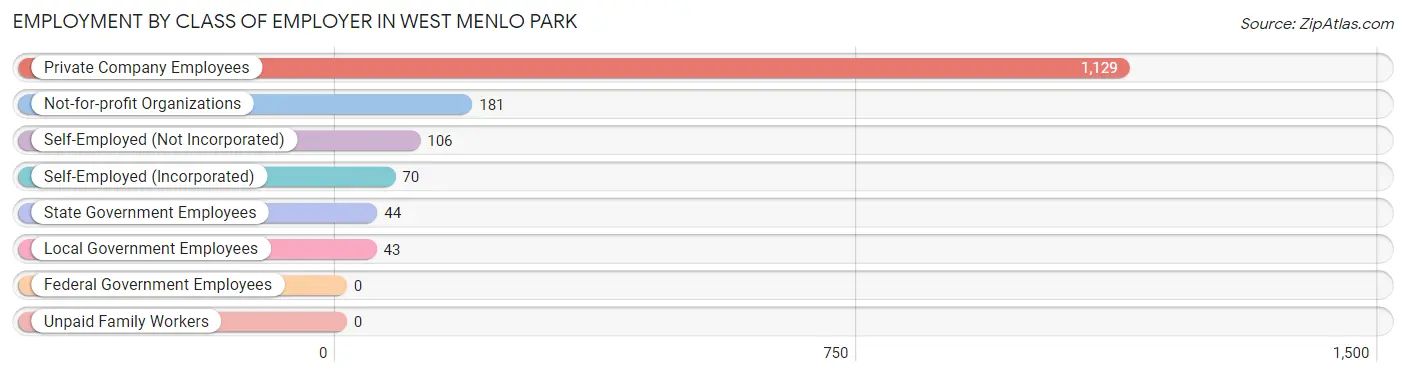
| Employer Class | # Employees | % Employees |
| Private Company Employees | 1,129 | 71.8% |
| Self-Employed (Incorporated) | 70 | 4.4% |
| Self-Employed (Not Incorporated) | 106 | 6.7% |
| Not-for-profit Organizations | 181 | 11.5% |
| Local Government Employees | 43 | 2.7% |
| State Government Employees | 44 | 2.8% |
| Federal Government Employees | 0 | 0.0% |
| Unpaid Family Workers | 0 | 0.0% |
| Total | 1,573 | 100.0% |
Employment Status by Age in West Menlo Park
According to the labor force statistics for West Menlo Park, out of the total population over 16 years of age (2,446), 69.2% or 1,693 individuals are in the labor force, with 4.1% or 69 of them unemployed. The age group with the highest labor force participation rate is 30 to 34 years, with 96.1% or 221 individuals in the labor force. Within the labor force, the 75 years and over age range has the highest percentage of unemployed individuals, with 48.1% or 13 of them being unemployed.
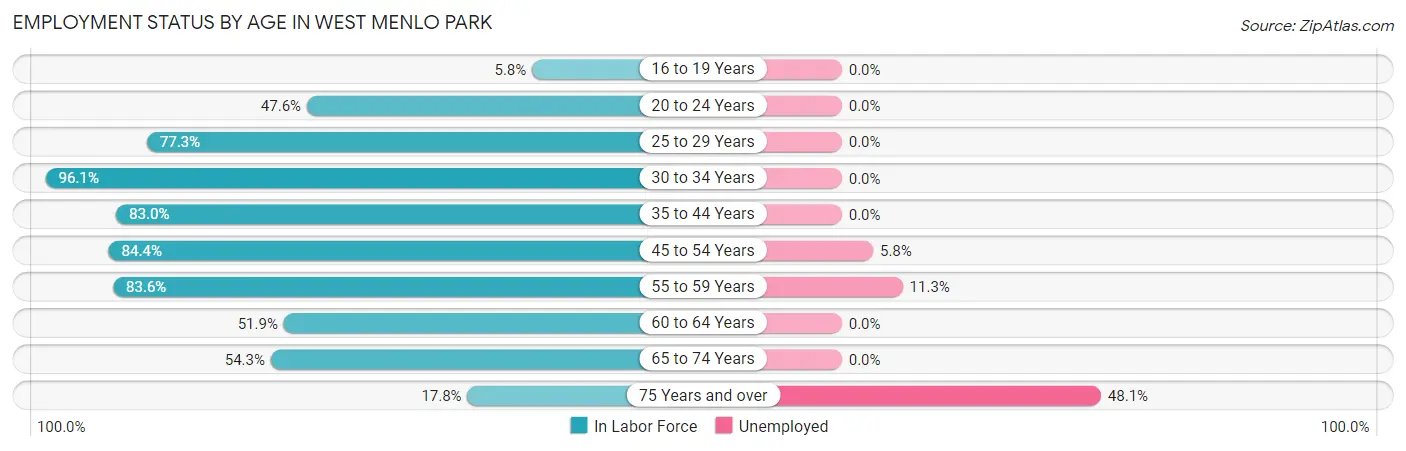
| Age Bracket | In Labor Force | Unemployed |
| 16 to 19 Years | 10 (5.8%) | 0 (0.0%) |
| 20 to 24 Years | 40 (47.6%) | 0 (0.0%) |
| 25 to 29 Years | 51 (77.3%) | 0 (0.0%) |
| 30 to 34 Years | 221 (96.1%) | 0 (0.0%) |
| 35 to 44 Years | 337 (83.0%) | 0 (0.0%) |
| 45 to 54 Years | 607 (84.4%) | 35 (5.8%) |
| 55 to 59 Years | 194 (83.6%) | 22 (11.3%) |
| 60 to 64 Years | 98 (51.9%) | 0 (0.0%) |
| 65 to 74 Years | 107 (54.3%) | 0 (0.0%) |
| 75 Years and over | 27 (17.8%) | 13 (48.1%) |
| Total | 1,693 (69.2%) | 69 (4.1%) |
Employment Status by Educational Attainment in West Menlo Park
According to labor force statistics for West Menlo Park, 81.9% of individuals (1,509) out of the total population between 25 and 64 years of age (1,842) are in the labor force, with 3.8% or 57 of them being unemployed. The group with the highest labor force participation rate are those with the educational attainment of high school diploma, with 100.0% or 27 individuals in the labor force. Within the labor force, individuals with high school diploma education have the highest percentage of unemployment, with 81.5% or 22 of them being unemployed.
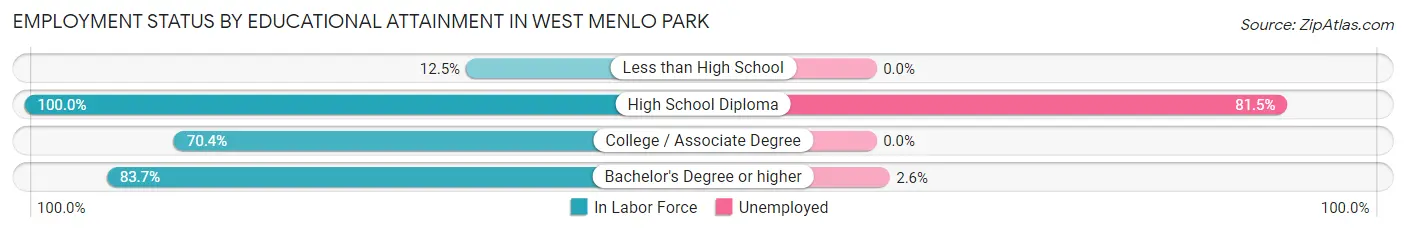
| Educational Attainment | In Labor Force | Unemployed |
| Less than High School | 3 (12.5%) | 0 (0.0%) |
| High School Diploma | 27 (100.0%) | 22 (81.5%) |
| College / Associate Degree | 114 (70.4%) | 0 (0.0%) |
| Bachelor's Degree or higher | 1,363 (83.7%) | 42 (2.6%) |
| Total | 1,509 (81.9%) | 70 (3.8%) |
Employment Occupations by Sex in West Menlo Park
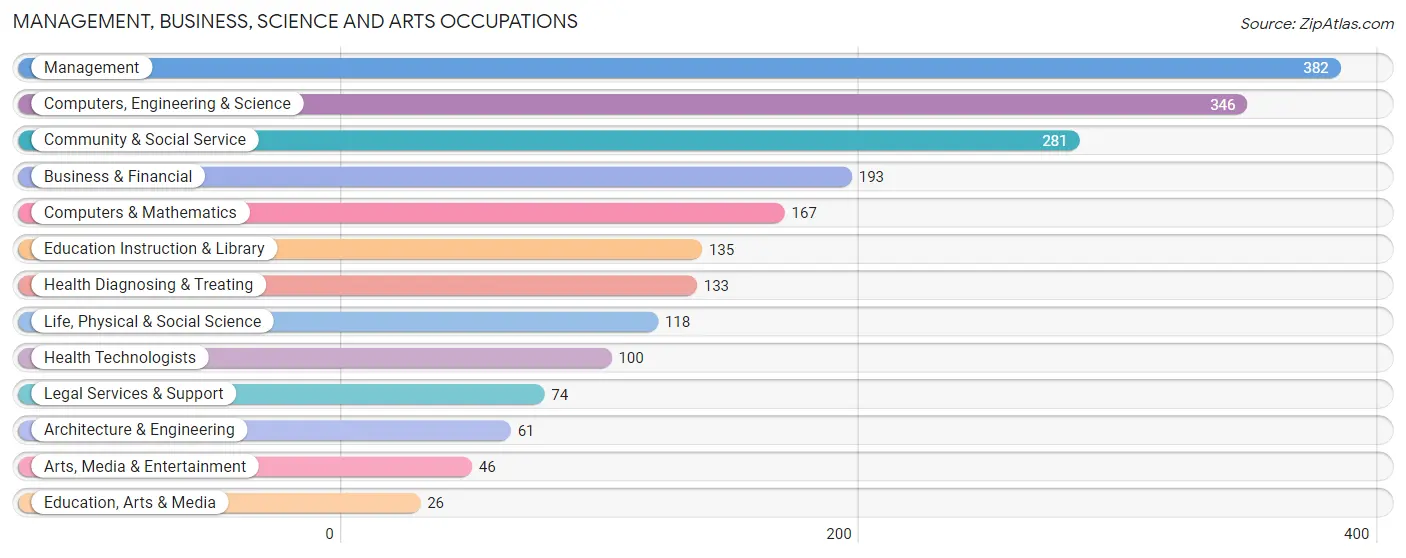
Management, Business, Science and Arts Occupations
The most common Management, Business, Science and Arts occupations in West Menlo Park are Management (382 | 23.5%), Computers, Engineering & Science (346 | 21.3%), Community & Social Service (281 | 17.3%), Business & Financial (193 | 11.9%), and Computers & Mathematics (167 | 10.3%).
Management, Business, Science and Arts Occupations by Sex
Within the Management, Business, Science and Arts occupations in West Menlo Park, the most male-oriented occupations are Computers & Mathematics (75.4%), Business & Financial (74.1%), and Architecture & Engineering (67.2%), while the most female-oriented occupations are Education, Arts & Media (100.0%), Health Diagnosing & Treating (75.2%), and Education Instruction & Library (74.1%).
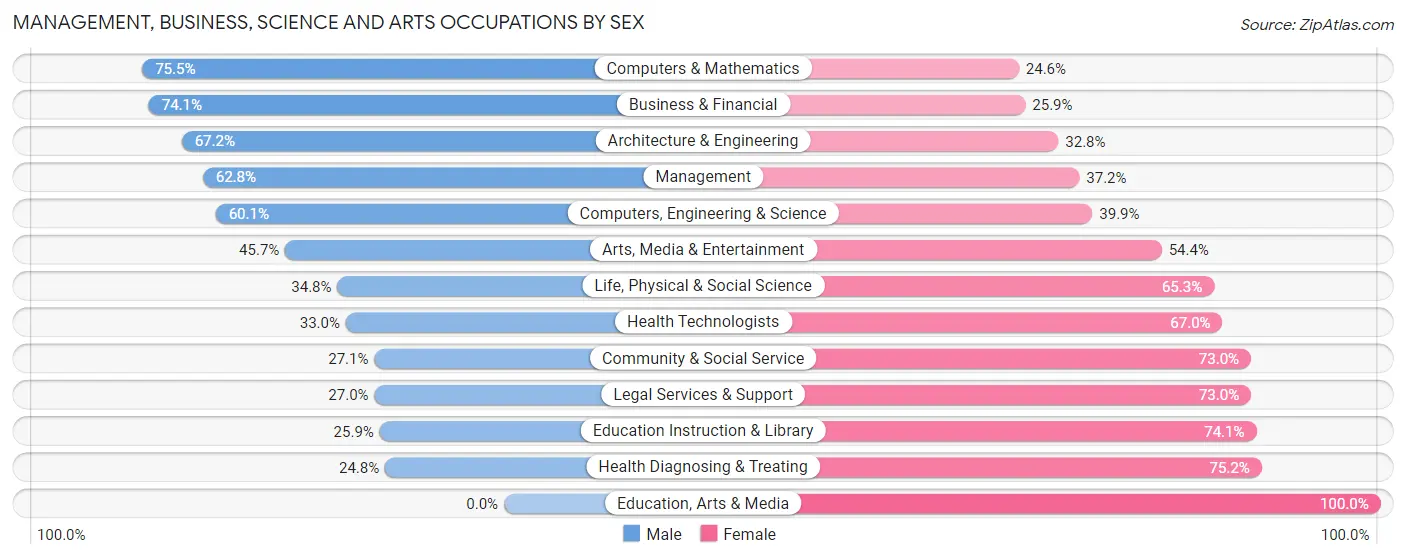
| Occupation | Male | Female |
| Management | 240 (62.8%) | 142 (37.2%) |
| Business & Financial | 143 (74.1%) | 50 (25.9%) |
| Computers, Engineering & Science | 208 (60.1%) | 138 (39.9%) |
| Computers & Mathematics | 126 (75.4%) | 41 (24.5%) |
| Architecture & Engineering | 41 (67.2%) | 20 (32.8%) |
| Life, Physical & Social Science | 41 (34.7%) | 77 (65.2%) |
| Community & Social Service | 76 (27.1%) | 205 (73.0%) |
| Education, Arts & Media | 0 (0.0%) | 26 (100.0%) |
| Legal Services & Support | 20 (27.0%) | 54 (73.0%) |
| Education Instruction & Library | 35 (25.9%) | 100 (74.1%) |
| Arts, Media & Entertainment | 21 (45.7%) | 25 (54.3%) |
| Health Diagnosing & Treating | 33 (24.8%) | 100 (75.2%) |
| Health Technologists | 33 (33.0%) | 67 (67.0%) |
| Total (Category) | 700 (52.4%) | 635 (47.6%) |
| Total (Overall) | 884 (54.5%) | 738 (45.5%) |
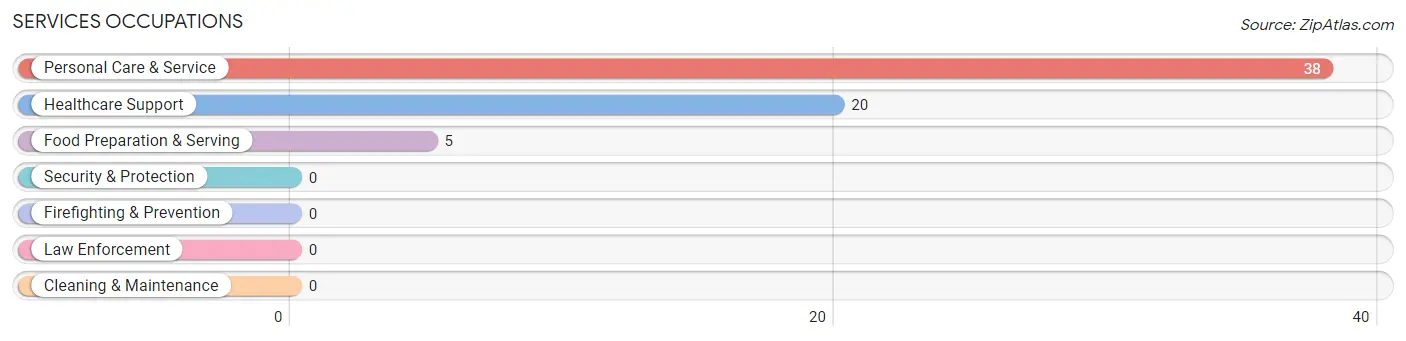
Services Occupations
The most common Services occupations in West Menlo Park are Personal Care & Service (38 | 2.3%), Healthcare Support (20 | 1.2%), and Food Preparation & Serving (5 | 0.3%).
Services Occupations by Sex
Within the Services occupations in West Menlo Park, the most male-oriented occupations are Food Preparation & Serving (100.0%), Healthcare Support (75.0%), and Personal Care & Service (26.3%), while the most female-oriented occupations are Personal Care & Service (73.7%), and Healthcare Support (25.0%).
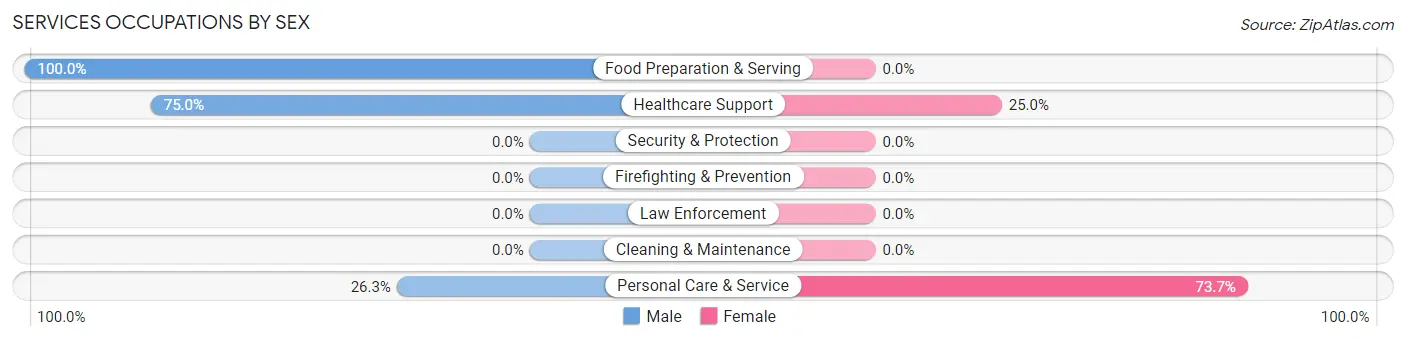
| Occupation | Male | Female |
| Healthcare Support | 15 (75.0%) | 5 (25.0%) |
| Security & Protection | 0 (0.0%) | 0 (0.0%) |
| Firefighting & Prevention | 0 (0.0%) | 0 (0.0%) |
| Law Enforcement | 0 (0.0%) | 0 (0.0%) |
| Food Preparation & Serving | 5 (100.0%) | 0 (0.0%) |
| Cleaning & Maintenance | 0 (0.0%) | 0 (0.0%) |
| Personal Care & Service | 10 (26.3%) | 28 (73.7%) |
| Total (Category) | 30 (47.6%) | 33 (52.4%) |
| Total (Overall) | 884 (54.5%) | 738 (45.5%) |
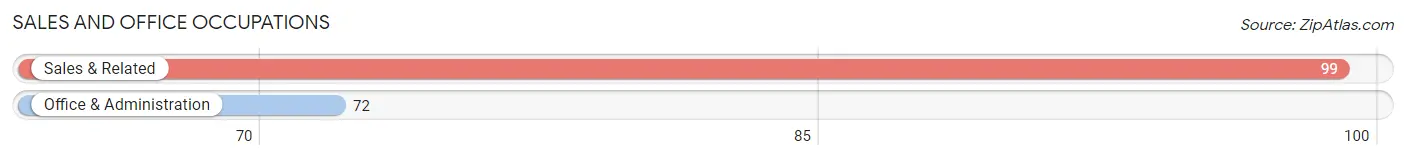
Sales and Office Occupations
The most common Sales and Office occupations in West Menlo Park are Sales & Related (99 | 6.1%), and Office & Administration (72 | 4.4%).
Sales and Office Occupations by Sex
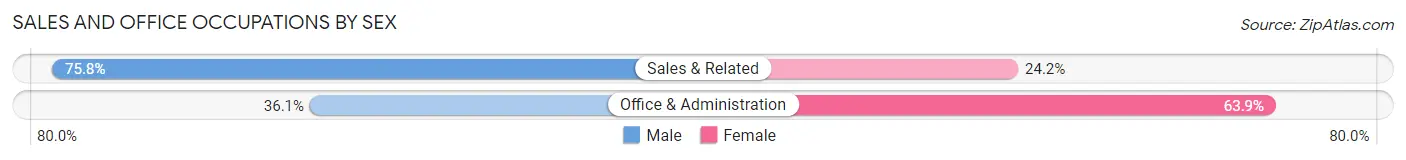
| Occupation | Male | Female |
| Sales & Related | 75 (75.8%) | 24 (24.2%) |
| Office & Administration | 26 (36.1%) | 46 (63.9%) |
| Total (Category) | 101 (59.1%) | 70 (40.9%) |
| Total (Overall) | 884 (54.5%) | 738 (45.5%) |
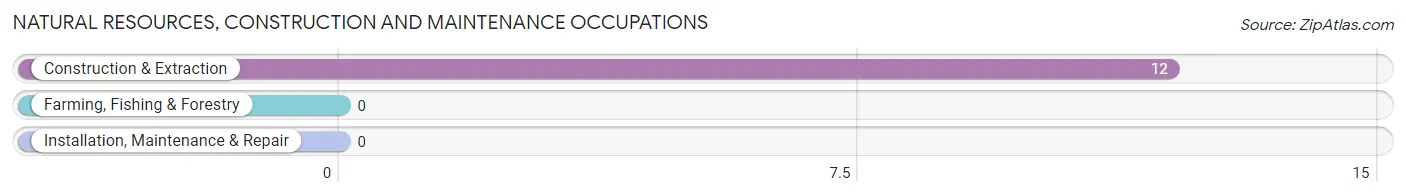
Natural Resources, Construction and Maintenance Occupations
The most common Natural Resources, Construction and Maintenance occupations in West Menlo Park are , and Construction & Extraction (12 | 0.7%).
Natural Resources, Construction and Maintenance Occupations by Sex
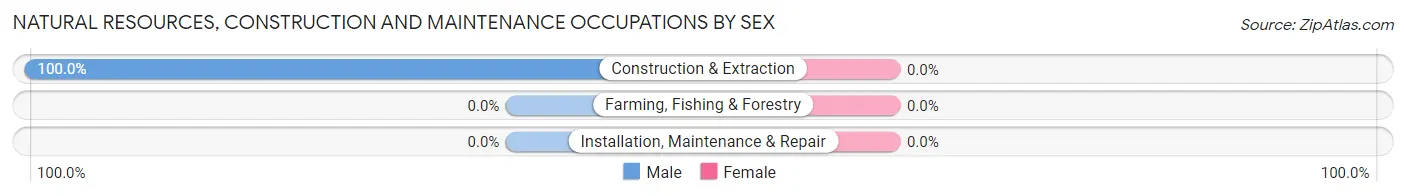
| Occupation | Male | Female |
| Farming, Fishing & Forestry | 0 (0.0%) | 0 (0.0%) |
| Construction & Extraction | 12 (100.0%) | 0 (0.0%) |
| Installation, Maintenance & Repair | 0 (0.0%) | 0 (0.0%) |
| Total (Category) | 12 (100.0%) | 0 (0.0%) |
| Total (Overall) | 884 (54.5%) | 738 (45.5%) |
Production, Transportation and Moving Occupations
The most common Production, Transportation and Moving occupations in West Menlo Park are , and Transportation (41 | 2.5%).
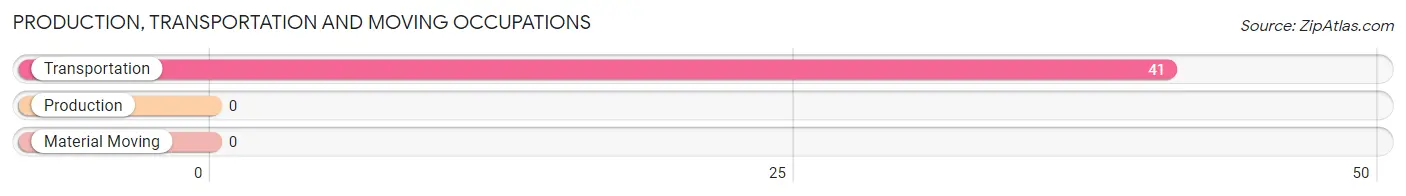
Production, Transportation and Moving Occupations by Sex
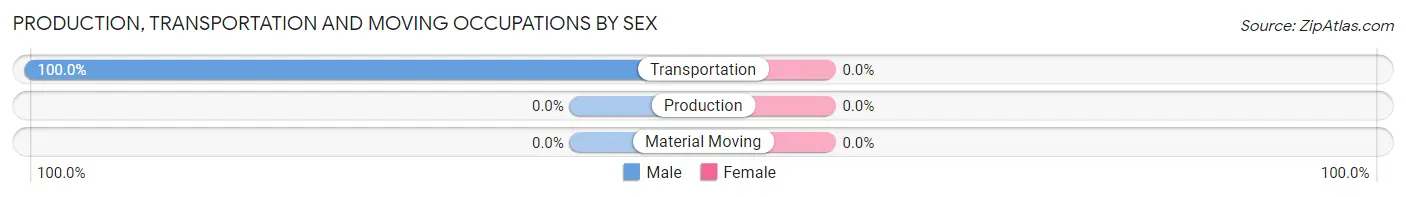
| Occupation | Male | Female |
| Production | 0 (0.0%) | 0 (0.0%) |
| Transportation | 41 (100.0%) | 0 (0.0%) |
| Material Moving | 0 (0.0%) | 0 (0.0%) |
| Total (Category) | 41 (100.0%) | 0 (0.0%) |
| Total (Overall) | 884 (54.5%) | 738 (45.5%) |
Employment Industries by Sex in West Menlo Park
Employment Industries in West Menlo Park
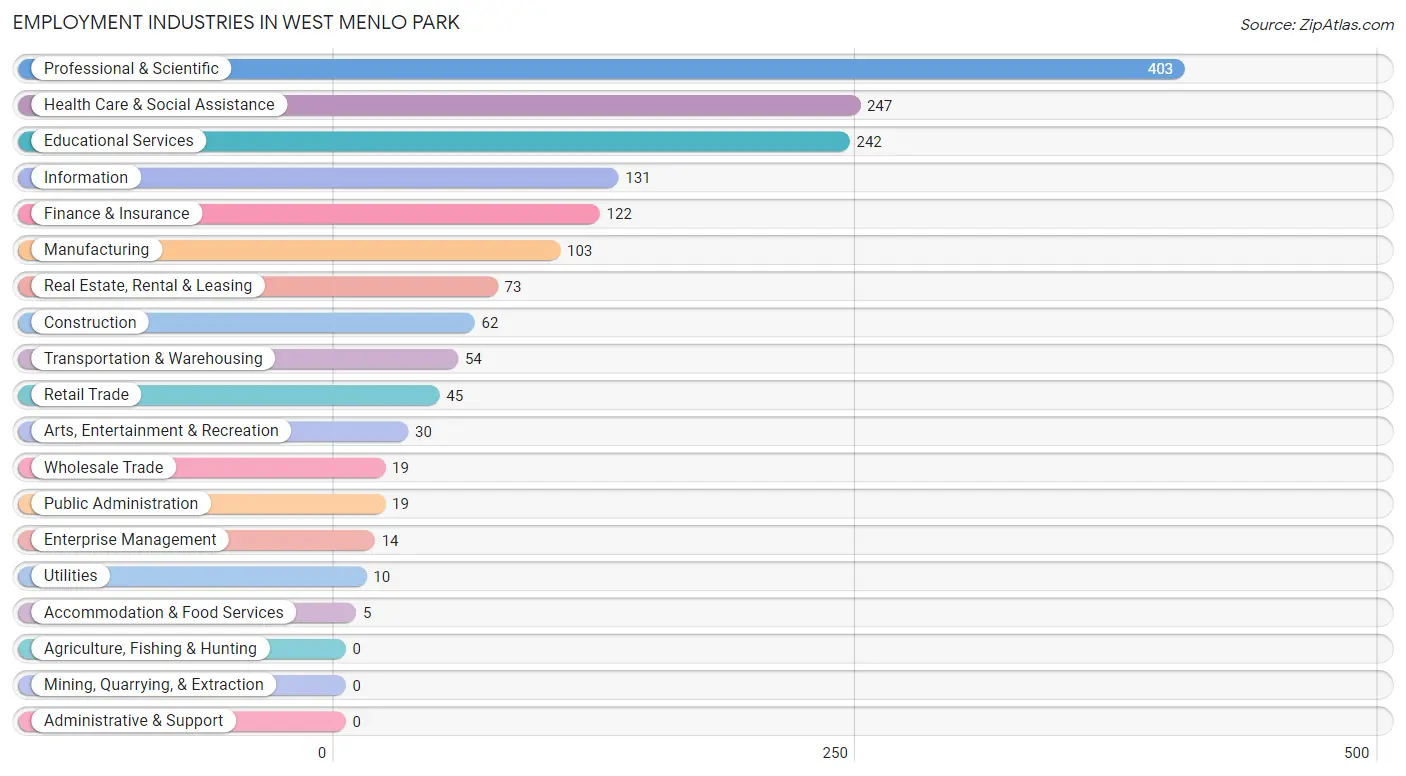
The major employment industries in West Menlo Park include Professional & Scientific (403 | 24.8%), Health Care & Social Assistance (247 | 15.2%), Educational Services (242 | 14.9%), Information (131 | 8.1%), and Finance & Insurance (122 | 7.5%).
Employment Industries by Sex in West Menlo Park
The West Menlo Park industries that see more men than women are Transportation & Warehousing (100.0%), Utilities (100.0%), and Enterprise Management (100.0%), whereas the industries that tend to have a higher number of women are Educational Services (78.9%), Health Care & Social Assistance (74.9%), and Information (63.4%).
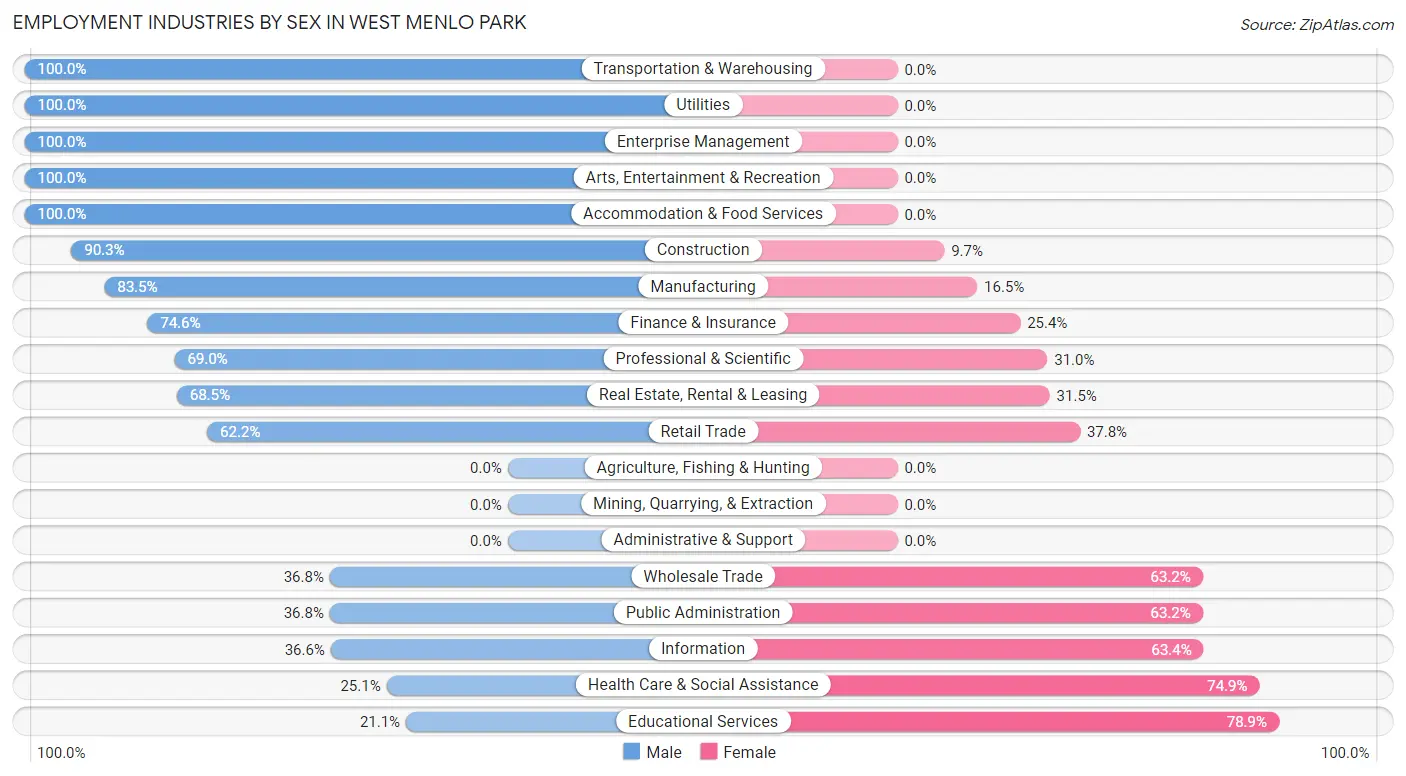
| Industry | Male | Female |
| Agriculture, Fishing & Hunting | 0 (0.0%) | 0 (0.0%) |
| Mining, Quarrying, & Extraction | 0 (0.0%) | 0 (0.0%) |
| Construction | 56 (90.3%) | 6 (9.7%) |
| Manufacturing | 86 (83.5%) | 17 (16.5%) |
| Wholesale Trade | 7 (36.8%) | 12 (63.2%) |
| Retail Trade | 28 (62.2%) | 17 (37.8%) |
| Transportation & Warehousing | 54 (100.0%) | 0 (0.0%) |
| Utilities | 10 (100.0%) | 0 (0.0%) |
| Information | 48 (36.6%) | 83 (63.4%) |
| Finance & Insurance | 91 (74.6%) | 31 (25.4%) |
| Real Estate, Rental & Leasing | 50 (68.5%) | 23 (31.5%) |
| Professional & Scientific | 278 (69.0%) | 125 (31.0%) |
| Enterprise Management | 14 (100.0%) | 0 (0.0%) |
| Administrative & Support | 0 (0.0%) | 0 (0.0%) |
| Educational Services | 51 (21.1%) | 191 (78.9%) |
| Health Care & Social Assistance | 62 (25.1%) | 185 (74.9%) |
| Arts, Entertainment & Recreation | 30 (100.0%) | 0 (0.0%) |
| Accommodation & Food Services | 5 (100.0%) | 0 (0.0%) |
| Public Administration | 7 (36.8%) | 12 (63.2%) |
| Total | 884 (54.5%) | 738 (45.5%) |
Education in West Menlo Park
School Enrollment in West Menlo Park
The most common levels of schooling among the 1,088 students in West Menlo Park are elementary school (289 | 26.6%), middle school (265 | 24.4%), and high school (243 | 22.3%).
| School Level | # Students | % Students |
| Nursery / Preschool | 42 | 3.9% |
| Kindergarten | 46 | 4.2% |
| Elementary School | 289 | 26.6% |
| Middle School | 265 | 24.4% |
| High School | 243 | 22.3% |
| College / Undergraduate | 106 | 9.7% |
| Graduate / Professional | 97 | 8.9% |
| Total | 1,088 | 100.0% |
School Enrollment by Age by Funding Source in West Menlo Park
Out of a total of 1,088 students who are enrolled in schools in West Menlo Park, 366 (33.6%) attend a private institution, while the remaining 722 (66.4%) are enrolled in public schools. The age group of 3 to 4 year olds has the highest likelihood of being enrolled in private schools, with 16 (100.0% in the age bracket) enrolled. Conversely, the age group of 10 to 14 year olds has the lowest likelihood of being enrolled in a private school, with 309 (80.9% in the age bracket) attending a public institution.
| Age Bracket | Public School | Private School |
| 3 to 4 Year Olds | 0 (0.0%) | 16 (100.0%) |
| 5 to 9 Year Old | 213 (68.9%) | 96 (31.1%) |
| 10 to 14 Year Olds | 309 (80.9%) | 73 (19.1%) |
| 15 to 17 Year Olds | 87 (52.1%) | 80 (47.9%) |
| 18 to 19 Year Olds | 41 (78.8%) | 11 (21.1%) |
| 20 to 24 Year Olds | 22 (45.8%) | 26 (54.2%) |
| 25 to 34 Year Olds | 6 (25.0%) | 18 (75.0%) |
| 35 Years and over | 44 (48.9%) | 46 (51.1%) |
| Total | 722 (66.4%) | 366 (33.6%) |
Educational Attainment by Field of Study in West Menlo Park
Engineering (499 | 24.6%), business (250 | 12.3%), computers & mathematics (191 | 9.4%), bio, nature & agricultural (186 | 9.2%), and social sciences (144 | 7.1%) are the most common fields of study among 2,028 individuals in West Menlo Park who have obtained a bachelor's degree or higher.
| Field of Study | # Graduates | % Graduates |
| Computers & Mathematics | 191 | 9.4% |
| Bio, Nature & Agricultural | 186 | 9.2% |
| Physical & Health Sciences | 64 | 3.2% |
| Psychology | 82 | 4.0% |
| Social Sciences | 144 | 7.1% |
| Engineering | 499 | 24.6% |
| Multidisciplinary Studies | 16 | 0.8% |
| Science & Technology | 140 | 6.9% |
| Business | 250 | 12.3% |
| Education | 59 | 2.9% |
| Literature & Languages | 101 | 5.0% |
| Liberal Arts & History | 84 | 4.1% |
| Visual & Performing Arts | 86 | 4.2% |
| Communications | 29 | 1.4% |
| Arts & Humanities | 97 | 4.8% |
| Total | 2,028 | 100.0% |
Transportation & Commute in West Menlo Park
Vehicle Availability by Sex in West Menlo Park
The most prevalent vehicle ownership categories in West Menlo Park are males with 2 vehicles (421, accounting for 47.8%) and females with 2 vehicles (320, making up 61.1%).
| Vehicles Available | Male | Female |
| No Vehicle | 12 (1.4%) | 16 (2.3%) |
| 1 Vehicle | 138 (15.7%) | 148 (21.5%) |
| 2 Vehicles | 421 (47.8%) | 320 (46.4%) |
| 3 Vehicles | 203 (23.1%) | 148 (21.5%) |
| 4 Vehicles | 81 (9.2%) | 46 (6.7%) |
| 5 or more Vehicles | 25 (2.8%) | 11 (1.6%) |
| Total | 880 (100.0%) | 689 (100.0%) |
Commute Time in West Menlo Park
The most frequently occuring commute durations in West Menlo Park are 20 to 24 minutes (197 commuters, 19.3%), 25 to 29 minutes (159 commuters, 15.6%), and 15 to 19 minutes (145 commuters, 14.2%).
| Commute Time | # Commuters | % Commuters |
| Less than 5 Minutes | 5 | 0.5% |
| 5 to 9 Minutes | 131 | 12.8% |
| 10 to 14 Minutes | 65 | 6.4% |
| 15 to 19 Minutes | 145 | 14.2% |
| 20 to 24 Minutes | 197 | 19.3% |
| 25 to 29 Minutes | 159 | 15.6% |
| 30 to 34 Minutes | 61 | 6.0% |
| 35 to 39 Minutes | 61 | 6.0% |
| 40 to 44 Minutes | 42 | 4.1% |
| 45 to 59 Minutes | 99 | 9.7% |
| 60 to 89 Minutes | 39 | 3.8% |
| 90 or more Minutes | 18 | 1.8% |
Commute Time by Sex in West Menlo Park
The most common commute times in West Menlo Park are 20 to 24 minutes (143 commuters, 25.9%) for males and 15 to 19 minutes (96 commuters, 20.5%) for females.
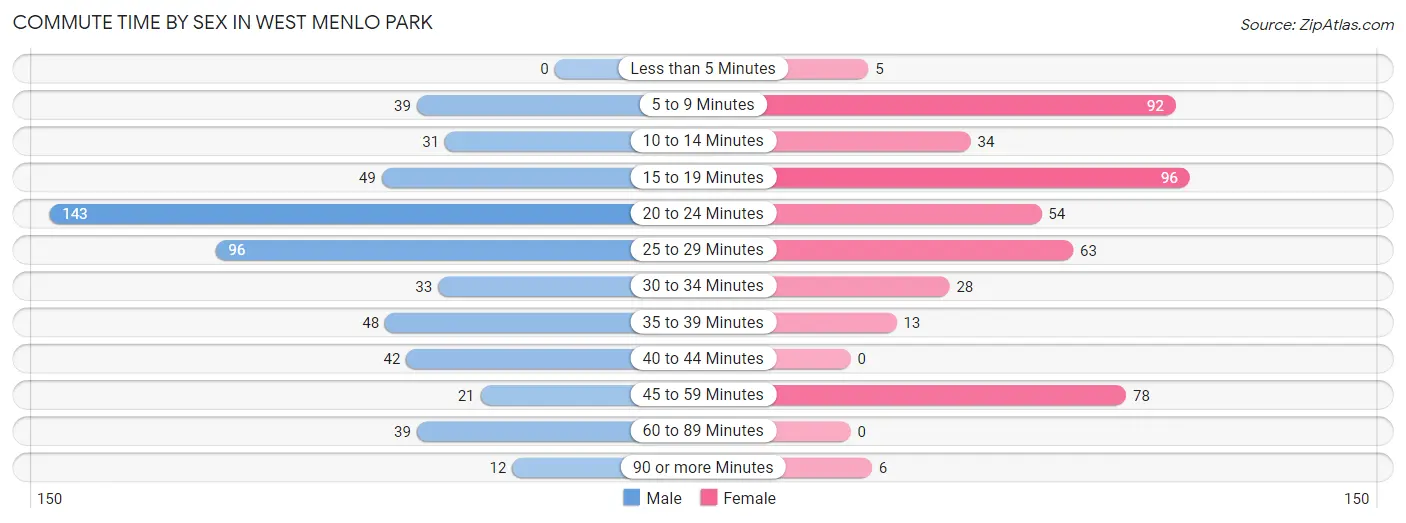
| Commute Time | Male | Female |
| Less than 5 Minutes | 0 (0.0%) | 5 (1.1%) |
| 5 to 9 Minutes | 39 (7.0%) | 92 (19.6%) |
| 10 to 14 Minutes | 31 (5.6%) | 34 (7.2%) |
| 15 to 19 Minutes | 49 (8.9%) | 96 (20.5%) |
| 20 to 24 Minutes | 143 (25.9%) | 54 (11.5%) |
| 25 to 29 Minutes | 96 (17.4%) | 63 (13.4%) |
| 30 to 34 Minutes | 33 (6.0%) | 28 (6.0%) |
| 35 to 39 Minutes | 48 (8.7%) | 13 (2.8%) |
| 40 to 44 Minutes | 42 (7.6%) | 0 (0.0%) |
| 45 to 59 Minutes | 21 (3.8%) | 78 (16.6%) |
| 60 to 89 Minutes | 39 (7.0%) | 0 (0.0%) |
| 90 or more Minutes | 12 (2.2%) | 6 (1.3%) |
Time of Departure to Work by Sex in West Menlo Park
The most frequent times of departure to work in West Menlo Park are 8:00 AM to 8:29 AM (202, 36.5%) for males and 8:00 AM to 8:29 AM (168, 35.8%) for females.
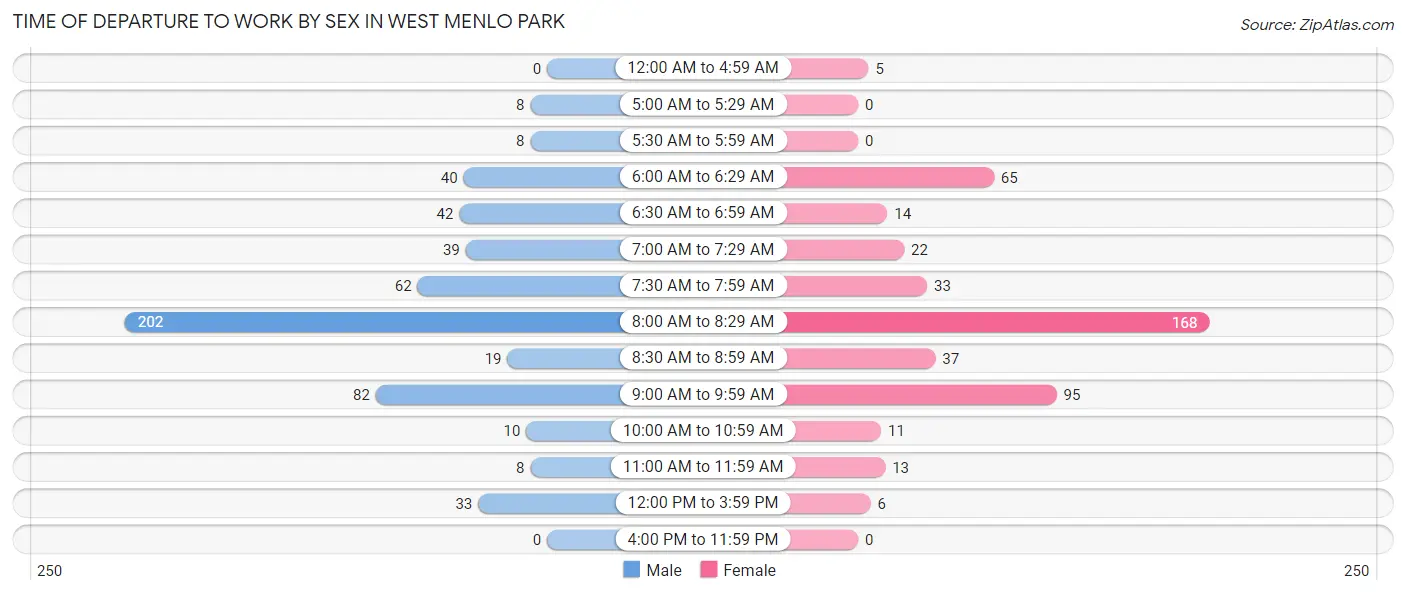
| Time of Departure | Male | Female |
| 12:00 AM to 4:59 AM | 0 (0.0%) | 5 (1.1%) |
| 5:00 AM to 5:29 AM | 8 (1.5%) | 0 (0.0%) |
| 5:30 AM to 5:59 AM | 8 (1.5%) | 0 (0.0%) |
| 6:00 AM to 6:29 AM | 40 (7.2%) | 65 (13.9%) |
| 6:30 AM to 6:59 AM | 42 (7.6%) | 14 (3.0%) |
| 7:00 AM to 7:29 AM | 39 (7.0%) | 22 (4.7%) |
| 7:30 AM to 7:59 AM | 62 (11.2%) | 33 (7.0%) |
| 8:00 AM to 8:29 AM | 202 (36.5%) | 168 (35.8%) |
| 8:30 AM to 8:59 AM | 19 (3.4%) | 37 (7.9%) |
| 9:00 AM to 9:59 AM | 82 (14.8%) | 95 (20.3%) |
| 10:00 AM to 10:59 AM | 10 (1.8%) | 11 (2.4%) |
| 11:00 AM to 11:59 AM | 8 (1.5%) | 13 (2.8%) |
| 12:00 PM to 3:59 PM | 33 (6.0%) | 6 (1.3%) |
| 4:00 PM to 11:59 PM | 0 (0.0%) | 0 (0.0%) |
| Total | 553 (100.0%) | 469 (100.0%) |
Housing Occupancy in West Menlo Park
Occupancy by Ownership in West Menlo Park
Of the total 1,193 dwellings in West Menlo Park, owner-occupied units account for 936 (78.5%), while renter-occupied units make up 257 (21.5%).
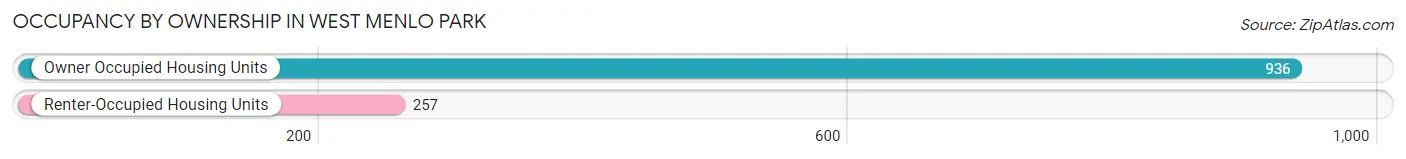
| Occupancy | # Housing Units | % Housing Units |
| Owner Occupied Housing Units | 936 | 78.5% |
| Renter-Occupied Housing Units | 257 | 21.5% |
| Total Occupied Housing Units | 1,193 | 100.0% |
Occupancy by Household Size in West Menlo Park
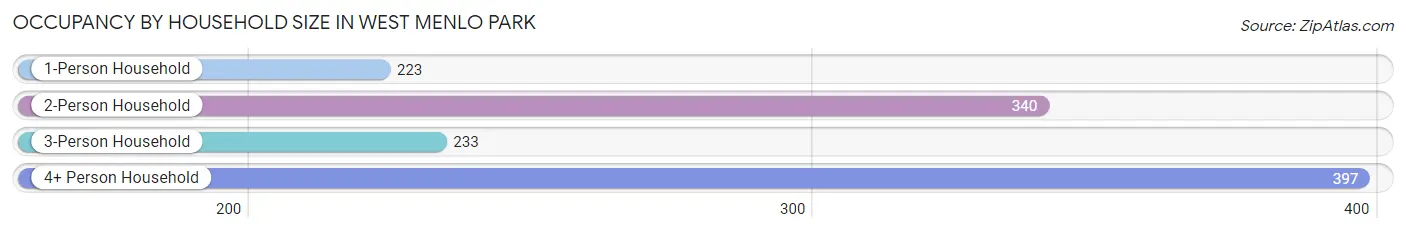
| Household Size | # Housing Units | % Housing Units |
| 1-Person Household | 223 | 18.7% |
| 2-Person Household | 340 | 28.5% |
| 3-Person Household | 233 | 19.5% |
| 4+ Person Household | 397 | 33.3% |
| Total Housing Units | 1,193 | 100.0% |
Occupancy by Ownership by Household Size in West Menlo Park
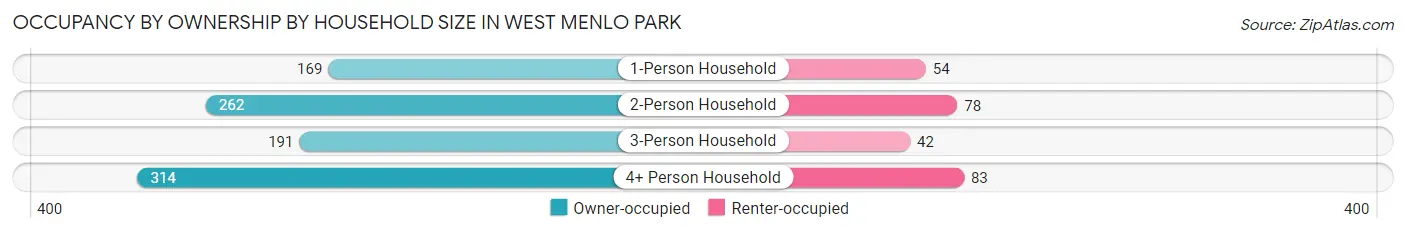
| Household Size | Owner-occupied | Renter-occupied |
| 1-Person Household | 169 (75.8%) | 54 (24.2%) |
| 2-Person Household | 262 (77.1%) | 78 (22.9%) |
| 3-Person Household | 191 (82.0%) | 42 (18.0%) |
| 4+ Person Household | 314 (79.1%) | 83 (20.9%) |
| Total Housing Units | 936 (78.5%) | 257 (21.5%) |
Occupancy by Educational Attainment in West Menlo Park
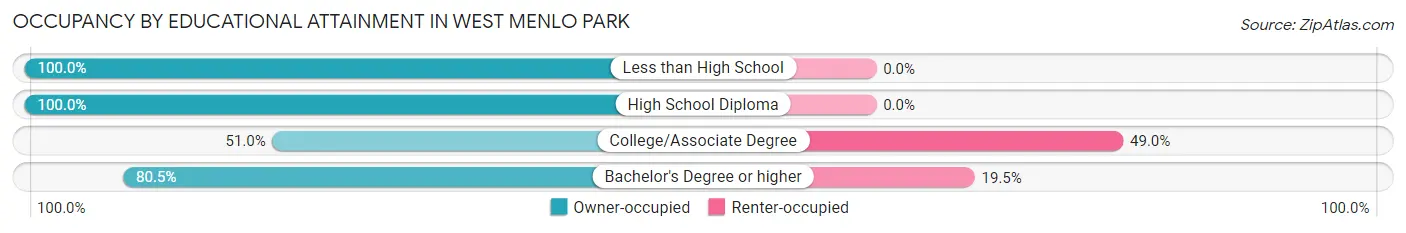
| Household Size | Owner-occupied | Renter-occupied |
| Less than High School | 13 (100.0%) | 0 (0.0%) |
| High School Diploma | 8 (100.0%) | 0 (0.0%) |
| College/Associate Degree | 49 (51.0%) | 47 (49.0%) |
| Bachelor's Degree or higher | 866 (80.5%) | 210 (19.5%) |
Occupancy by Age of Householder in West Menlo Park
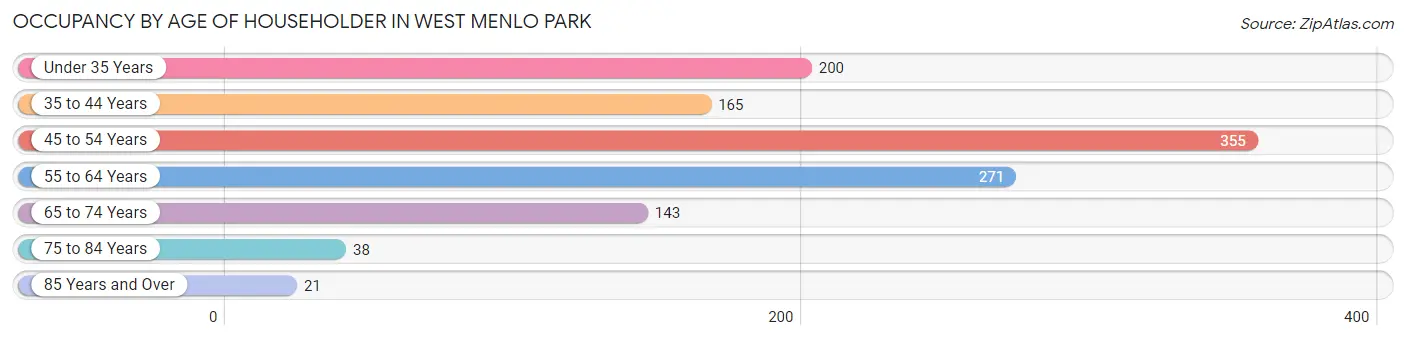
| Age Bracket | # Households | % Households |
| Under 35 Years | 200 | 16.8% |
| 35 to 44 Years | 165 | 13.8% |
| 45 to 54 Years | 355 | 29.8% |
| 55 to 64 Years | 271 | 22.7% |
| 65 to 74 Years | 143 | 12.0% |
| 75 to 84 Years | 38 | 3.2% |
| 85 Years and Over | 21 | 1.8% |
| Total | 1,193 | 100.0% |
Housing Finances in West Menlo Park
Median Income by Occupancy in West Menlo Park
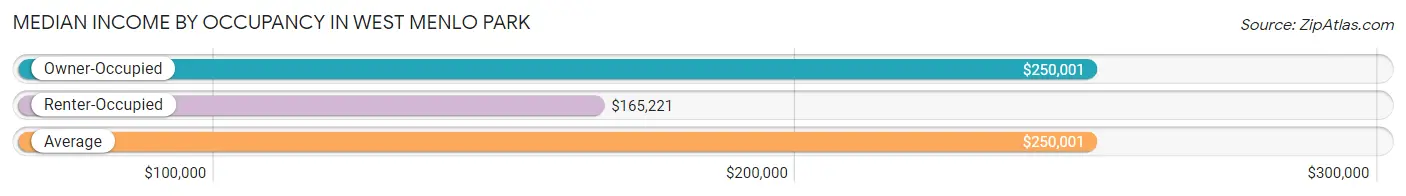
| Occupancy Type | # Households | Median Income |
| Owner-Occupied | 936 (78.5%) | $250,001 |
| Renter-Occupied | 257 (21.5%) | $165,221 |
| Average | 1,193 (100.0%) | $250,001 |
Occupancy by Householder Income Bracket in West Menlo Park
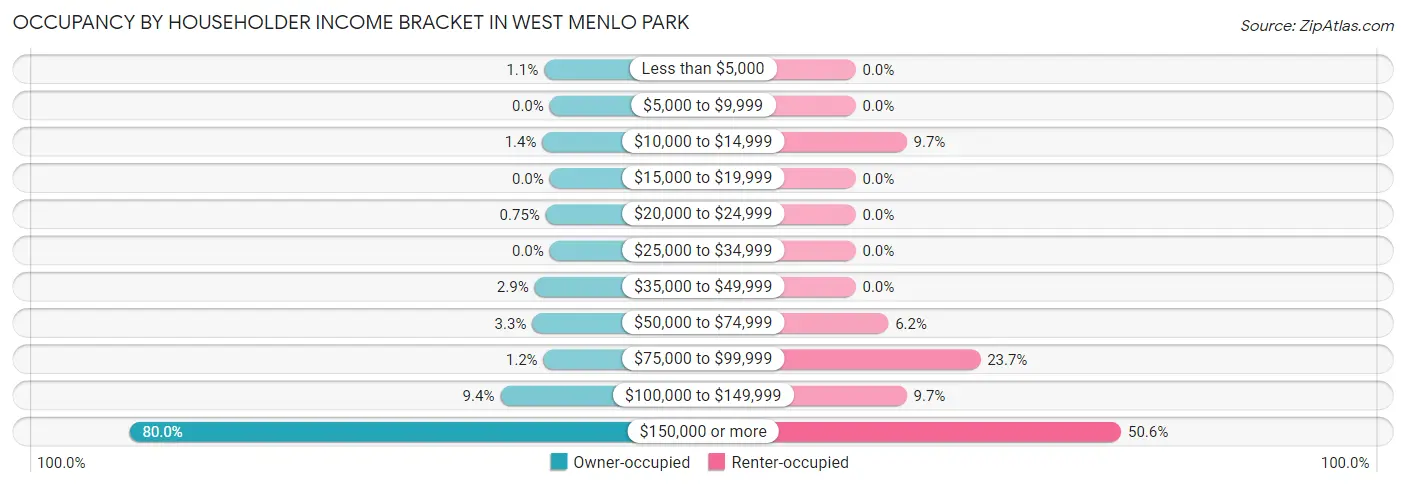
| Income Bracket | Owner-occupied | Renter-occupied |
| Less than $5,000 | 10 (1.1%) | 0 (0.0%) |
| $5,000 to $9,999 | 0 (0.0%) | 0 (0.0%) |
| $10,000 to $14,999 | 13 (1.4%) | 25 (9.7%) |
| $15,000 to $19,999 | 0 (0.0%) | 0 (0.0%) |
| $20,000 to $24,999 | 7 (0.7%) | 0 (0.0%) |
| $25,000 to $34,999 | 0 (0.0%) | 0 (0.0%) |
| $35,000 to $49,999 | 27 (2.9%) | 0 (0.0%) |
| $50,000 to $74,999 | 31 (3.3%) | 16 (6.2%) |
| $75,000 to $99,999 | 11 (1.2%) | 61 (23.7%) |
| $100,000 to $149,999 | 88 (9.4%) | 25 (9.7%) |
| $150,000 or more | 749 (80.0%) | 130 (50.6%) |
| Total | 936 (100.0%) | 257 (100.0%) |
Monthly Housing Cost Tiers in West Menlo Park
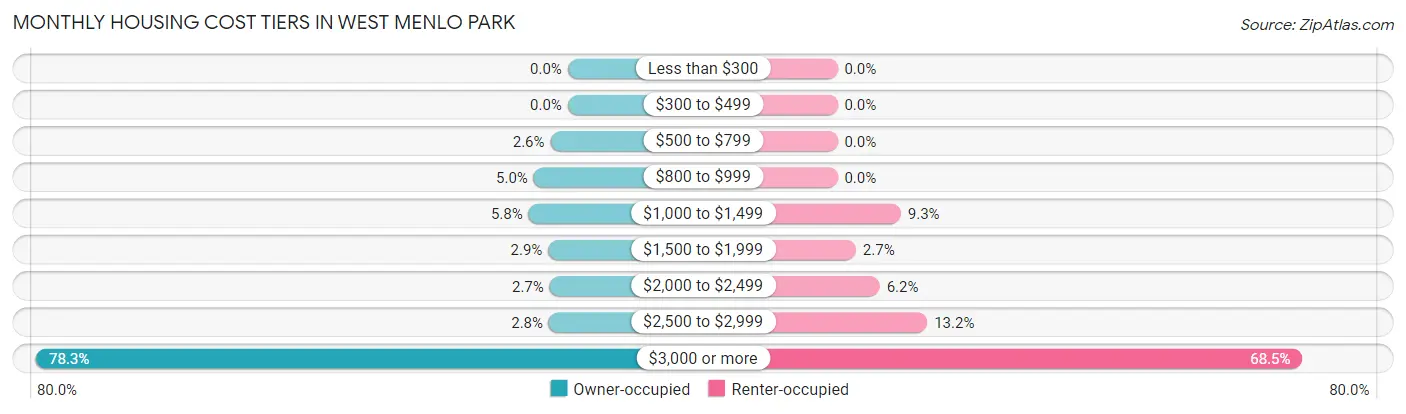
| Monthly Cost | Owner-occupied | Renter-occupied |
| Less than $300 | 0 (0.0%) | 0 (0.0%) |
| $300 to $499 | 0 (0.0%) | 0 (0.0%) |
| $500 to $799 | 24 (2.6%) | 0 (0.0%) |
| $800 to $999 | 47 (5.0%) | 0 (0.0%) |
| $1,000 to $1,499 | 54 (5.8%) | 24 (9.3%) |
| $1,500 to $1,999 | 27 (2.9%) | 7 (2.7%) |
| $2,000 to $2,499 | 25 (2.7%) | 16 (6.2%) |
| $2,500 to $2,999 | 26 (2.8%) | 34 (13.2%) |
| $3,000 or more | 733 (78.3%) | 176 (68.5%) |
| Total | 936 (100.0%) | 257 (100.0%) |
Physical Housing Characteristics in West Menlo Park
Housing Structures in West Menlo Park
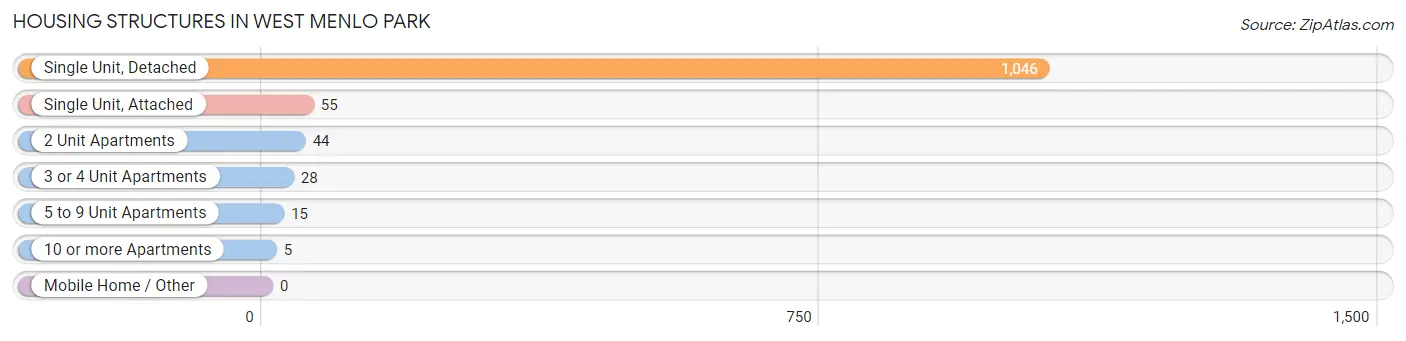
| Structure Type | # Housing Units | % Housing Units |
| Single Unit, Detached | 1,046 | 87.7% |
| Single Unit, Attached | 55 | 4.6% |
| 2 Unit Apartments | 44 | 3.7% |
| 3 or 4 Unit Apartments | 28 | 2.4% |
| 5 to 9 Unit Apartments | 15 | 1.3% |
| 10 or more Apartments | 5 | 0.4% |
| Mobile Home / Other | 0 | 0.0% |
| Total | 1,193 | 100.0% |
Housing Structures by Occupancy in West Menlo Park
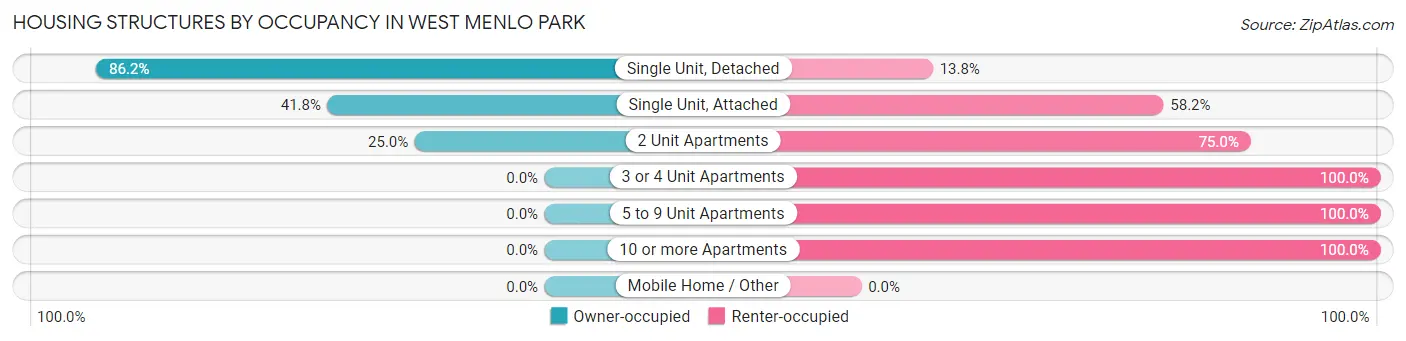
| Structure Type | Owner-occupied | Renter-occupied |
| Single Unit, Detached | 902 (86.2%) | 144 (13.8%) |
| Single Unit, Attached | 23 (41.8%) | 32 (58.2%) |
| 2 Unit Apartments | 11 (25.0%) | 33 (75.0%) |
| 3 or 4 Unit Apartments | 0 (0.0%) | 28 (100.0%) |
| 5 to 9 Unit Apartments | 0 (0.0%) | 15 (100.0%) |
| 10 or more Apartments | 0 (0.0%) | 5 (100.0%) |
| Mobile Home / Other | 0 (0.0%) | 0 (0.0%) |
| Total | 936 (78.5%) | 257 (21.5%) |
Housing Structures by Number of Rooms in West Menlo Park
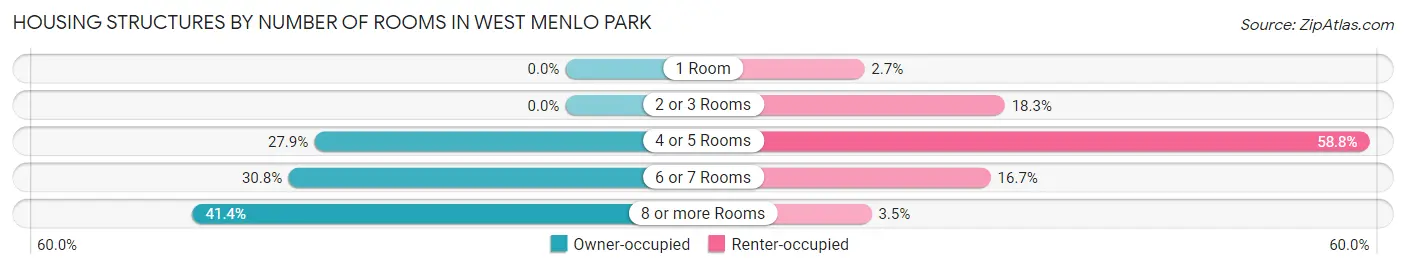
| Number of Rooms | Owner-occupied | Renter-occupied |
| 1 Room | 0 (0.0%) | 7 (2.7%) |
| 2 or 3 Rooms | 0 (0.0%) | 47 (18.3%) |
| 4 or 5 Rooms | 261 (27.9%) | 151 (58.8%) |
| 6 or 7 Rooms | 288 (30.8%) | 43 (16.7%) |
| 8 or more Rooms | 387 (41.3%) | 9 (3.5%) |
| Total | 936 (100.0%) | 257 (100.0%) |
Housing Structure by Heating Type in West Menlo Park

| Heating Type | Owner-occupied | Renter-occupied |
| Utility Gas | 768 (82.1%) | 215 (83.7%) |
| Bottled, Tank, or LP Gas | 13 (1.4%) | 0 (0.0%) |
| Electricity | 155 (16.6%) | 42 (16.3%) |
| Fuel Oil or Kerosene | 0 (0.0%) | 0 (0.0%) |
| Coal or Coke | 0 (0.0%) | 0 (0.0%) |
| All other Fuels | 0 (0.0%) | 0 (0.0%) |
| No Fuel Used | 0 (0.0%) | 0 (0.0%) |
| Total | 936 (100.0%) | 257 (100.0%) |
Household Vehicle Usage in West Menlo Park
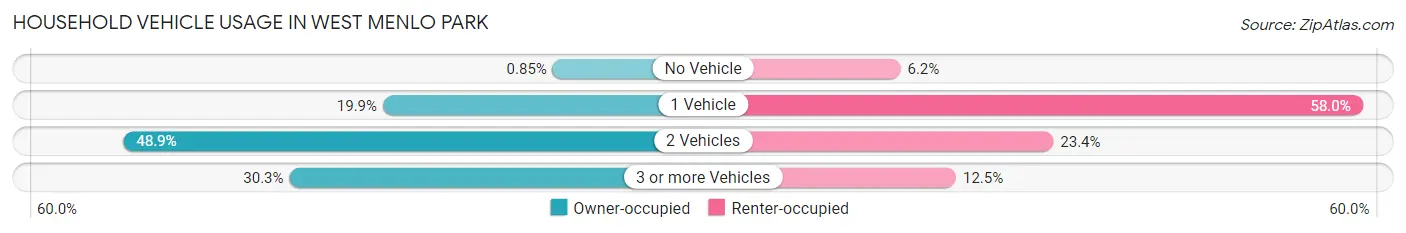
| Vehicles per Household | Owner-occupied | Renter-occupied |
| No Vehicle | 8 (0.9%) | 16 (6.2%) |
| 1 Vehicle | 186 (19.9%) | 149 (58.0%) |
| 2 Vehicles | 458 (48.9%) | 60 (23.4%) |
| 3 or more Vehicles | 284 (30.3%) | 32 (12.4%) |
| Total | 936 (100.0%) | 257 (100.0%) |
Real Estate & Mortgages in West Menlo Park
Real Estate and Mortgage Overview in West Menlo Park
| Characteristic | Without Mortgage | With Mortgage |
| Housing Units | 210 | 726 |
| Median Property Value | $2,000,001 | $2,000,001 |
| Median Household Income | $250,001 | $603 |
| Monthly Housing Costs | $1,188 | $681 |
| Real Estate Taxes | $9,271 | $0 |
Property Value by Mortgage Status in West Menlo Park
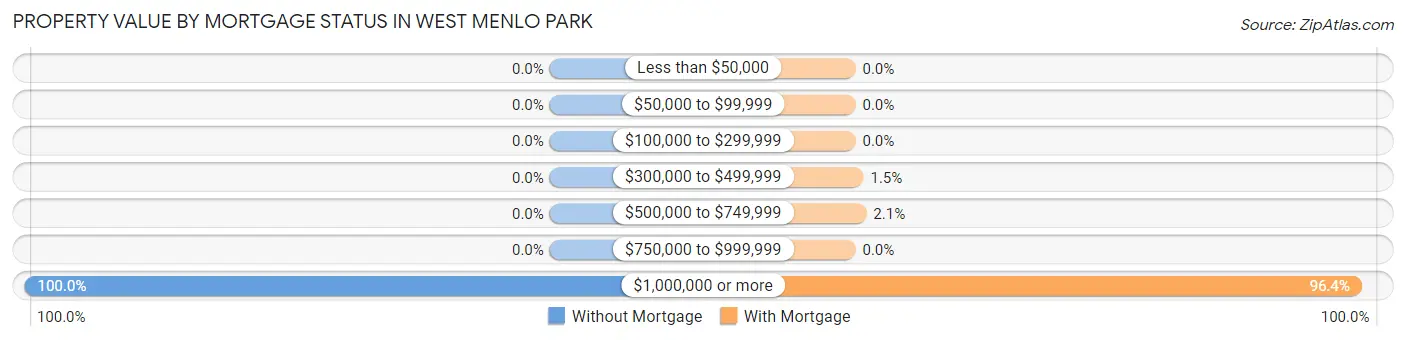
| Property Value | Without Mortgage | With Mortgage |
| Less than $50,000 | 0 (0.0%) | 0 (0.0%) |
| $50,000 to $99,999 | 0 (0.0%) | 0 (0.0%) |
| $100,000 to $299,999 | 0 (0.0%) | 0 (0.0%) |
| $300,000 to $499,999 | 0 (0.0%) | 11 (1.5%) |
| $500,000 to $749,999 | 0 (0.0%) | 15 (2.1%) |
| $750,000 to $999,999 | 0 (0.0%) | 0 (0.0%) |
| $1,000,000 or more | 210 (100.0%) | 700 (96.4%) |
| Total | 210 (100.0%) | 726 (100.0%) |
Household Income by Mortgage Status in West Menlo Park
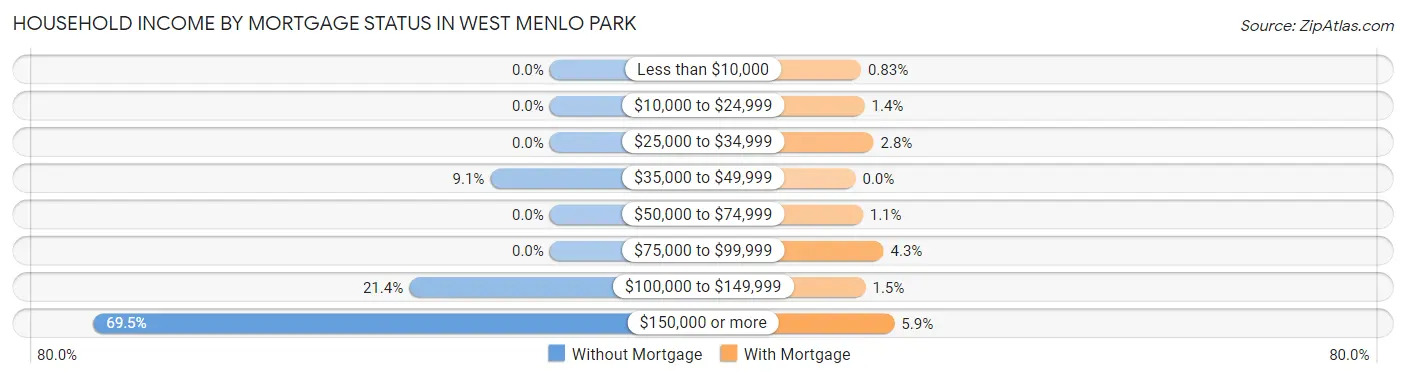
| Household Income | Without Mortgage | With Mortgage |
| Less than $10,000 | 0 (0.0%) | 6 (0.8%) |
| $10,000 to $24,999 | 0 (0.0%) | 10 (1.4%) |
| $25,000 to $34,999 | 0 (0.0%) | 20 (2.8%) |
| $35,000 to $49,999 | 19 (9.0%) | 0 (0.0%) |
| $50,000 to $74,999 | 0 (0.0%) | 8 (1.1%) |
| $75,000 to $99,999 | 0 (0.0%) | 31 (4.3%) |
| $100,000 to $149,999 | 45 (21.4%) | 11 (1.5%) |
| $150,000 or more | 146 (69.5%) | 43 (5.9%) |
| Total | 210 (100.0%) | 726 (100.0%) |
Property Value to Household Income Ratio in West Menlo Park
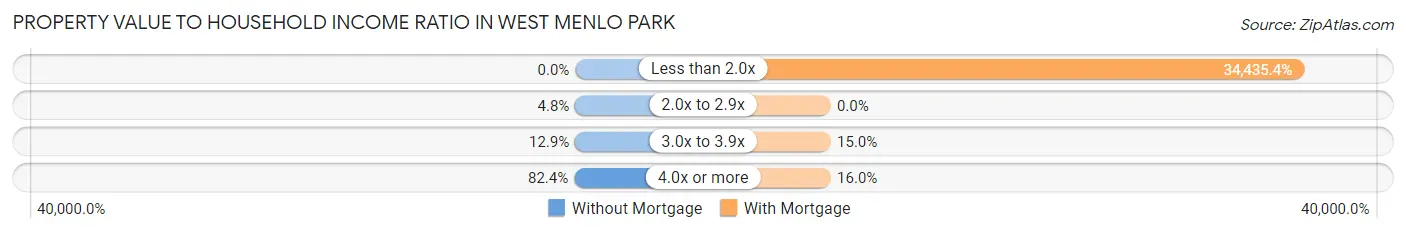
| Value-to-Income Ratio | Without Mortgage | With Mortgage |
| Less than 2.0x | 0 (0.0%) | 250,001 (34,435.4%) |
| 2.0x to 2.9x | 10 (4.8%) | 0 (0.0%) |
| 3.0x to 3.9x | 27 (12.9%) | 109 (15.0%) |
| 4.0x or more | 173 (82.4%) | 116 (16.0%) |
| Total | 210 (100.0%) | 726 (100.0%) |
Real Estate Taxes by Mortgage Status in West Menlo Park
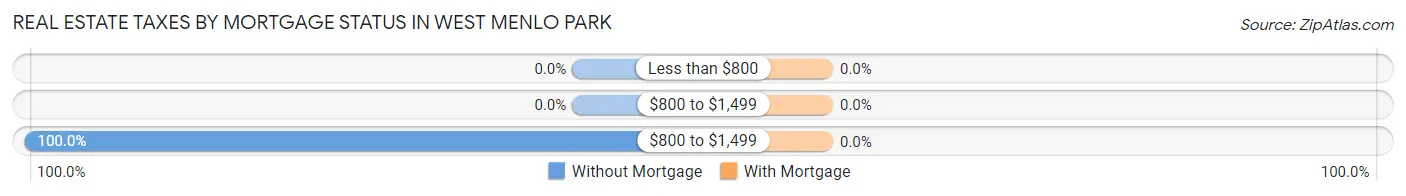
| Property Taxes | Without Mortgage | With Mortgage |
| Less than $800 | 0 (0.0%) | 0 (0.0%) |
| $800 to $1,499 | 0 (0.0%) | 0 (0.0%) |
| $800 to $1,499 | 210 (100.0%) | 0 (0.0%) |
| Total | 210 (100.0%) | 726 (100.0%) |
Health & Disability in West Menlo Park
Health Insurance Coverage by Age in West Menlo Park
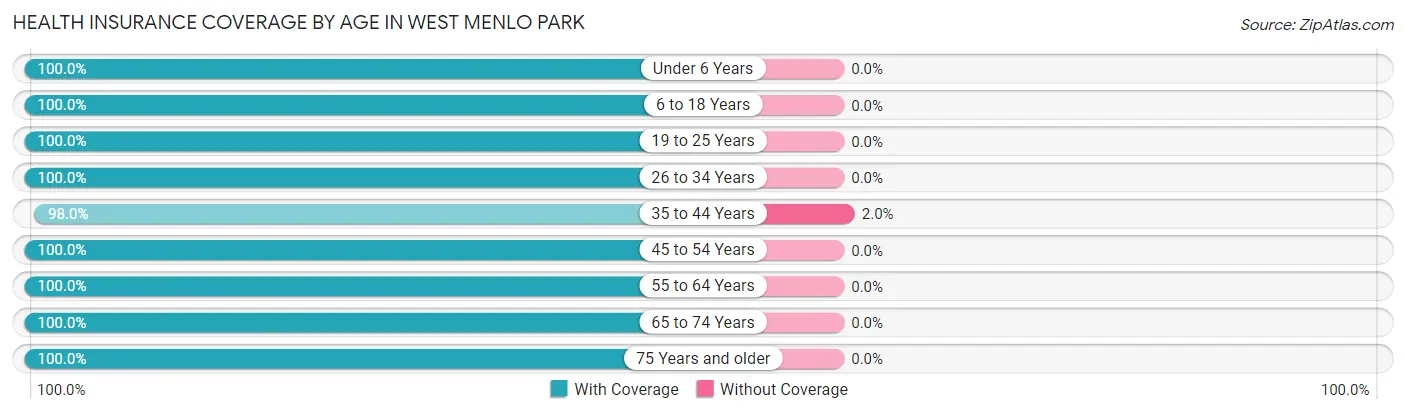
| Age Bracket | With Coverage | Without Coverage |
| Under 6 Years | 270 (100.0%) | 0 (0.0%) |
| 6 to 18 Years | 824 (100.0%) | 0 (0.0%) |
| 19 to 25 Years | 132 (100.0%) | 0 (0.0%) |
| 26 to 34 Years | 275 (100.0%) | 0 (0.0%) |
| 35 to 44 Years | 398 (98.0%) | 8 (2.0%) |
| 45 to 54 Years | 719 (100.0%) | 0 (0.0%) |
| 55 to 64 Years | 421 (100.0%) | 0 (0.0%) |
| 65 to 74 Years | 197 (100.0%) | 0 (0.0%) |
| 75 Years and older | 152 (100.0%) | 0 (0.0%) |
| Total | 3,388 (99.8%) | 8 (0.2%) |
Health Insurance Coverage by Citizenship Status in West Menlo Park
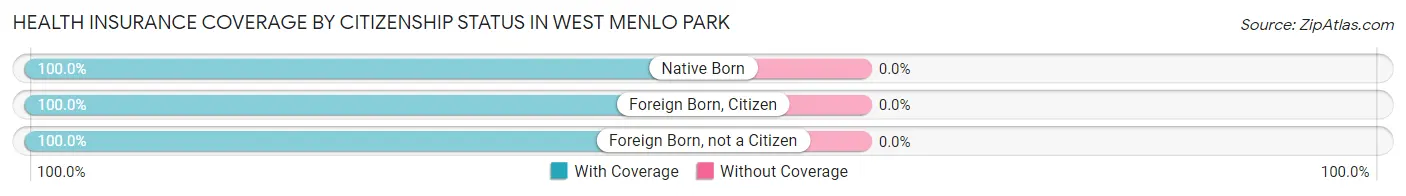
| Citizenship Status | With Coverage | Without Coverage |
| Native Born | 270 (100.0%) | 0 (0.0%) |
| Foreign Born, Citizen | 824 (100.0%) | 0 (0.0%) |
| Foreign Born, not a Citizen | 132 (100.0%) | 0 (0.0%) |
Health Insurance Coverage by Household Income in West Menlo Park
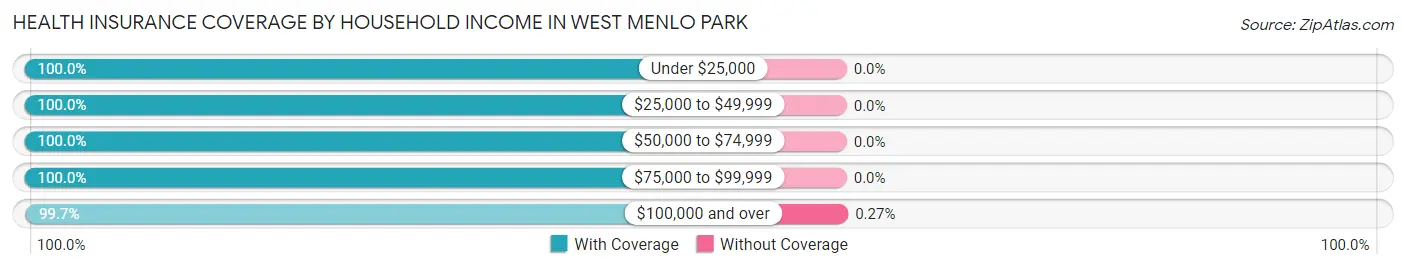
| Household Income | With Coverage | Without Coverage |
| Under $25,000 | 98 (100.0%) | 0 (0.0%) |
| $25,000 to $49,999 | 27 (100.0%) | 0 (0.0%) |
| $50,000 to $74,999 | 76 (100.0%) | 0 (0.0%) |
| $75,000 to $99,999 | 169 (100.0%) | 0 (0.0%) |
| $100,000 and over | 3,006 (99.7%) | 8 (0.3%) |
Public vs Private Health Insurance Coverage by Age in West Menlo Park
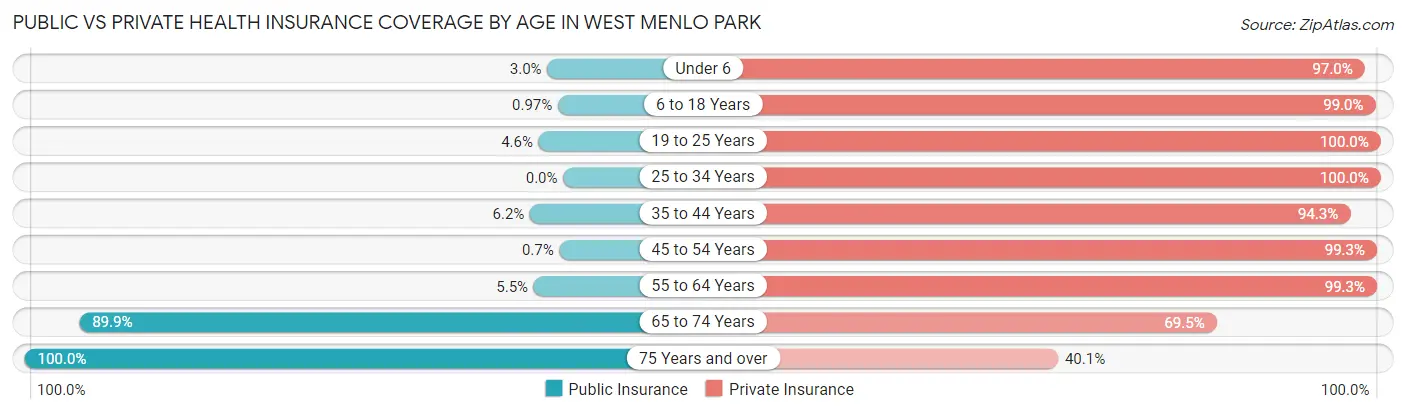
| Age Bracket | Public Insurance | Private Insurance |
| Under 6 | 8 (3.0%) | 262 (97.0%) |
| 6 to 18 Years | 8 (1.0%) | 816 (99.0%) |
| 19 to 25 Years | 6 (4.5%) | 132 (100.0%) |
| 25 to 34 Years | 0 (0.0%) | 275 (100.0%) |
| 35 to 44 Years | 25 (6.2%) | 383 (94.3%) |
| 45 to 54 Years | 5 (0.7%) | 714 (99.3%) |
| 55 to 64 Years | 23 (5.5%) | 418 (99.3%) |
| 65 to 74 Years | 177 (89.8%) | 137 (69.5%) |
| 75 Years and over | 152 (100.0%) | 61 (40.1%) |
| Total | 404 (11.9%) | 3,198 (94.2%) |
Disability Status by Sex by Age in West Menlo Park
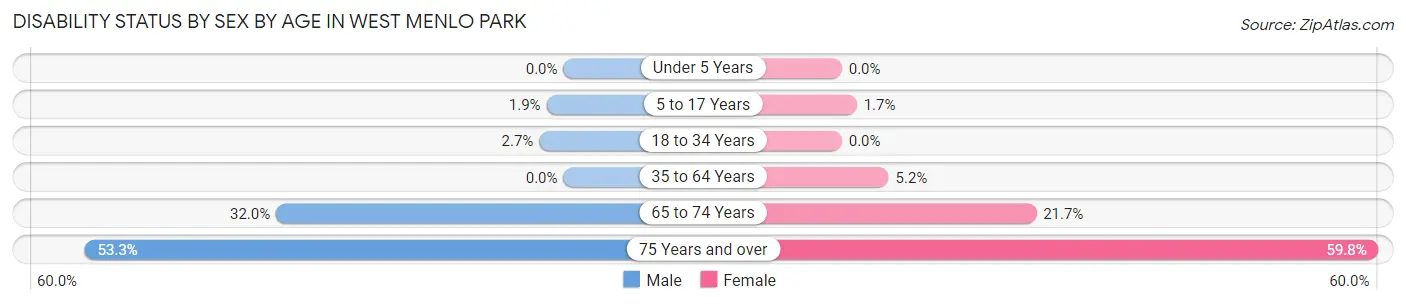
| Age Bracket | Male | Female |
| Under 5 Years | 0 (0.0%) | 0 (0.0%) |
| 5 to 17 Years | 7 (1.9%) | 8 (1.7%) |
| 18 to 34 Years | 6 (2.7%) | 0 (0.0%) |
| 35 to 64 Years | 0 (0.0%) | 44 (5.2%) |
| 65 to 74 Years | 32 (32.0%) | 21 (21.6%) |
| 75 Years and over | 32 (53.3%) | 55 (59.8%) |
Disability Class by Sex by Age in West Menlo Park
Disability Class: Hearing Difficulty
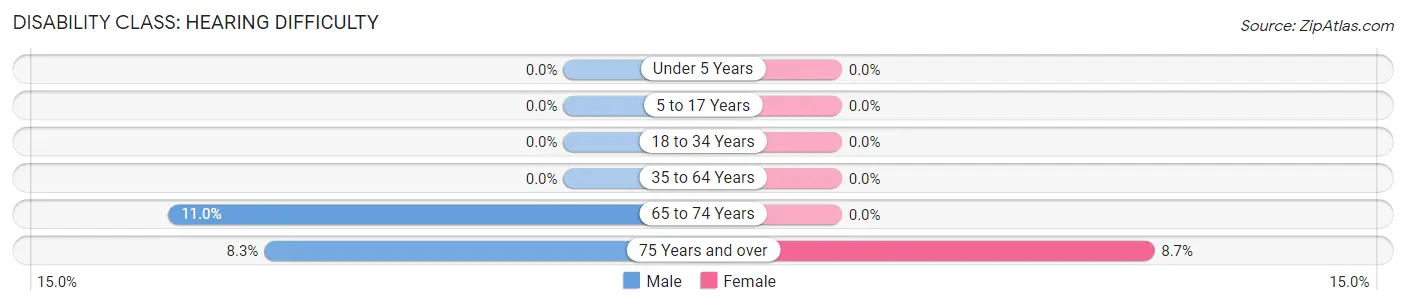
| Age Bracket | Male | Female |
| Under 5 Years | 0 (0.0%) | 0 (0.0%) |
| 5 to 17 Years | 0 (0.0%) | 0 (0.0%) |
| 18 to 34 Years | 0 (0.0%) | 0 (0.0%) |
| 35 to 64 Years | 0 (0.0%) | 0 (0.0%) |
| 65 to 74 Years | 11 (11.0%) | 0 (0.0%) |
| 75 Years and over | 5 (8.3%) | 8 (8.7%) |
Disability Class: Vision Difficulty
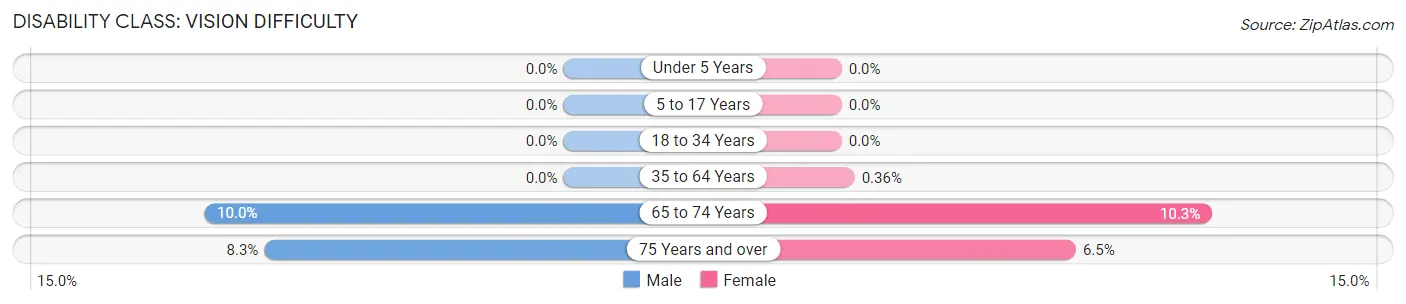
| Age Bracket | Male | Female |
| Under 5 Years | 0 (0.0%) | 0 (0.0%) |
| 5 to 17 Years | 0 (0.0%) | 0 (0.0%) |
| 18 to 34 Years | 0 (0.0%) | 0 (0.0%) |
| 35 to 64 Years | 0 (0.0%) | 3 (0.4%) |
| 65 to 74 Years | 10 (10.0%) | 10 (10.3%) |
| 75 Years and over | 5 (8.3%) | 6 (6.5%) |
Disability Class: Cognitive Difficulty
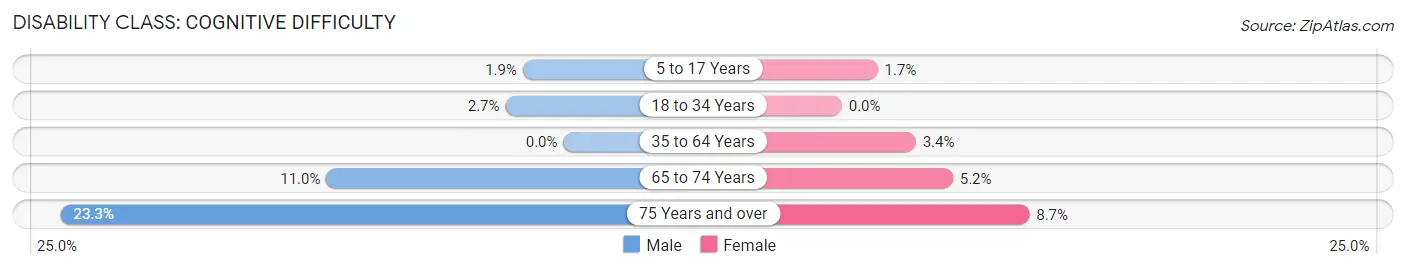
| Age Bracket | Male | Female |
| 5 to 17 Years | 7 (1.9%) | 8 (1.7%) |
| 18 to 34 Years | 6 (2.7%) | 0 (0.0%) |
| 35 to 64 Years | 0 (0.0%) | 29 (3.4%) |
| 65 to 74 Years | 11 (11.0%) | 5 (5.1%) |
| 75 Years and over | 14 (23.3%) | 8 (8.7%) |
Disability Class: Ambulatory Difficulty
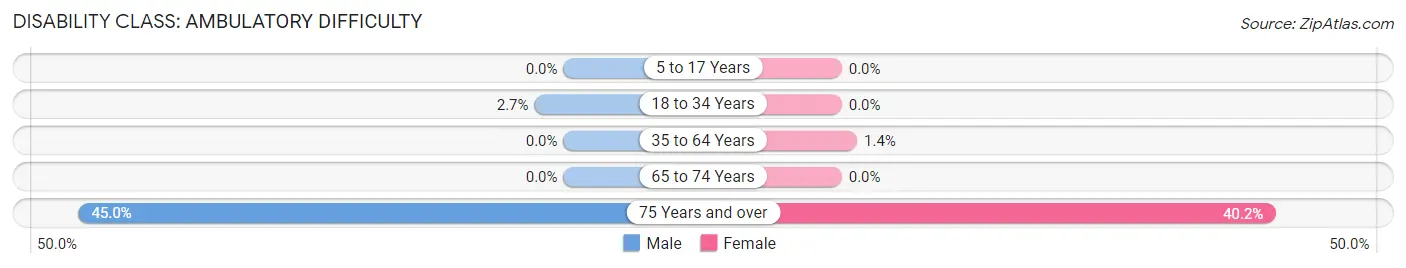
| Age Bracket | Male | Female |
| 5 to 17 Years | 0 (0.0%) | 0 (0.0%) |
| 18 to 34 Years | 6 (2.7%) | 0 (0.0%) |
| 35 to 64 Years | 0 (0.0%) | 12 (1.4%) |
| 65 to 74 Years | 0 (0.0%) | 0 (0.0%) |
| 75 Years and over | 27 (45.0%) | 37 (40.2%) |
Disability Class: Self-Care Difficulty
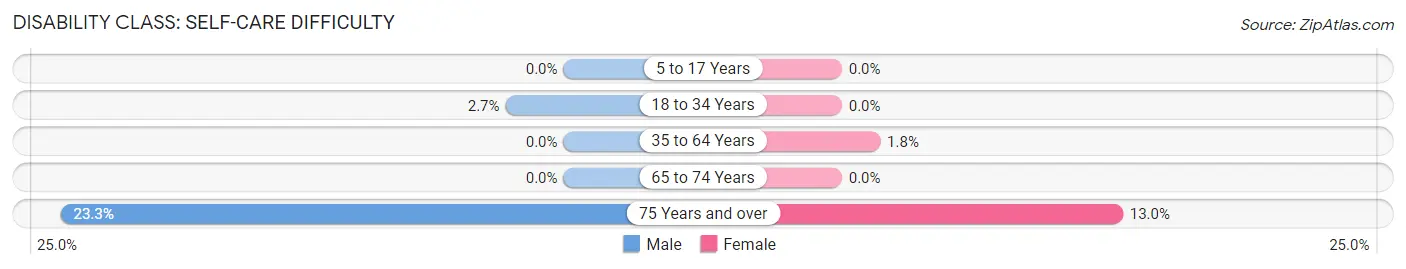
| Age Bracket | Male | Female |
| 5 to 17 Years | 0 (0.0%) | 0 (0.0%) |
| 18 to 34 Years | 6 (2.7%) | 0 (0.0%) |
| 35 to 64 Years | 0 (0.0%) | 15 (1.8%) |
| 65 to 74 Years | 0 (0.0%) | 0 (0.0%) |
| 75 Years and over | 14 (23.3%) | 12 (13.0%) |
Technology Access in West Menlo Park
Computing Device Access in West Menlo Park
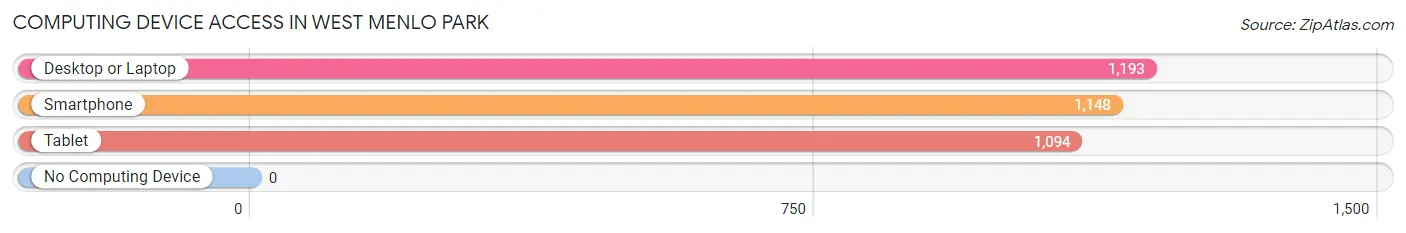
| Device Type | # Households | % Households |
| Desktop or Laptop | 1,193 | 100.0% |
| Smartphone | 1,148 | 96.2% |
| Tablet | 1,094 | 91.7% |
| No Computing Device | 0 | 0.0% |
| Total | 1,193 | 100.0% |
Internet Access in West Menlo Park
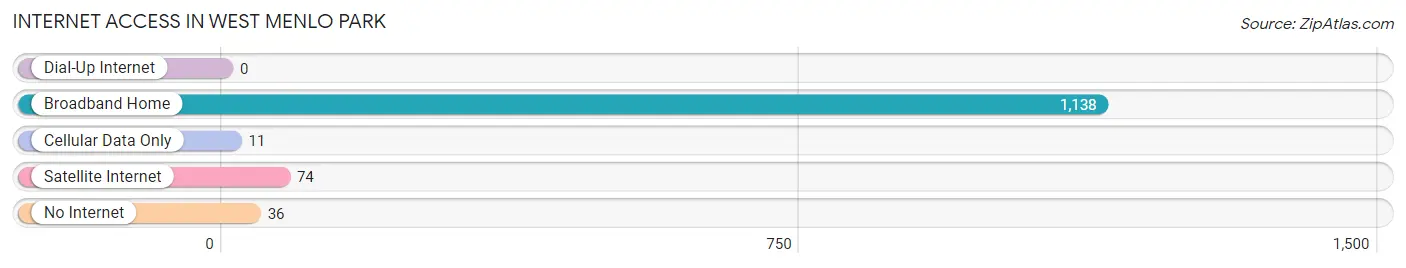
| Internet Type | # Households | % Households |
| Dial-Up Internet | 0 | 0.0% |
| Broadband Home | 1,138 | 95.4% |
| Cellular Data Only | 11 | 0.9% |
| Satellite Internet | 74 | 6.2% |
| No Internet | 36 | 3.0% |
| Total | 1,193 | 100.0% |
West Menlo Park Summary
Menlo Park is a city located in San Mateo County, California, United States, in the San Francisco Bay Area. It is located in the western part of the county, bordered by the cities of Palo Alto, Atherton, and Redwood City. The population was 32,026 at the 2010 census. Menlo Park is one of the most affluent cities in the United States, with a median household income of $118,844 in 2019.
History
The area that is now Menlo Park was originally inhabited by the Ohlone people, who lived in the area for thousands of years. The first European settlers arrived in the area in the mid-1800s, and the area was eventually incorporated as a city in 1874. The city was named after Menlo Park, a former estate owned by Leland Stanford, the founder of Stanford University.
The city grew rapidly in the early 20th century, and by the 1950s it had become a major center for technology and research. In the 1960s, the city was home to the first computer company, SRI International, and the first venture capital firm, Kleiner Perkins.
Geography
Menlo Park is located in the western part of San Mateo County, bordered by the cities of Palo Alto, Atherton, and Redwood City. It is situated on the San Francisco Peninsula, about 25 miles south of San Francisco. The city covers an area of 11.2 square miles, with a population density of 2,845 people per square mile.
The city is located in a temperate climate zone, with mild temperatures year-round. The average high temperature in July is 73°F, and the average low temperature in January is 46°F. The city receives an average of 22 inches of rain per year.
Economy
Menlo Park is a major center for technology and research, and is home to several major companies, including Facebook, Oracle, and Hewlett Packard. The city is also home to several venture capital firms, including Kleiner Perkins and Sequoia Capital.
The city's economy is also supported by a strong retail sector, with several shopping centers and malls located in the city. The city is also home to several major medical centers, including Stanford Medical Center and the Palo Alto Medical Foundation.
Demographics
As of the 2010 census, the population of Menlo Park was 32,026. The racial makeup of the city was 68.2% White, 11.2% Asian, 8.3% Hispanic or Latino, 6.2% African American, and 4.2% from other races.
The median household income in Menlo Park was $118,844 in 2019, making it one of the most affluent cities in the United States. The median age of the city's population was 38.7 years. The city's population is highly educated, with over 70% of the population having a bachelor's degree or higher.
Common Questions
What is Per Capita Income in West Menlo Park?
Per Capita income in West Menlo Park is $153,054.
What is the Median Family Income in West Menlo Park?
Median Family Income in West Menlo Park is $250,001.
What is the Median Household income in West Menlo Park?
Median Household Income in West Menlo Park is $250,001.
What is Income or Wage Gap in West Menlo Park?
Income or Wage Gap in West Menlo Park is 54.2%.
Women in West Menlo Park earn 45.8 cents for every dollar earned by a man.
What is Inequality or Gini Index in West Menlo Park?
Inequality or Gini Index in West Menlo Park is 0.46.
What is the Total Population of West Menlo Park?
Total Population of West Menlo Park is 3,401.
What is the Total Male Population of West Menlo Park?
Total Male Population of West Menlo Park is 1,579.
What is the Total Female Population of West Menlo Park?
Total Female Population of West Menlo Park is 1,822.
What is the Ratio of Males per 100 Females in West Menlo Park?
There are 86.66 Males per 100 Females in West Menlo Park.
What is the Ratio of Females per 100 Males in West Menlo Park?
There are 115.39 Females per 100 Males in West Menlo Park.
What is the Median Population Age in West Menlo Park?
Median Population Age in West Menlo Park is 39.4 Years.
What is the Average Family Size in West Menlo Park
Average Family Size in West Menlo Park is 3.2 People.
What is the Average Household Size in West Menlo Park
Average Household Size in West Menlo Park is 2.8 People.
How Large is the Labor Force in West Menlo Park?
There are 1,693 People in the Labor Forcein in West Menlo Park.
What is the Percentage of People in the Labor Force in West Menlo Park?
69.2% of People are in the Labor Force in West Menlo Park.
What is the Unemployment Rate in West Menlo Park?
Unemployment Rate in West Menlo Park is 4.1%.