Cities with the Highest Percentage of Population Employed in Legal Services & Support in Indiana
RELATED REPORTS & OPTIONS
Legal Services & Support
Indiana
Compare Cities
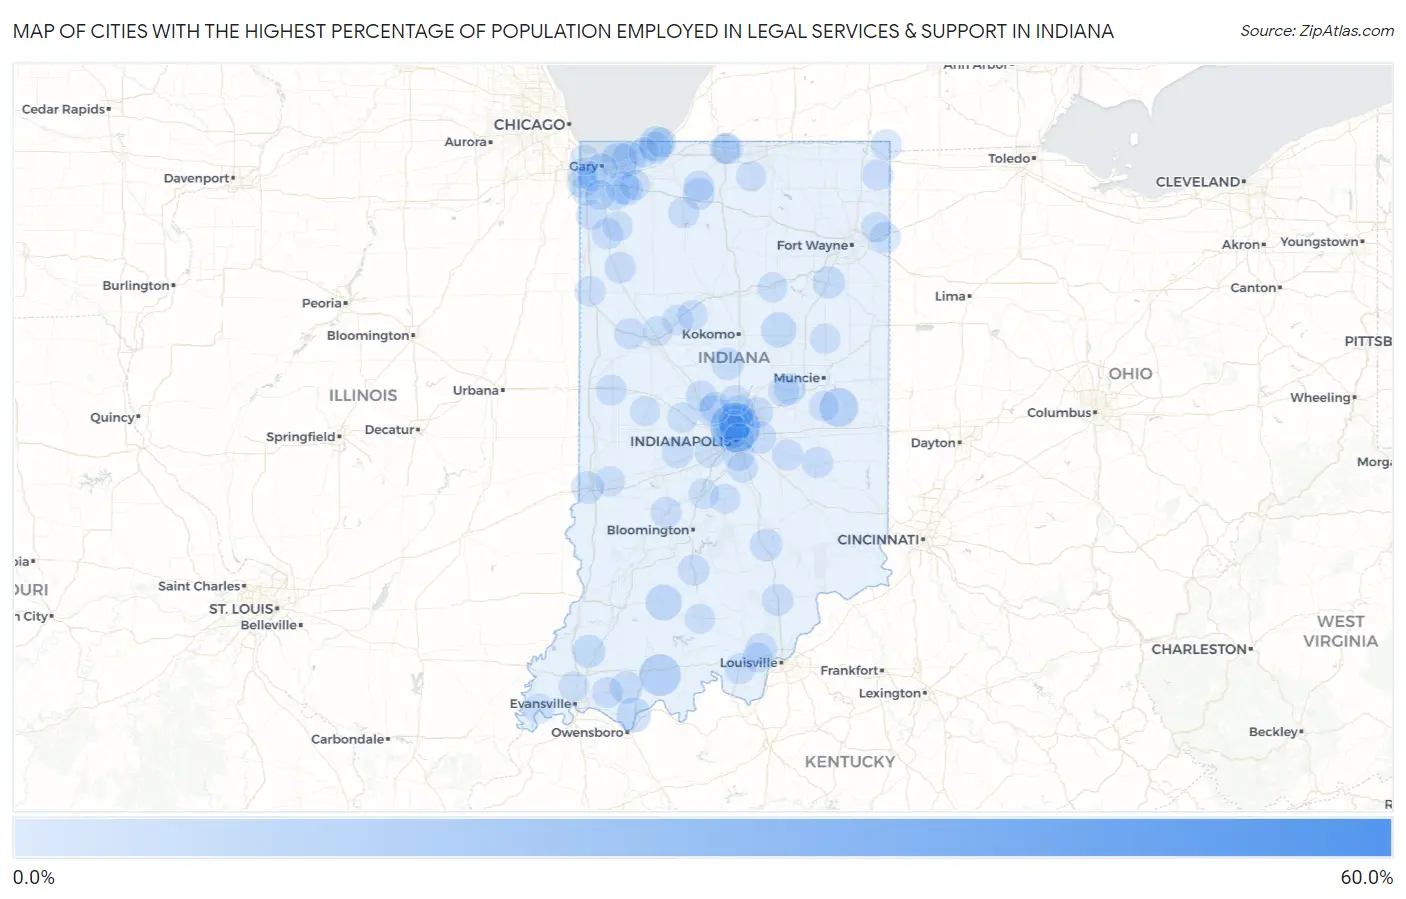
Map of Cities with the Highest Percentage of Population Employed in Legal Services & Support in Indiana
0.0%
60.0%
Cities with the Highest Percentage of Population Employed in Legal Services & Support in Indiana
| City | % Employed | vs State | vs National | |
| 1. | Preble | 57.1% | 0.76%(+56.4)#1 | 1.2%(+56.0)#7 |
| 2. | London | 50.0% | 0.76%(+49.2)#2 | 1.2%(+48.8)#9 |
| 3. | Westwood | 23.4% | 0.76%(+22.6)#3 | 1.2%(+22.2)#42 |
| 4. | Crows Nest | 17.2% | 0.76%(+16.5)#4 | 1.2%(+16.1)#80 |
| 5. | St Meinrad | 10.6% | 0.76%(+9.87)#5 | 1.2%(+9.45)#193 |
| 6. | Harrison Lake | 9.5% | 0.76%(+8.72)#6 | 1.2%(+8.30)#254 |
| 7. | Mooreland | 8.1% | 0.76%(+7.35)#7 | 1.2%(+6.92)#335 |
| 8. | Ogden Dunes | 7.0% | 0.76%(+6.20)#8 | 1.2%(+5.77)#445 |
| 9. | Meridian Hills | 6.2% | 0.76%(+5.44)#9 | 1.2%(+5.02)#565 |
| 10. | Wynnedale | 6.1% | 0.76%(+5.32)#10 | 1.2%(+4.90)#588 |
| 11. | Shoals | 5.8% | 0.76%(+5.03)#11 | 1.2%(+4.61)#640 |
| 12. | Browns Crossing | 5.8% | 0.76%(+5.02)#12 | 1.2%(+4.60)#643 |
| 13. | Celestine | 5.7% | 0.76%(+4.96)#13 | 1.2%(+4.54)#657 |
| 14. | Duneland Beach | 5.6% | 0.76%(+4.79)#14 | 1.2%(+4.37)#701 |
| 15. | Williams Creek | 5.5% | 0.76%(+4.71)#15 | 1.2%(+4.29)#714 |
| 16. | Herbst | 5.2% | 0.76%(+4.43)#16 | 1.2%(+4.01)#791 |
| 17. | Long Beach | 5.2% | 0.76%(+4.43)#17 | 1.2%(+4.00)#793 |
| 18. | Rockport | 4.9% | 0.76%(+4.12)#18 | 1.2%(+3.70)#880 |
| 19. | Cloverland | 4.7% | 0.76%(+3.97)#19 | 1.2%(+3.55)#930 |
| 20. | Waverly | 4.6% | 0.76%(+3.83)#20 | 1.2%(+3.41)#984 |
| 21. | Dune Acres | 4.5% | 0.76%(+3.73)#21 | 1.2%(+3.30)#1,016 |
| 22. | Foxcliff Estates | 3.9% | 0.76%(+3.19)#22 | 1.2%(+2.76)#1,258 |
| 23. | Snow Lake | 3.7% | 0.76%(+2.99)#23 | 1.2%(+2.57)#1,354 |
| 24. | Francisco | 3.6% | 0.76%(+2.82)#24 | 1.2%(+2.40)#1,473 |
| 25. | Shorewood Forest | 3.5% | 0.76%(+2.70)#25 | 1.2%(+2.28)#1,566 |
| 26. | Spring Hill | 3.3% | 0.76%(+2.57)#26 | 1.2%(+2.15)#1,655 |
| 27. | Toad Hop | 3.1% | 0.76%(+2.33)#27 | 1.2%(+1.91)#1,842 |
| 28. | Jonesville | 3.1% | 0.76%(+2.30)#28 | 1.2%(+1.88)#1,866 |
| 29. | Markle | 3.1% | 0.76%(+2.29)#29 | 1.2%(+1.87)#1,874 |
| 30. | Cumberland | 3.0% | 0.76%(+2.28)#30 | 1.2%(+1.86)#1,886 |
| 31. | Tennyson | 3.0% | 0.76%(+2.22)#31 | 1.2%(+1.80)#1,953 |
| 32. | Floyds Knobs | 2.9% | 0.76%(+2.18)#32 | 1.2%(+1.76)#2,000 |
| 33. | Kempton | 2.9% | 0.76%(+2.10)#33 | 1.2%(+1.67)#2,064 |
| 34. | Pottawattamie Park | 2.7% | 0.76%(+1.94)#34 | 1.2%(+1.52)#2,234 |
| 35. | Carmel | 2.7% | 0.76%(+1.90)#35 | 1.2%(+1.48)#2,273 |
| 36. | Koontz Lake | 2.4% | 0.76%(+1.63)#36 | 1.2%(+1.21)#2,590 |
| 37. | Whitestown | 2.3% | 0.76%(+1.57)#37 | 1.2%(+1.14)#2,684 |
| 38. | North Crows Nest | 2.3% | 0.76%(+1.56)#38 | 1.2%(+1.14)#2,689 |
| 39. | Coatesville | 2.3% | 0.76%(+1.51)#39 | 1.2%(+1.09)#2,757 |
| 40. | Country Club Heights | 2.3% | 0.76%(+1.51)#40 | 1.2%(+1.09)#2,760 |
| 41. | Scottsburg | 2.2% | 0.76%(+1.47)#41 | 1.2%(+1.05)#2,820 |
| 42. | Rensselaer | 2.2% | 0.76%(+1.41)#42 | 1.2%(+0.988)#2,923 |
| 43. | Homecroft | 2.2% | 0.76%(+1.40)#43 | 1.2%(+0.981)#2,942 |
| 44. | Galena | 2.1% | 0.76%(+1.33)#44 | 1.2%(+0.905)#3,056 |
| 45. | Otterbein | 2.1% | 0.76%(+1.31)#45 | 1.2%(+0.885)#3,092 |
| 46. | Rushville | 2.0% | 0.76%(+1.28)#46 | 1.2%(+0.855)#3,146 |
| 47. | Knox | 1.9% | 0.76%(+1.19)#47 | 1.2%(+0.765)#3,312 |
| 48. | St John | 1.9% | 0.76%(+1.18)#48 | 1.2%(+0.761)#3,318 |
| 49. | Oolitic | 1.9% | 0.76%(+1.17)#49 | 1.2%(+0.751)#3,335 |
| 50. | Roselawn | 1.9% | 0.76%(+1.17)#50 | 1.2%(+0.746)#3,345 |
| 51. | Morristown | 1.9% | 0.76%(+1.15)#51 | 1.2%(+0.727)#3,383 |
| 52. | Ulen | 1.9% | 0.76%(+1.12)#52 | 1.2%(+0.703)#3,434 |
| 53. | Zionsville | 1.9% | 0.76%(+1.10)#53 | 1.2%(+0.678)#3,490 |
| 54. | Indian Village | 1.9% | 0.76%(+1.09)#54 | 1.2%(+0.668)#3,513 |
| 55. | Hamilton | 1.8% | 0.76%(+1.09)#55 | 1.2%(+0.666)#3,515 |
| 56. | Clear Lake | 1.8% | 0.76%(+1.07)#56 | 1.2%(+0.645)#3,571 |
| 57. | Fishers | 1.8% | 0.76%(+1.03)#57 | 1.2%(+0.612)#3,655 |
| 58. | Edgewood | 1.8% | 0.76%(+1.01)#58 | 1.2%(+0.587)#3,710 |
| 59. | Boonville | 1.7% | 0.76%(+0.983)#59 | 1.2%(+0.561)#3,761 |
| 60. | Woodburn | 1.7% | 0.76%(+0.936)#60 | 1.2%(+0.514)#3,892 |
| 61. | Dyer | 1.7% | 0.76%(+0.929)#61 | 1.2%(+0.507)#3,915 |
| 62. | Aberdeen | 1.7% | 0.76%(+0.912)#62 | 1.2%(+0.490)#3,956 |
| 63. | Spencer | 1.6% | 0.76%(+0.848)#63 | 1.2%(+0.426)#4,095 |
| 64. | Corydon | 1.6% | 0.76%(+0.816)#64 | 1.2%(+0.394)#4,174 |
| 65. | Veedersburg | 1.6% | 0.76%(+0.804)#65 | 1.2%(+0.382)#4,206 |
| 66. | Walkerton | 1.5% | 0.76%(+0.758)#66 | 1.2%(+0.336)#4,348 |
| 67. | Roseland | 1.5% | 0.76%(+0.718)#67 | 1.2%(+0.296)#4,480 |
| 68. | Lowell | 1.4% | 0.76%(+0.674)#68 | 1.2%(+0.252)#4,624 |
| 69. | Gary | 1.4% | 0.76%(+0.666)#69 | 1.2%(+0.244)#4,648 |
| 70. | Lakes Of The Four Seasons | 1.4% | 0.76%(+0.662)#70 | 1.2%(+0.240)#4,661 |
| 71. | Martinsville | 1.4% | 0.76%(+0.659)#71 | 1.2%(+0.237)#4,680 |
| 72. | Plainfield | 1.4% | 0.76%(+0.653)#72 | 1.2%(+0.232)#4,691 |
| 73. | Delphi | 1.4% | 0.76%(+0.640)#73 | 1.2%(+0.218)#4,744 |
| 74. | Munster | 1.4% | 0.76%(+0.627)#74 | 1.2%(+0.206)#4,772 |
| 75. | Kentland | 1.4% | 0.76%(+0.623)#75 | 1.2%(+0.201)#4,790 |
| 76. | Griffith | 1.4% | 0.76%(+0.608)#76 | 1.2%(+0.187)#4,834 |
| 77. | Jamestown | 1.4% | 0.76%(+0.601)#77 | 1.2%(+0.179)#4,860 |
| 78. | Harlan | 1.3% | 0.76%(+0.585)#78 | 1.2%(+0.163)#4,908 |
| 79. | Camden | 1.3% | 0.76%(+0.562)#79 | 1.2%(+0.141)#4,987 |
| 80. | Indianapolis | 1.3% | 0.76%(+0.562)#80 | 1.2%(+0.140)#4,989 |
| 81. | Mount Summit | 1.3% | 0.76%(+0.504)#81 | 1.2%(+0.082)#5,185 |
| 82. | Valparaiso | 1.3% | 0.76%(+0.499)#82 | 1.2%(+0.077)#5,205 |
| 83. | Hammond | 1.3% | 0.76%(+0.495)#83 | 1.2%(+0.073)#5,226 |
| 84. | Georgetown | 1.3% | 0.76%(+0.495)#84 | 1.2%(+0.073)#5,227 |
| 85. | Wakarusa | 1.2% | 0.76%(+0.439)#85 | 1.2%(+0.017)#5,452 |
| 86. | Beverly Shores | 1.2% | 0.76%(+0.428)#86 | 1.2%(+0.007)#5,489 |
| 87. | Lake Holiday | 1.2% | 0.76%(+0.422)#87 | 1.2%(+0.000)#5,517 |
| 88. | De Motte | 1.2% | 0.76%(+0.414)#88 | 1.2%(-0.008)#5,540 |
| 89. | Hartford City | 1.2% | 0.76%(+0.402)#89 | 1.2%(-0.020)#5,587 |
| 90. | Wabash | 1.1% | 0.76%(+0.369)#90 | 1.2%(-0.053)#5,729 |
| 91. | Seelyville | 1.1% | 0.76%(+0.351)#91 | 1.2%(-0.070)#5,805 |
| 92. | Michiana Shores | 1.1% | 0.76%(+0.343)#92 | 1.2%(-0.079)#5,856 |
| 93. | Mount Vernon | 1.1% | 0.76%(+0.332)#93 | 1.2%(-0.090)#5,901 |
| 94. | Greenwood | 1.1% | 0.76%(+0.329)#94 | 1.2%(-0.093)#5,918 |
| 95. | Crown Point | 1.1% | 0.76%(+0.314)#95 | 1.2%(-0.108)#5,979 |
| 96. | Darmstadt | 1.1% | 0.76%(+0.303)#96 | 1.2%(-0.118)#6,030 |
| 97. | Morgantown | 1.0% | 0.76%(+0.286)#97 | 1.2%(-0.136)#6,124 |
| 98. | Battle Ground | 1.0% | 0.76%(+0.279)#98 | 1.2%(-0.143)#6,163 |
| 99. | Westfield | 0.99% | 0.76%(+0.225)#99 | 1.2%(-0.197)#6,433 |
| 100. | Paoli | 0.98% | 0.76%(+0.223)#100 | 1.2%(-0.199)#6,438 |
Common Questions
What are the Top 10 Cities with the Highest Percentage of Population Employed in Legal Services & Support in Indiana?
Top 10 Cities with the Highest Percentage of Population Employed in Legal Services & Support in Indiana are:
#1
17.2%
#2
10.6%
#3
8.1%
#4
7.0%
#5
6.2%
#6
6.1%
#7
5.8%
#8
5.5%
#9
5.2%
#10
5.2%
What city has the Highest Percentage of Population Employed in Legal Services & Support in Indiana?
Crows Nest has the Highest Percentage of Population Employed in Legal Services & Support in Indiana with 17.2%.
What is the Percentage of Population Employed in Legal Services & Support in the State of Indiana?
Percentage of Population Employed in Legal Services & Support in Indiana is 0.76%.
What is the Percentage of Population Employed in Legal Services & Support in the United States?
Percentage of Population Employed in Legal Services & Support in the United States is 1.2%.