Ross, CA Map & Demographics
Ross Map
Ross Overview
$148,521
PER CAPITA INCOME
$250,001
AVG FAMILY INCOME
$250,001
AVG HOUSEHOLD INCOME
77.7%
WAGE / INCOME GAP [ % ]
22.3¢/ $1
WAGE / INCOME GAP [ $ ]
0.51
INEQUALITY / GINI INDEX
2,537
TOTAL POPULATION
1,197
MALE POPULATION
1,340
FEMALE POPULATION
89.33
MALES / 100 FEMALES
111.95
FEMALES / 100 MALES
46.4
MEDIAN AGE
3.1
AVG FAMILY SIZE
2.8
AVG HOUSEHOLD SIZE
1,137
LABOR FORCE [ PEOPLE ]
57.7%
PERCENT IN LABOR FORCE
3.1%
UNEMPLOYMENT RATE
Ross Zip Codes
Income in Ross
Income Overview in Ross
Per Capita Income in Ross is $148,521, while median incomes of families and households are $250,001 and $250,001 respectively.
| Characteristic | Number | Measure |
| Per Capita Income | 2,537 | $148,521 |
| Median Family Income | 692 | $250,001 |
| Mean Family Income | 692 | $503,181 |
| Median Household Income | 884 | $250,001 |
| Mean Household Income | 884 | $430,034 |
| Income Deficit | 692 | $0 |
| Wage / Income Gap (%) | 2,537 | 77.74% |
| Wage / Income Gap ($) | 2,537 | 22.26¢ per $1 |
| Gini / Inequality Index | 2,537 | 0.51 |
Earnings by Sex in Ross
Average Earnings in Ross are $109,286, $206,667 for men and $46,000 for women, a difference of 77.7%.
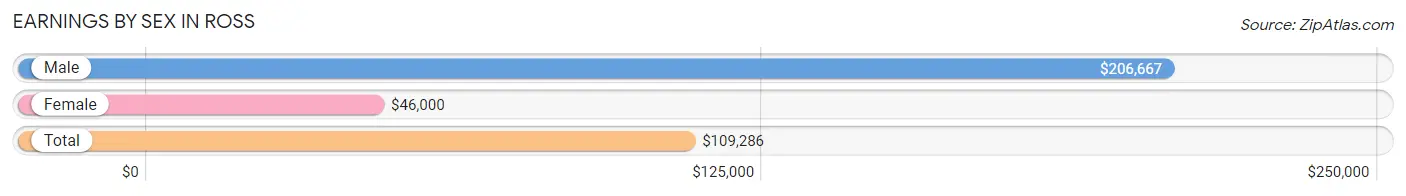
| Sex | Number | Average Earnings |
| Male | 626 (52.4%) | $206,667 |
| Female | 568 (47.6%) | $46,000 |
| Total | 1,194 (100.0%) | $109,286 |
Earnings by Sex by Income Bracket in Ross
The most common earnings brackets in Ross are $100,000+ for men (437 | 69.8%) and $100,000+ for women (198 | 34.9%).
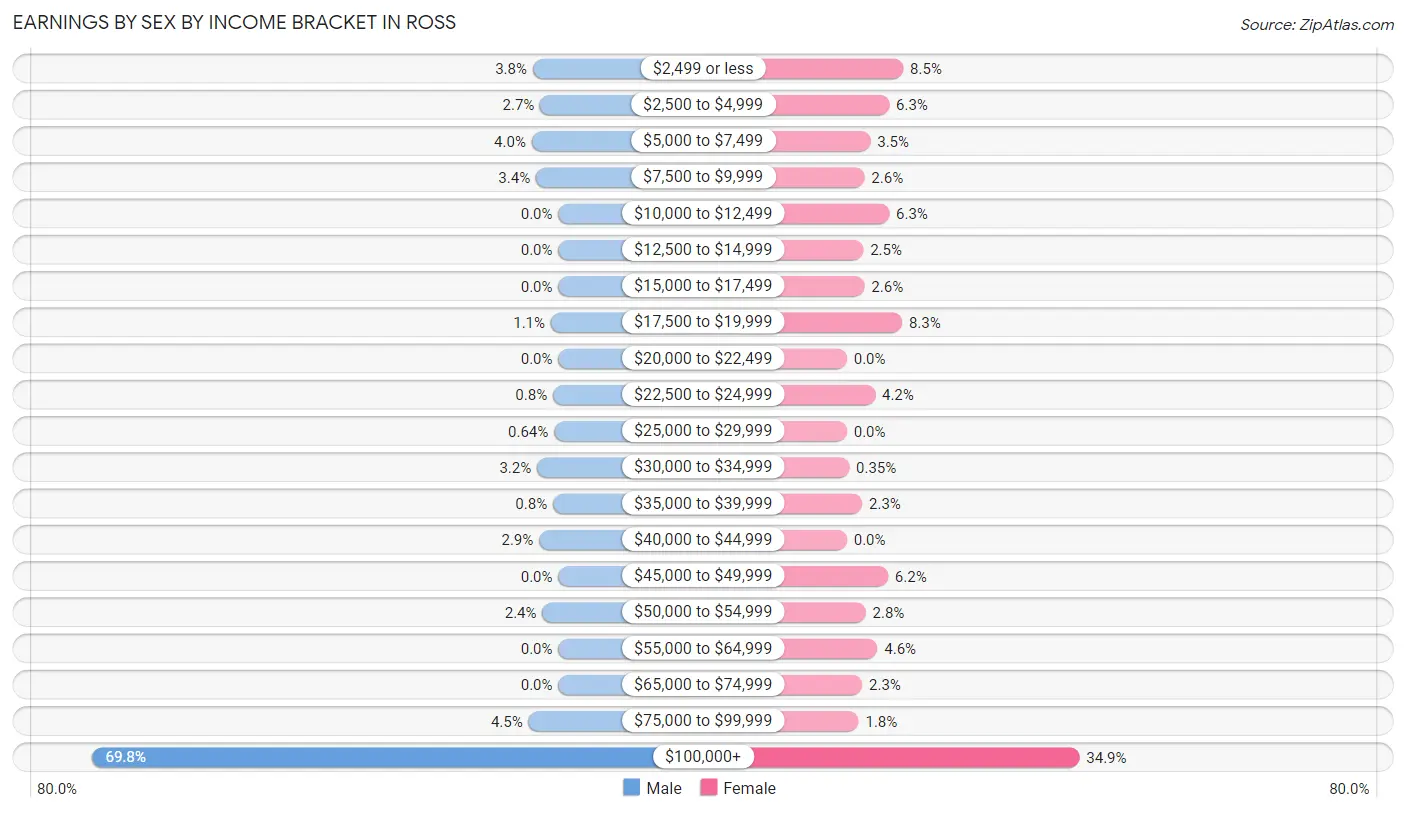
| Income | Male | Female |
| $2,499 or less | 24 (3.8%) | 48 (8.5%) |
| $2,500 to $4,999 | 17 (2.7%) | 36 (6.3%) |
| $5,000 to $7,499 | 25 (4.0%) | 20 (3.5%) |
| $7,500 to $9,999 | 21 (3.4%) | 15 (2.6%) |
| $10,000 to $12,499 | 0 (0.0%) | 36 (6.3%) |
| $12,500 to $14,999 | 0 (0.0%) | 14 (2.5%) |
| $15,000 to $17,499 | 0 (0.0%) | 15 (2.6%) |
| $17,500 to $19,999 | 7 (1.1%) | 47 (8.3%) |
| $20,000 to $22,499 | 0 (0.0%) | 0 (0.0%) |
| $22,500 to $24,999 | 5 (0.8%) | 24 (4.2%) |
| $25,000 to $29,999 | 4 (0.6%) | 0 (0.0%) |
| $30,000 to $34,999 | 20 (3.2%) | 2 (0.4%) |
| $35,000 to $39,999 | 5 (0.8%) | 13 (2.3%) |
| $40,000 to $44,999 | 18 (2.9%) | 0 (0.0%) |
| $45,000 to $49,999 | 0 (0.0%) | 35 (6.2%) |
| $50,000 to $54,999 | 15 (2.4%) | 16 (2.8%) |
| $55,000 to $64,999 | 0 (0.0%) | 26 (4.6%) |
| $65,000 to $74,999 | 0 (0.0%) | 13 (2.3%) |
| $75,000 to $99,999 | 28 (4.5%) | 10 (1.8%) |
| $100,000+ | 437 (69.8%) | 198 (34.9%) |
| Total | 626 (100.0%) | 568 (100.0%) |
Earnings by Sex by Educational Attainment in Ross
Average earnings in Ross are $230,750 for men and $58,558 for women, a difference of 74.6%. Men with an educational attainment of graduate degree enjoy the highest average annual earnings of $250,001, while those with college or associate's degree education earn the least with $166,705. Women with an educational attainment of graduate degree earn the most with the average annual earnings of $108,170, while those with college or associate's degree education have the smallest earnings of $46,071.
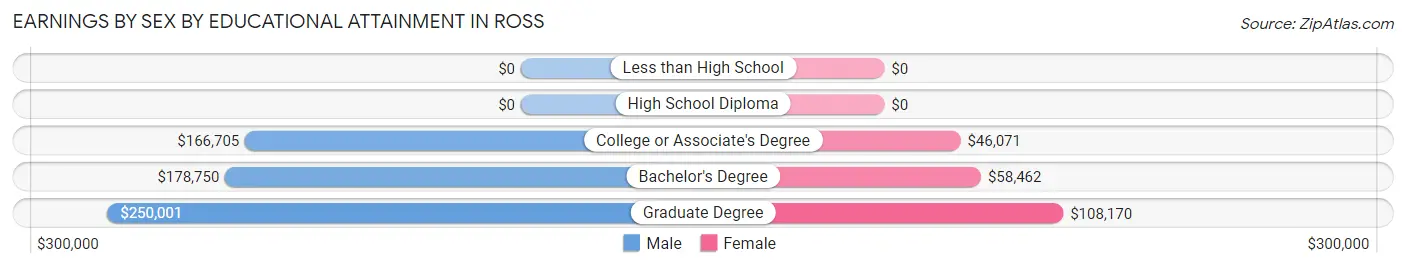
| Educational Attainment | Male Income | Female Income |
| Less than High School | - | - |
| High School Diploma | - | - |
| College or Associate's Degree | $166,705 | $46,071 |
| Bachelor's Degree | $178,750 | $58,462 |
| Graduate Degree | $250,001 | $108,170 |
| Total | $230,750 | $58,558 |
Family Income in Ross
Family Income Brackets in Ross
According to the Ross family income data, there are 518 families falling into the $200,000+ income range, which is the most common income bracket and makes up 74.9% of all families.
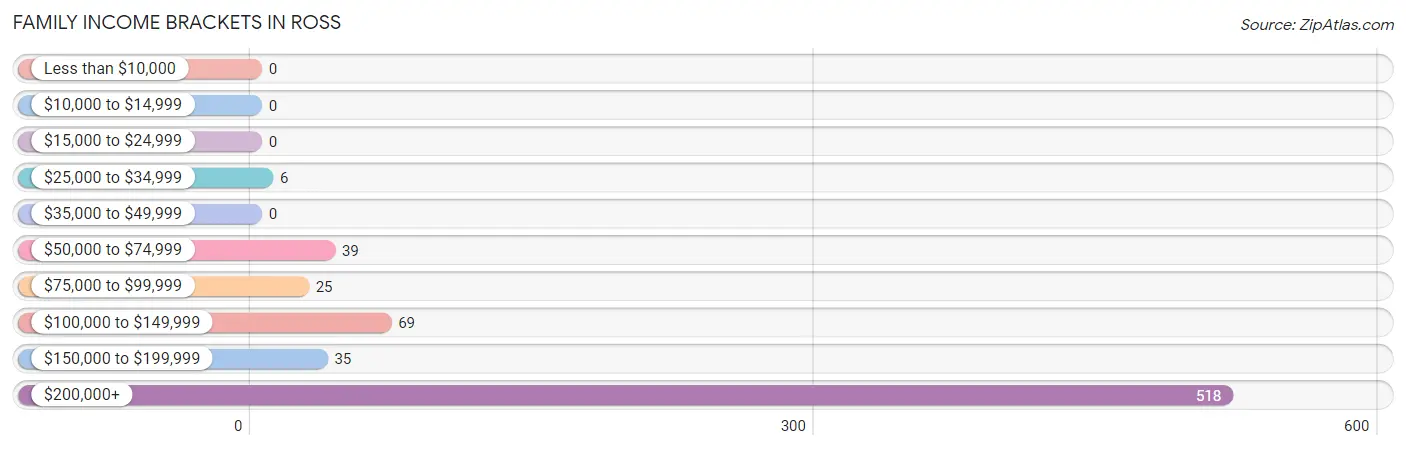
| Income Bracket | # Families | % Families |
| Less than $10,000 | 0 | 0.0% |
| $10,000 to $14,999 | 0 | 0.0% |
| $15,000 to $24,999 | 0 | 0.0% |
| $25,000 to $34,999 | 6 | 0.9% |
| $35,000 to $49,999 | 0 | 0.0% |
| $50,000 to $74,999 | 39 | 5.6% |
| $75,000 to $99,999 | 25 | 3.6% |
| $100,000 to $149,999 | 69 | 10.0% |
| $150,000 to $199,999 | 35 | 5.1% |
| $200,000+ | 518 | 74.9% |
Family Income by Famaliy Size in Ross
3-person families (186 | 26.9%) account for the highest median family income in Ross with $250,001 per family, while 2-person families (251 | 36.3%) have the highest median income of $113,476 per family member.
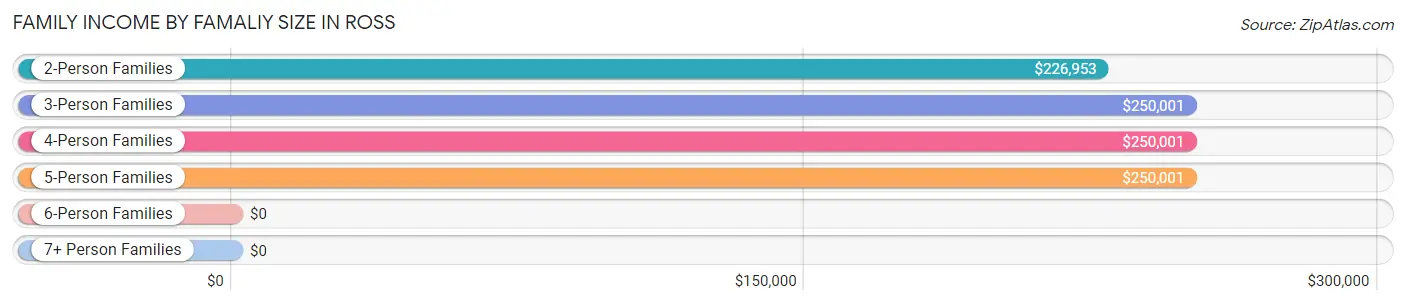
| Income Bracket | # Families | Median Income |
| 2-Person Families | 251 (36.3%) | $226,953 |
| 3-Person Families | 186 (26.9%) | $250,001 |
| 4-Person Families | 210 (30.3%) | $250,001 |
| 5-Person Families | 45 (6.5%) | $250,001 |
| 6-Person Families | 0 (0.0%) | $0 |
| 7+ Person Families | 0 (0.0%) | $0 |
| Total | 692 (100.0%) | $250,001 |
Family Income by Number of Earners in Ross
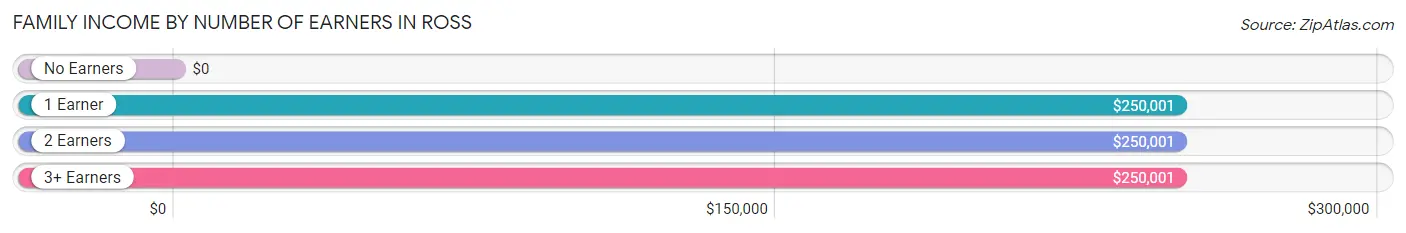
| Number of Earners | # Families | Median Income |
| No Earners | 99 (14.3%) | $0 |
| 1 Earner | 256 (37.0%) | $250,001 |
| 2 Earners | 288 (41.6%) | $250,001 |
| 3+ Earners | 49 (7.1%) | $250,001 |
| Total | 692 (100.0%) | $250,001 |
Household Income in Ross
Household Income Brackets in Ross
With 557 households falling in the category, the $200,000+ income range is the most frequent in Ross, accounting for 63.0% of all households.
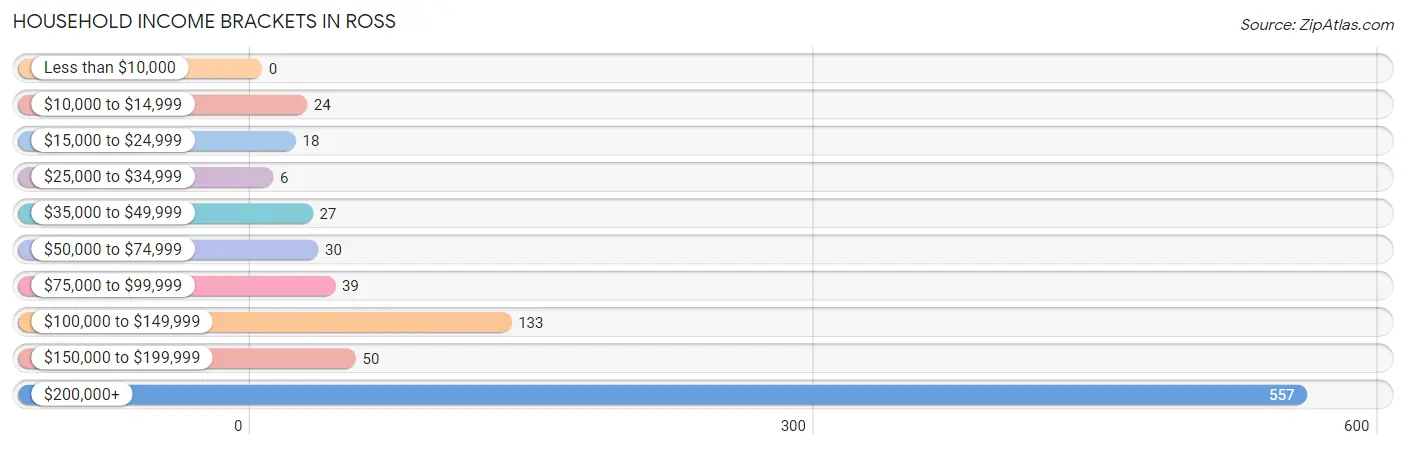
| Income Bracket | # Households | % Households |
| Less than $10,000 | 0 | 0.0% |
| $10,000 to $14,999 | 24 | 2.7% |
| $15,000 to $24,999 | 18 | 2.0% |
| $25,000 to $34,999 | 6 | 0.7% |
| $35,000 to $49,999 | 27 | 3.1% |
| $50,000 to $74,999 | 30 | 3.4% |
| $75,000 to $99,999 | 39 | 4.4% |
| $100,000 to $149,999 | 133 | 15.0% |
| $150,000 to $199,999 | 50 | 5.7% |
| $200,000+ | 557 | 63.0% |
Household Income by Householder Age in Ross
The median household income in Ross is $250,001, with the highest median household income of $250,001 found in the 25 to 44 years age bracket for the primary householder. A total of 129 households (14.6%) fall into this category.
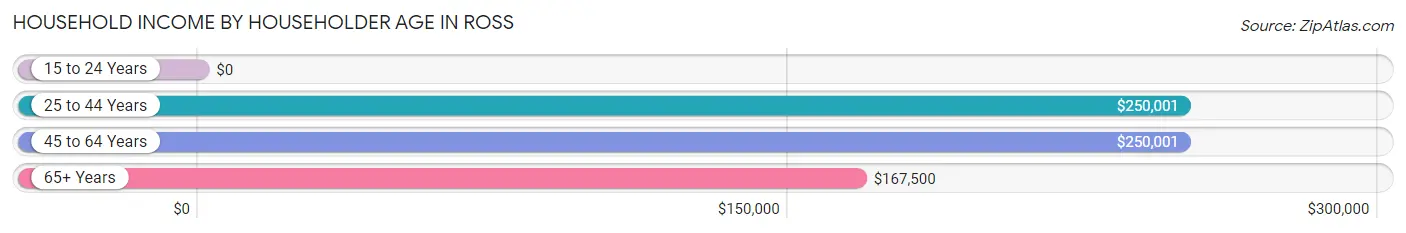
| Income Bracket | # Households | Median Income |
| 15 to 24 Years | 0 (0.0%) | $0 |
| 25 to 44 Years | 129 (14.6%) | $250,001 |
| 45 to 64 Years | 419 (47.4%) | $250,001 |
| 65+ Years | 336 (38.0%) | $167,500 |
| Total | 884 (100.0%) | $250,001 |
Poverty in Ross
Income Below Poverty by Sex and Age in Ross
With 2.4% poverty level for males and 5.3% for females among the residents of Ross, 55 to 64 year old males and 75 year old and over females are the most vulnerable to poverty, with 16 males (9.5%) and 24 females (17.0%) in their respective age groups living below the poverty level.
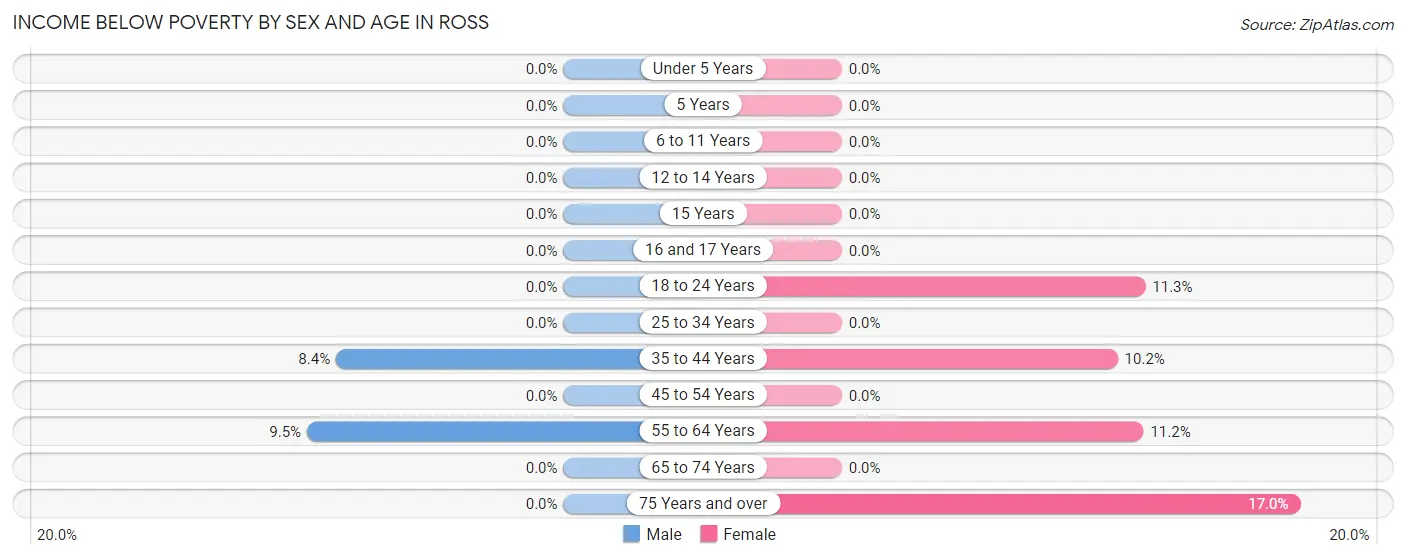
| Age Bracket | Male | Female |
| Under 5 Years | 0 (0.0%) | 0 (0.0%) |
| 5 Years | 0 (0.0%) | 0 (0.0%) |
| 6 to 11 Years | 0 (0.0%) | 0 (0.0%) |
| 12 to 14 Years | 0 (0.0%) | 0 (0.0%) |
| 15 Years | 0 (0.0%) | 0 (0.0%) |
| 16 and 17 Years | 0 (0.0%) | 0 (0.0%) |
| 18 to 24 Years | 0 (0.0%) | 16 (11.3%) |
| 25 to 34 Years | 0 (0.0%) | 0 (0.0%) |
| 35 to 44 Years | 13 (8.4%) | 17 (10.2%) |
| 45 to 54 Years | 0 (0.0%) | 0 (0.0%) |
| 55 to 64 Years | 16 (9.5%) | 14 (11.2%) |
| 65 to 74 Years | 0 (0.0%) | 0 (0.0%) |
| 75 Years and over | 0 (0.0%) | 24 (17.0%) |
| Total | 29 (2.4%) | 71 (5.3%) |
Income Above Poverty by Sex and Age in Ross
According to the poverty statistics in Ross, males aged under 5 years and females aged under 5 years are the age groups that are most secure financially, with 100.0% of males and 100.0% of females in these age groups living above the poverty line.
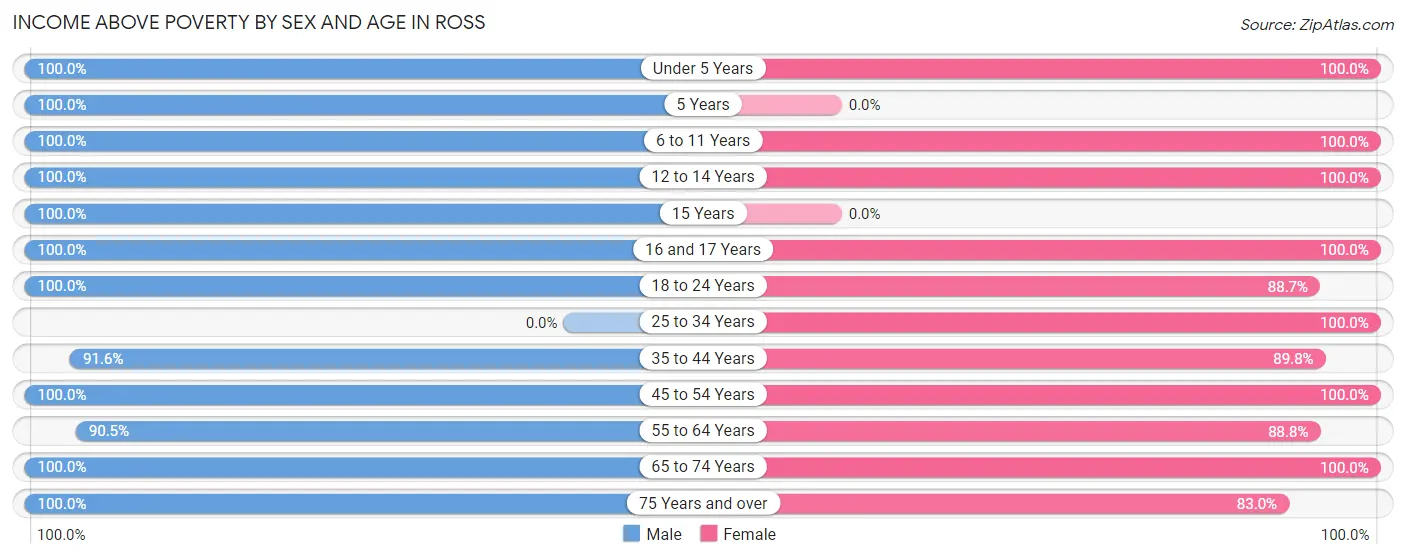
| Age Bracket | Male | Female |
| Under 5 Years | 65 (100.0%) | 59 (100.0%) |
| 5 Years | 14 (100.0%) | 0 (0.0%) |
| 6 to 11 Years | 188 (100.0%) | 135 (100.0%) |
| 12 to 14 Years | 44 (100.0%) | 57 (100.0%) |
| 15 Years | 4 (100.0%) | 0 (0.0%) |
| 16 and 17 Years | 83 (100.0%) | 57 (100.0%) |
| 18 to 24 Years | 23 (100.0%) | 126 (88.7%) |
| 25 to 34 Years | 0 (0.0%) | 46 (100.0%) |
| 35 to 44 Years | 141 (91.6%) | 149 (89.8%) |
| 45 to 54 Years | 252 (100.0%) | 233 (100.0%) |
| 55 to 64 Years | 152 (90.5%) | 111 (88.8%) |
| 65 to 74 Years | 99 (100.0%) | 179 (100.0%) |
| 75 Years and over | 103 (100.0%) | 117 (83.0%) |
| Total | 1,168 (97.6%) | 1,269 (94.7%) |
Income Below Poverty Among Married-Couple Families in Ross
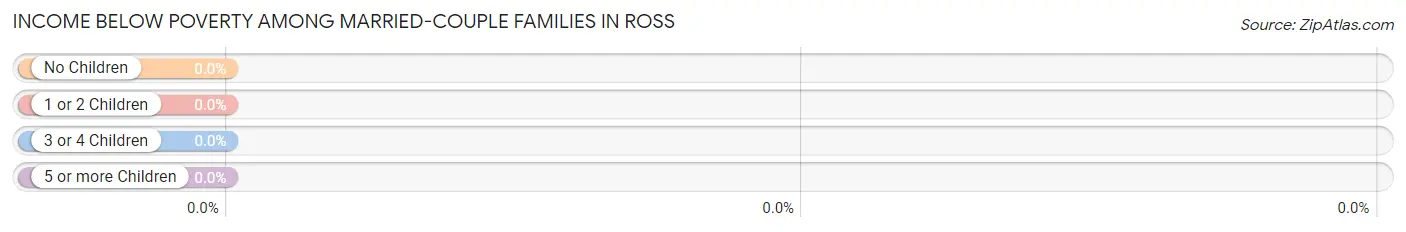
| Children | Above Poverty | Below Poverty |
| No Children | 239 (100.0%) | 0 (0.0%) |
| 1 or 2 Children | 316 (100.0%) | 0 (0.0%) |
| 3 or 4 Children | 42 (100.0%) | 0 (0.0%) |
| 5 or more Children | 0 (0.0%) | 0 (0.0%) |
| Total | 597 (100.0%) | 0 (0.0%) |
Income Below Poverty Among Single-Parent Households in Ross
| Children | Single Father | Single Mother |
| No Children | 0 (0.0%) | 0 (0.0%) |
| 1 or 2 Children | 0 (0.0%) | 0 (0.0%) |
| 3 or 4 Children | 0 (0.0%) | 0 (0.0%) |
| 5 or more Children | 0 (0.0%) | 0 (0.0%) |
| Total | 0 (0.0%) | 0 (0.0%) |
Income Below Poverty Among Married-Couple vs Single-Parent Households in Ross
| Children | Married-Couple Families | Single-Parent Households |
| No Children | 0 (0.0%) | 0 (0.0%) |
| 1 or 2 Children | 0 (0.0%) | 0 (0.0%) |
| 3 or 4 Children | 0 (0.0%) | 0 (0.0%) |
| 5 or more Children | 0 (0.0%) | 0 (0.0%) |
| Total | 0 (0.0%) | 0 (0.0%) |
Race in Ross
The most populous races in Ross are White / Caucasian (2,220 | 87.5%), Two or more Races (175 | 6.9%), and Hispanic or Latino (111 | 4.4%).
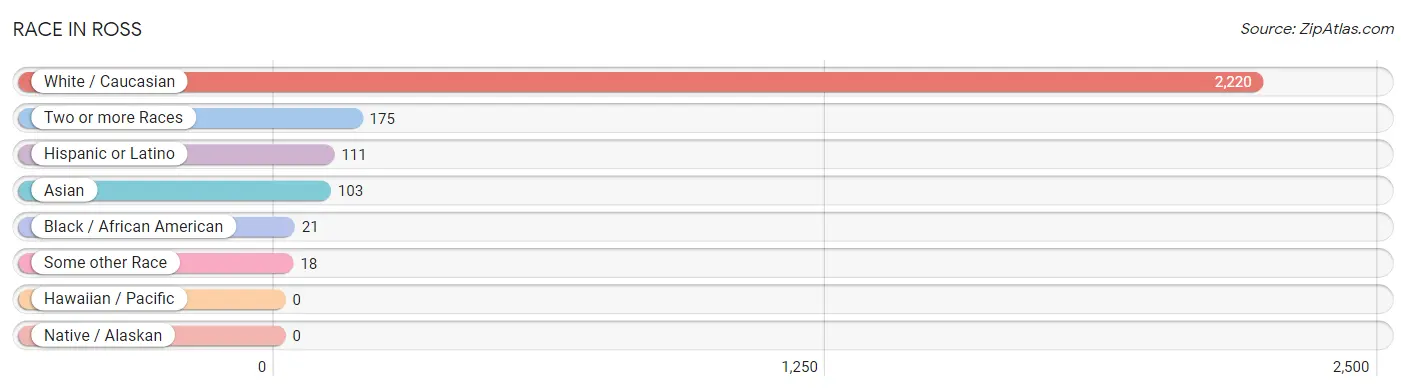
| Race | # Population | % Population |
| Asian | 103 | 4.1% |
| Black / African American | 21 | 0.8% |
| Hawaiian / Pacific | 0 | 0.0% |
| Hispanic or Latino | 111 | 4.4% |
| Native / Alaskan | 0 | 0.0% |
| White / Caucasian | 2,220 | 87.5% |
| Two or more Races | 175 | 6.9% |
| Some other Race | 18 | 0.7% |
| Total | 2,537 | 100.0% |
Ancestry in Ross
The most populous ancestries reported in Ross are English (504 | 19.9%), Irish (414 | 16.3%), German (376 | 14.8%), European (287 | 11.3%), and Italian (175 | 6.9%), together accounting for 69.2% of all Ross residents.
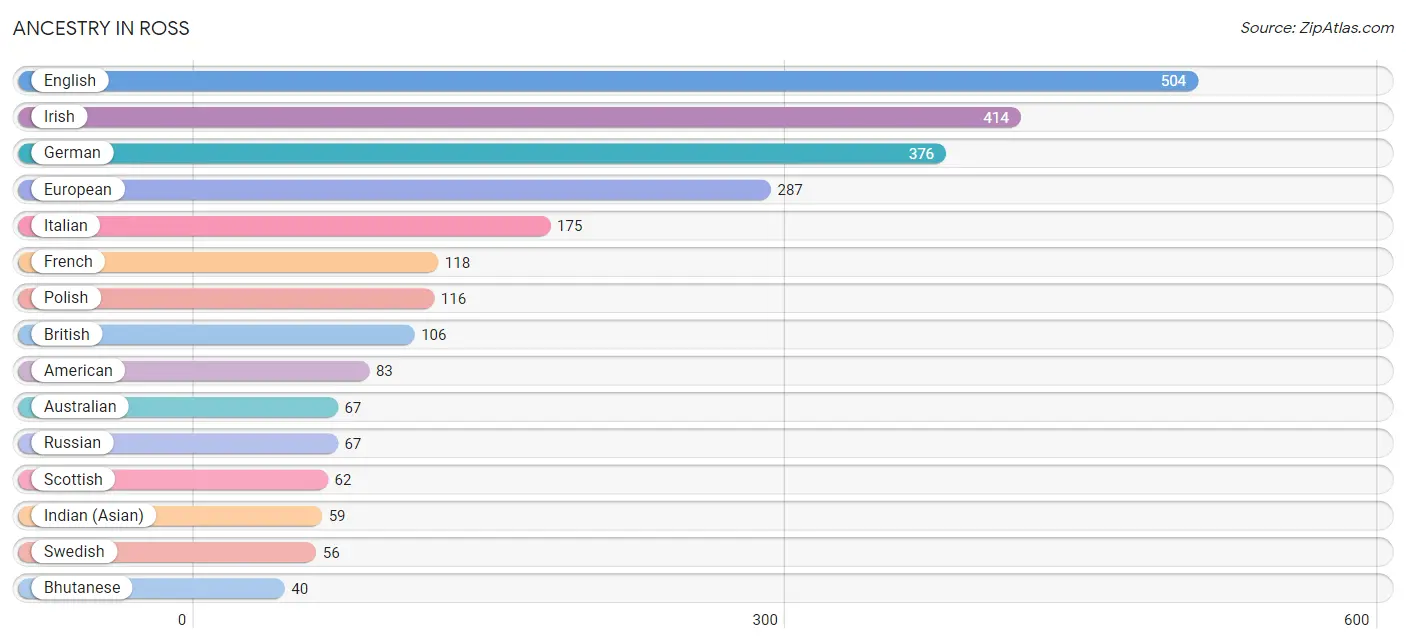
| Ancestry | # Population | % Population |
| American | 83 | 3.3% |
| Australian | 67 | 2.6% |
| Austrian | 30 | 1.2% |
| Bhutanese | 40 | 1.6% |
| Brazilian | 12 | 0.5% |
| British | 106 | 4.2% |
| Canadian | 37 | 1.5% |
| Central American | 3 | 0.1% |
| Central American Indian | 34 | 1.3% |
| Cuban | 10 | 0.4% |
| Czech | 6 | 0.2% |
| Czechoslovakian | 12 | 0.5% |
| Danish | 15 | 0.6% |
| Dutch | 30 | 1.2% |
| Eastern European | 8 | 0.3% |
| English | 504 | 19.9% |
| European | 287 | 11.3% |
| Finnish | 36 | 1.4% |
| French | 118 | 4.6% |
| French Canadian | 5 | 0.2% |
| German | 376 | 14.8% |
| Greek | 4 | 0.2% |
| Indian (Asian) | 59 | 2.3% |
| Iranian | 10 | 0.4% |
| Irish | 414 | 16.3% |
| Italian | 175 | 6.9% |
| Jamaican | 22 | 0.9% |
| Korean | 27 | 1.1% |
| Laotian | 12 | 0.5% |
| Lithuanian | 5 | 0.2% |
| Mexican | 32 | 1.3% |
| Nicaraguan | 3 | 0.1% |
| Northern European | 16 | 0.6% |
| Norwegian | 40 | 1.6% |
| Polish | 116 | 4.6% |
| Portuguese | 12 | 0.5% |
| Puerto Rican | 34 | 1.3% |
| Russian | 67 | 2.6% |
| Scandinavian | 7 | 0.3% |
| Scotch-Irish | 32 | 1.3% |
| Scottish | 62 | 2.4% |
| Spaniard | 15 | 0.6% |
| Spanish | 17 | 0.7% |
| Subsaharan African | 2 | 0.1% |
| Sudanese | 2 | 0.1% |
| Swedish | 56 | 2.2% |
| Thai | 28 | 1.1% |
| Ukrainian | 13 | 0.5% |
| Welsh | 12 | 0.5% | View All 49 Rows |
Immigrants in Ross
The most numerous immigrant groups reported in Ross came from Europe (100 | 3.9%), Canada (56 | 2.2%), Northern Europe (47 | 1.8%), Austria (30 | 1.2%), and Western Europe (30 | 1.2%), together accounting for 10.4% of all Ross residents.
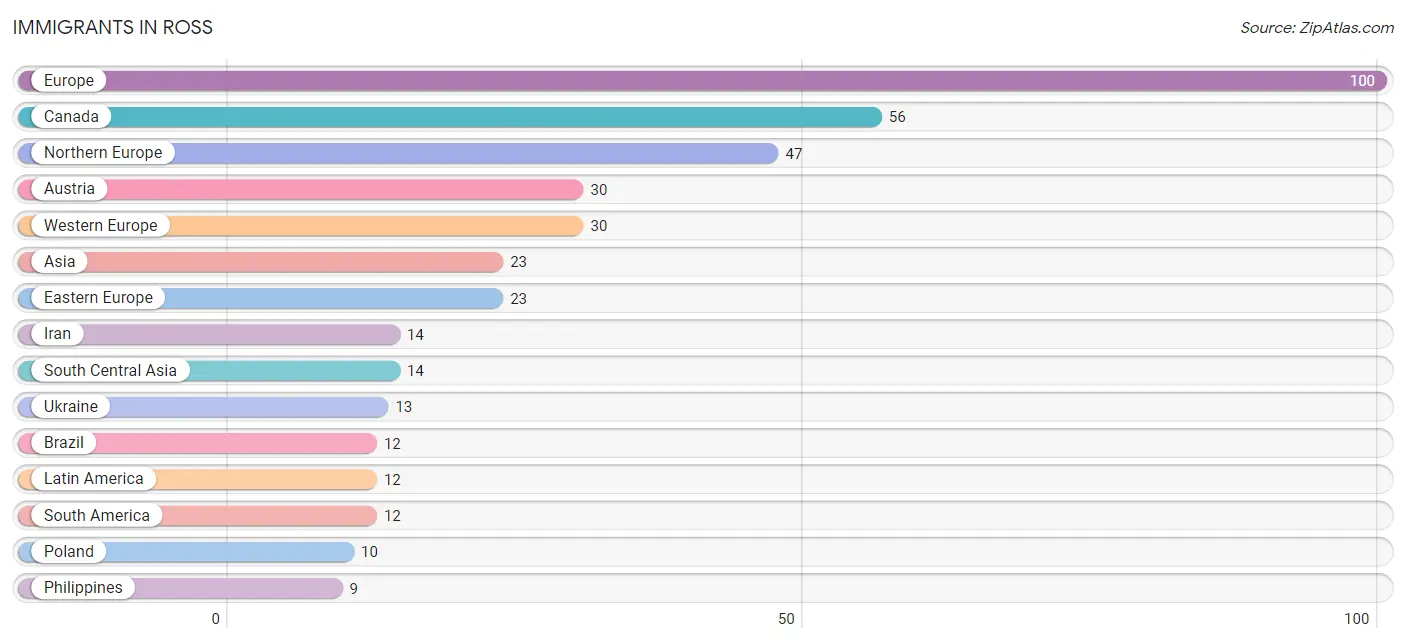
| Immigration Origin | # Population | % Population |
| Asia | 23 | 0.9% |
| Austria | 30 | 1.2% |
| Brazil | 12 | 0.5% |
| Canada | 56 | 2.2% |
| Eastern Europe | 23 | 0.9% |
| England | 6 | 0.2% |
| Europe | 100 | 3.9% |
| Iran | 14 | 0.5% |
| Latin America | 12 | 0.5% |
| Northern Europe | 47 | 1.8% |
| Philippines | 9 | 0.4% |
| Poland | 10 | 0.4% |
| Scotland | 6 | 0.2% |
| South America | 12 | 0.5% |
| South Central Asia | 14 | 0.5% |
| South Eastern Asia | 9 | 0.4% |
| Ukraine | 13 | 0.5% |
| Western Europe | 30 | 1.2% | View All 18 Rows |
Sex and Age in Ross
Sex and Age in Ross
The most populous age groups in Ross are 50 to 54 Years (199 | 16.6%) for men and 50 to 54 Years (137 | 10.2%) for women.
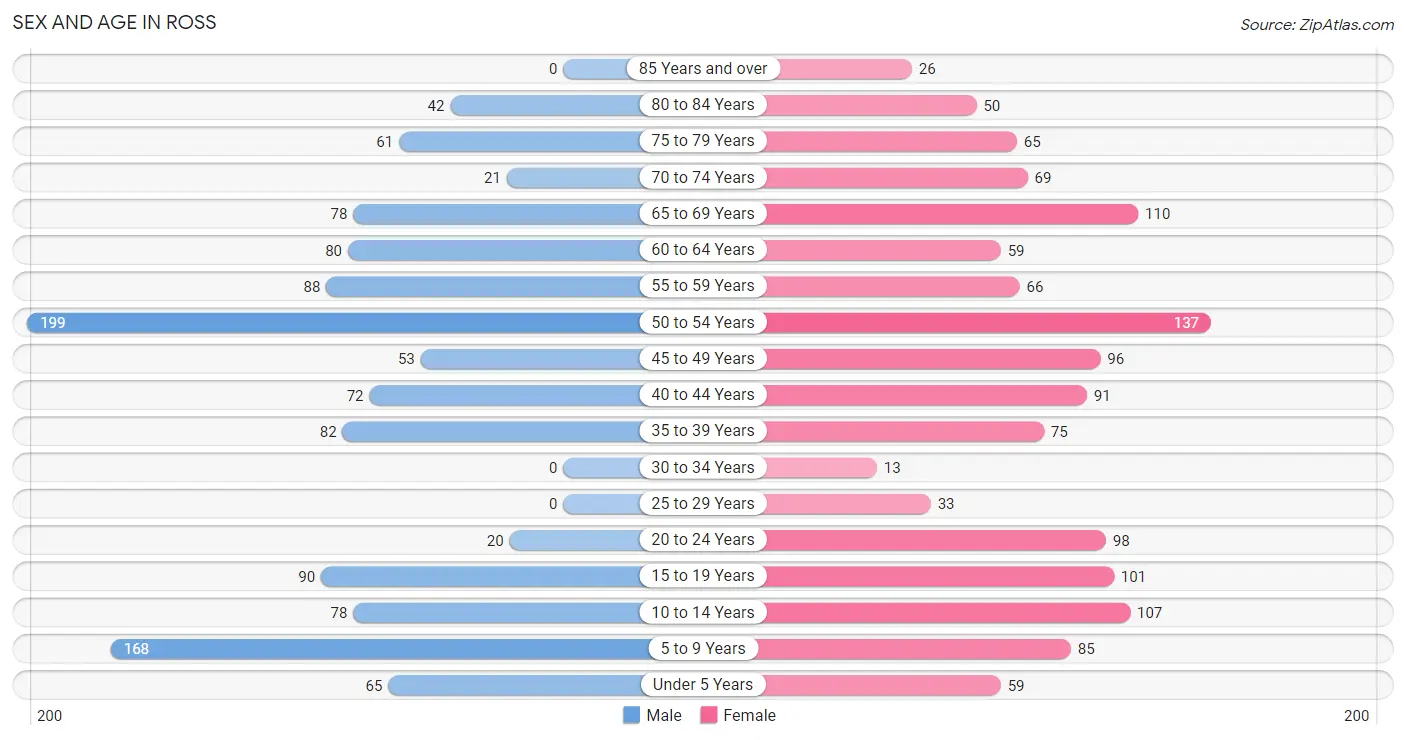
| Age Bracket | Male | Female |
| Under 5 Years | 65 (5.4%) | 59 (4.4%) |
| 5 to 9 Years | 168 (14.0%) | 85 (6.3%) |
| 10 to 14 Years | 78 (6.5%) | 107 (8.0%) |
| 15 to 19 Years | 90 (7.5%) | 101 (7.5%) |
| 20 to 24 Years | 20 (1.7%) | 98 (7.3%) |
| 25 to 29 Years | 0 (0.0%) | 33 (2.5%) |
| 30 to 34 Years | 0 (0.0%) | 13 (1.0%) |
| 35 to 39 Years | 82 (6.9%) | 75 (5.6%) |
| 40 to 44 Years | 72 (6.0%) | 91 (6.8%) |
| 45 to 49 Years | 53 (4.4%) | 96 (7.2%) |
| 50 to 54 Years | 199 (16.6%) | 137 (10.2%) |
| 55 to 59 Years | 88 (7.3%) | 66 (4.9%) |
| 60 to 64 Years | 80 (6.7%) | 59 (4.4%) |
| 65 to 69 Years | 78 (6.5%) | 110 (8.2%) |
| 70 to 74 Years | 21 (1.8%) | 69 (5.1%) |
| 75 to 79 Years | 61 (5.1%) | 65 (4.9%) |
| 80 to 84 Years | 42 (3.5%) | 50 (3.7%) |
| 85 Years and over | 0 (0.0%) | 26 (1.9%) |
| Total | 1,197 (100.0%) | 1,340 (100.0%) |
Families and Households in Ross
Median Family Size in Ross
The median family size in Ross is 3.14 persons per family, with single male/father families (38 | 5.5%) accounting for the largest median family size of 3.63 persons per family. On the other hand, single female/mother families (57 | 8.2%) represent the smallest median family size with 2.81 persons per family.
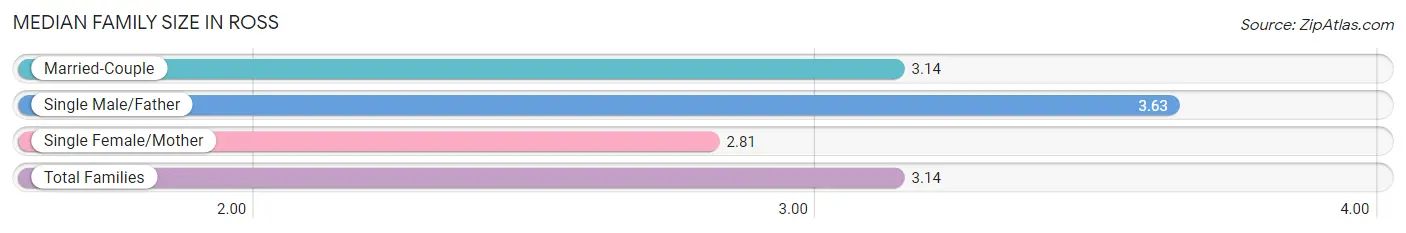
| Family Type | # Families | Family Size |
| Married-Couple | 597 (86.3%) | 3.14 |
| Single Male/Father | 38 (5.5%) | 3.63 |
| Single Female/Mother | 57 (8.2%) | 2.81 |
| Total Families | 692 (100.0%) | 3.14 |
Median Household Size in Ross
The median household size in Ross is 2.77 persons per household, with single male/father households (38 | 4.3%) accounting for the largest median household size of 3.97 persons per household. non-family households (192 | 21.7%) represent the smallest median household size with 1.14 persons per household.
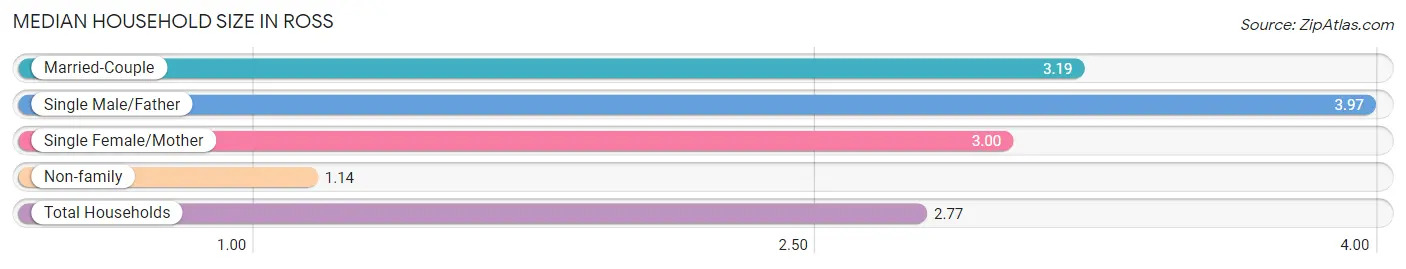
| Household Type | # Households | Household Size |
| Married-Couple | 597 (67.5%) | 3.19 |
| Single Male/Father | 38 (4.3%) | 3.97 |
| Single Female/Mother | 57 (6.5%) | 3.00 |
| Non-family | 192 (21.7%) | 1.14 |
| Total Households | 884 (100.0%) | 2.77 |
Household Size by Marriage Status in Ross
Out of a total of 884 households in Ross, 692 (78.3%) are family households, while 192 (21.7%) are nonfamily households. The most numerous type of family households are 2-person households, comprising 242, and the most common type of nonfamily households are 1-person households, comprising 180.
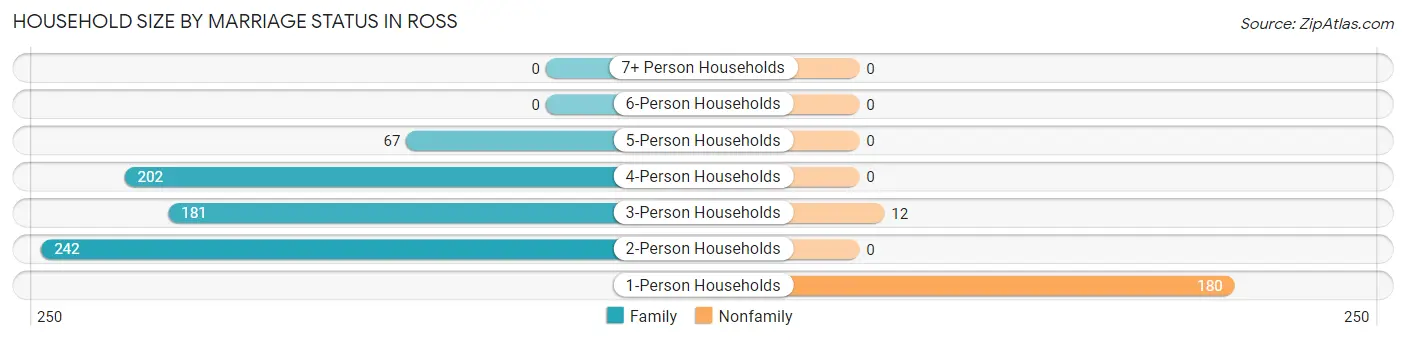
| Household Size | Family Households | Nonfamily Households |
| 1-Person Households | - | 180 (20.4%) |
| 2-Person Households | 242 (27.4%) | 0 (0.0%) |
| 3-Person Households | 181 (20.5%) | 12 (1.4%) |
| 4-Person Households | 202 (22.9%) | 0 (0.0%) |
| 5-Person Households | 67 (7.6%) | 0 (0.0%) |
| 6-Person Households | 0 (0.0%) | 0 (0.0%) |
| 7+ Person Households | 0 (0.0%) | 0 (0.0%) |
| Total | 692 (78.3%) | 192 (21.7%) |
Female Fertility in Ross
Fertility by Age in Ross
Average fertility rate in Ross is 80.0 births per 1,000 women. Women in the age bracket of 35 to 50 years have the highest fertility rate with 152.0 births per 1,000 women. Women in the age bracket of 35 to 50 years acount for 100.0% of all women with births.
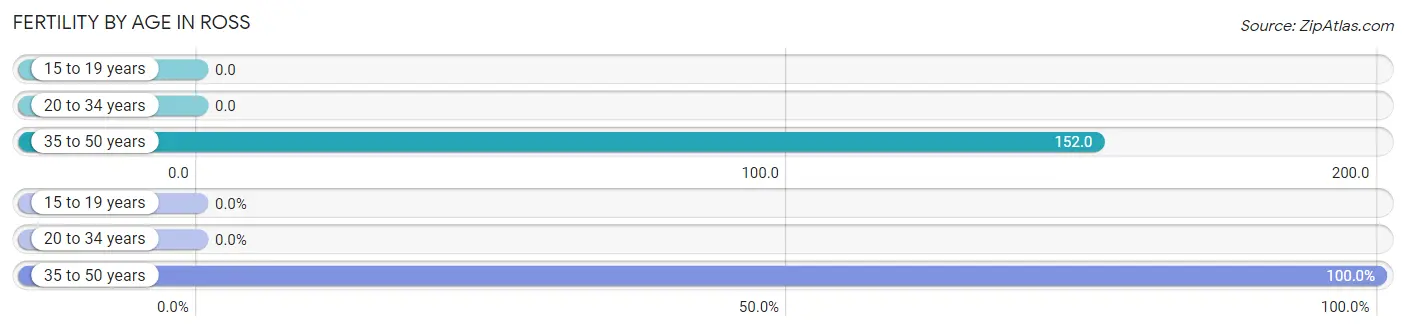
| Age Bracket | Women with Births | Births / 1,000 Women |
| 15 to 19 years | 0 (0.0%) | 0.0 |
| 20 to 34 years | 0 (0.0%) | 0.0 |
| 35 to 50 years | 41 (100.0%) | 152.0 |
| Total | 41 (100.0%) | 80.0 |
Fertility by Age by Marriage Status in Ross
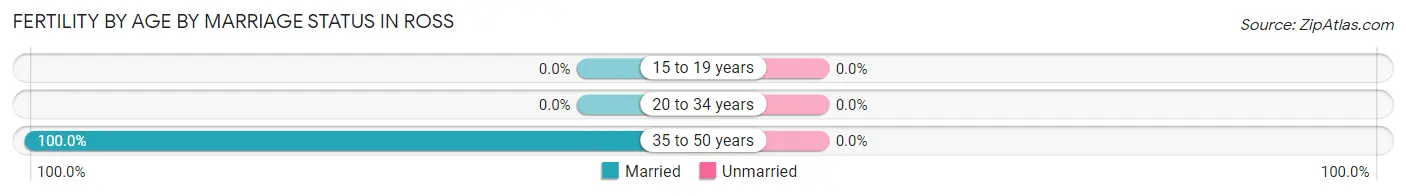
| Age Bracket | Married | Unmarried |
| 15 to 19 years | 0 (0.0%) | 0 (0.0%) |
| 20 to 34 years | 0 (0.0%) | 0 (0.0%) |
| 35 to 50 years | 41 (100.0%) | 0 (0.0%) |
| Total | 41 (100.0%) | 0 (0.0%) |
Fertility by Education in Ross
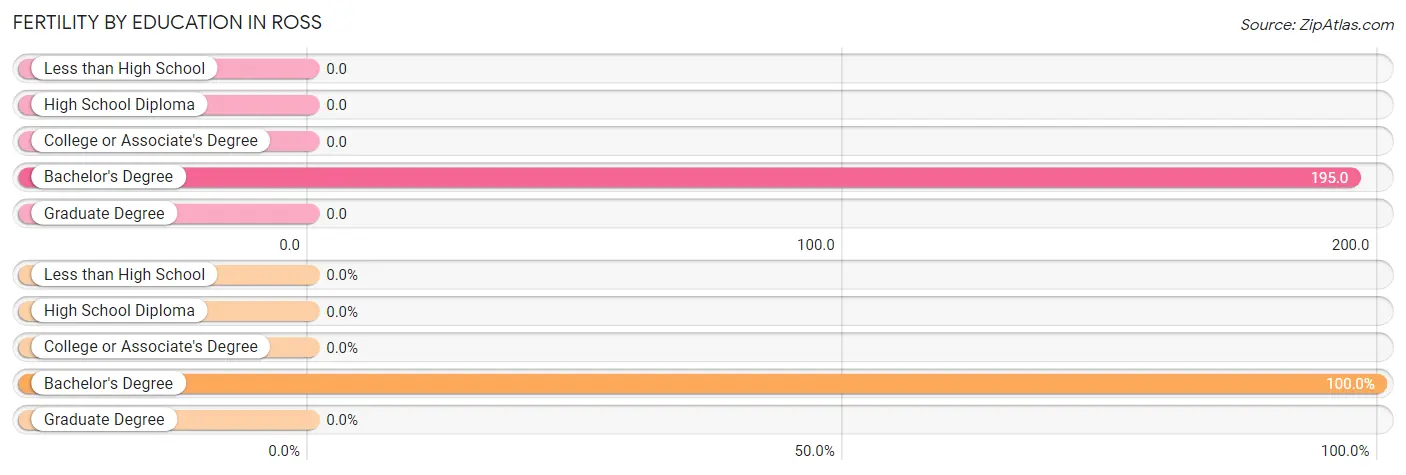
| Educational Attainment | Women with Births | Births / 1,000 Women |
| Less than High School | 0 (0.0%) | 0.0 |
| High School Diploma | 0 (0.0%) | 0.0 |
| College or Associate's Degree | 0 (0.0%) | 0.0 |
| Bachelor's Degree | 41 (100.0%) | 195.0 |
| Graduate Degree | 0 (0.0%) | 0.0 |
| Total | 41 (100.0%) | 80.0 |
Fertility by Education by Marriage Status in Ross
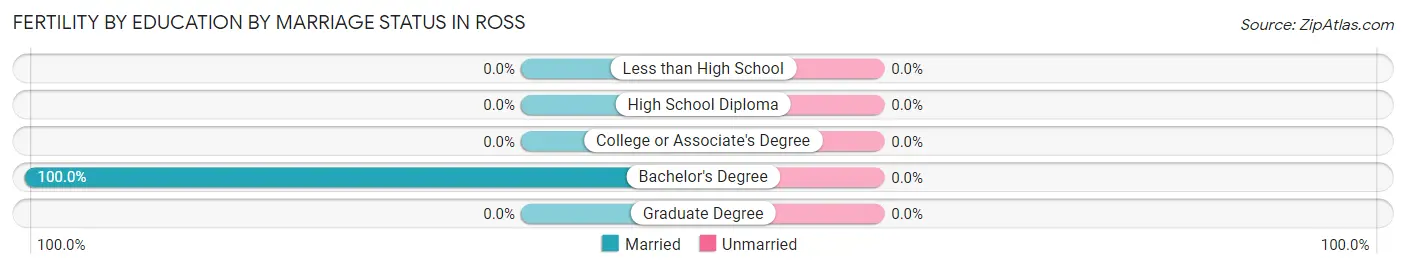
| Educational Attainment | Married | Unmarried |
| Less than High School | 0 (0.0%) | 0 (0.0%) |
| High School Diploma | 0 (0.0%) | 0 (0.0%) |
| College or Associate's Degree | 0 (0.0%) | 0 (0.0%) |
| Bachelor's Degree | 41 (100.0%) | 0 (0.0%) |
| Graduate Degree | 0 (0.0%) | 0 (0.0%) |
| Total | 41 (100.0%) | 0 (0.0%) |
Employment Characteristics in Ross
Employment by Class of Employer in Ross
Among the 1,077 employed individuals in Ross, private company employees (677 | 62.9%), self-employed (not incorporated) (141 | 13.1%), and self-employed (incorporated) (109 | 10.1%) make up the most common classes of employment.
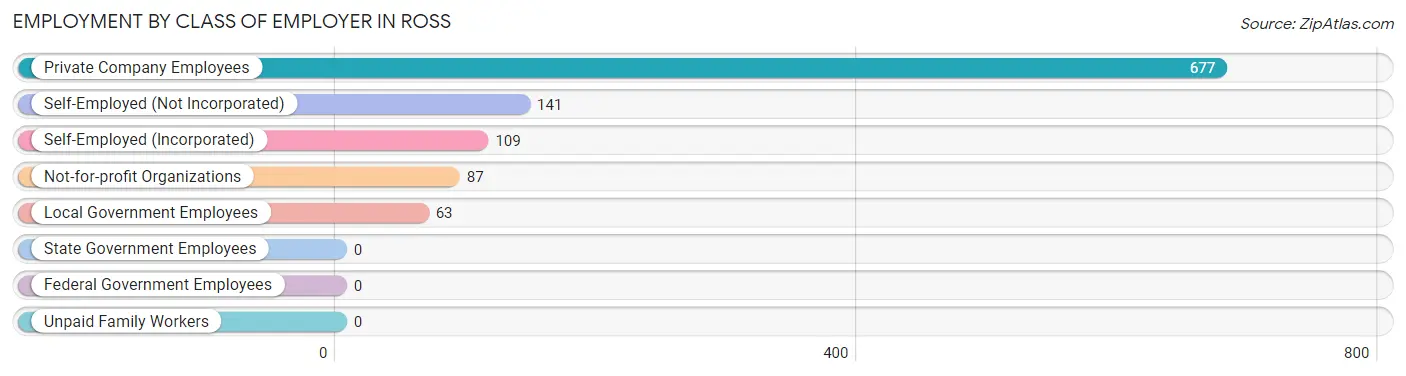
| Employer Class | # Employees | % Employees |
| Private Company Employees | 677 | 62.9% |
| Self-Employed (Incorporated) | 109 | 10.1% |
| Self-Employed (Not Incorporated) | 141 | 13.1% |
| Not-for-profit Organizations | 87 | 8.1% |
| Local Government Employees | 63 | 5.9% |
| State Government Employees | 0 | 0.0% |
| Federal Government Employees | 0 | 0.0% |
| Unpaid Family Workers | 0 | 0.0% |
| Total | 1,077 | 100.0% |
Employment Status by Age in Ross
According to the labor force statistics for Ross, out of the total population over 16 years of age (1,971), 57.7% or 1,137 individuals are in the labor force, with 3.1% or 35 of them unemployed. The age group with the highest labor force participation rate is 25 to 29 years, with 100.0% or 33 individuals in the labor force. Within the labor force, the 35 to 44 years age range has the highest percentage of unemployed individuals, with 6.6% or 15 of them being unemployed.
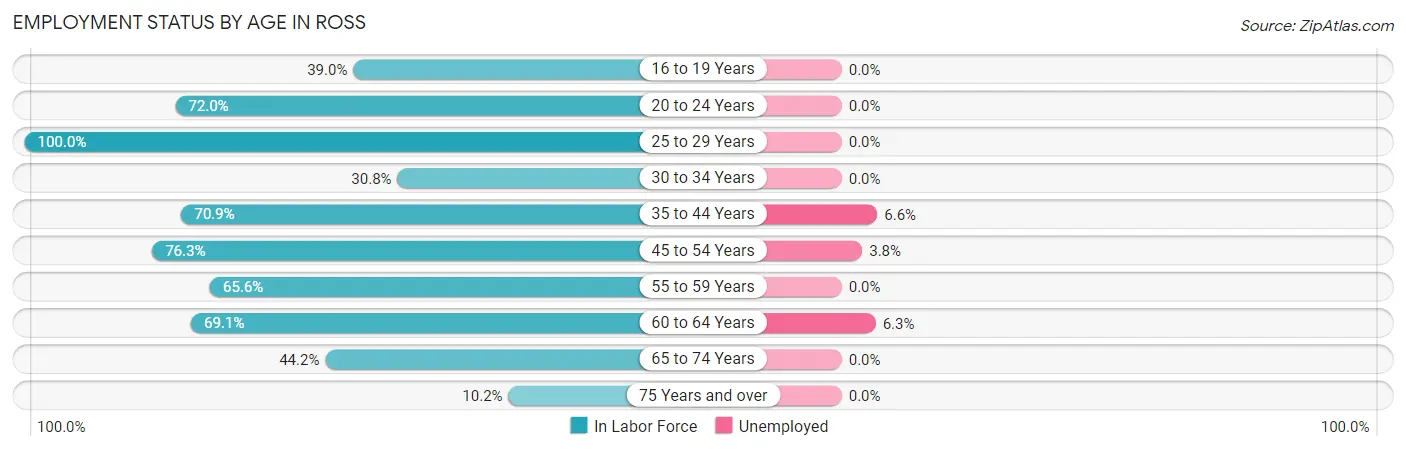
| Age Bracket | In Labor Force | Unemployed |
| 16 to 19 Years | 73 (39.0%) | 0 (0.0%) |
| 20 to 24 Years | 85 (72.0%) | 0 (0.0%) |
| 25 to 29 Years | 33 (100.0%) | 0 (0.0%) |
| 30 to 34 Years | 4 (30.8%) | 0 (0.0%) |
| 35 to 44 Years | 227 (70.9%) | 15 (6.6%) |
| 45 to 54 Years | 370 (76.3%) | 14 (3.8%) |
| 55 to 59 Years | 101 (65.6%) | 0 (0.0%) |
| 60 to 64 Years | 96 (69.1%) | 6 (6.3%) |
| 65 to 74 Years | 123 (44.2%) | 0 (0.0%) |
| 75 Years and over | 25 (10.2%) | 0 (0.0%) |
| Total | 1,137 (57.7%) | 35 (3.1%) |
Employment Status by Educational Attainment in Ross
According to labor force statistics for Ross, 72.6% of individuals (831) out of the total population between 25 and 64 years of age (1,144) are in the labor force, with 4.2% or 35 of them being unemployed. The group with the highest labor force participation rate are those with the educational attainment of bachelor's degree or higher, with 76.9% or 748 individuals in the labor force. Within the labor force, individuals with college / associate degree education have the highest percentage of unemployment, with 7.4% or 6 of them being unemployed.
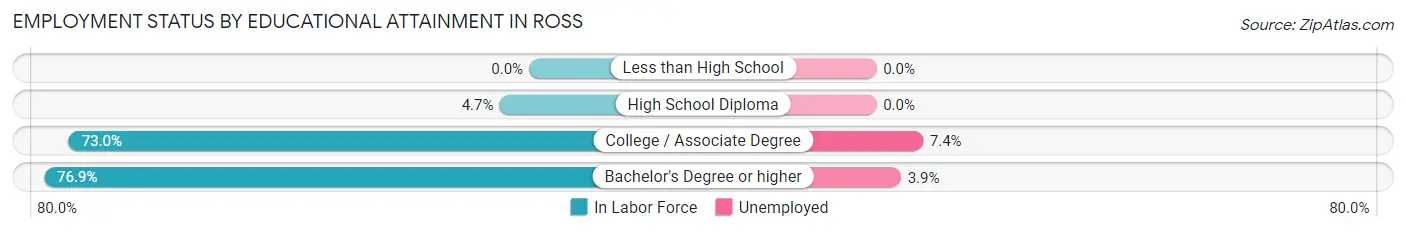
| Educational Attainment | In Labor Force | Unemployed |
| Less than High School | 0 (0.0%) | 0 (0.0%) |
| High School Diploma | 2 (4.7%) | 0 (0.0%) |
| College / Associate Degree | 81 (73.0%) | 8 (7.4%) |
| Bachelor's Degree or higher | 748 (76.9%) | 38 (3.9%) |
| Total | 831 (72.6%) | 48 (4.2%) |
Employment Occupations by Sex in Ross
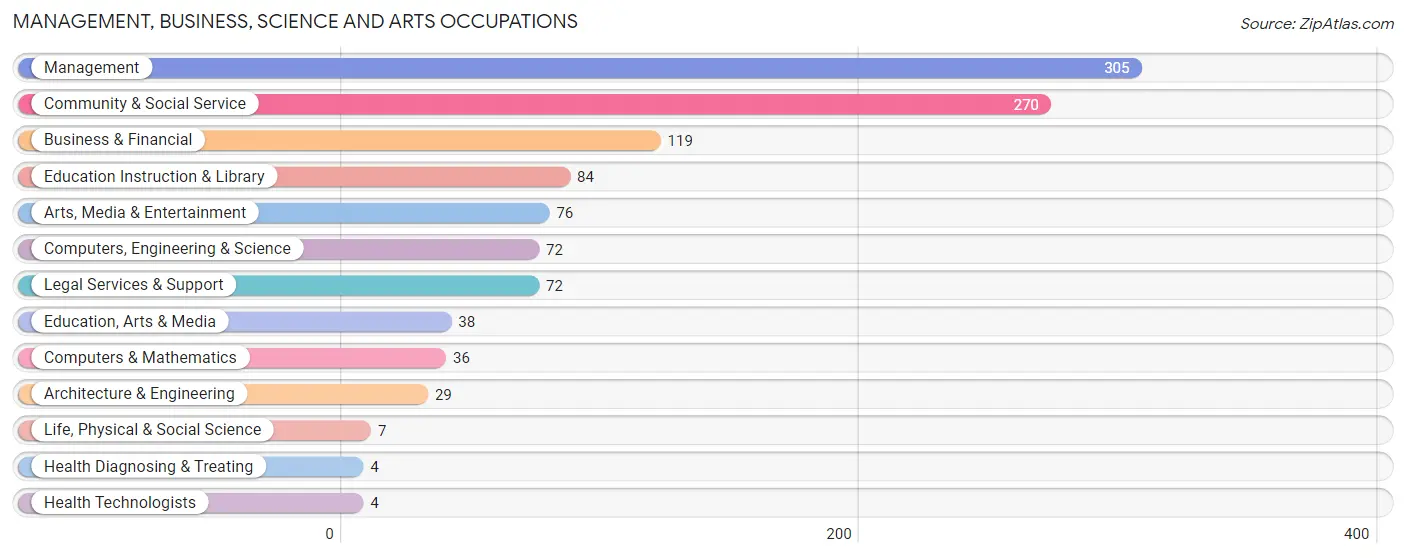
Management, Business, Science and Arts Occupations
The most common Management, Business, Science and Arts occupations in Ross are Management (305 | 27.7%), Community & Social Service (270 | 24.5%), Business & Financial (119 | 10.8%), Education Instruction & Library (84 | 7.6%), and Arts, Media & Entertainment (76 | 6.9%).
Management, Business, Science and Arts Occupations by Sex
Within the Management, Business, Science and Arts occupations in Ross, the most male-oriented occupations are Life, Physical & Social Science (100.0%), Health Diagnosing & Treating (100.0%), and Health Technologists (100.0%), while the most female-oriented occupations are Education Instruction & Library (76.2%), Architecture & Engineering (62.1%), and Arts, Media & Entertainment (61.8%).
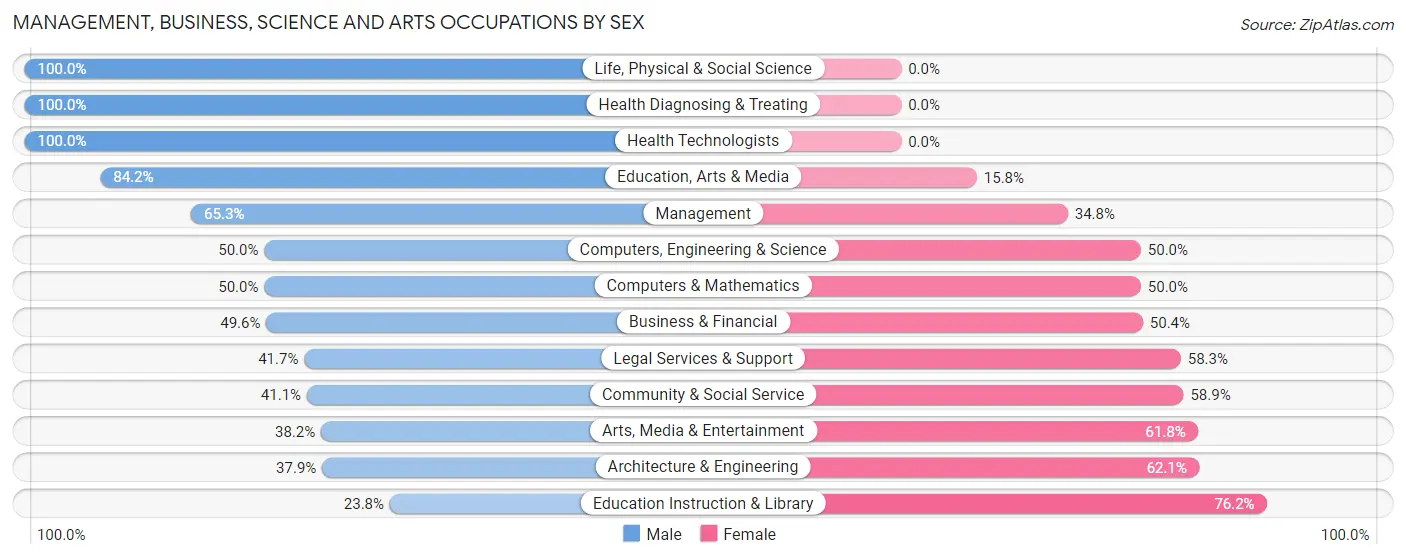
| Occupation | Male | Female |
| Management | 199 (65.2%) | 106 (34.7%) |
| Business & Financial | 59 (49.6%) | 60 (50.4%) |
| Computers, Engineering & Science | 36 (50.0%) | 36 (50.0%) |
| Computers & Mathematics | 18 (50.0%) | 18 (50.0%) |
| Architecture & Engineering | 11 (37.9%) | 18 (62.1%) |
| Life, Physical & Social Science | 7 (100.0%) | 0 (0.0%) |
| Community & Social Service | 111 (41.1%) | 159 (58.9%) |
| Education, Arts & Media | 32 (84.2%) | 6 (15.8%) |
| Legal Services & Support | 30 (41.7%) | 42 (58.3%) |
| Education Instruction & Library | 20 (23.8%) | 64 (76.2%) |
| Arts, Media & Entertainment | 29 (38.2%) | 47 (61.8%) |
| Health Diagnosing & Treating | 4 (100.0%) | 0 (0.0%) |
| Health Technologists | 4 (100.0%) | 0 (0.0%) |
| Total (Category) | 409 (53.1%) | 361 (46.9%) |
| Total (Overall) | 578 (52.4%) | 524 (47.5%) |
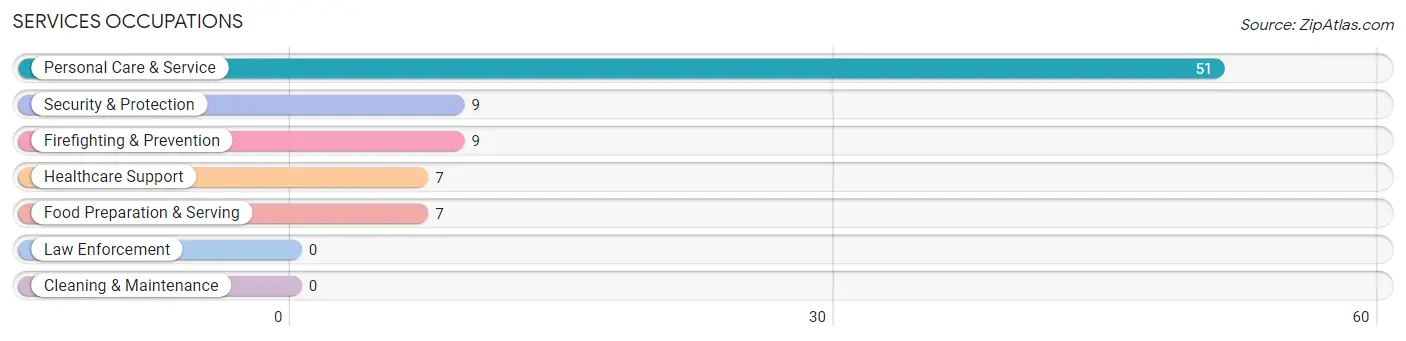
Services Occupations
The most common Services occupations in Ross are Personal Care & Service (51 | 4.6%), Security & Protection (9 | 0.8%), Firefighting & Prevention (9 | 0.8%), Healthcare Support (7 | 0.6%), and Food Preparation & Serving (7 | 0.6%).
Services Occupations by Sex
Within the Services occupations in Ross, the most male-oriented occupations are Security & Protection (100.0%), Firefighting & Prevention (100.0%), and Healthcare Support (42.9%), while the most female-oriented occupations are Food Preparation & Serving (100.0%), Personal Care & Service (100.0%), and Healthcare Support (57.1%).
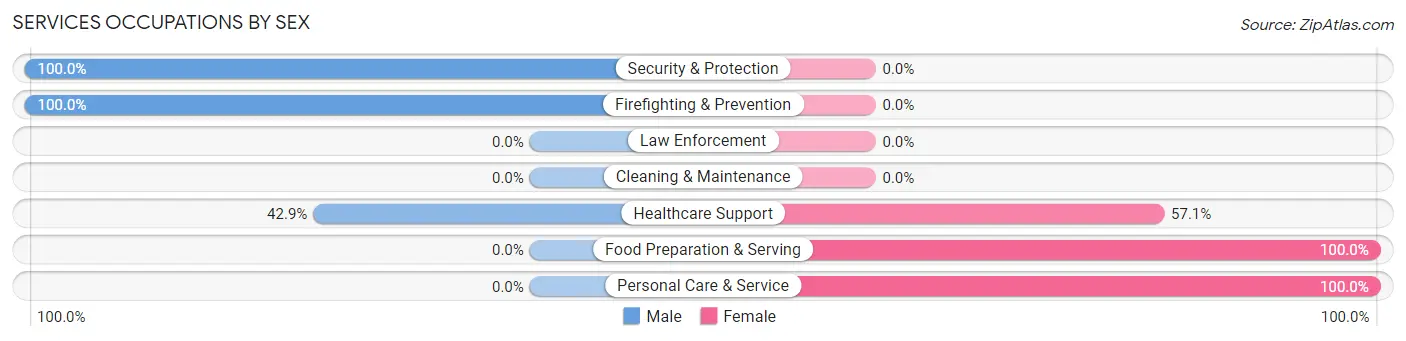
| Occupation | Male | Female |
| Healthcare Support | 3 (42.9%) | 4 (57.1%) |
| Security & Protection | 9 (100.0%) | 0 (0.0%) |
| Firefighting & Prevention | 9 (100.0%) | 0 (0.0%) |
| Law Enforcement | 0 (0.0%) | 0 (0.0%) |
| Food Preparation & Serving | 0 (0.0%) | 7 (100.0%) |
| Cleaning & Maintenance | 0 (0.0%) | 0 (0.0%) |
| Personal Care & Service | 0 (0.0%) | 51 (100.0%) |
| Total (Category) | 12 (16.2%) | 62 (83.8%) |
| Total (Overall) | 578 (52.4%) | 524 (47.5%) |
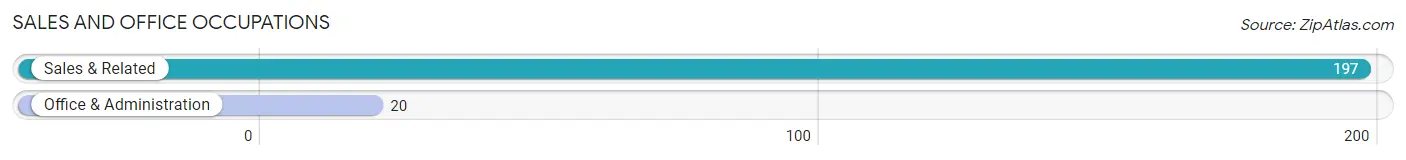
Sales and Office Occupations
The most common Sales and Office occupations in Ross are Sales & Related (197 | 17.9%), and Office & Administration (20 | 1.8%).
Sales and Office Occupations by Sex
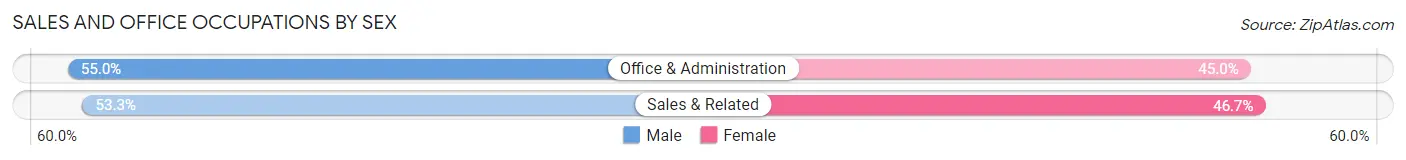
| Occupation | Male | Female |
| Sales & Related | 105 (53.3%) | 92 (46.7%) |
| Office & Administration | 11 (55.0%) | 9 (45.0%) |
| Total (Category) | 116 (53.5%) | 101 (46.5%) |
| Total (Overall) | 578 (52.4%) | 524 (47.5%) |
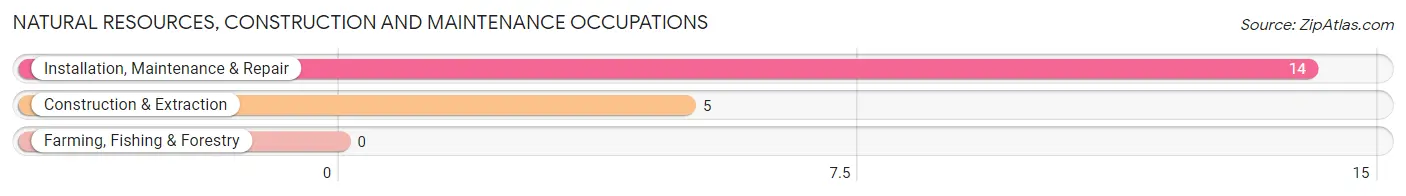
Natural Resources, Construction and Maintenance Occupations
The most common Natural Resources, Construction and Maintenance occupations in Ross are Installation, Maintenance & Repair (14 | 1.3%), and Construction & Extraction (5 | 0.4%).
Natural Resources, Construction and Maintenance Occupations by Sex
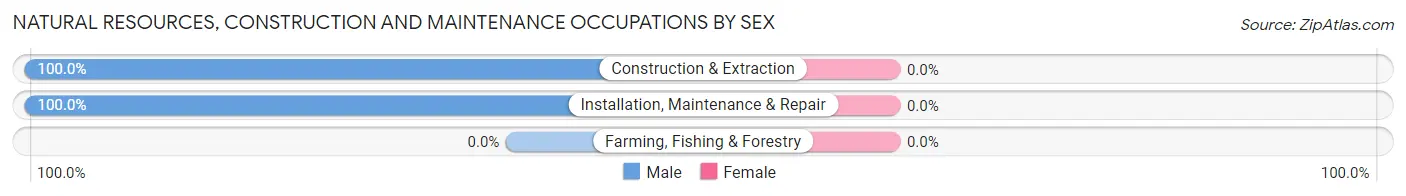
| Occupation | Male | Female |
| Farming, Fishing & Forestry | 0 (0.0%) | 0 (0.0%) |
| Construction & Extraction | 5 (100.0%) | 0 (0.0%) |
| Installation, Maintenance & Repair | 14 (100.0%) | 0 (0.0%) |
| Total (Category) | 19 (100.0%) | 0 (0.0%) |
| Total (Overall) | 578 (52.4%) | 524 (47.5%) |
Production, Transportation and Moving Occupations
The most common Production, Transportation and Moving occupations in Ross are Material Moving (13 | 1.2%), and Production (9 | 0.8%).
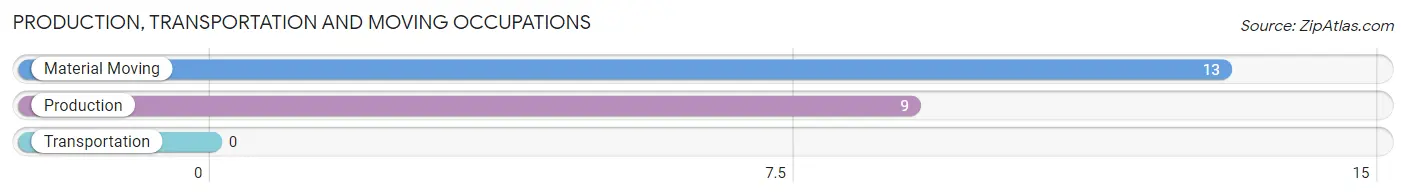
Production, Transportation and Moving Occupations by Sex
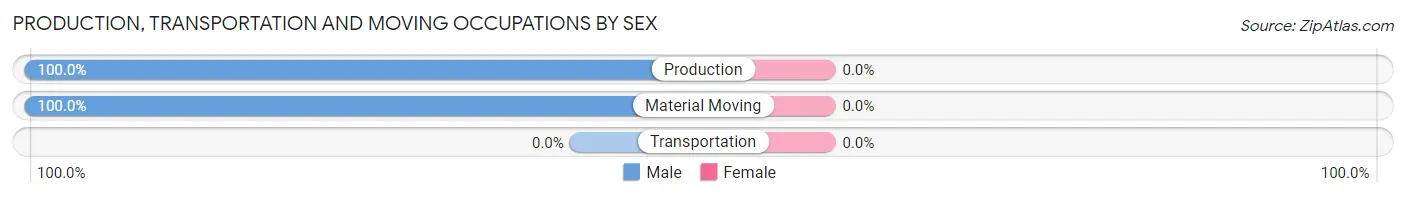
| Occupation | Male | Female |
| Production | 9 (100.0%) | 0 (0.0%) |
| Transportation | 0 (0.0%) | 0 (0.0%) |
| Material Moving | 13 (100.0%) | 0 (0.0%) |
| Total (Category) | 22 (100.0%) | 0 (0.0%) |
| Total (Overall) | 578 (52.4%) | 524 (47.5%) |
Employment Industries by Sex in Ross
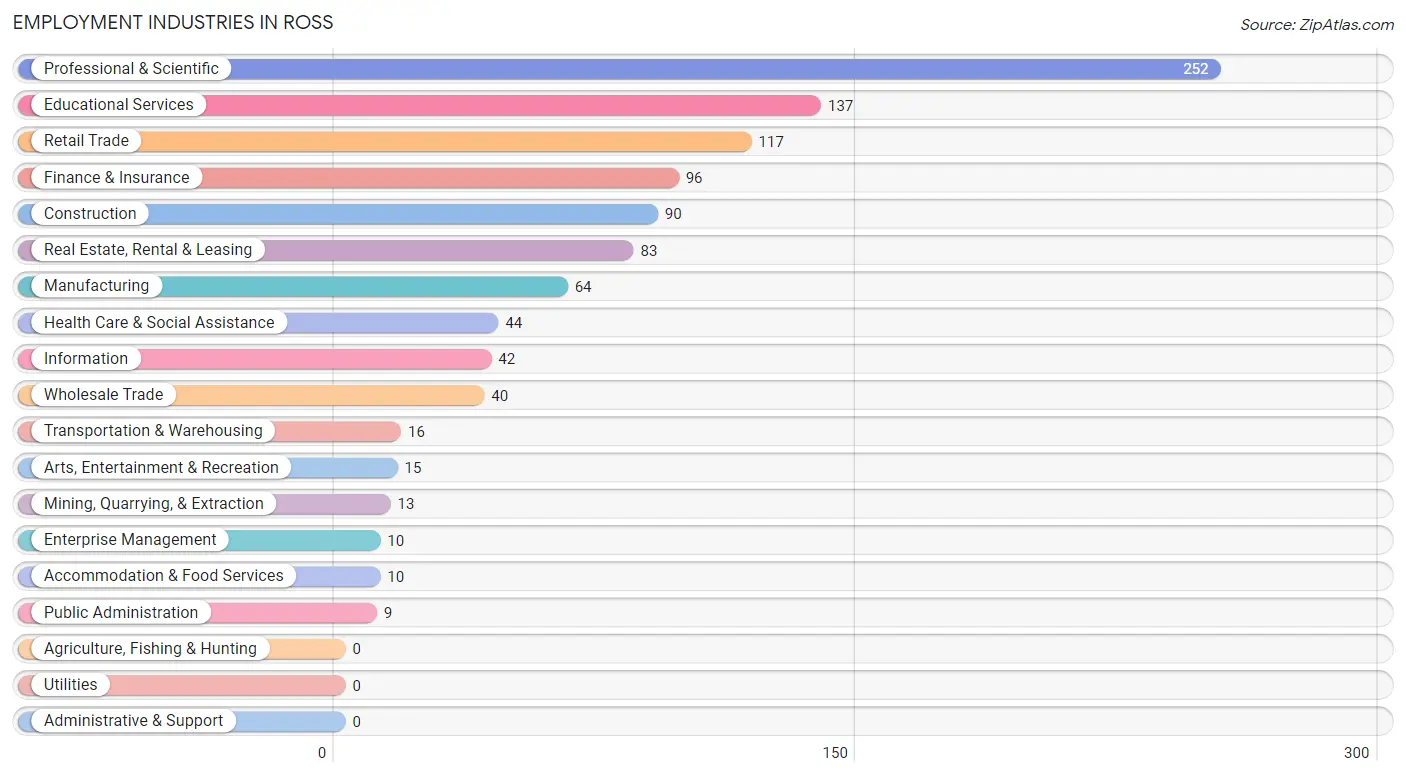
Employment Industries in Ross
The major employment industries in Ross include Professional & Scientific (252 | 22.9%), Educational Services (137 | 12.4%), Retail Trade (117 | 10.6%), Finance & Insurance (96 | 8.7%), and Construction (90 | 8.2%).
Employment Industries by Sex in Ross
The Ross industries that see more men than women are Arts, Entertainment & Recreation (100.0%), Public Administration (100.0%), and Information (90.5%), whereas the industries that tend to have a higher number of women are Mining, Quarrying, & Extraction (100.0%), Transportation & Warehousing (100.0%), and Enterprise Management (100.0%).
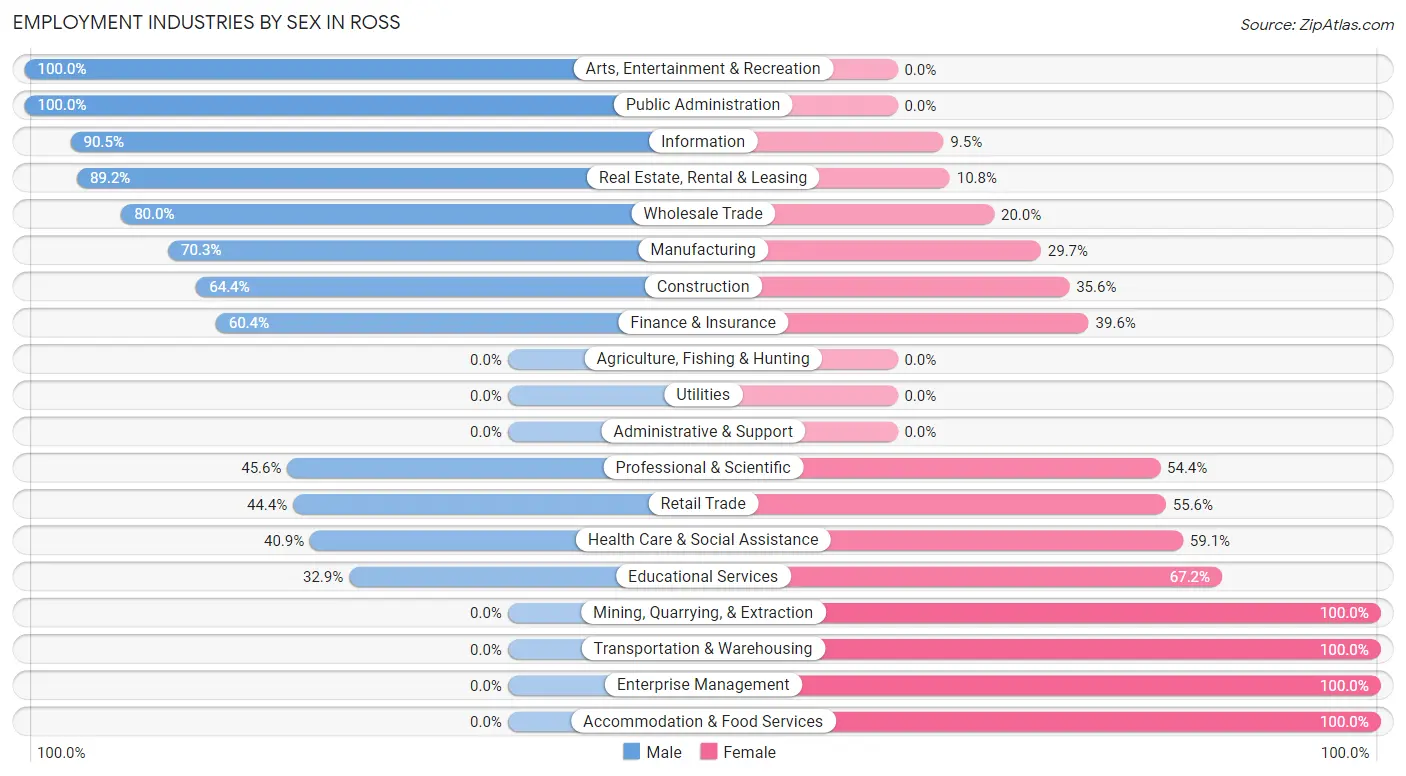
| Industry | Male | Female |
| Agriculture, Fishing & Hunting | 0 (0.0%) | 0 (0.0%) |
| Mining, Quarrying, & Extraction | 0 (0.0%) | 13 (100.0%) |
| Construction | 58 (64.4%) | 32 (35.6%) |
| Manufacturing | 45 (70.3%) | 19 (29.7%) |
| Wholesale Trade | 32 (80.0%) | 8 (20.0%) |
| Retail Trade | 52 (44.4%) | 65 (55.6%) |
| Transportation & Warehousing | 0 (0.0%) | 16 (100.0%) |
| Utilities | 0 (0.0%) | 0 (0.0%) |
| Information | 38 (90.5%) | 4 (9.5%) |
| Finance & Insurance | 58 (60.4%) | 38 (39.6%) |
| Real Estate, Rental & Leasing | 74 (89.2%) | 9 (10.8%) |
| Professional & Scientific | 115 (45.6%) | 137 (54.4%) |
| Enterprise Management | 0 (0.0%) | 10 (100.0%) |
| Administrative & Support | 0 (0.0%) | 0 (0.0%) |
| Educational Services | 45 (32.9%) | 92 (67.1%) |
| Health Care & Social Assistance | 18 (40.9%) | 26 (59.1%) |
| Arts, Entertainment & Recreation | 15 (100.0%) | 0 (0.0%) |
| Accommodation & Food Services | 0 (0.0%) | 10 (100.0%) |
| Public Administration | 9 (100.0%) | 0 (0.0%) |
| Total | 578 (52.4%) | 524 (47.5%) |
Education in Ross
School Enrollment in Ross
The most common levels of schooling among the 734 students in Ross are elementary school (239 | 32.6%), high school (197 | 26.8%), and middle school (149 | 20.3%).
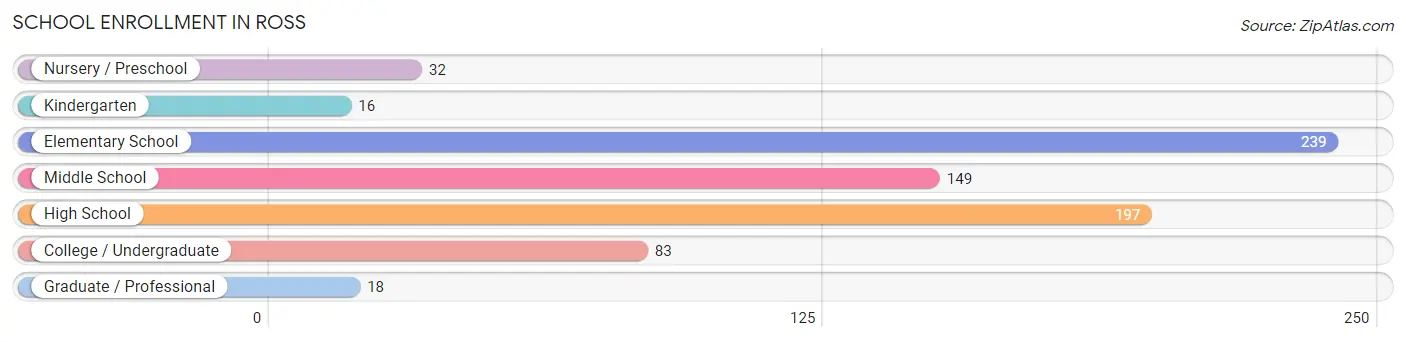
| School Level | # Students | % Students |
| Nursery / Preschool | 32 | 4.4% |
| Kindergarten | 16 | 2.2% |
| Elementary School | 239 | 32.6% |
| Middle School | 149 | 20.3% |
| High School | 197 | 26.8% |
| College / Undergraduate | 83 | 11.3% |
| Graduate / Professional | 18 | 2.5% |
| Total | 734 | 100.0% |
School Enrollment by Age by Funding Source in Ross
Out of a total of 734 students who are enrolled in schools in Ross, 255 (34.7%) attend a private institution, while the remaining 479 (65.3%) are enrolled in public schools. The age group of 3 to 4 year olds has the highest likelihood of being enrolled in private schools, with 26 (86.7% in the age bracket) enrolled. Conversely, the age group of 20 to 24 year olds has the lowest likelihood of being enrolled in a private school, with 41 (100.0% in the age bracket) attending a public institution.
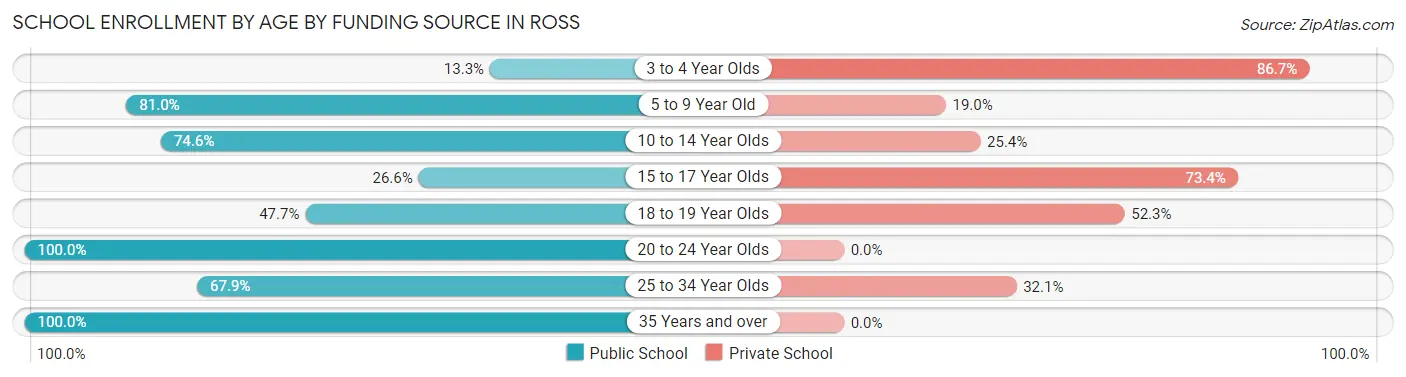
| Age Bracket | Public School | Private School |
| 3 to 4 Year Olds | 4 (13.3%) | 26 (86.7%) |
| 5 to 9 Year Old | 205 (81.0%) | 48 (19.0%) |
| 10 to 14 Year Olds | 138 (74.6%) | 47 (25.4%) |
| 15 to 17 Year Olds | 37 (26.6%) | 102 (73.4%) |
| 18 to 19 Year Olds | 21 (47.7%) | 23 (52.3%) |
| 20 to 24 Year Olds | 41 (100.0%) | 0 (0.0%) |
| 25 to 34 Year Olds | 19 (67.9%) | 9 (32.1%) |
| 35 Years and over | 14 (100.0%) | 0 (0.0%) |
| Total | 479 (65.3%) | 255 (34.7%) |
Educational Attainment by Field of Study in Ross
Social sciences (386 | 26.5%), business (175 | 12.0%), literature & languages (154 | 10.6%), communications (126 | 8.6%), and liberal arts & history (112 | 7.7%) are the most common fields of study among 1,458 individuals in Ross who have obtained a bachelor's degree or higher.
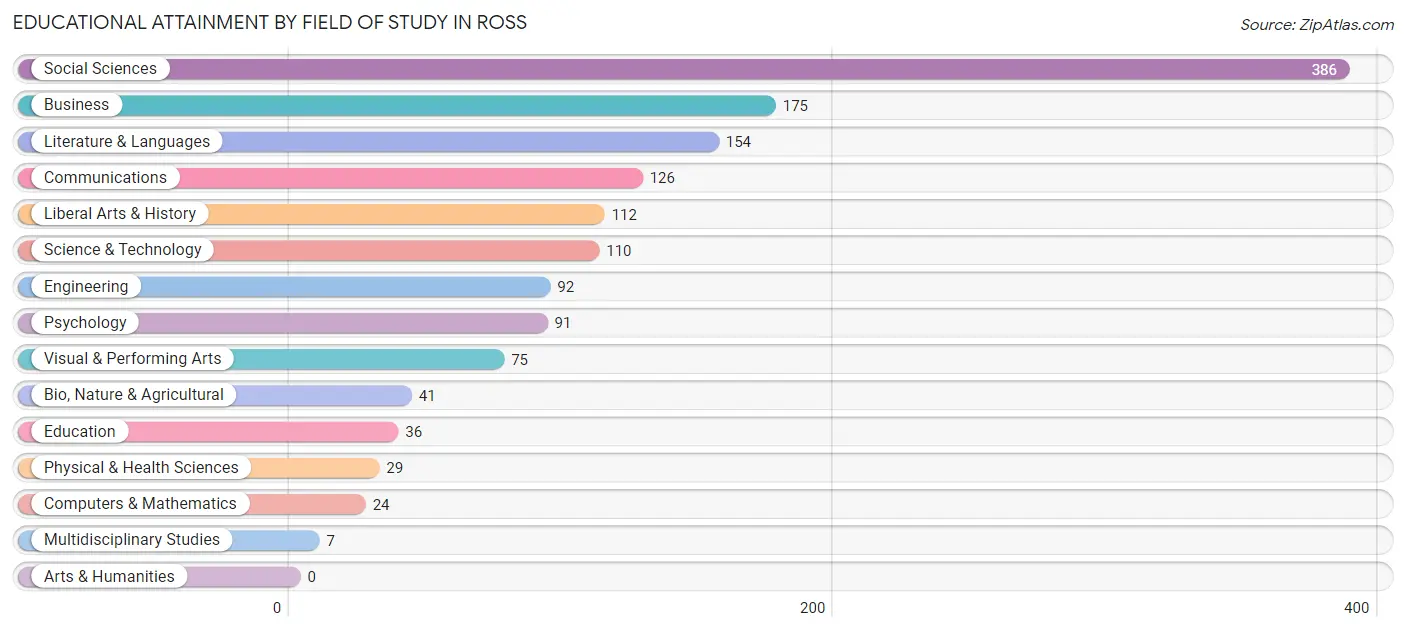
| Field of Study | # Graduates | % Graduates |
| Computers & Mathematics | 24 | 1.7% |
| Bio, Nature & Agricultural | 41 | 2.8% |
| Physical & Health Sciences | 29 | 2.0% |
| Psychology | 91 | 6.2% |
| Social Sciences | 386 | 26.5% |
| Engineering | 92 | 6.3% |
| Multidisciplinary Studies | 7 | 0.5% |
| Science & Technology | 110 | 7.5% |
| Business | 175 | 12.0% |
| Education | 36 | 2.5% |
| Literature & Languages | 154 | 10.6% |
| Liberal Arts & History | 112 | 7.7% |
| Visual & Performing Arts | 75 | 5.1% |
| Communications | 126 | 8.6% |
| Arts & Humanities | 0 | 0.0% |
| Total | 1,458 | 100.0% |
Transportation & Commute in Ross
Vehicle Availability by Sex in Ross
The most prevalent vehicle ownership categories in Ross are males with 2 vehicles (192, accounting for 34.9%) and females with 2 vehicles (262, making up 36.6%).
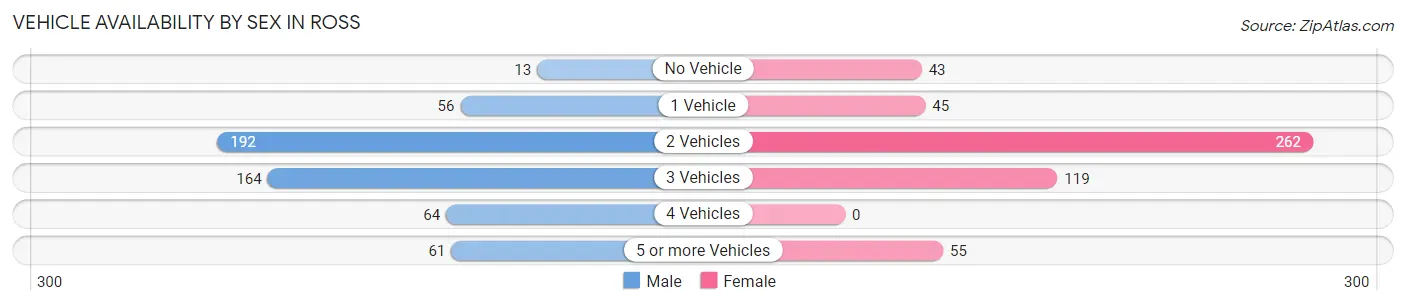
| Vehicles Available | Male | Female |
| No Vehicle | 13 (2.4%) | 43 (8.2%) |
| 1 Vehicle | 56 (10.2%) | 45 (8.6%) |
| 2 Vehicles | 192 (34.9%) | 262 (50.0%) |
| 3 Vehicles | 164 (29.8%) | 119 (22.7%) |
| 4 Vehicles | 64 (11.6%) | 0 (0.0%) |
| 5 or more Vehicles | 61 (11.1%) | 55 (10.5%) |
| Total | 550 (100.0%) | 524 (100.0%) |
Commute Time in Ross
The most frequently occuring commute durations in Ross are 30 to 34 minutes (138 commuters, 17.9%), less than 5 minutes (106 commuters, 13.7%), and 5 to 9 minutes (101 commuters, 13.1%).
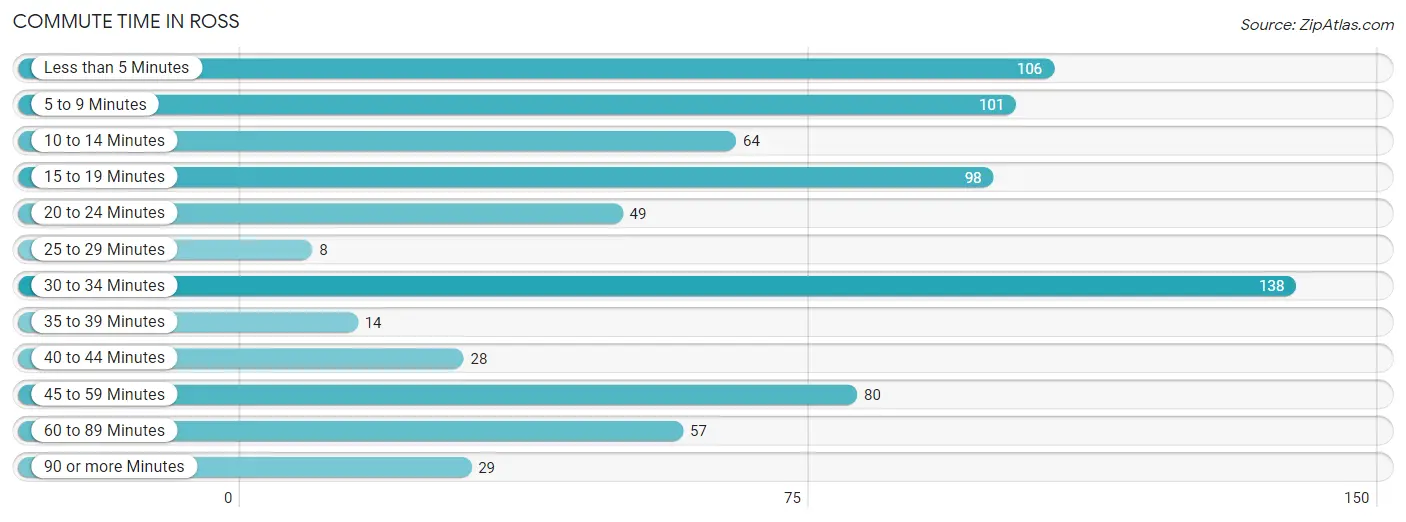
| Commute Time | # Commuters | % Commuters |
| Less than 5 Minutes | 106 | 13.7% |
| 5 to 9 Minutes | 101 | 13.1% |
| 10 to 14 Minutes | 64 | 8.3% |
| 15 to 19 Minutes | 98 | 12.7% |
| 20 to 24 Minutes | 49 | 6.4% |
| 25 to 29 Minutes | 8 | 1.0% |
| 30 to 34 Minutes | 138 | 17.9% |
| 35 to 39 Minutes | 14 | 1.8% |
| 40 to 44 Minutes | 28 | 3.6% |
| 45 to 59 Minutes | 80 | 10.4% |
| 60 to 89 Minutes | 57 | 7.4% |
| 90 or more Minutes | 29 | 3.8% |
Commute Time by Sex in Ross
The most common commute times in Ross are 30 to 34 minutes (90 commuters, 21.2%) for males and less than 5 minutes (69 commuters, 19.9%) for females.
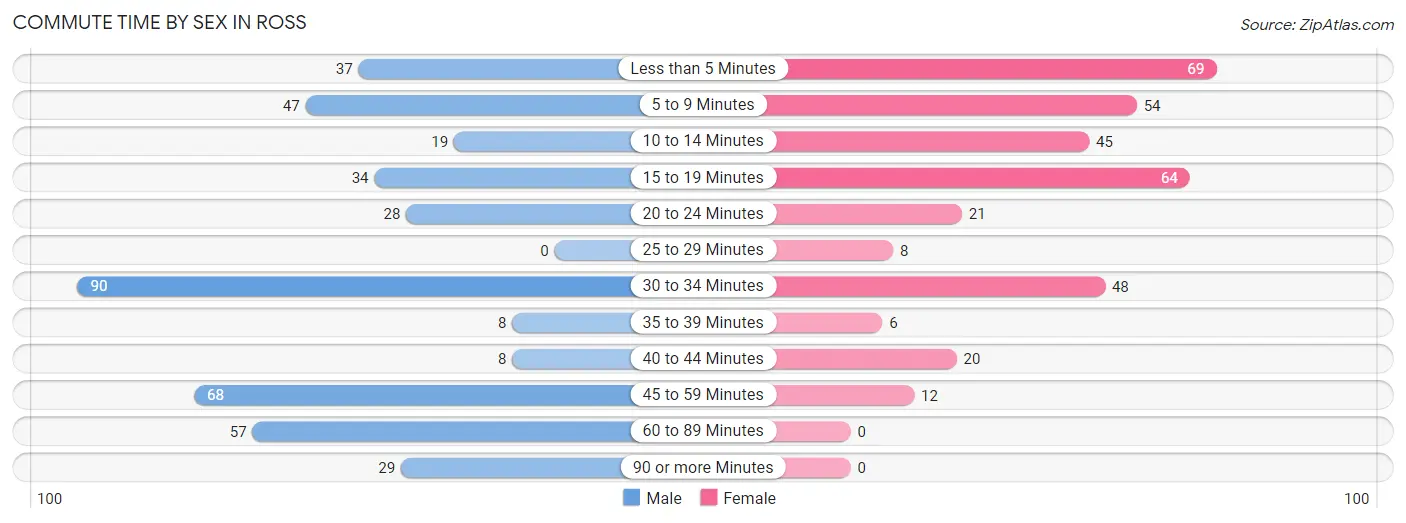
| Commute Time | Male | Female |
| Less than 5 Minutes | 37 (8.7%) | 69 (19.9%) |
| 5 to 9 Minutes | 47 (11.1%) | 54 (15.6%) |
| 10 to 14 Minutes | 19 (4.5%) | 45 (13.0%) |
| 15 to 19 Minutes | 34 (8.0%) | 64 (18.4%) |
| 20 to 24 Minutes | 28 (6.6%) | 21 (6.0%) |
| 25 to 29 Minutes | 0 (0.0%) | 8 (2.3%) |
| 30 to 34 Minutes | 90 (21.2%) | 48 (13.8%) |
| 35 to 39 Minutes | 8 (1.9%) | 6 (1.7%) |
| 40 to 44 Minutes | 8 (1.9%) | 20 (5.8%) |
| 45 to 59 Minutes | 68 (16.0%) | 12 (3.5%) |
| 60 to 89 Minutes | 57 (13.4%) | 0 (0.0%) |
| 90 or more Minutes | 29 (6.8%) | 0 (0.0%) |
Time of Departure to Work by Sex in Ross
The most frequent times of departure to work in Ross are 7:30 AM to 7:59 AM (121, 28.5%) for males and 9:00 AM to 9:59 AM (93, 26.8%) for females.
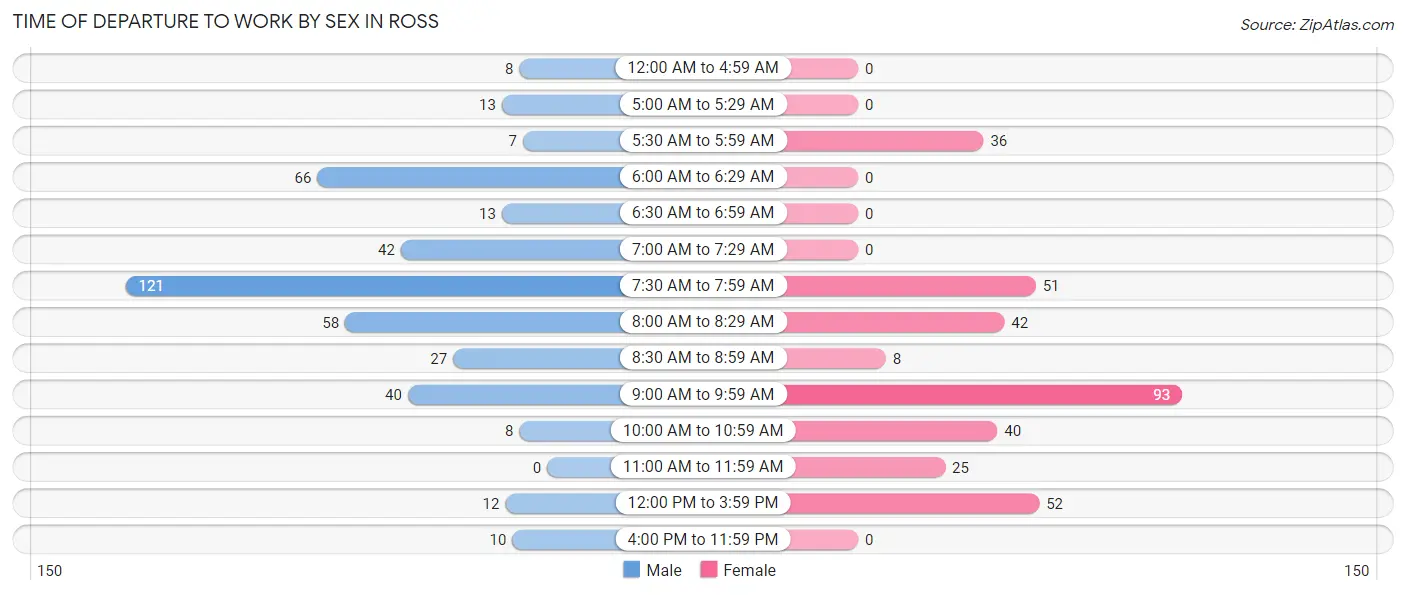
| Time of Departure | Male | Female |
| 12:00 AM to 4:59 AM | 8 (1.9%) | 0 (0.0%) |
| 5:00 AM to 5:29 AM | 13 (3.1%) | 0 (0.0%) |
| 5:30 AM to 5:59 AM | 7 (1.7%) | 36 (10.4%) |
| 6:00 AM to 6:29 AM | 66 (15.5%) | 0 (0.0%) |
| 6:30 AM to 6:59 AM | 13 (3.1%) | 0 (0.0%) |
| 7:00 AM to 7:29 AM | 42 (9.9%) | 0 (0.0%) |
| 7:30 AM to 7:59 AM | 121 (28.5%) | 51 (14.7%) |
| 8:00 AM to 8:29 AM | 58 (13.7%) | 42 (12.1%) |
| 8:30 AM to 8:59 AM | 27 (6.4%) | 8 (2.3%) |
| 9:00 AM to 9:59 AM | 40 (9.4%) | 93 (26.8%) |
| 10:00 AM to 10:59 AM | 8 (1.9%) | 40 (11.5%) |
| 11:00 AM to 11:59 AM | 0 (0.0%) | 25 (7.2%) |
| 12:00 PM to 3:59 PM | 12 (2.8%) | 52 (15.0%) |
| 4:00 PM to 11:59 PM | 10 (2.4%) | 0 (0.0%) |
| Total | 425 (100.0%) | 347 (100.0%) |
Housing Occupancy in Ross
Occupancy by Ownership in Ross
Of the total 884 dwellings in Ross, owner-occupied units account for 726 (82.1%), while renter-occupied units make up 158 (17.9%).
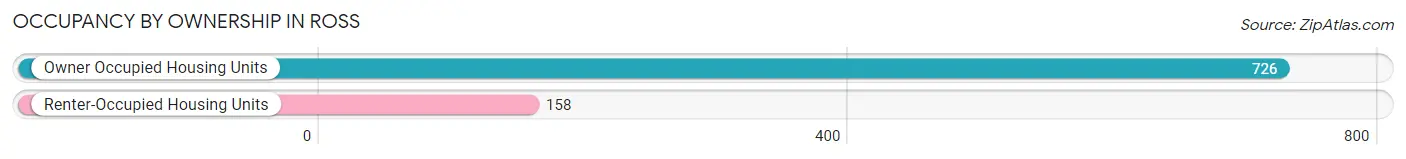
| Occupancy | # Housing Units | % Housing Units |
| Owner Occupied Housing Units | 726 | 82.1% |
| Renter-Occupied Housing Units | 158 | 17.9% |
| Total Occupied Housing Units | 884 | 100.0% |
Occupancy by Household Size in Ross
| Household Size | # Housing Units | % Housing Units |
| 1-Person Household | 180 | 20.4% |
| 2-Person Household | 242 | 27.4% |
| 3-Person Household | 193 | 21.8% |
| 4+ Person Household | 269 | 30.4% |
| Total Housing Units | 884 | 100.0% |
Occupancy by Ownership by Household Size in Ross
| Household Size | Owner-occupied | Renter-occupied |
| 1-Person Household | 130 (72.2%) | 50 (27.8%) |
| 2-Person Household | 238 (98.4%) | 4 (1.7%) |
| 3-Person Household | 161 (83.4%) | 32 (16.6%) |
| 4+ Person Household | 197 (73.2%) | 72 (26.8%) |
| Total Housing Units | 726 (82.1%) | 158 (17.9%) |
Occupancy by Educational Attainment in Ross
| Household Size | Owner-occupied | Renter-occupied |
| Less than High School | 0 (0.0%) | 0 (0.0%) |
| High School Diploma | 0 (0.0%) | 0 (0.0%) |
| College/Associate Degree | 91 (92.9%) | 7 (7.1%) |
| Bachelor's Degree or higher | 635 (80.8%) | 151 (19.2%) |
Occupancy by Age of Householder in Ross
| Age Bracket | # Households | % Households |
| Under 35 Years | 0 | 0.0% |
| 35 to 44 Years | 129 | 14.6% |
| 45 to 54 Years | 277 | 31.3% |
| 55 to 64 Years | 142 | 16.1% |
| 65 to 74 Years | 178 | 20.1% |
| 75 to 84 Years | 137 | 15.5% |
| 85 Years and Over | 21 | 2.4% |
| Total | 884 | 100.0% |
Housing Finances in Ross
Median Income by Occupancy in Ross
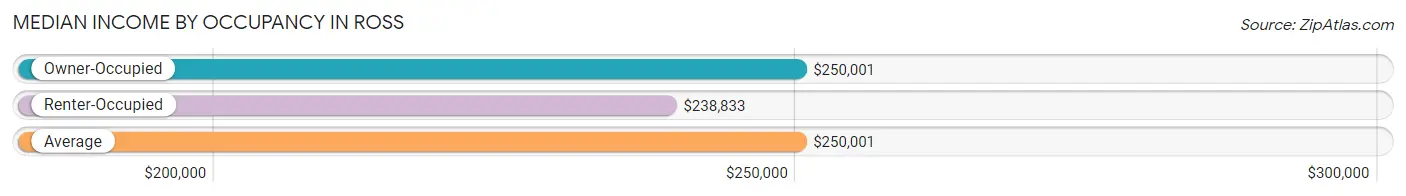
| Occupancy Type | # Households | Median Income |
| Owner-Occupied | 726 (82.1%) | $250,001 |
| Renter-Occupied | 158 (17.9%) | $238,833 |
| Average | 884 (100.0%) | $250,001 |
Occupancy by Householder Income Bracket in Ross
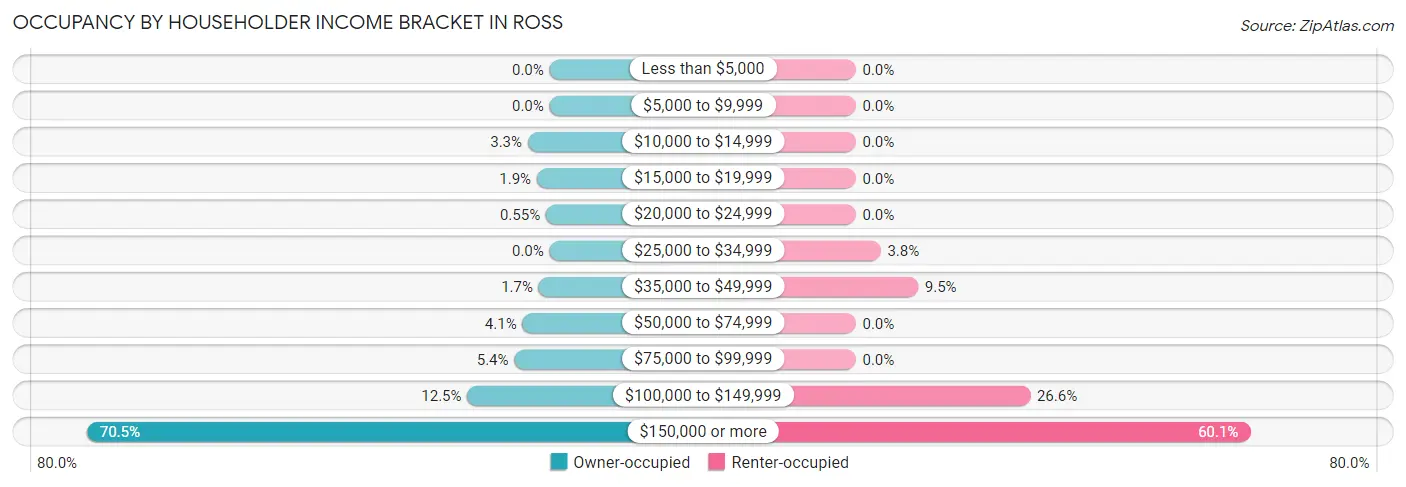
| Income Bracket | Owner-occupied | Renter-occupied |
| Less than $5,000 | 0 (0.0%) | 0 (0.0%) |
| $5,000 to $9,999 | 0 (0.0%) | 0 (0.0%) |
| $10,000 to $14,999 | 24 (3.3%) | 0 (0.0%) |
| $15,000 to $19,999 | 14 (1.9%) | 0 (0.0%) |
| $20,000 to $24,999 | 4 (0.5%) | 0 (0.0%) |
| $25,000 to $34,999 | 0 (0.0%) | 6 (3.8%) |
| $35,000 to $49,999 | 12 (1.7%) | 15 (9.5%) |
| $50,000 to $74,999 | 30 (4.1%) | 0 (0.0%) |
| $75,000 to $99,999 | 39 (5.4%) | 0 (0.0%) |
| $100,000 to $149,999 | 91 (12.5%) | 42 (26.6%) |
| $150,000 or more | 512 (70.5%) | 95 (60.1%) |
| Total | 726 (100.0%) | 158 (100.0%) |
Monthly Housing Cost Tiers in Ross
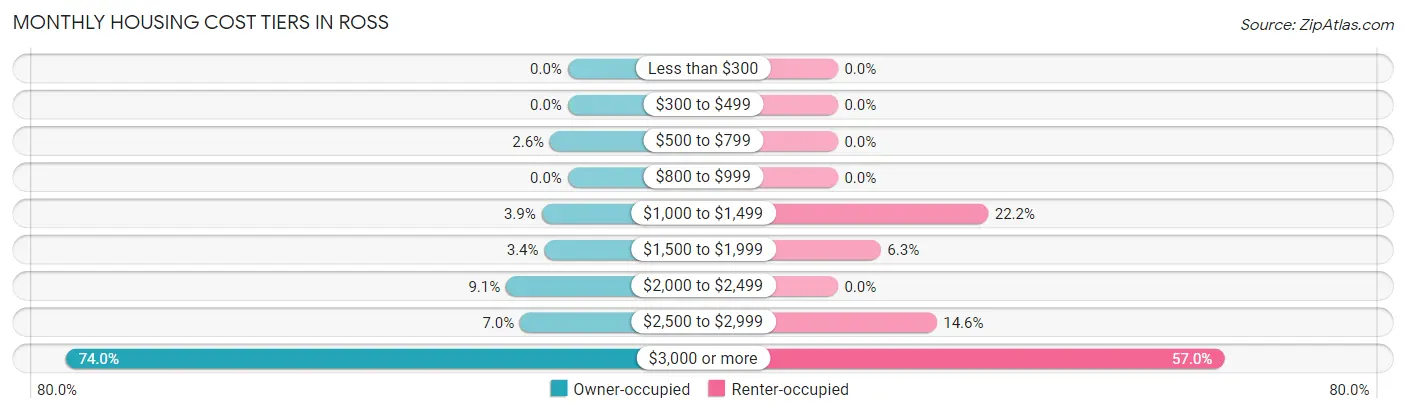
| Monthly Cost | Owner-occupied | Renter-occupied |
| Less than $300 | 0 (0.0%) | 0 (0.0%) |
| $300 to $499 | 0 (0.0%) | 0 (0.0%) |
| $500 to $799 | 19 (2.6%) | 0 (0.0%) |
| $800 to $999 | 0 (0.0%) | 0 (0.0%) |
| $1,000 to $1,499 | 28 (3.9%) | 35 (22.2%) |
| $1,500 to $1,999 | 25 (3.4%) | 10 (6.3%) |
| $2,000 to $2,499 | 66 (9.1%) | 0 (0.0%) |
| $2,500 to $2,999 | 51 (7.0%) | 23 (14.6%) |
| $3,000 or more | 537 (74.0%) | 90 (57.0%) |
| Total | 726 (100.0%) | 158 (100.0%) |
Physical Housing Characteristics in Ross
Housing Structures in Ross
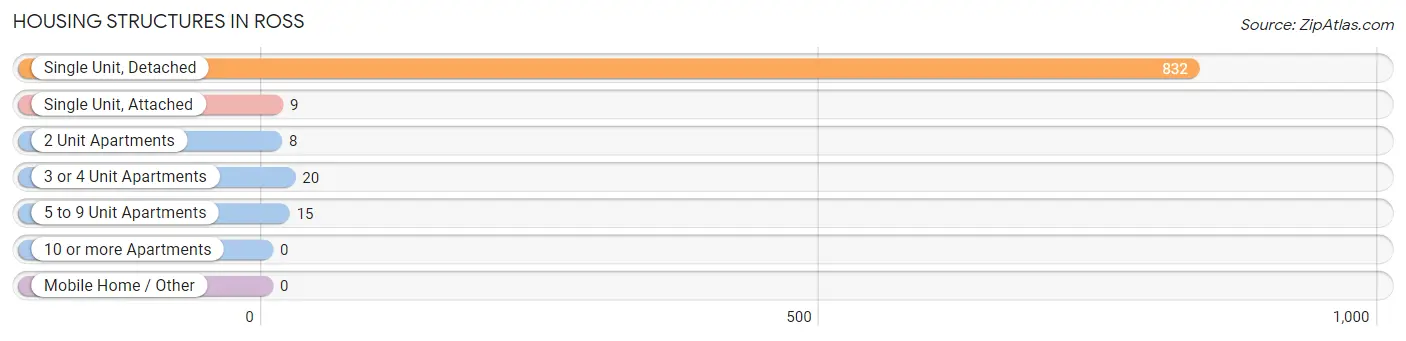
| Structure Type | # Housing Units | % Housing Units |
| Single Unit, Detached | 832 | 94.1% |
| Single Unit, Attached | 9 | 1.0% |
| 2 Unit Apartments | 8 | 0.9% |
| 3 or 4 Unit Apartments | 20 | 2.3% |
| 5 to 9 Unit Apartments | 15 | 1.7% |
| 10 or more Apartments | 0 | 0.0% |
| Mobile Home / Other | 0 | 0.0% |
| Total | 884 | 100.0% |
Housing Structures by Occupancy in Ross
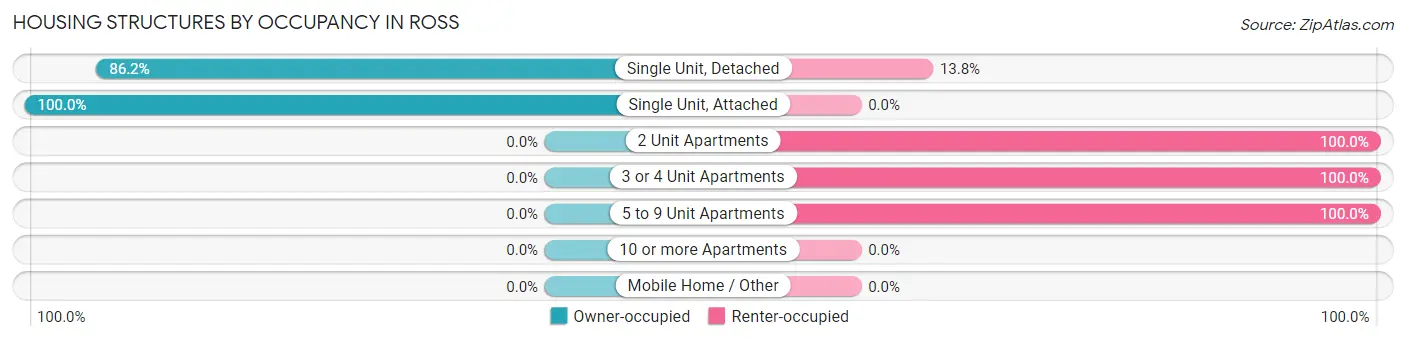
| Structure Type | Owner-occupied | Renter-occupied |
| Single Unit, Detached | 717 (86.2%) | 115 (13.8%) |
| Single Unit, Attached | 9 (100.0%) | 0 (0.0%) |
| 2 Unit Apartments | 0 (0.0%) | 8 (100.0%) |
| 3 or 4 Unit Apartments | 0 (0.0%) | 20 (100.0%) |
| 5 to 9 Unit Apartments | 0 (0.0%) | 15 (100.0%) |
| 10 or more Apartments | 0 (0.0%) | 0 (0.0%) |
| Mobile Home / Other | 0 (0.0%) | 0 (0.0%) |
| Total | 726 (82.1%) | 158 (17.9%) |
Housing Structures by Number of Rooms in Ross
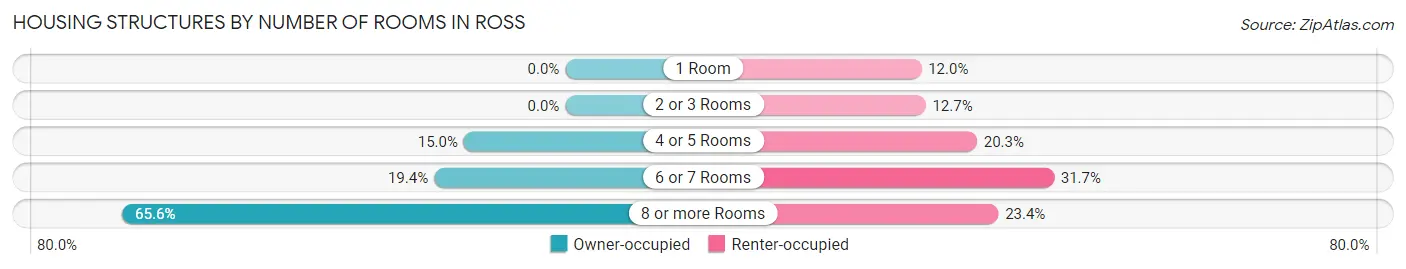
| Number of Rooms | Owner-occupied | Renter-occupied |
| 1 Room | 0 (0.0%) | 19 (12.0%) |
| 2 or 3 Rooms | 0 (0.0%) | 20 (12.7%) |
| 4 or 5 Rooms | 109 (15.0%) | 32 (20.3%) |
| 6 or 7 Rooms | 141 (19.4%) | 50 (31.7%) |
| 8 or more Rooms | 476 (65.6%) | 37 (23.4%) |
| Total | 726 (100.0%) | 158 (100.0%) |
Housing Structure by Heating Type in Ross
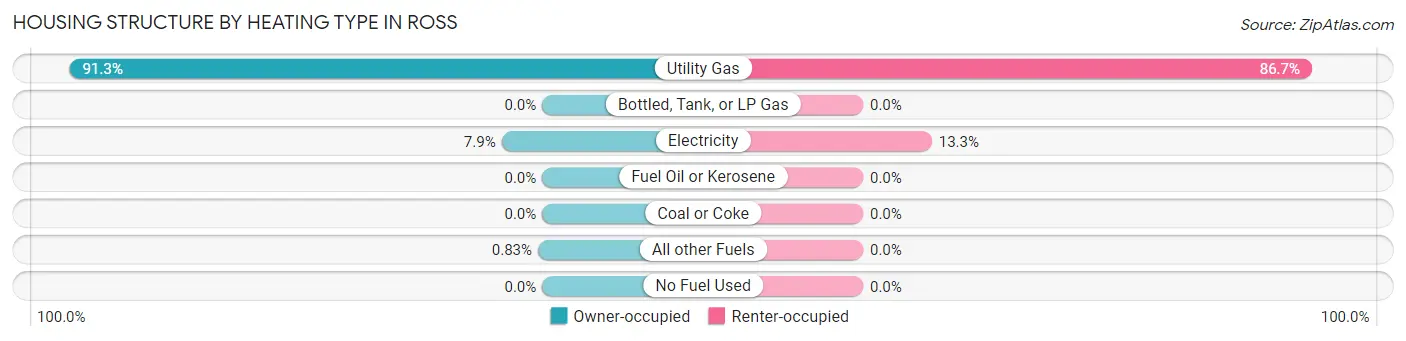
| Heating Type | Owner-occupied | Renter-occupied |
| Utility Gas | 663 (91.3%) | 137 (86.7%) |
| Bottled, Tank, or LP Gas | 0 (0.0%) | 0 (0.0%) |
| Electricity | 57 (7.9%) | 21 (13.3%) |
| Fuel Oil or Kerosene | 0 (0.0%) | 0 (0.0%) |
| Coal or Coke | 0 (0.0%) | 0 (0.0%) |
| All other Fuels | 6 (0.8%) | 0 (0.0%) |
| No Fuel Used | 0 (0.0%) | 0 (0.0%) |
| Total | 726 (100.0%) | 158 (100.0%) |
Household Vehicle Usage in Ross
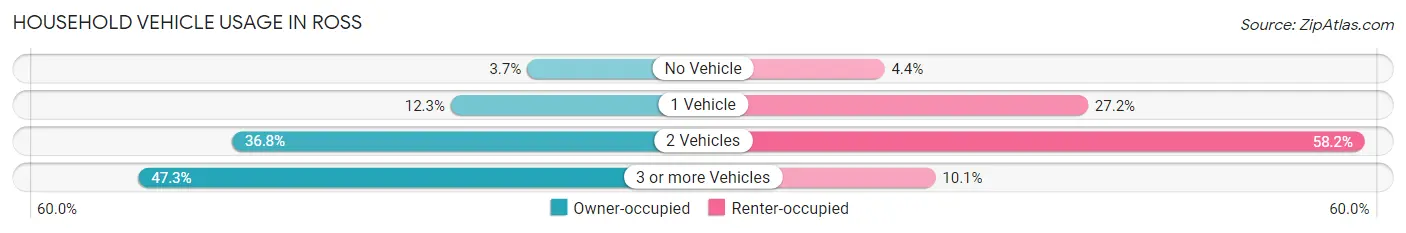
| Vehicles per Household | Owner-occupied | Renter-occupied |
| No Vehicle | 27 (3.7%) | 7 (4.4%) |
| 1 Vehicle | 89 (12.3%) | 43 (27.2%) |
| 2 Vehicles | 267 (36.8%) | 92 (58.2%) |
| 3 or more Vehicles | 343 (47.2%) | 16 (10.1%) |
| Total | 726 (100.0%) | 158 (100.0%) |
Real Estate & Mortgages in Ross
Real Estate and Mortgage Overview in Ross
| Characteristic | Without Mortgage | With Mortgage |
| Housing Units | 265 | 461 |
| Median Property Value | $2,000,001 | $2,000,001 |
| Median Household Income | $201,250 | $358 |
| Monthly Housing Costs | $1,501 | $418 |
| Real Estate Taxes | $10,001 | $0 |
Property Value by Mortgage Status in Ross
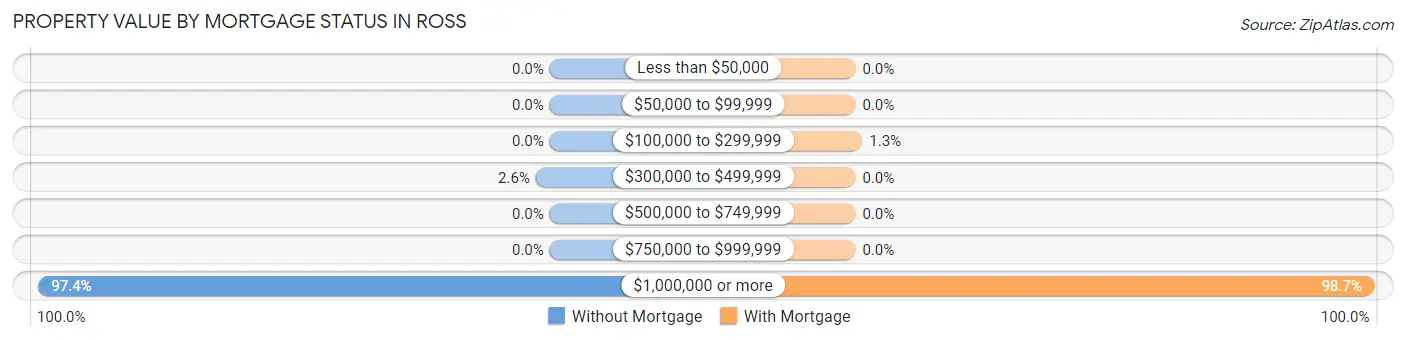
| Property Value | Without Mortgage | With Mortgage |
| Less than $50,000 | 0 (0.0%) | 0 (0.0%) |
| $50,000 to $99,999 | 0 (0.0%) | 0 (0.0%) |
| $100,000 to $299,999 | 0 (0.0%) | 6 (1.3%) |
| $300,000 to $499,999 | 7 (2.6%) | 0 (0.0%) |
| $500,000 to $749,999 | 0 (0.0%) | 0 (0.0%) |
| $750,000 to $999,999 | 0 (0.0%) | 0 (0.0%) |
| $1,000,000 or more | 258 (97.4%) | 455 (98.7%) |
| Total | 265 (100.0%) | 461 (100.0%) |
Household Income by Mortgage Status in Ross
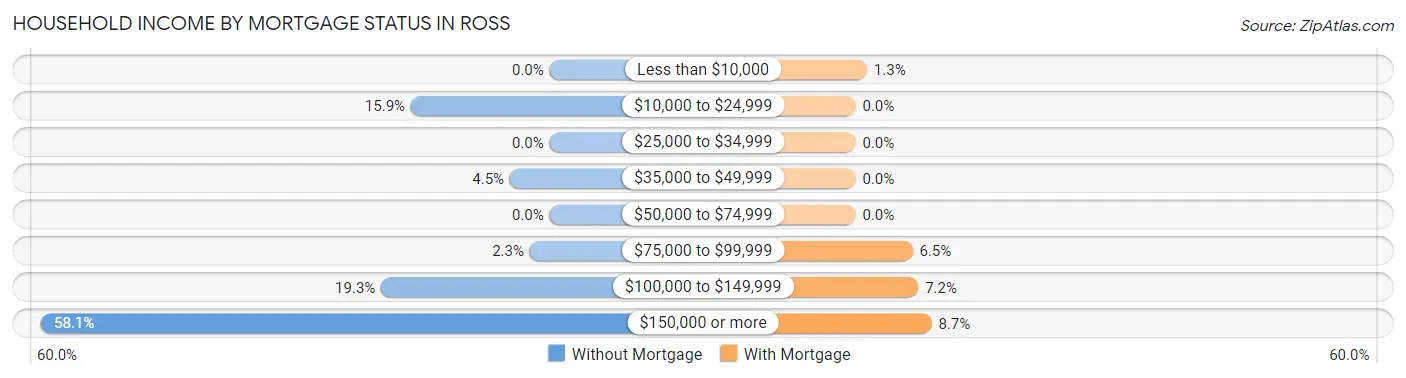
| Household Income | Without Mortgage | With Mortgage |
| Less than $10,000 | 0 (0.0%) | 6 (1.3%) |
| $10,000 to $24,999 | 42 (15.9%) | 0 (0.0%) |
| $25,000 to $34,999 | 0 (0.0%) | 0 (0.0%) |
| $35,000 to $49,999 | 12 (4.5%) | 0 (0.0%) |
| $50,000 to $74,999 | 0 (0.0%) | 0 (0.0%) |
| $75,000 to $99,999 | 6 (2.3%) | 30 (6.5%) |
| $100,000 to $149,999 | 51 (19.3%) | 33 (7.2%) |
| $150,000 or more | 154 (58.1%) | 40 (8.7%) |
| Total | 265 (100.0%) | 461 (100.0%) |
Property Value to Household Income Ratio in Ross
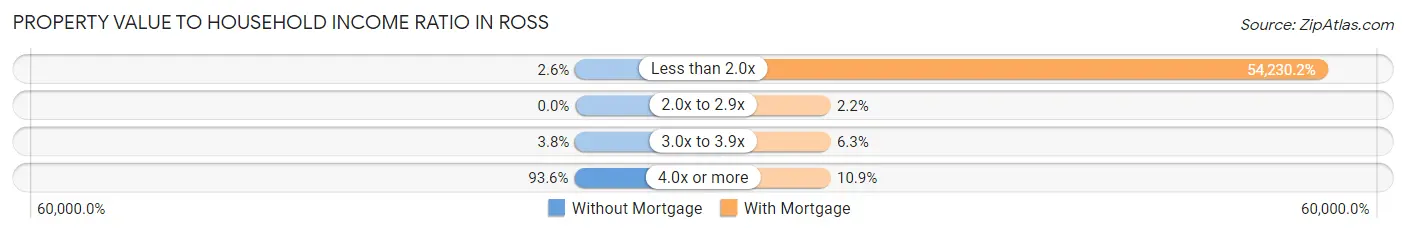
| Value-to-Income Ratio | Without Mortgage | With Mortgage |
| Less than 2.0x | 7 (2.6%) | 250,001 (54,230.2%) |
| 2.0x to 2.9x | 0 (0.0%) | 10 (2.2%) |
| 3.0x to 3.9x | 10 (3.8%) | 29 (6.3%) |
| 4.0x or more | 248 (93.6%) | 50 (10.8%) |
| Total | 265 (100.0%) | 461 (100.0%) |
Real Estate Taxes by Mortgage Status in Ross
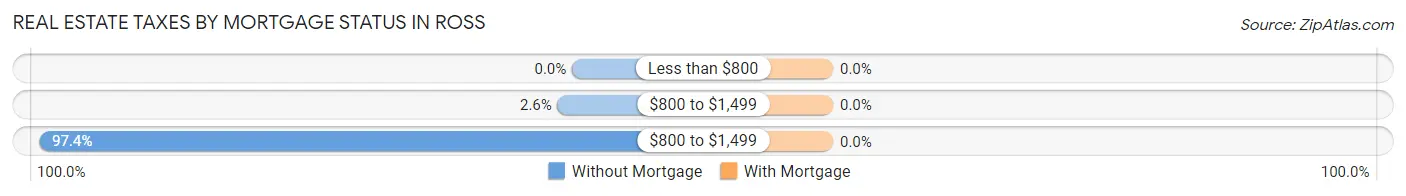
| Property Taxes | Without Mortgage | With Mortgage |
| Less than $800 | 0 (0.0%) | 0 (0.0%) |
| $800 to $1,499 | 7 (2.6%) | 0 (0.0%) |
| $800 to $1,499 | 258 (97.4%) | 0 (0.0%) |
| Total | 265 (100.0%) | 461 (100.0%) |
Health & Disability in Ross
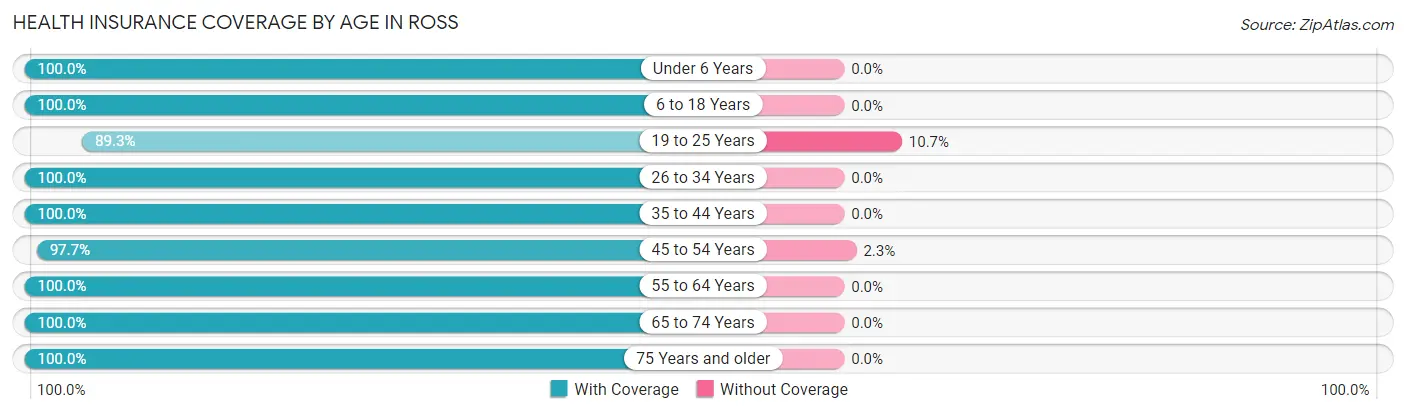
Health Insurance Coverage by Age in Ross
| Age Bracket | With Coverage | Without Coverage |
| Under 6 Years | 138 (100.0%) | 0 (0.0%) |
| 6 to 18 Years | 612 (100.0%) | 0 (0.0%) |
| 19 to 25 Years | 108 (89.3%) | 13 (10.7%) |
| 26 to 34 Years | 46 (100.0%) | 0 (0.0%) |
| 35 to 44 Years | 320 (100.0%) | 0 (0.0%) |
| 45 to 54 Years | 474 (97.7%) | 11 (2.3%) |
| 55 to 64 Years | 293 (100.0%) | 0 (0.0%) |
| 65 to 74 Years | 278 (100.0%) | 0 (0.0%) |
| 75 Years and older | 244 (100.0%) | 0 (0.0%) |
| Total | 2,513 (99.1%) | 24 (0.9%) |
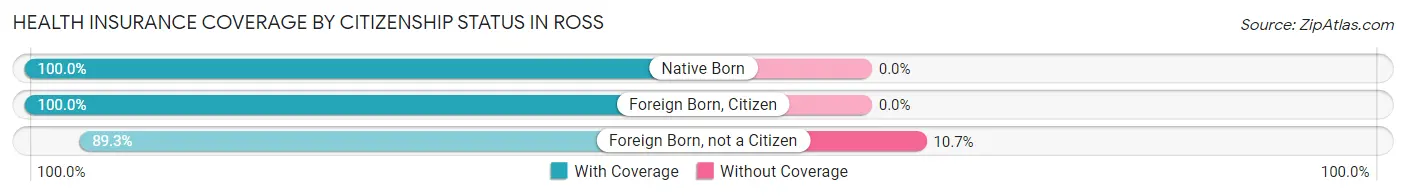
Health Insurance Coverage by Citizenship Status in Ross
| Citizenship Status | With Coverage | Without Coverage |
| Native Born | 138 (100.0%) | 0 (0.0%) |
| Foreign Born, Citizen | 612 (100.0%) | 0 (0.0%) |
| Foreign Born, not a Citizen | 108 (89.3%) | 13 (10.7%) |
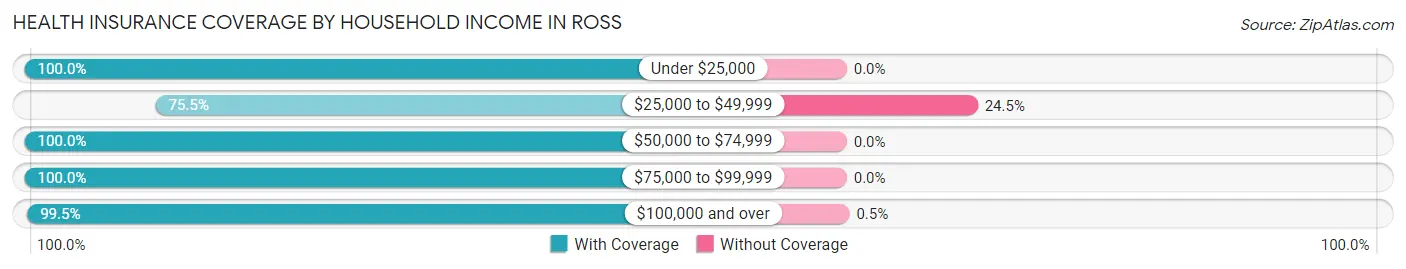
Health Insurance Coverage by Household Income in Ross
| Household Income | With Coverage | Without Coverage |
| Under $25,000 | 42 (100.0%) | 0 (0.0%) |
| $25,000 to $49,999 | 40 (75.5%) | 13 (24.5%) |
| $50,000 to $74,999 | 84 (100.0%) | 0 (0.0%) |
| $75,000 to $99,999 | 68 (100.0%) | 0 (0.0%) |
| $100,000 and over | 2,190 (99.5%) | 11 (0.5%) |
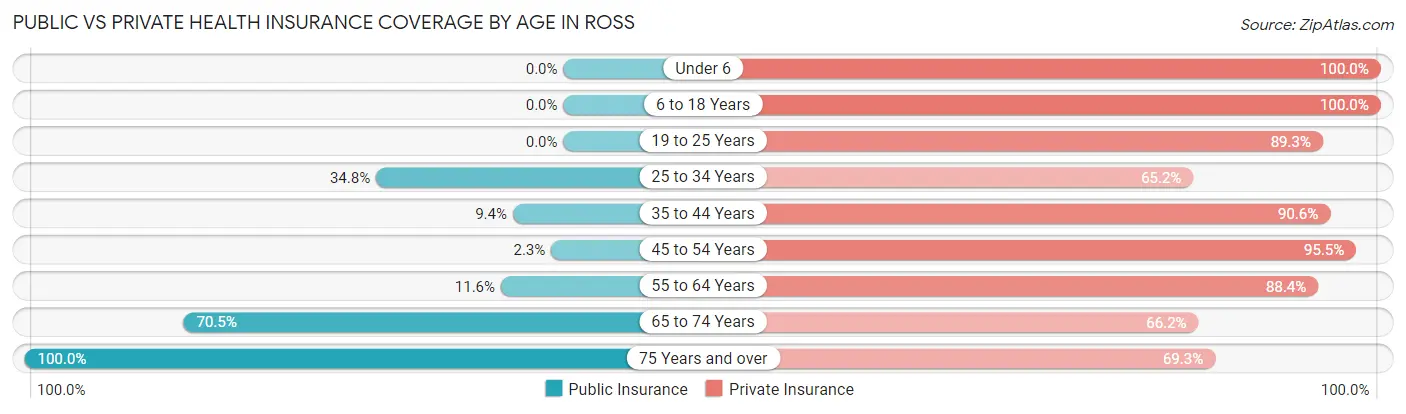
Public vs Private Health Insurance Coverage by Age in Ross
| Age Bracket | Public Insurance | Private Insurance |
| Under 6 | 0 (0.0%) | 138 (100.0%) |
| 6 to 18 Years | 0 (0.0%) | 612 (100.0%) |
| 19 to 25 Years | 0 (0.0%) | 108 (89.3%) |
| 25 to 34 Years | 16 (34.8%) | 30 (65.2%) |
| 35 to 44 Years | 30 (9.4%) | 290 (90.6%) |
| 45 to 54 Years | 11 (2.3%) | 463 (95.5%) |
| 55 to 64 Years | 34 (11.6%) | 259 (88.4%) |
| 65 to 74 Years | 196 (70.5%) | 184 (66.2%) |
| 75 Years and over | 244 (100.0%) | 169 (69.3%) |
| Total | 531 (20.9%) | 2,253 (88.8%) |
Disability Status by Sex by Age in Ross
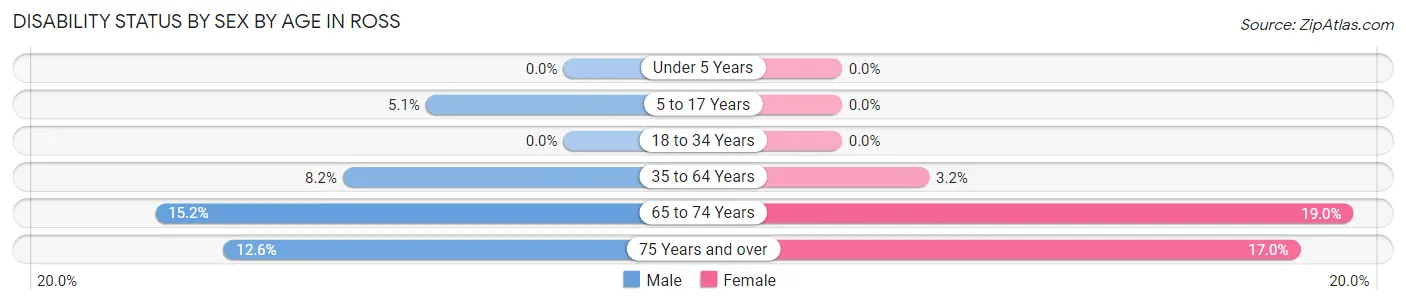
| Age Bracket | Male | Female |
| Under 5 Years | 0 (0.0%) | 0 (0.0%) |
| 5 to 17 Years | 17 (5.1%) | 0 (0.0%) |
| 18 to 34 Years | 0 (0.0%) | 0 (0.0%) |
| 35 to 64 Years | 47 (8.2%) | 17 (3.2%) |
| 65 to 74 Years | 15 (15.1%) | 34 (19.0%) |
| 75 Years and over | 13 (12.6%) | 24 (17.0%) |
Disability Class by Sex by Age in Ross
Disability Class: Hearing Difficulty
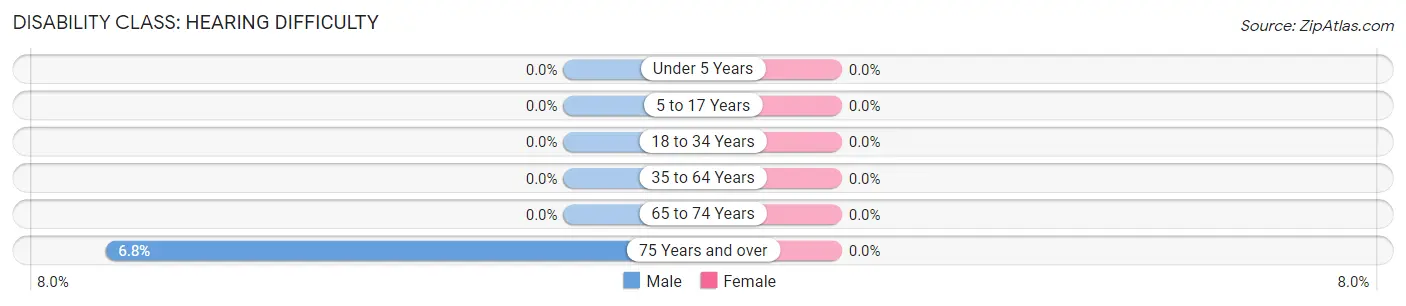
| Age Bracket | Male | Female |
| Under 5 Years | 0 (0.0%) | 0 (0.0%) |
| 5 to 17 Years | 0 (0.0%) | 0 (0.0%) |
| 18 to 34 Years | 0 (0.0%) | 0 (0.0%) |
| 35 to 64 Years | 0 (0.0%) | 0 (0.0%) |
| 65 to 74 Years | 0 (0.0%) | 0 (0.0%) |
| 75 Years and over | 7 (6.8%) | 0 (0.0%) |
Disability Class: Vision Difficulty
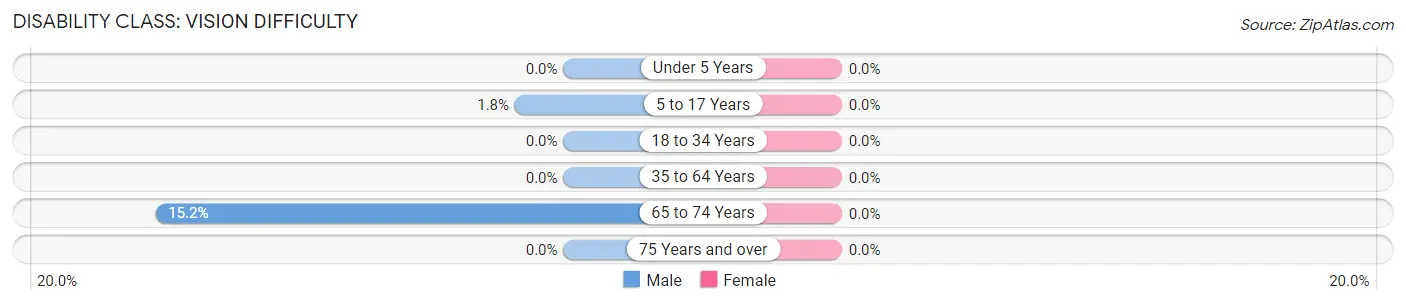
| Age Bracket | Male | Female |
| Under 5 Years | 0 (0.0%) | 0 (0.0%) |
| 5 to 17 Years | 6 (1.8%) | 0 (0.0%) |
| 18 to 34 Years | 0 (0.0%) | 0 (0.0%) |
| 35 to 64 Years | 0 (0.0%) | 0 (0.0%) |
| 65 to 74 Years | 15 (15.1%) | 0 (0.0%) |
| 75 Years and over | 0 (0.0%) | 0 (0.0%) |
Disability Class: Cognitive Difficulty
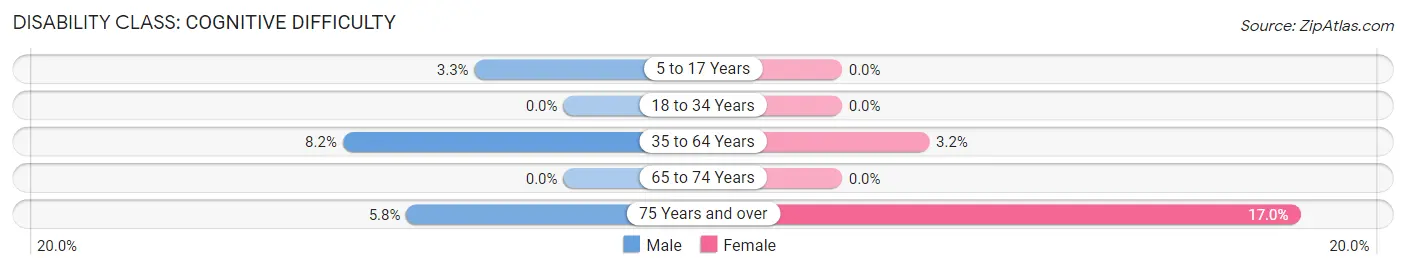
| Age Bracket | Male | Female |
| 5 to 17 Years | 11 (3.3%) | 0 (0.0%) |
| 18 to 34 Years | 0 (0.0%) | 0 (0.0%) |
| 35 to 64 Years | 47 (8.2%) | 17 (3.2%) |
| 65 to 74 Years | 0 (0.0%) | 0 (0.0%) |
| 75 Years and over | 6 (5.8%) | 24 (17.0%) |
Disability Class: Ambulatory Difficulty
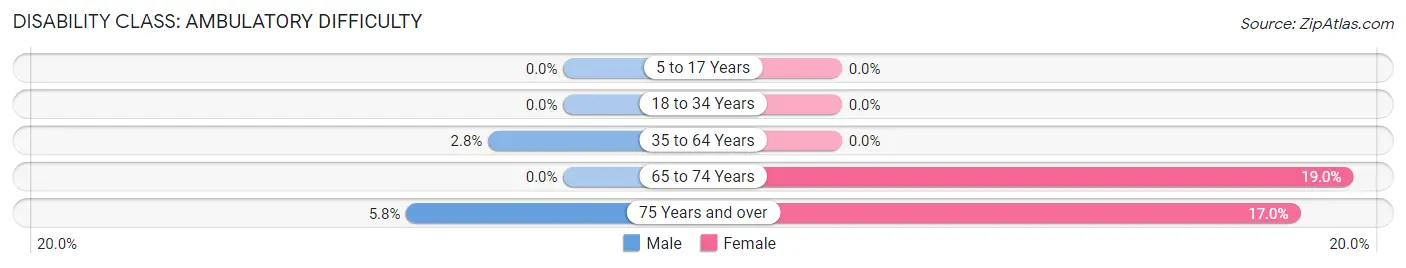
| Age Bracket | Male | Female |
| 5 to 17 Years | 0 (0.0%) | 0 (0.0%) |
| 18 to 34 Years | 0 (0.0%) | 0 (0.0%) |
| 35 to 64 Years | 16 (2.8%) | 0 (0.0%) |
| 65 to 74 Years | 0 (0.0%) | 34 (19.0%) |
| 75 Years and over | 6 (5.8%) | 24 (17.0%) |
Disability Class: Self-Care Difficulty
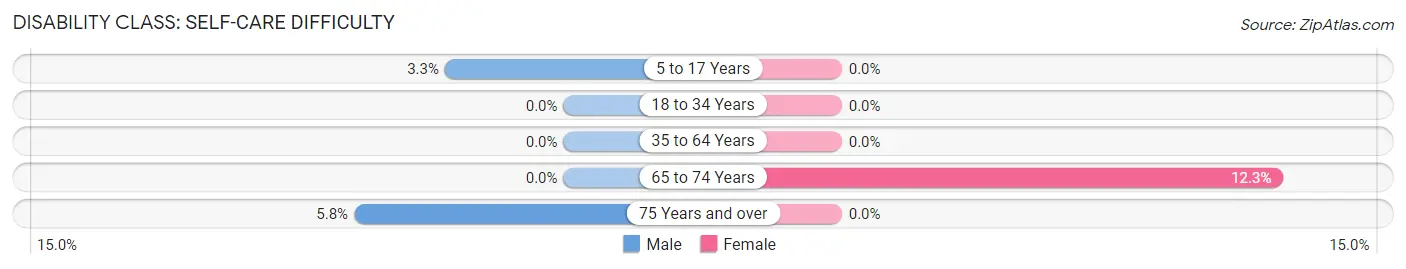
| Age Bracket | Male | Female |
| 5 to 17 Years | 11 (3.3%) | 0 (0.0%) |
| 18 to 34 Years | 0 (0.0%) | 0 (0.0%) |
| 35 to 64 Years | 0 (0.0%) | 0 (0.0%) |
| 65 to 74 Years | 0 (0.0%) | 22 (12.3%) |
| 75 Years and over | 6 (5.8%) | 0 (0.0%) |
Technology Access in Ross
Computing Device Access in Ross
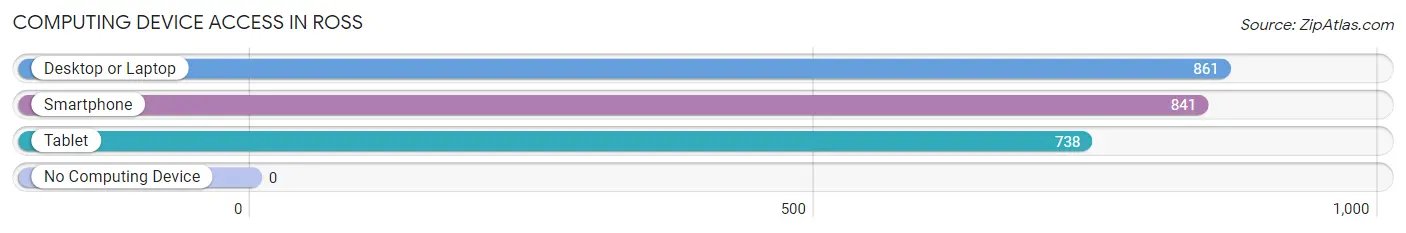
| Device Type | # Households | % Households |
| Desktop or Laptop | 861 | 97.4% |
| Smartphone | 841 | 95.1% |
| Tablet | 738 | 83.5% |
| No Computing Device | 0 | 0.0% |
| Total | 884 | 100.0% |
Internet Access in Ross
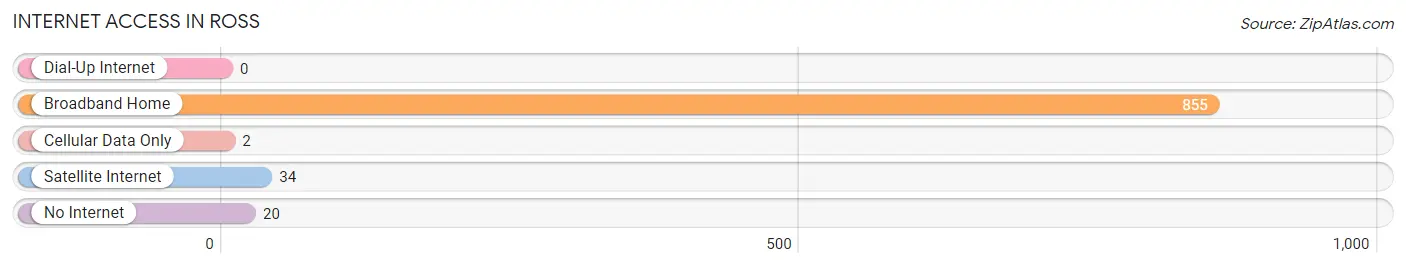
| Internet Type | # Households | % Households |
| Dial-Up Internet | 0 | 0.0% |
| Broadband Home | 855 | 96.7% |
| Cellular Data Only | 2 | 0.2% |
| Satellite Internet | 34 | 3.8% |
| No Internet | 20 | 2.3% |
| Total | 884 | 100.0% |
Ross Summary
Ross is a small town located in Marin County, California, United States. It is situated in the San Francisco Bay Area, just north of San Francisco. The town has a population of approximately 2,500 people and is known for its affluent and wealthy residents.
History
The area that is now Ross was originally inhabited by the Coast Miwok Native American tribe. The first Europeans to settle in the area were the Spanish, who established a mission in nearby San Rafael in 1817. The area was then part of the Rancho Punta de Quentin Mexican land grant, which was granted to John Reed in 1834. In 1857, James Ross purchased the land and established a sheep ranch. The town of Ross was officially founded in 1875 and was named after James Ross.
Geography
Ross is located in Marin County, California, in the San Francisco Bay Area. It is situated on the western side of the county, just north of San Francisco. The town covers an area of approximately 1.5 square miles and has a population of approximately 2,500 people. The town is located at an elevation of approximately 200 feet above sea level.
The climate in Ross is mild and temperate, with warm summers and cool winters. The average annual temperature is approximately 60 degrees Fahrenheit. The average annual precipitation is approximately 20 inches.
Economy
The economy of Ross is largely based on the service industry. The town is home to a number of restaurants, retail stores, and other businesses. The town is also home to a number of wealthy residents, who contribute to the local economy through their investments and spending.
Demographics
As of the 2010 census, the population of Ross was 2,415. The racial makeup of the town was 87.3% White, 1.2% African American, 0.2% Native American, 8.2% Asian, 0.1% Pacific Islander, 0.7% from other races, and 2.5% from two or more races. The median household income was $150,000, and the median family income was $170,000.
Conclusion
Ross is a small town located in Marin County, California, United States. It is situated in the San Francisco Bay Area, just north of San Francisco. The town has a population of approximately 2,500 people and is known for its affluent and wealthy residents. The economy of Ross is largely based on the service industry, and the town is home to a number of wealthy residents. The racial makeup of the town is predominantly White, with a small percentage of African American, Native American, Asian, and Pacific Islander residents.
Common Questions
What is Per Capita Income in Ross?
Per Capita income in Ross is $148,521.
What is the Median Family Income in Ross?
Median Family Income in Ross is $250,001.
What is the Median Household income in Ross?
Median Household Income in Ross is $250,001.
What is Income or Wage Gap in Ross?
Income or Wage Gap in Ross is 77.7%.
Women in Ross earn 22.3 cents for every dollar earned by a man.
What is Inequality or Gini Index in Ross?
Inequality or Gini Index in Ross is 0.51.
What is the Total Population of Ross?
Total Population of Ross is 2,537.
What is the Total Male Population of Ross?
Total Male Population of Ross is 1,197.
What is the Total Female Population of Ross?
Total Female Population of Ross is 1,340.
What is the Ratio of Males per 100 Females in Ross?
There are 89.33 Males per 100 Females in Ross.
What is the Ratio of Females per 100 Males in Ross?
There are 111.95 Females per 100 Males in Ross.
What is the Median Population Age in Ross?
Median Population Age in Ross is 46.4 Years.
What is the Average Family Size in Ross
Average Family Size in Ross is 3.1 People.
What is the Average Household Size in Ross
Average Household Size in Ross is 2.8 People.
How Large is the Labor Force in Ross?
There are 1,137 People in the Labor Forcein in Ross.
What is the Percentage of People in the Labor Force in Ross?
57.7% of People are in the Labor Force in Ross.
What is the Unemployment Rate in Ross?
Unemployment Rate in Ross is 3.1%.