Hillsborough, CA Map & Demographics
Hillsborough Map
Hillsborough Overview
$168,494
PER CAPITA INCOME
$250,001
AVG FAMILY INCOME
$250,001
AVG HOUSEHOLD INCOME
66.0%
WAGE / INCOME GAP [ % ]
34.0¢/ $1
WAGE / INCOME GAP [ $ ]
0.49
INEQUALITY / GINI INDEX
11,258
TOTAL POPULATION
5,738
MALE POPULATION
5,520
FEMALE POPULATION
103.95
MALES / 100 FEMALES
96.20
FEMALES / 100 MALES
46.5
MEDIAN AGE
3.4
AVG FAMILY SIZE
3.2
AVG HOUSEHOLD SIZE
5,233
LABOR FORCE [ PEOPLE ]
61.2%
PERCENT IN LABOR FORCE
5.4%
UNEMPLOYMENT RATE
Hillsborough Area Codes
Income in Hillsborough
Income Overview in Hillsborough
Per Capita Income in Hillsborough is $168,494, while median incomes of families and households are $250,001 and $250,001 respectively.
| Characteristic | Number | Measure |
| Per Capita Income | 11,258 | $168,494 |
| Median Family Income | 3,086 | $250,001 |
| Mean Family Income | 3,086 | $564,493 |
| Median Household Income | 3,483 | $250,001 |
| Mean Household Income | 3,483 | $539,950 |
| Income Deficit | 3,086 | $0 |
| Wage / Income Gap (%) | 11,258 | 66.03% |
| Wage / Income Gap ($) | 11,258 | 33.97¢ per $1 |
| Gini / Inequality Index | 11,258 | 0.49 |
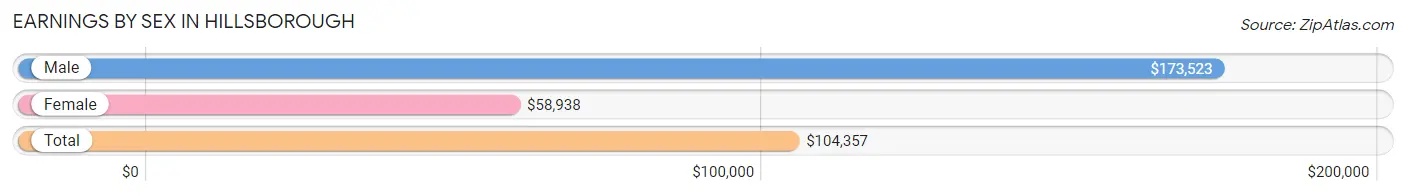
Earnings by Sex in Hillsborough
Average Earnings in Hillsborough are $104,357, $173,523 for men and $58,938 for women, a difference of 66.0%.
| Sex | Number | Average Earnings |
| Male | 3,085 (56.7%) | $173,523 |
| Female | 2,359 (43.3%) | $58,938 |
| Total | 5,444 (100.0%) | $104,357 |
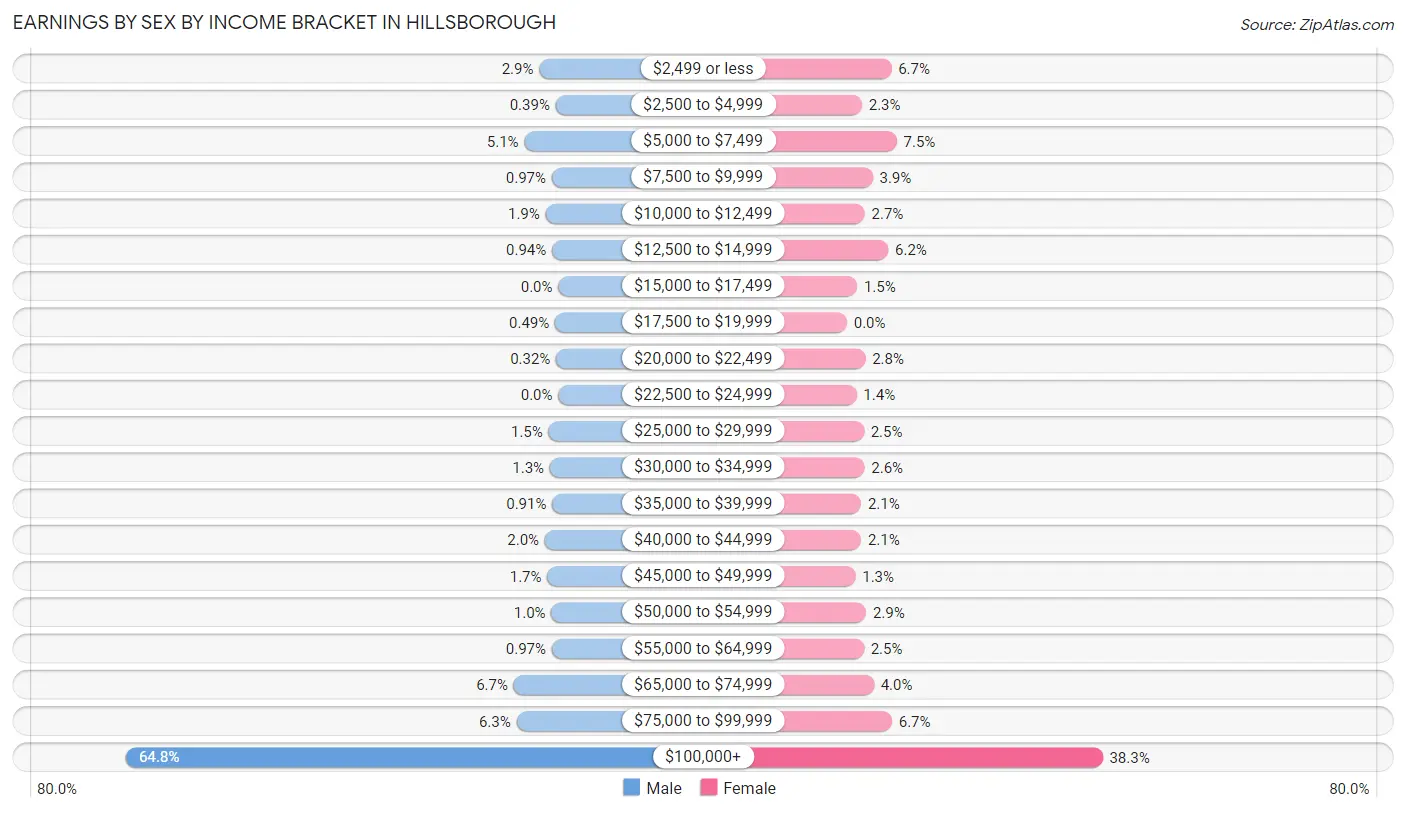
Earnings by Sex by Income Bracket in Hillsborough
The most common earnings brackets in Hillsborough are $100,000+ for men (1,999 | 64.8%) and $100,000+ for women (904 | 38.3%).
| Income | Male | Female |
| $2,499 or less | 88 (2.9%) | 157 (6.7%) |
| $2,500 to $4,999 | 12 (0.4%) | 53 (2.2%) |
| $5,000 to $7,499 | 157 (5.1%) | 176 (7.5%) |
| $7,500 to $9,999 | 30 (1.0%) | 91 (3.9%) |
| $10,000 to $12,499 | 59 (1.9%) | 63 (2.7%) |
| $12,500 to $14,999 | 29 (0.9%) | 146 (6.2%) |
| $15,000 to $17,499 | 0 (0.0%) | 36 (1.5%) |
| $17,500 to $19,999 | 15 (0.5%) | 0 (0.0%) |
| $20,000 to $22,499 | 10 (0.3%) | 65 (2.8%) |
| $22,500 to $24,999 | 0 (0.0%) | 34 (1.4%) |
| $25,000 to $29,999 | 45 (1.5%) | 60 (2.5%) |
| $30,000 to $34,999 | 39 (1.3%) | 62 (2.6%) |
| $35,000 to $39,999 | 28 (0.9%) | 50 (2.1%) |
| $40,000 to $44,999 | 62 (2.0%) | 50 (2.1%) |
| $45,000 to $49,999 | 51 (1.7%) | 30 (1.3%) |
| $50,000 to $54,999 | 32 (1.0%) | 68 (2.9%) |
| $55,000 to $64,999 | 30 (1.0%) | 60 (2.5%) |
| $65,000 to $74,999 | 206 (6.7%) | 95 (4.0%) |
| $75,000 to $99,999 | 193 (6.3%) | 159 (6.7%) |
| $100,000+ | 1,999 (64.8%) | 904 (38.3%) |
| Total | 3,085 (100.0%) | 2,359 (100.0%) |
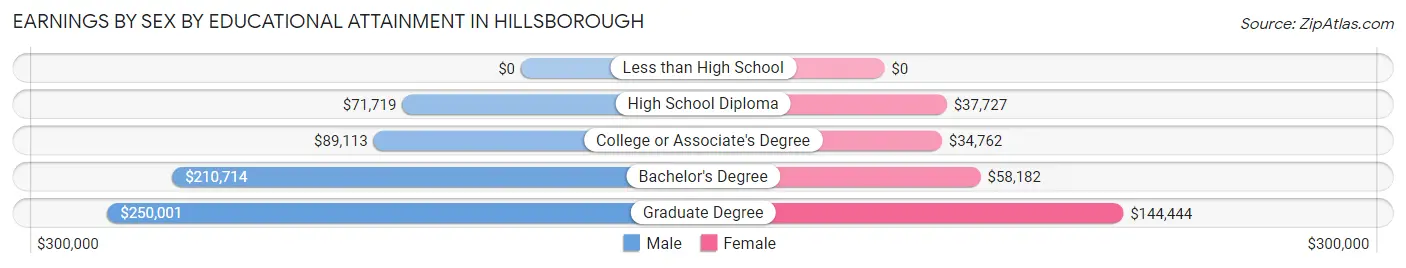
Earnings by Sex by Educational Attainment in Hillsborough
Average earnings in Hillsborough are $218,194 for men and $71,875 for women, a difference of 67.1%. Men with an educational attainment of graduate degree enjoy the highest average annual earnings of $250,001, while those with high school diploma education earn the least with $71,719. Women with an educational attainment of graduate degree earn the most with the average annual earnings of $144,444, while those with college or associate's degree education have the smallest earnings of $34,762.
| Educational Attainment | Male Income | Female Income |
| Less than High School | - | - |
| High School Diploma | $71,719 | $37,727 |
| College or Associate's Degree | $89,113 | $34,762 |
| Bachelor's Degree | $210,714 | $58,182 |
| Graduate Degree | $250,001 | $144,444 |
| Total | $218,194 | $71,875 |
Family Income in Hillsborough
Family Income Brackets in Hillsborough
According to the Hillsborough family income data, there are 2,216 families falling into the $200,000+ income range, which is the most common income bracket and makes up 71.8% of all families. Conversely, the $35,000 to $49,999 income bracket is the least frequent group with only 12 families (0.4%) belonging to this category.
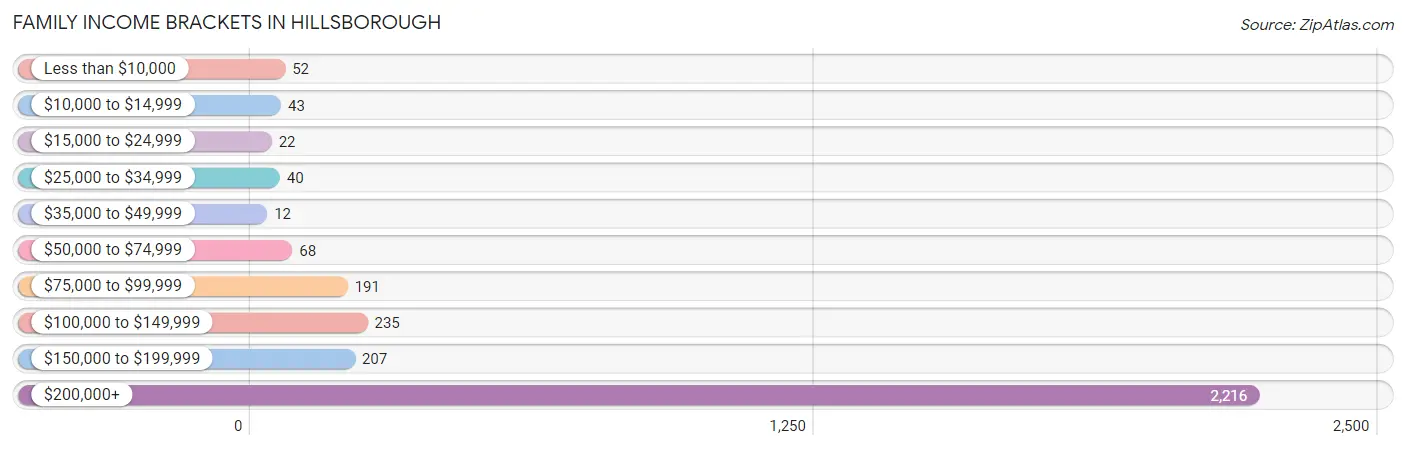
| Income Bracket | # Families | % Families |
| Less than $10,000 | 52 | 1.7% |
| $10,000 to $14,999 | 43 | 1.4% |
| $15,000 to $24,999 | 22 | 0.7% |
| $25,000 to $34,999 | 40 | 1.3% |
| $35,000 to $49,999 | 12 | 0.4% |
| $50,000 to $74,999 | 68 | 2.2% |
| $75,000 to $99,999 | 191 | 6.2% |
| $100,000 to $149,999 | 235 | 7.6% |
| $150,000 to $199,999 | 207 | 6.7% |
| $200,000+ | 2,216 | 71.8% |
Family Income by Famaliy Size in Hillsborough
2-person families (1,183 | 38.3%) account for the highest median family income in Hillsborough with $250,001 per family, while 2-person families (1,183 | 38.3%) have the highest median income of $125,000 per family member.
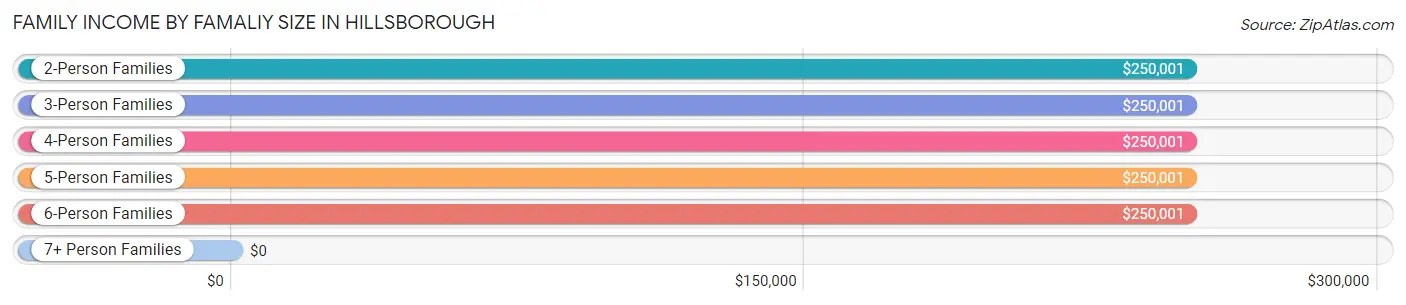
| Income Bracket | # Families | Median Income |
| 2-Person Families | 1,183 (38.3%) | $250,001 |
| 3-Person Families | 514 (16.7%) | $250,001 |
| 4-Person Families | 961 (31.1%) | $250,001 |
| 5-Person Families | 332 (10.8%) | $250,001 |
| 6-Person Families | 85 (2.8%) | $250,001 |
| 7+ Person Families | 11 (0.4%) | $0 |
| Total | 3,086 (100.0%) | $250,001 |
Family Income by Number of Earners in Hillsborough
The median family income in Hillsborough is $250,001, with families comprising 1 earner (881) having the highest median family income of $250,001, while families with no earners (513) have the lowest median family income of $151,369, accounting for 28.5% and 16.6% of families, respectively.
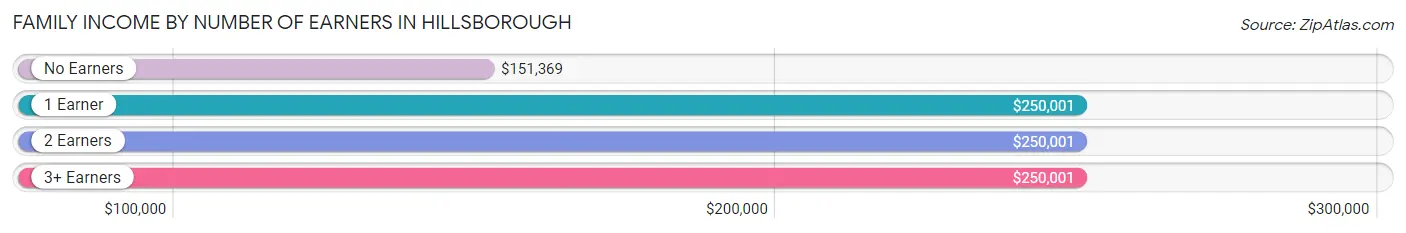
| Number of Earners | # Families | Median Income |
| No Earners | 513 (16.6%) | $151,369 |
| 1 Earner | 881 (28.5%) | $250,001 |
| 2 Earners | 1,298 (42.1%) | $250,001 |
| 3+ Earners | 394 (12.8%) | $250,001 |
| Total | 3,086 (100.0%) | $250,001 |
Household Income in Hillsborough
Household Income Brackets in Hillsborough
With 2,424 households falling in the category, the $200,000+ income range is the most frequent in Hillsborough, accounting for 69.6% of all households. In contrast, only 21 households (0.6%) fall into the $35,000 to $49,999 income bracket, making it the least populous group.
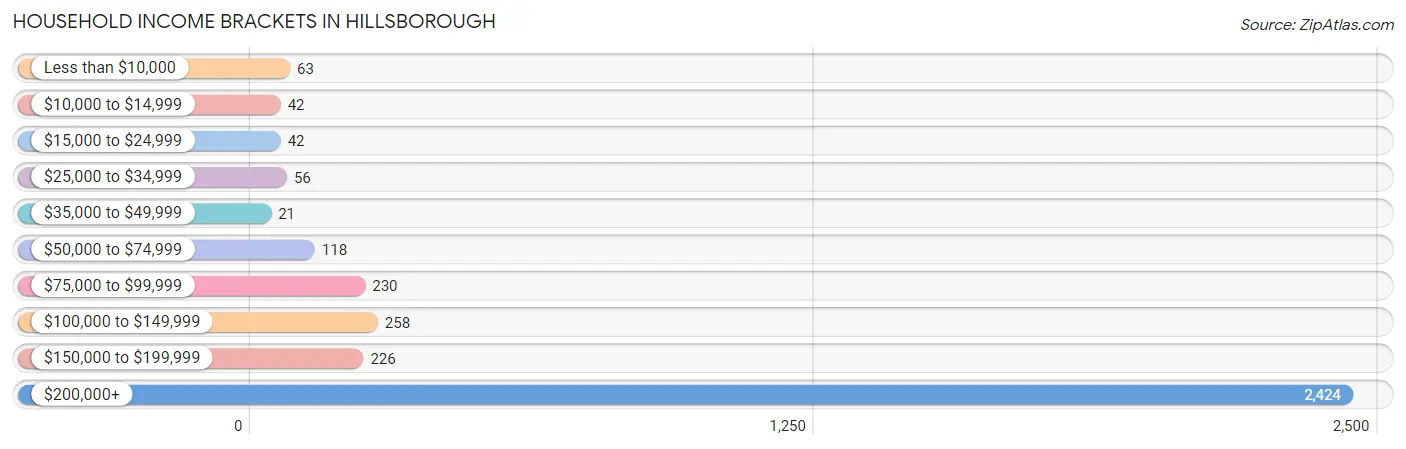
| Income Bracket | # Households | % Households |
| Less than $10,000 | 63 | 1.8% |
| $10,000 to $14,999 | 42 | 1.2% |
| $15,000 to $24,999 | 42 | 1.2% |
| $25,000 to $34,999 | 56 | 1.6% |
| $35,000 to $49,999 | 21 | 0.6% |
| $50,000 to $74,999 | 118 | 3.4% |
| $75,000 to $99,999 | 230 | 6.6% |
| $100,000 to $149,999 | 258 | 7.4% |
| $150,000 to $199,999 | 226 | 6.5% |
| $200,000+ | 2,424 | 69.6% |
Household Income by Householder Age in Hillsborough
The median household income in Hillsborough is $250,001, with the highest median household income of $250,001 found in the 25 to 44 years age bracket for the primary householder. A total of 402 households (11.5%) fall into this category.
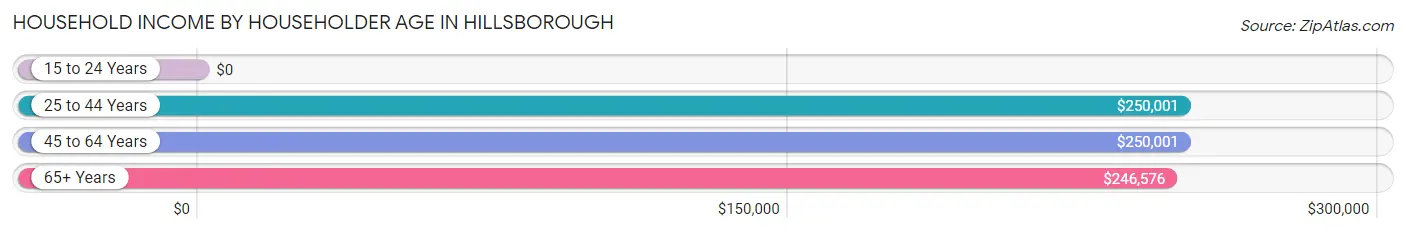
| Income Bracket | # Households | Median Income |
| 15 to 24 Years | 0 (0.0%) | $0 |
| 25 to 44 Years | 402 (11.5%) | $250,001 |
| 45 to 64 Years | 1,896 (54.4%) | $250,001 |
| 65+ Years | 1,185 (34.0%) | $246,576 |
| Total | 3,483 (100.0%) | $250,001 |
Poverty in Hillsborough
Income Below Poverty by Sex and Age in Hillsborough
With 2.6% poverty level for males and 5.4% for females among the residents of Hillsborough, 5 year old males and 18 to 24 year old females are the most vulnerable to poverty, with 40 males (35.4%) and 42 females (14.4%) in their respective age groups living below the poverty level.
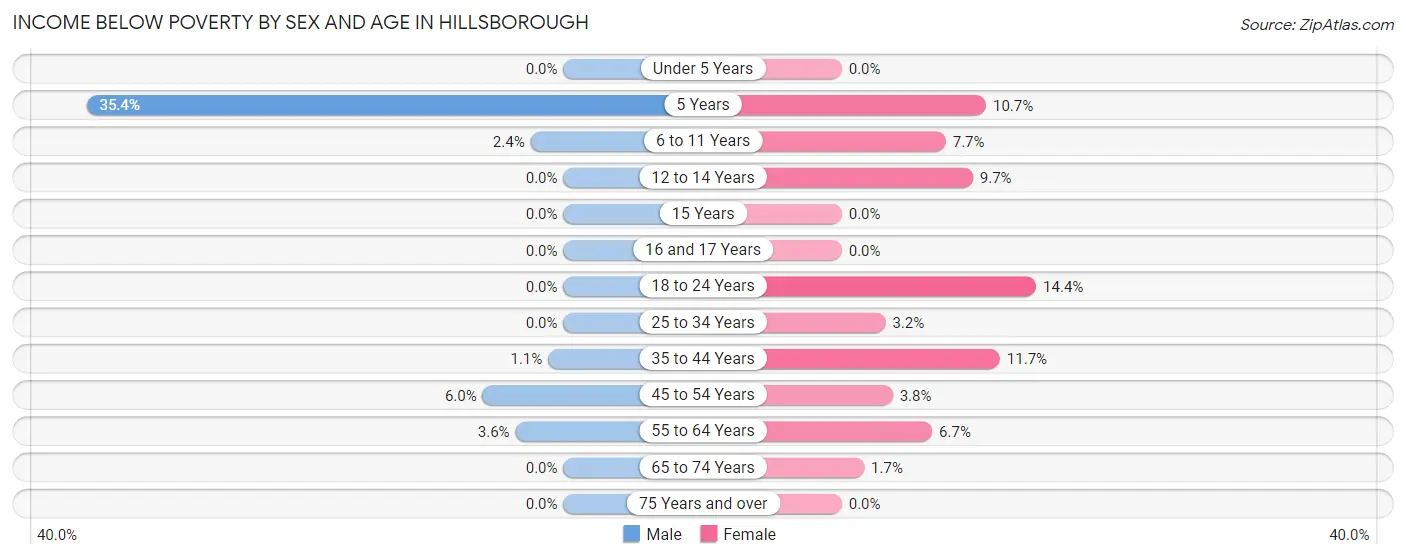
| Age Bracket | Male | Female |
| Under 5 Years | 0 (0.0%) | 0 (0.0%) |
| 5 Years | 40 (35.4%) | 6 (10.7%) |
| 6 to 11 Years | 18 (2.4%) | 43 (7.7%) |
| 12 to 14 Years | 0 (0.0%) | 36 (9.7%) |
| 15 Years | 0 (0.0%) | 0 (0.0%) |
| 16 and 17 Years | 0 (0.0%) | 0 (0.0%) |
| 18 to 24 Years | 0 (0.0%) | 42 (14.4%) |
| 25 to 34 Years | 0 (0.0%) | 10 (3.2%) |
| 35 to 44 Years | 7 (1.1%) | 60 (11.7%) |
| 45 to 54 Years | 53 (6.0%) | 41 (3.8%) |
| 55 to 64 Years | 32 (3.6%) | 51 (6.7%) |
| 65 to 74 Years | 0 (0.0%) | 10 (1.7%) |
| 75 Years and over | 0 (0.0%) | 0 (0.0%) |
| Total | 150 (2.6%) | 299 (5.4%) |
Income Above Poverty by Sex and Age in Hillsborough
According to the poverty statistics in Hillsborough, males aged under 5 years and females aged under 5 years are the age groups that are most secure financially, with 100.0% of males and 100.0% of females in these age groups living above the poverty line.
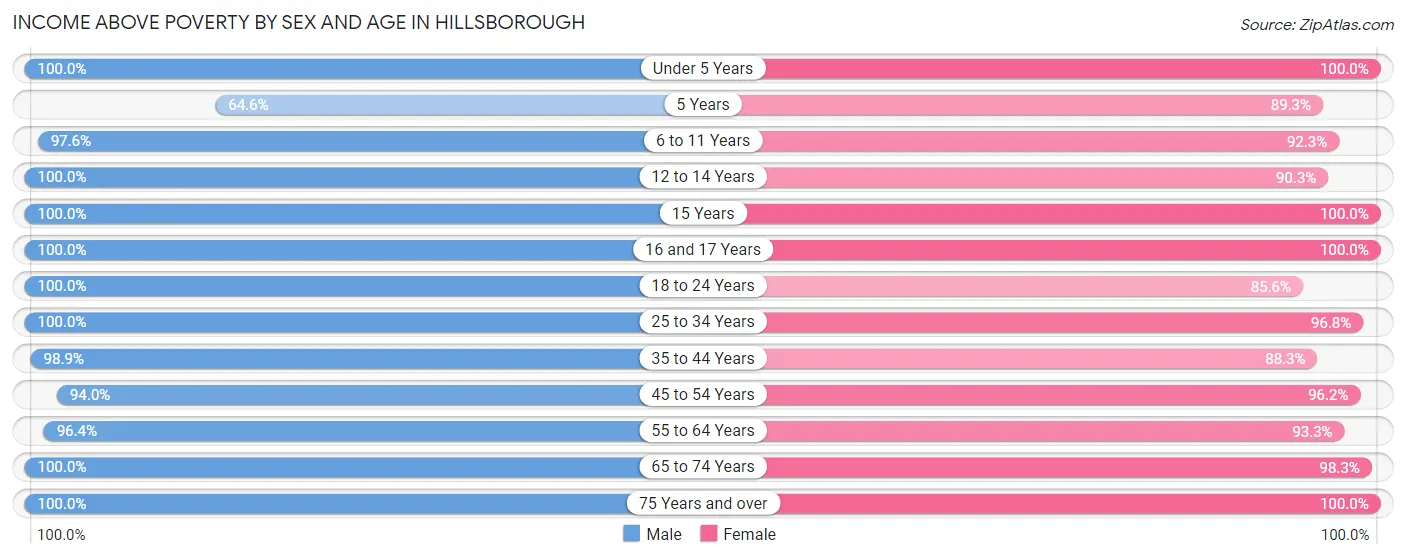
| Age Bracket | Male | Female |
| Under 5 Years | 241 (100.0%) | 134 (100.0%) |
| 5 Years | 73 (64.6%) | 50 (89.3%) |
| 6 to 11 Years | 719 (97.6%) | 514 (92.3%) |
| 12 to 14 Years | 275 (100.0%) | 334 (90.3%) |
| 15 Years | 71 (100.0%) | 125 (100.0%) |
| 16 and 17 Years | 254 (100.0%) | 140 (100.0%) |
| 18 to 24 Years | 363 (100.0%) | 249 (85.6%) |
| 25 to 34 Years | 173 (100.0%) | 299 (96.8%) |
| 35 to 44 Years | 610 (98.9%) | 451 (88.3%) |
| 45 to 54 Years | 830 (94.0%) | 1,045 (96.2%) |
| 55 to 64 Years | 868 (96.4%) | 709 (93.3%) |
| 65 to 74 Years | 535 (100.0%) | 594 (98.3%) |
| 75 Years and over | 547 (100.0%) | 577 (100.0%) |
| Total | 5,559 (97.4%) | 5,221 (94.6%) |
Income Below Poverty Among Married-Couple Families in Hillsborough
The poverty statistics for married-couple families in Hillsborough show that 1.6% or 45 of the total 2,852 families live below the poverty line. Families with 3 or 4 children have the highest poverty rate of 4.5%, comprising of 12 families. On the other hand, families with 1 or 2 children have the lowest poverty rate of 0.5%, which includes 6 families.
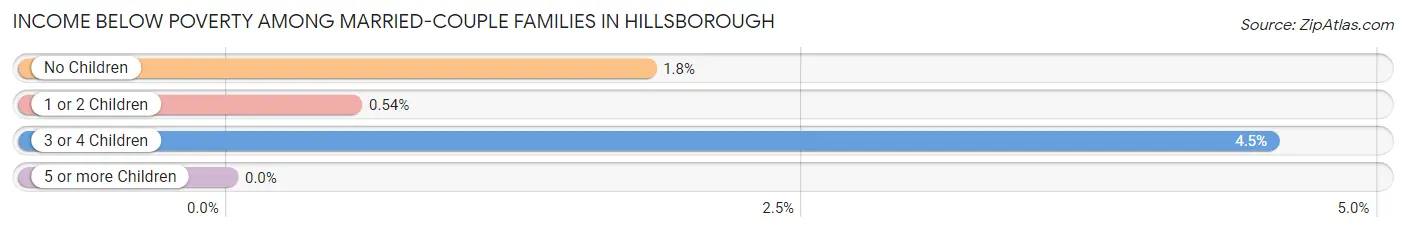
| Children | Above Poverty | Below Poverty |
| No Children | 1,456 (98.2%) | 27 (1.8%) |
| 1 or 2 Children | 1,098 (99.5%) | 6 (0.5%) |
| 3 or 4 Children | 253 (95.5%) | 12 (4.5%) |
| 5 or more Children | 0 (0.0%) | 0 (0.0%) |
| Total | 2,807 (98.4%) | 45 (1.6%) |
Income Below Poverty Among Single-Parent Households in Hillsborough
According to the poverty data in Hillsborough, 38.5% or 42 single-father households and 7.2% or 9 single-mother households are living below the poverty line. Among single-father households, those with 1 or 2 children have the highest poverty rate, with 42 households (67.7%) experiencing poverty. Likewise, among single-mother households, those with 1 or 2 children have the highest poverty rate, with 9 households (19.6%) falling below the poverty line.
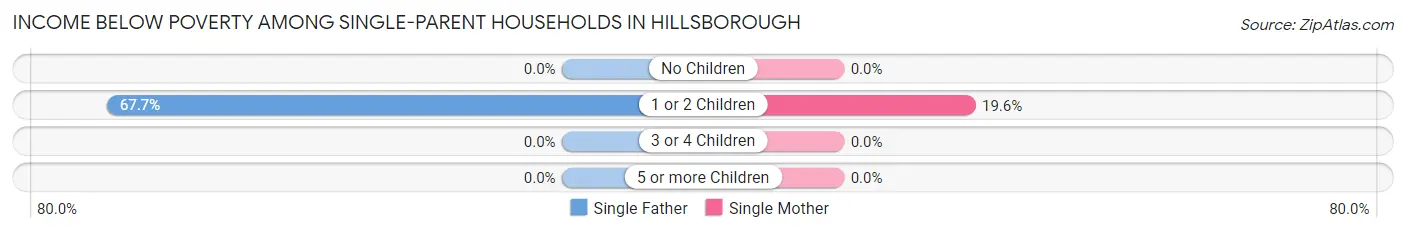
| Children | Single Father | Single Mother |
| No Children | 0 (0.0%) | 0 (0.0%) |
| 1 or 2 Children | 42 (67.7%) | 9 (19.6%) |
| 3 or 4 Children | 0 (0.0%) | 0 (0.0%) |
| 5 or more Children | 0 (0.0%) | 0 (0.0%) |
| Total | 42 (38.5%) | 9 (7.2%) |
Income Below Poverty Among Married-Couple vs Single-Parent Households in Hillsborough
The poverty data for Hillsborough shows that 45 of the married-couple family households (1.6%) and 51 of the single-parent households (21.8%) are living below the poverty level. Within the married-couple family households, those with 3 or 4 children have the highest poverty rate, with 12 households (4.5%) falling below the poverty line. Among the single-parent households, those with 1 or 2 children have the highest poverty rate, with 51 household (47.2%) living below poverty.
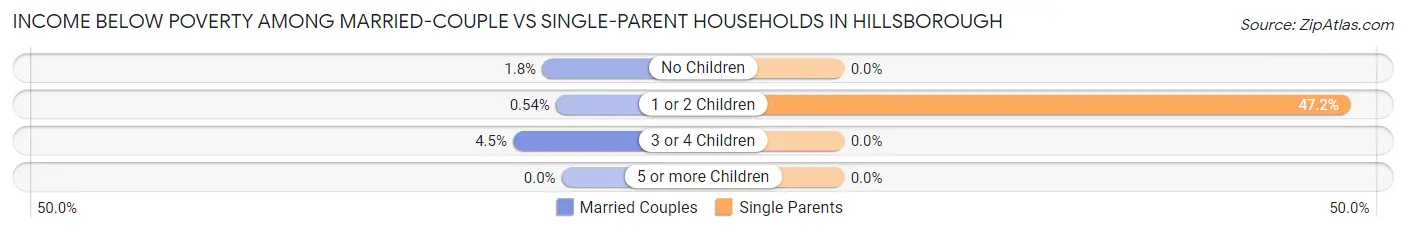
| Children | Married-Couple Families | Single-Parent Households |
| No Children | 27 (1.8%) | 0 (0.0%) |
| 1 or 2 Children | 6 (0.5%) | 51 (47.2%) |
| 3 or 4 Children | 12 (4.5%) | 0 (0.0%) |
| 5 or more Children | 0 (0.0%) | 0 (0.0%) |
| Total | 45 (1.6%) | 51 (21.8%) |
Race in Hillsborough
The most populous races in Hillsborough are White / Caucasian (6,030 | 53.6%), Asian (3,800 | 33.8%), and Two or more Races (1,160 | 10.3%).
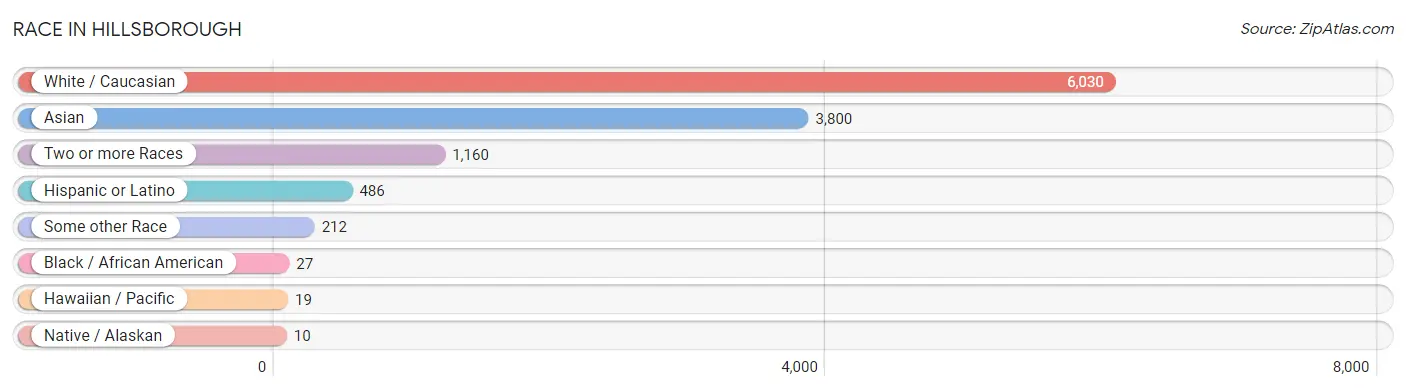
| Race | # Population | % Population |
| Asian | 3,800 | 33.8% |
| Black / African American | 27 | 0.2% |
| Hawaiian / Pacific | 19 | 0.2% |
| Hispanic or Latino | 486 | 4.3% |
| Native / Alaskan | 10 | 0.1% |
| White / Caucasian | 6,030 | 53.6% |
| Two or more Races | 1,160 | 10.3% |
| Some other Race | 212 | 1.9% |
| Total | 11,258 | 100.0% |
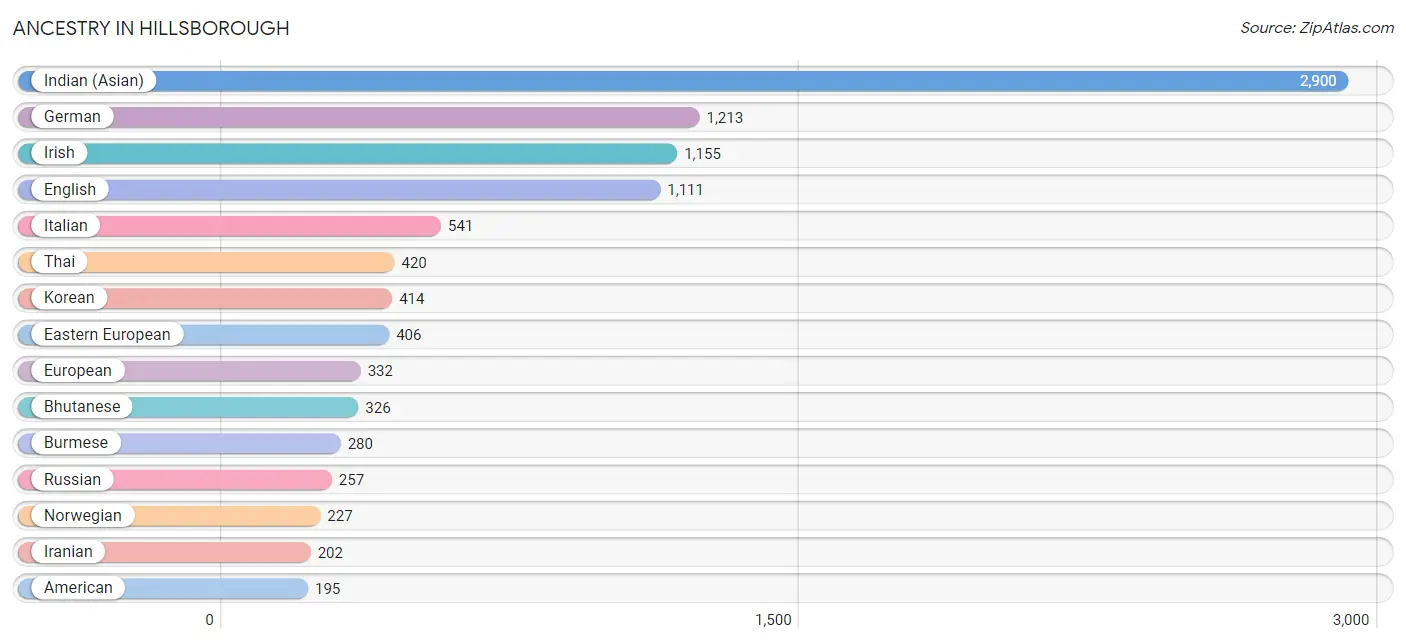
Ancestry in Hillsborough
The most populous ancestries reported in Hillsborough are Indian (Asian) (2,900 | 25.8%), German (1,213 | 10.8%), Irish (1,155 | 10.3%), English (1,111 | 9.9%), and Italian (541 | 4.8%), together accounting for 61.5% of all Hillsborough residents.
| Ancestry | # Population | % Population |
| American | 195 | 1.7% |
| Arab | 136 | 1.2% |
| Argentinean | 57 | 0.5% |
| Armenian | 12 | 0.1% |
| Assyrian / Chaldean / Syriac | 12 | 0.1% |
| Australian | 8 | 0.1% |
| Austrian | 37 | 0.3% |
| Barbadian | 7 | 0.1% |
| Basque | 19 | 0.2% |
| Belgian | 7 | 0.1% |
| Bhutanese | 326 | 2.9% |
| Brazilian | 9 | 0.1% |
| British | 57 | 0.5% |
| Bulgarian | 18 | 0.2% |
| Burmese | 280 | 2.5% |
| Canadian | 107 | 0.9% |
| Central American | 53 | 0.5% |
| Colombian | 53 | 0.5% |
| Croatian | 27 | 0.2% |
| Cuban | 20 | 0.2% |
| Czech | 25 | 0.2% |
| Danish | 81 | 0.7% |
| Dutch | 110 | 1.0% |
| Eastern European | 406 | 3.6% |
| Egyptian | 20 | 0.2% |
| English | 1,111 | 9.9% |
| European | 332 | 2.9% |
| Filipino | 138 | 1.2% |
| Finnish | 8 | 0.1% |
| French | 175 | 1.5% |
| French Canadian | 17 | 0.2% |
| German | 1,213 | 10.8% |
| Greek | 64 | 0.6% |
| Hungarian | 154 | 1.4% |
| Indian (Asian) | 2,900 | 25.8% |
| Inupiat | 10 | 0.1% |
| Iranian | 202 | 1.8% |
| Irish | 1,155 | 10.3% |
| Israeli | 23 | 0.2% |
| Italian | 541 | 4.8% |
| Korean | 414 | 3.7% |
| Lebanese | 65 | 0.6% |
| Lithuanian | 36 | 0.3% |
| Mexican | 182 | 1.6% |
| Nicaraguan | 10 | 0.1% |
| Northern European | 29 | 0.3% |
| Norwegian | 227 | 2.0% |
| Pakistani | 43 | 0.4% |
| Palestinian | 30 | 0.3% |
| Peruvian | 57 | 0.5% |
| Polish | 147 | 1.3% |
| Portuguese | 82 | 0.7% |
| Romanian | 10 | 0.1% |
| Russian | 257 | 2.3% |
| Salvadoran | 43 | 0.4% |
| Scandinavian | 22 | 0.2% |
| Scotch-Irish | 26 | 0.2% |
| Scottish | 151 | 1.3% |
| Serbian | 12 | 0.1% |
| Slovak | 7 | 0.1% |
| South American | 175 | 1.5% |
| Spaniard | 34 | 0.3% |
| Spanish | 22 | 0.2% |
| Sri Lankan | 76 | 0.7% |
| Swedish | 56 | 0.5% |
| Swiss | 24 | 0.2% |
| Thai | 420 | 3.7% |
| Tongan | 15 | 0.1% |
| Turkish | 9 | 0.1% |
| Ukrainian | 62 | 0.5% |
| Venezuelan | 8 | 0.1% |
| Welsh | 178 | 1.6% |
| Yugoslavian | 46 | 0.4% | View All 73 Rows |
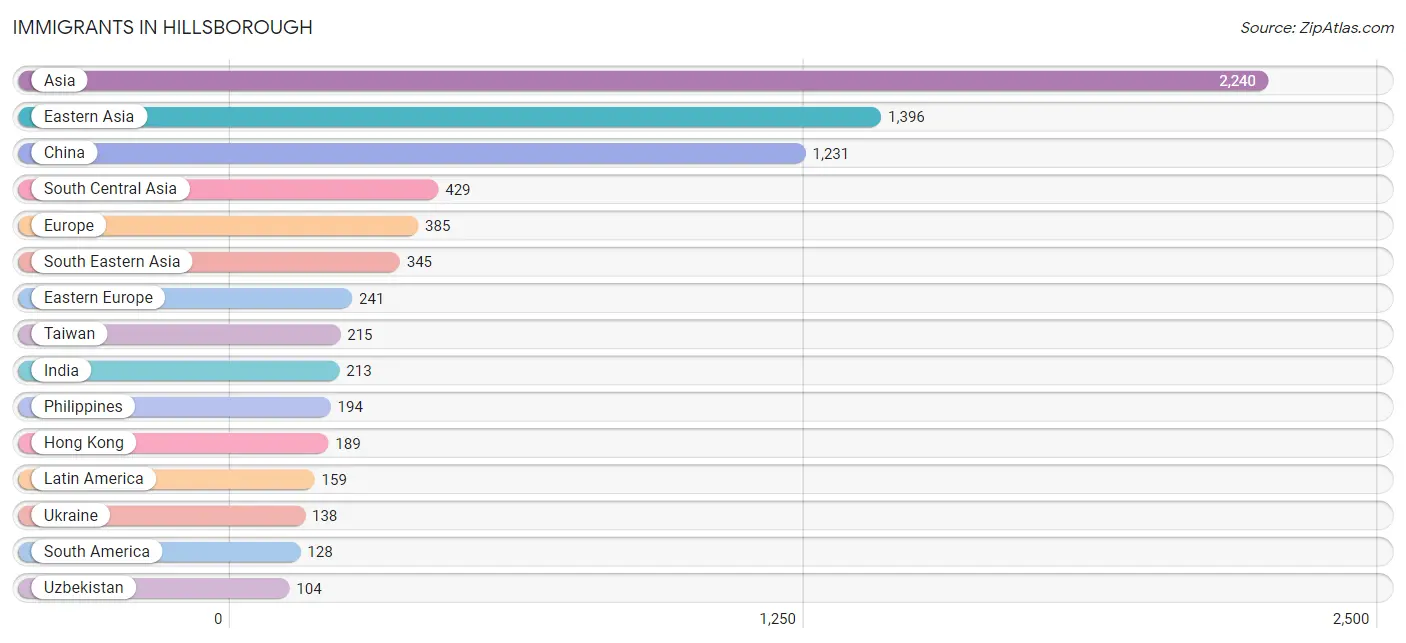
Immigrants in Hillsborough
The most numerous immigrant groups reported in Hillsborough came from Asia (2,240 | 19.9%), Eastern Asia (1,396 | 12.4%), China (1,231 | 10.9%), South Central Asia (429 | 3.8%), and Europe (385 | 3.4%), together accounting for 50.5% of all Hillsborough residents.
| Immigration Origin | # Population | % Population |
| Africa | 44 | 0.4% |
| Argentina | 9 | 0.1% |
| Asia | 2,240 | 19.9% |
| Australia | 25 | 0.2% |
| Belarus | 52 | 0.5% |
| Brazil | 9 | 0.1% |
| Bulgaria | 8 | 0.1% |
| Canada | 44 | 0.4% |
| Central America | 31 | 0.3% |
| China | 1,231 | 10.9% |
| Colombia | 53 | 0.5% |
| Denmark | 18 | 0.2% |
| Eastern Asia | 1,396 | 12.4% |
| Eastern Europe | 241 | 2.1% |
| Egypt | 44 | 0.4% |
| El Salvador | 12 | 0.1% |
| England | 18 | 0.2% |
| Europe | 385 | 3.4% |
| Fiji | 14 | 0.1% |
| France | 23 | 0.2% |
| Germany | 41 | 0.4% |
| Hong Kong | 189 | 1.7% |
| India | 213 | 1.9% |
| Iran | 93 | 0.8% |
| Israel | 23 | 0.2% |
| Japan | 73 | 0.6% |
| Jordan | 28 | 0.3% |
| Korea | 92 | 0.8% |
| Latin America | 159 | 1.4% |
| Mexico | 9 | 0.1% |
| Netherlands | 3 | 0.0% |
| Nicaragua | 10 | 0.1% |
| Northern Africa | 44 | 0.4% |
| Northern Europe | 46 | 0.4% |
| Oceania | 57 | 0.5% |
| Pakistan | 19 | 0.2% |
| Peru | 57 | 0.5% |
| Philippines | 194 | 1.7% |
| Romania | 10 | 0.1% |
| Saudi Arabia | 19 | 0.2% |
| Singapore | 36 | 0.3% |
| South America | 128 | 1.1% |
| South Central Asia | 429 | 3.8% |
| South Eastern Asia | 345 | 3.1% |
| Southern Europe | 11 | 0.1% |
| Spain | 11 | 0.1% |
| Switzerland | 20 | 0.2% |
| Taiwan | 215 | 1.9% |
| Thailand | 47 | 0.4% |
| Ukraine | 138 | 1.2% |
| Uzbekistan | 104 | 0.9% |
| Vietnam | 45 | 0.4% |
| Western Asia | 70 | 0.6% |
| Western Europe | 87 | 0.8% | View All 54 Rows |
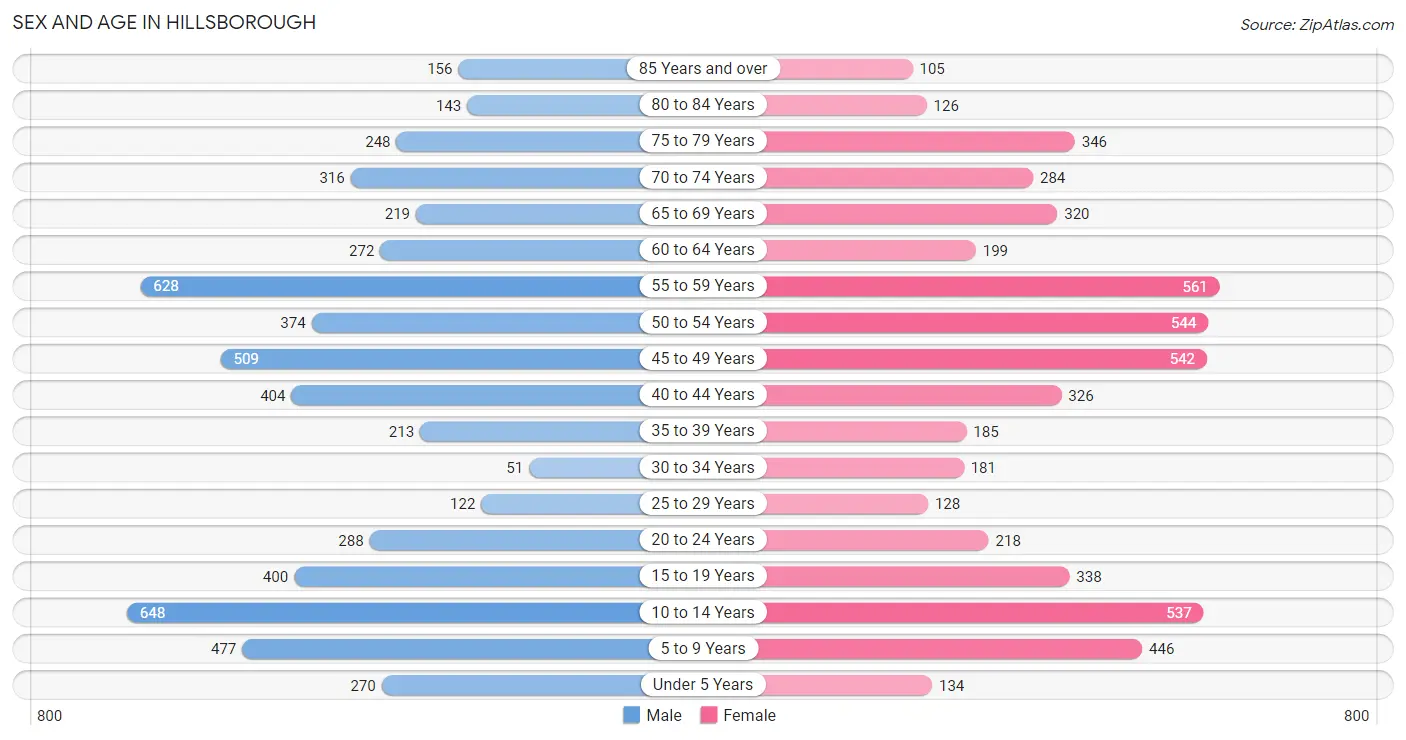
Sex and Age in Hillsborough
Sex and Age in Hillsborough
The most populous age groups in Hillsborough are 10 to 14 Years (648 | 11.3%) for men and 55 to 59 Years (561 | 10.2%) for women.
| Age Bracket | Male | Female |
| Under 5 Years | 270 (4.7%) | 134 (2.4%) |
| 5 to 9 Years | 477 (8.3%) | 446 (8.1%) |
| 10 to 14 Years | 648 (11.3%) | 537 (9.7%) |
| 15 to 19 Years | 400 (7.0%) | 338 (6.1%) |
| 20 to 24 Years | 288 (5.0%) | 218 (4.0%) |
| 25 to 29 Years | 122 (2.1%) | 128 (2.3%) |
| 30 to 34 Years | 51 (0.9%) | 181 (3.3%) |
| 35 to 39 Years | 213 (3.7%) | 185 (3.4%) |
| 40 to 44 Years | 404 (7.0%) | 326 (5.9%) |
| 45 to 49 Years | 509 (8.9%) | 542 (9.8%) |
| 50 to 54 Years | 374 (6.5%) | 544 (9.9%) |
| 55 to 59 Years | 628 (10.9%) | 561 (10.2%) |
| 60 to 64 Years | 272 (4.7%) | 199 (3.6%) |
| 65 to 69 Years | 219 (3.8%) | 320 (5.8%) |
| 70 to 74 Years | 316 (5.5%) | 284 (5.1%) |
| 75 to 79 Years | 248 (4.3%) | 346 (6.3%) |
| 80 to 84 Years | 143 (2.5%) | 126 (2.3%) |
| 85 Years and over | 156 (2.7%) | 105 (1.9%) |
| Total | 5,738 (100.0%) | 5,520 (100.0%) |
Families and Households in Hillsborough
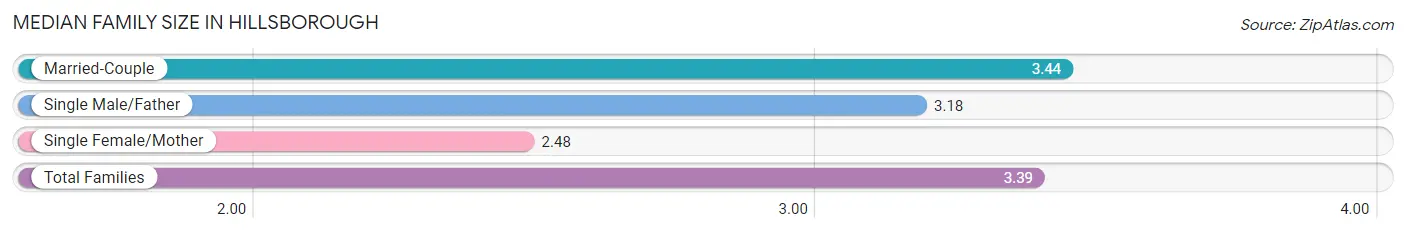
Median Family Size in Hillsborough
The median family size in Hillsborough is 3.39 persons per family, with married-couple families (2,852 | 92.4%) accounting for the largest median family size of 3.44 persons per family. On the other hand, single female/mother families (125 | 4.1%) represent the smallest median family size with 2.48 persons per family.
| Family Type | # Families | Family Size |
| Married-Couple | 2,852 (92.4%) | 3.44 |
| Single Male/Father | 109 (3.5%) | 3.18 |
| Single Female/Mother | 125 (4.1%) | 2.48 |
| Total Families | 3,086 (100.0%) | 3.39 |
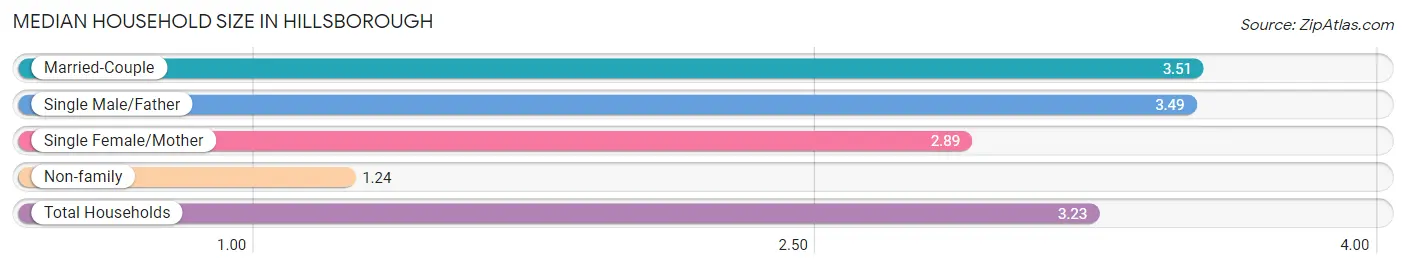
Median Household Size in Hillsborough
The median household size in Hillsborough is 3.23 persons per household, with married-couple households (2,852 | 81.9%) accounting for the largest median household size of 3.51 persons per household. non-family households (397 | 11.4%) represent the smallest median household size with 1.24 persons per household.
| Household Type | # Households | Household Size |
| Married-Couple | 2,852 (81.9%) | 3.51 |
| Single Male/Father | 109 (3.1%) | 3.49 |
| Single Female/Mother | 125 (3.6%) | 2.89 |
| Non-family | 397 (11.4%) | 1.24 |
| Total Households | 3,483 (100.0%) | 3.23 |
Household Size by Marriage Status in Hillsborough
Out of a total of 3,483 households in Hillsborough, 3,086 (88.6%) are family households, while 397 (11.4%) are nonfamily households. The most numerous type of family households are 2-person households, comprising 1,062, and the most common type of nonfamily households are 1-person households, comprising 335.
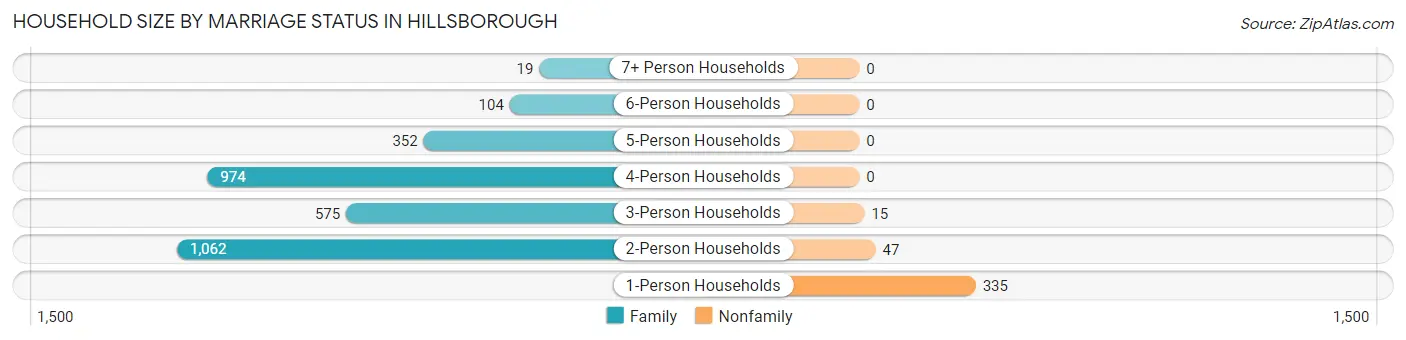
| Household Size | Family Households | Nonfamily Households |
| 1-Person Households | - | 335 (9.6%) |
| 2-Person Households | 1,062 (30.5%) | 47 (1.3%) |
| 3-Person Households | 575 (16.5%) | 15 (0.4%) |
| 4-Person Households | 974 (28.0%) | 0 (0.0%) |
| 5-Person Households | 352 (10.1%) | 0 (0.0%) |
| 6-Person Households | 104 (3.0%) | 0 (0.0%) |
| 7+ Person Households | 19 (0.5%) | 0 (0.0%) |
| Total | 3,086 (88.6%) | 397 (11.4%) |
Female Fertility in Hillsborough
Fertility by Age in Hillsborough
Average fertility rate in Hillsborough is 18.0 births per 1,000 women. Women in the age bracket of 35 to 50 years have the highest fertility rate with 25.0 births per 1,000 women. Women in the age bracket of 35 to 50 years acount for 75.0% of all women with births.
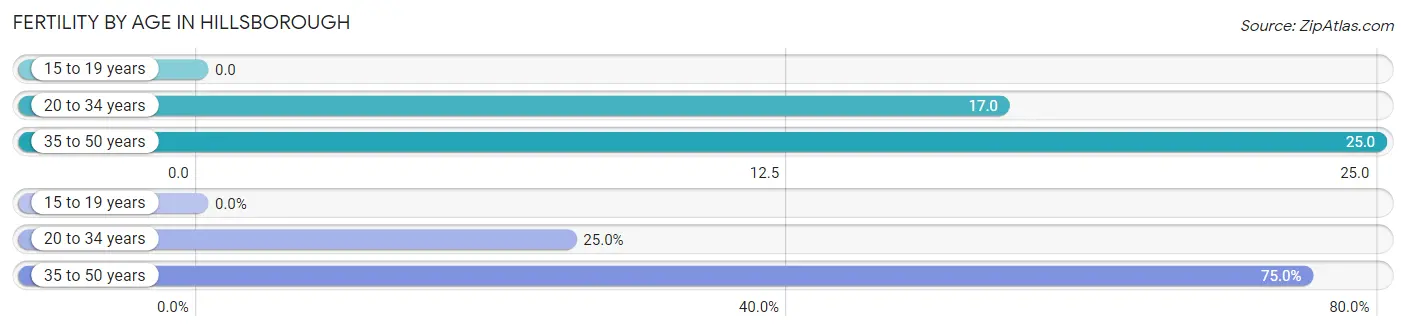
| Age Bracket | Women with Births | Births / 1,000 Women |
| 15 to 19 years | 0 (0.0%) | 0.0 |
| 20 to 34 years | 9 (25.0%) | 17.0 |
| 35 to 50 years | 27 (75.0%) | 25.0 |
| Total | 36 (100.0%) | 18.0 |
Fertility by Age by Marriage Status in Hillsborough
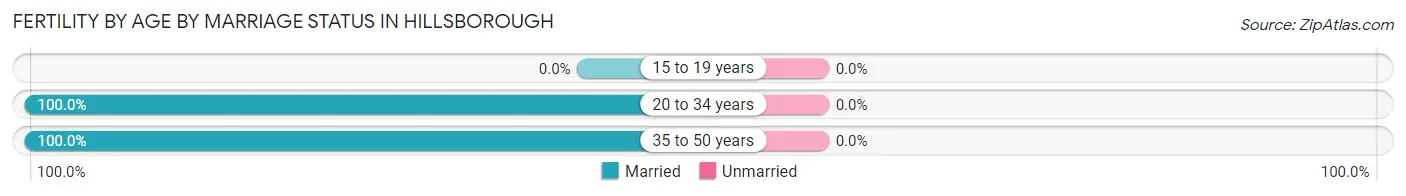
| Age Bracket | Married | Unmarried |
| 15 to 19 years | 0 (0.0%) | 0 (0.0%) |
| 20 to 34 years | 9 (100.0%) | 0 (0.0%) |
| 35 to 50 years | 27 (100.0%) | 0 (0.0%) |
| Total | 36 (100.0%) | 0 (0.0%) |
Fertility by Education in Hillsborough
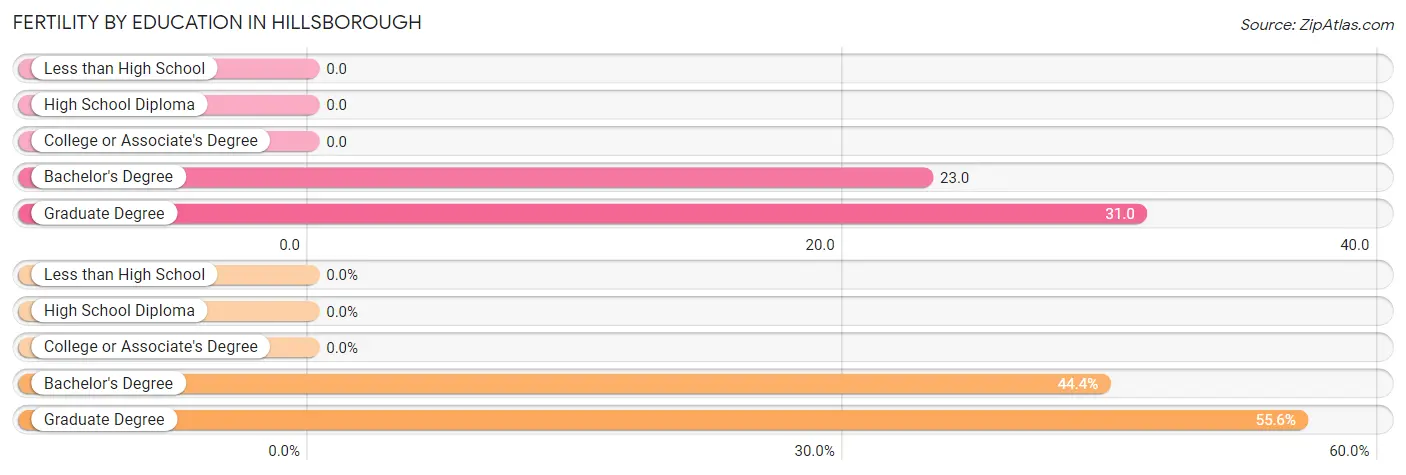
| Educational Attainment | Women with Births | Births / 1,000 Women |
| Less than High School | 0 (0.0%) | 0.0 |
| High School Diploma | 0 (0.0%) | 0.0 |
| College or Associate's Degree | 0 (0.0%) | 0.0 |
| Bachelor's Degree | 16 (44.4%) | 23.0 |
| Graduate Degree | 20 (55.6%) | 31.0 |
| Total | 36 (100.0%) | 18.0 |
Fertility by Education by Marriage Status in Hillsborough
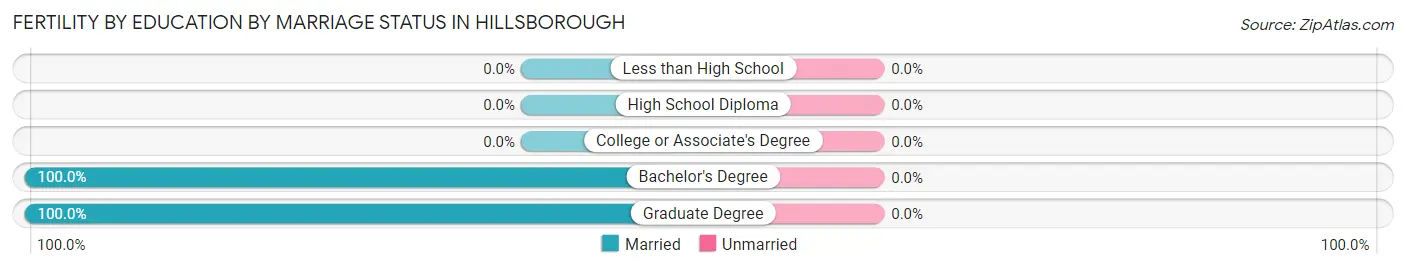
| Educational Attainment | Married | Unmarried |
| Less than High School | 0 (0.0%) | 0 (0.0%) |
| High School Diploma | 0 (0.0%) | 0 (0.0%) |
| College or Associate's Degree | 0 (0.0%) | 0 (0.0%) |
| Bachelor's Degree | 16 (100.0%) | 0 (0.0%) |
| Graduate Degree | 20 (100.0%) | 0 (0.0%) |
| Total | 36 (100.0%) | 0 (0.0%) |
Employment Characteristics in Hillsborough
Employment by Class of Employer in Hillsborough
Among the 4,893 employed individuals in Hillsborough, private company employees (3,000 | 61.3%), self-employed (incorporated) (724 | 14.8%), and self-employed (not incorporated) (428 | 8.7%) make up the most common classes of employment.
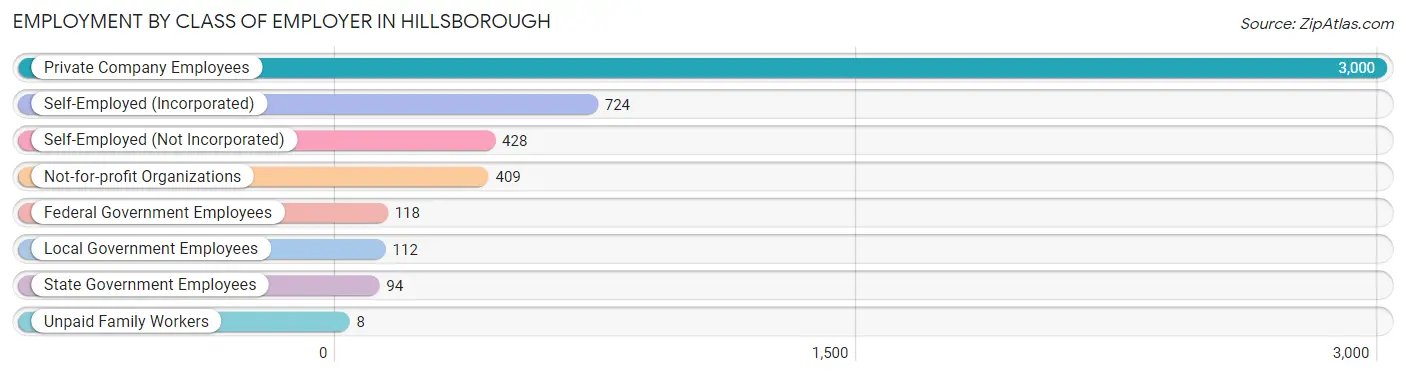
| Employer Class | # Employees | % Employees |
| Private Company Employees | 3,000 | 61.3% |
| Self-Employed (Incorporated) | 724 | 14.8% |
| Self-Employed (Not Incorporated) | 428 | 8.7% |
| Not-for-profit Organizations | 409 | 8.4% |
| Local Government Employees | 112 | 2.3% |
| State Government Employees | 94 | 1.9% |
| Federal Government Employees | 118 | 2.4% |
| Unpaid Family Workers | 8 | 0.2% |
| Total | 4,893 | 100.0% |
Employment Status by Age in Hillsborough
According to the labor force statistics for Hillsborough, out of the total population over 16 years of age (8,550), 61.2% or 5,233 individuals are in the labor force, with 5.4% or 283 of them unemployed. The age group with the highest labor force participation rate is 25 to 29 years, with 87.2% or 218 individuals in the labor force. Within the labor force, the 75 years and over age range has the highest percentage of unemployed individuals, with 15.6% or 36 of them being unemployed.
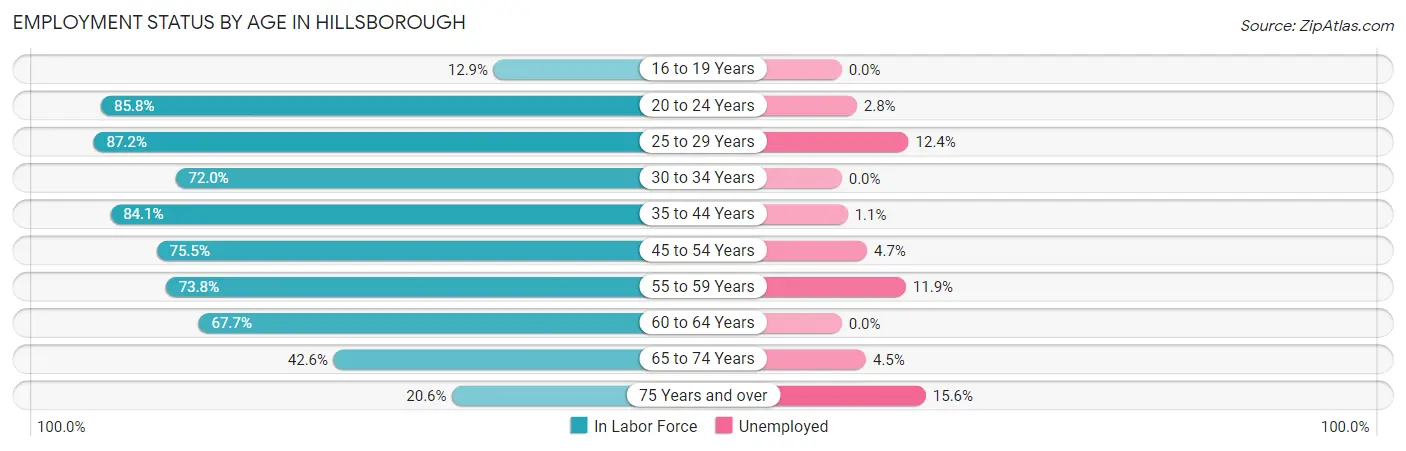
| Age Bracket | In Labor Force | Unemployed |
| 16 to 19 Years | 70 (12.9%) | 0 (0.0%) |
| 20 to 24 Years | 434 (85.8%) | 12 (2.8%) |
| 25 to 29 Years | 218 (87.2%) | 27 (12.4%) |
| 30 to 34 Years | 167 (72.0%) | 0 (0.0%) |
| 35 to 44 Years | 949 (84.1%) | 10 (1.1%) |
| 45 to 54 Years | 1,487 (75.5%) | 70 (4.7%) |
| 55 to 59 Years | 877 (73.8%) | 104 (11.9%) |
| 60 to 64 Years | 319 (67.7%) | 0 (0.0%) |
| 65 to 74 Years | 485 (42.6%) | 22 (4.5%) |
| 75 Years and over | 232 (20.6%) | 36 (15.6%) |
| Total | 5,233 (61.2%) | 283 (5.4%) |
Employment Status by Educational Attainment in Hillsborough
According to labor force statistics for Hillsborough, 76.7% of individuals (4,018) out of the total population between 25 and 64 years of age (5,239) are in the labor force, with 5.3% or 213 of them being unemployed. The group with the highest labor force participation rate are those with the educational attainment of high school diploma, with 89.1% or 155 individuals in the labor force. Within the labor force, individuals with bachelor's degree or higher education have the highest percentage of unemployment, with 6.2% or 212 of them being unemployed.
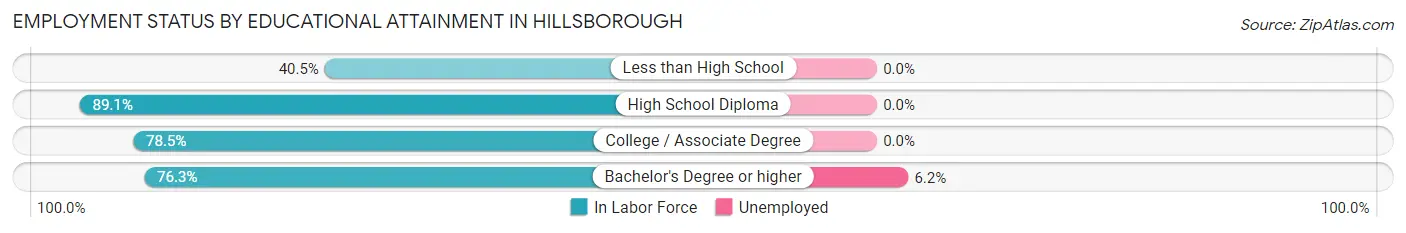
| Educational Attainment | In Labor Force | Unemployed |
| Less than High School | 17 (40.5%) | 0 (0.0%) |
| High School Diploma | 155 (89.1%) | 0 (0.0%) |
| College / Associate Degree | 424 (78.5%) | 0 (0.0%) |
| Bachelor's Degree or higher | 3,421 (76.3%) | 278 (6.2%) |
| Total | 4,018 (76.7%) | 278 (5.3%) |
Employment Occupations by Sex in Hillsborough
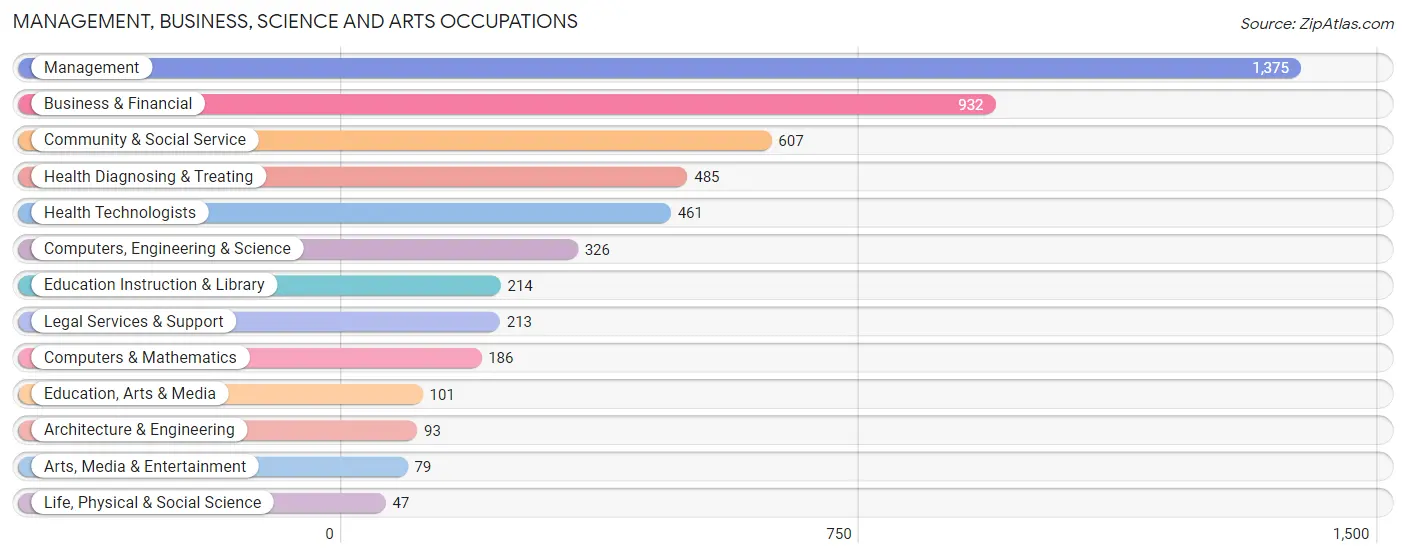
Management, Business, Science and Arts Occupations
The most common Management, Business, Science and Arts occupations in Hillsborough are Management (1,375 | 27.8%), Business & Financial (932 | 18.8%), Community & Social Service (607 | 12.2%), Health Diagnosing & Treating (485 | 9.8%), and Health Technologists (461 | 9.3%).
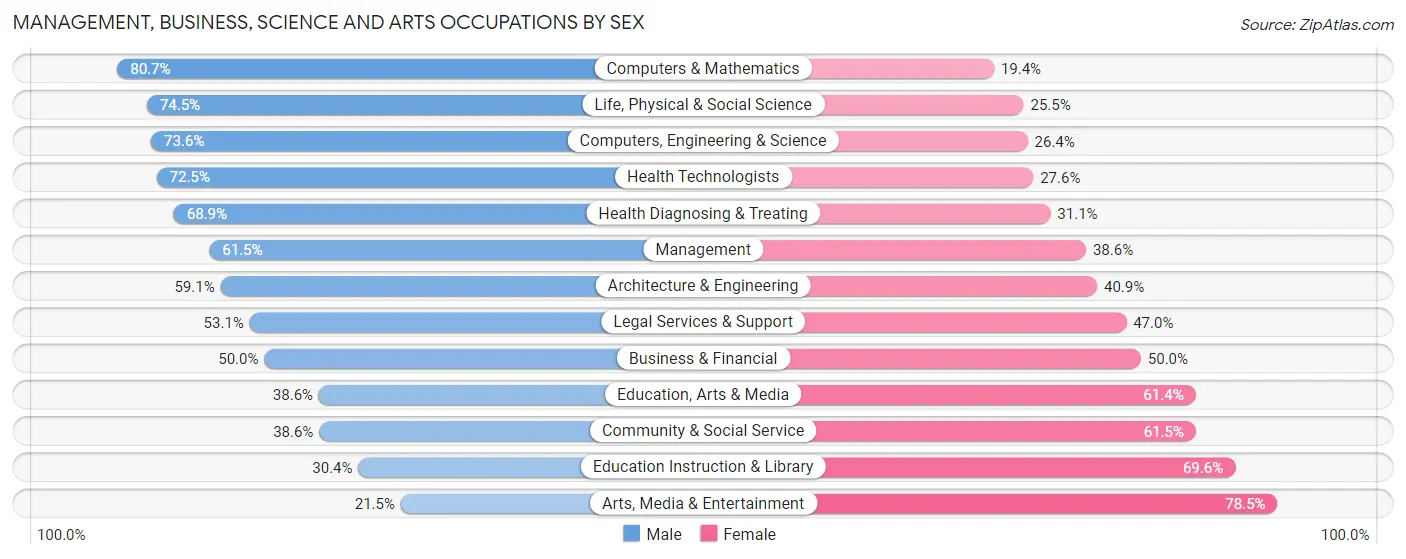
Management, Business, Science and Arts Occupations by Sex
Within the Management, Business, Science and Arts occupations in Hillsborough, the most male-oriented occupations are Computers & Mathematics (80.6%), Life, Physical & Social Science (74.5%), and Computers, Engineering & Science (73.6%), while the most female-oriented occupations are Arts, Media & Entertainment (78.5%), Education Instruction & Library (69.6%), and Community & Social Service (61.5%).
| Occupation | Male | Female |
| Management | 845 (61.5%) | 530 (38.6%) |
| Business & Financial | 466 (50.0%) | 466 (50.0%) |
| Computers, Engineering & Science | 240 (73.6%) | 86 (26.4%) |
| Computers & Mathematics | 150 (80.6%) | 36 (19.4%) |
| Architecture & Engineering | 55 (59.1%) | 38 (40.9%) |
| Life, Physical & Social Science | 35 (74.5%) | 12 (25.5%) |
| Community & Social Service | 234 (38.6%) | 373 (61.5%) |
| Education, Arts & Media | 39 (38.6%) | 62 (61.4%) |
| Legal Services & Support | 113 (53.0%) | 100 (46.9%) |
| Education Instruction & Library | 65 (30.4%) | 149 (69.6%) |
| Arts, Media & Entertainment | 17 (21.5%) | 62 (78.5%) |
| Health Diagnosing & Treating | 334 (68.9%) | 151 (31.1%) |
| Health Technologists | 334 (72.5%) | 127 (27.6%) |
| Total (Category) | 2,119 (56.9%) | 1,606 (43.1%) |
| Total (Overall) | 2,803 (56.6%) | 2,152 (43.4%) |
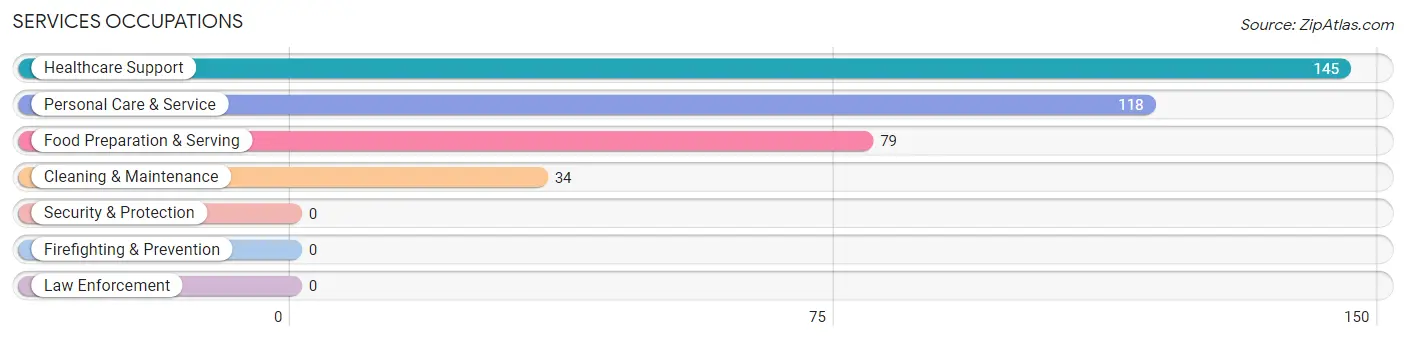
Services Occupations
The most common Services occupations in Hillsborough are Healthcare Support (145 | 2.9%), Personal Care & Service (118 | 2.4%), Food Preparation & Serving (79 | 1.6%), and Cleaning & Maintenance (34 | 0.7%).
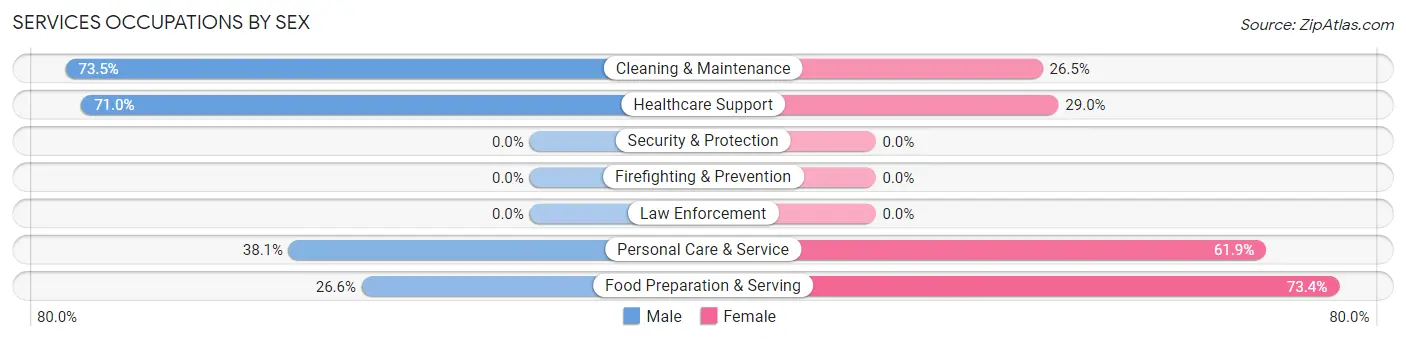
Services Occupations by Sex
Within the Services occupations in Hillsborough, the most male-oriented occupations are Cleaning & Maintenance (73.5%), Healthcare Support (71.0%), and Personal Care & Service (38.1%), while the most female-oriented occupations are Food Preparation & Serving (73.4%), Personal Care & Service (61.9%), and Healthcare Support (29.0%).
| Occupation | Male | Female |
| Healthcare Support | 103 (71.0%) | 42 (29.0%) |
| Security & Protection | 0 (0.0%) | 0 (0.0%) |
| Firefighting & Prevention | 0 (0.0%) | 0 (0.0%) |
| Law Enforcement | 0 (0.0%) | 0 (0.0%) |
| Food Preparation & Serving | 21 (26.6%) | 58 (73.4%) |
| Cleaning & Maintenance | 25 (73.5%) | 9 (26.5%) |
| Personal Care & Service | 45 (38.1%) | 73 (61.9%) |
| Total (Category) | 194 (51.6%) | 182 (48.4%) |
| Total (Overall) | 2,803 (56.6%) | 2,152 (43.4%) |
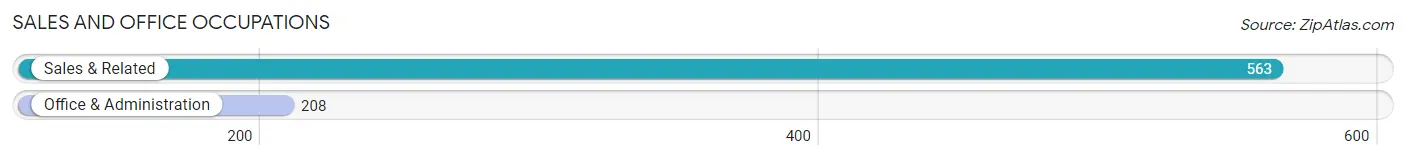
Sales and Office Occupations
The most common Sales and Office occupations in Hillsborough are Sales & Related (563 | 11.4%), and Office & Administration (208 | 4.2%).
Sales and Office Occupations by Sex
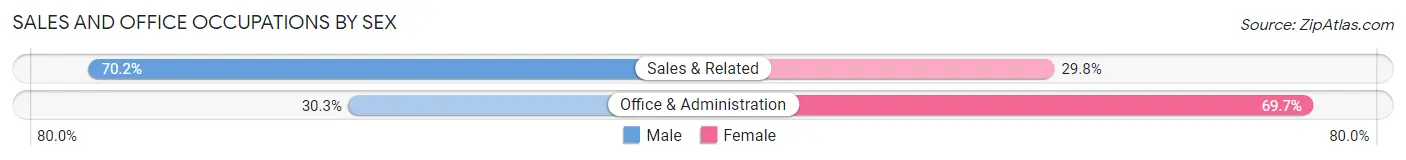
| Occupation | Male | Female |
| Sales & Related | 395 (70.2%) | 168 (29.8%) |
| Office & Administration | 63 (30.3%) | 145 (69.7%) |
| Total (Category) | 458 (59.4%) | 313 (40.6%) |
| Total (Overall) | 2,803 (56.6%) | 2,152 (43.4%) |
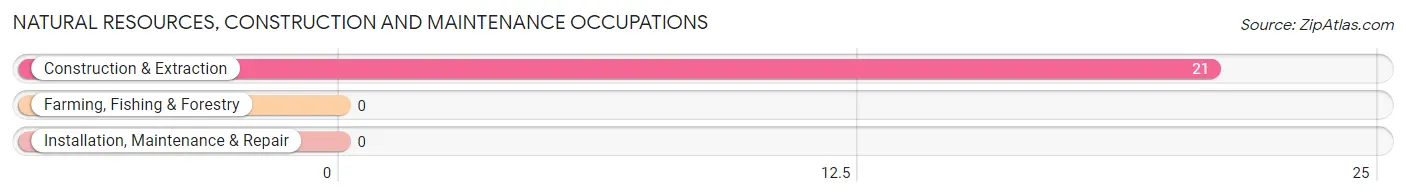
Natural Resources, Construction and Maintenance Occupations
The most common Natural Resources, Construction and Maintenance occupations in Hillsborough are , and Construction & Extraction (21 | 0.4%).
Natural Resources, Construction and Maintenance Occupations by Sex
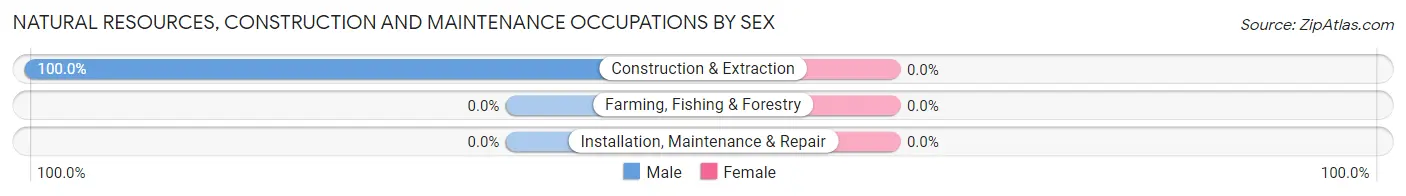
| Occupation | Male | Female |
| Farming, Fishing & Forestry | 0 (0.0%) | 0 (0.0%) |
| Construction & Extraction | 21 (100.0%) | 0 (0.0%) |
| Installation, Maintenance & Repair | 0 (0.0%) | 0 (0.0%) |
| Total (Category) | 21 (100.0%) | 0 (0.0%) |
| Total (Overall) | 2,803 (56.6%) | 2,152 (43.4%) |
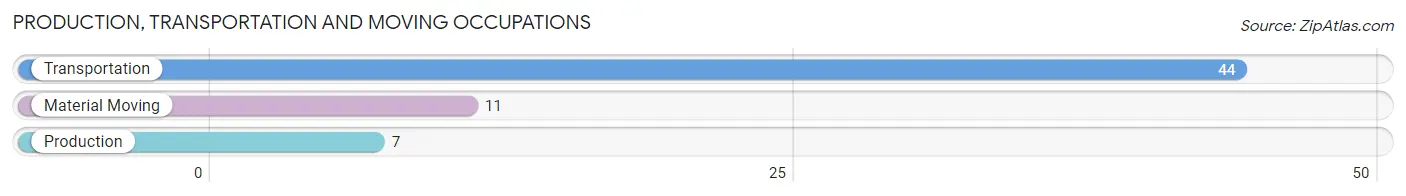
Production, Transportation and Moving Occupations
The most common Production, Transportation and Moving occupations in Hillsborough are Transportation (44 | 0.9%), Material Moving (11 | 0.2%), and Production (7 | 0.1%).
Production, Transportation and Moving Occupations by Sex
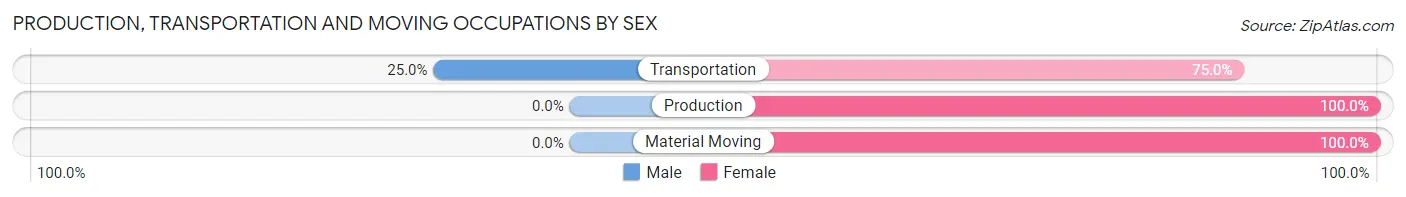
| Occupation | Male | Female |
| Production | 0 (0.0%) | 7 (100.0%) |
| Transportation | 11 (25.0%) | 33 (75.0%) |
| Material Moving | 0 (0.0%) | 11 (100.0%) |
| Total (Category) | 11 (17.7%) | 51 (82.3%) |
| Total (Overall) | 2,803 (56.6%) | 2,152 (43.4%) |
Employment Industries by Sex in Hillsborough
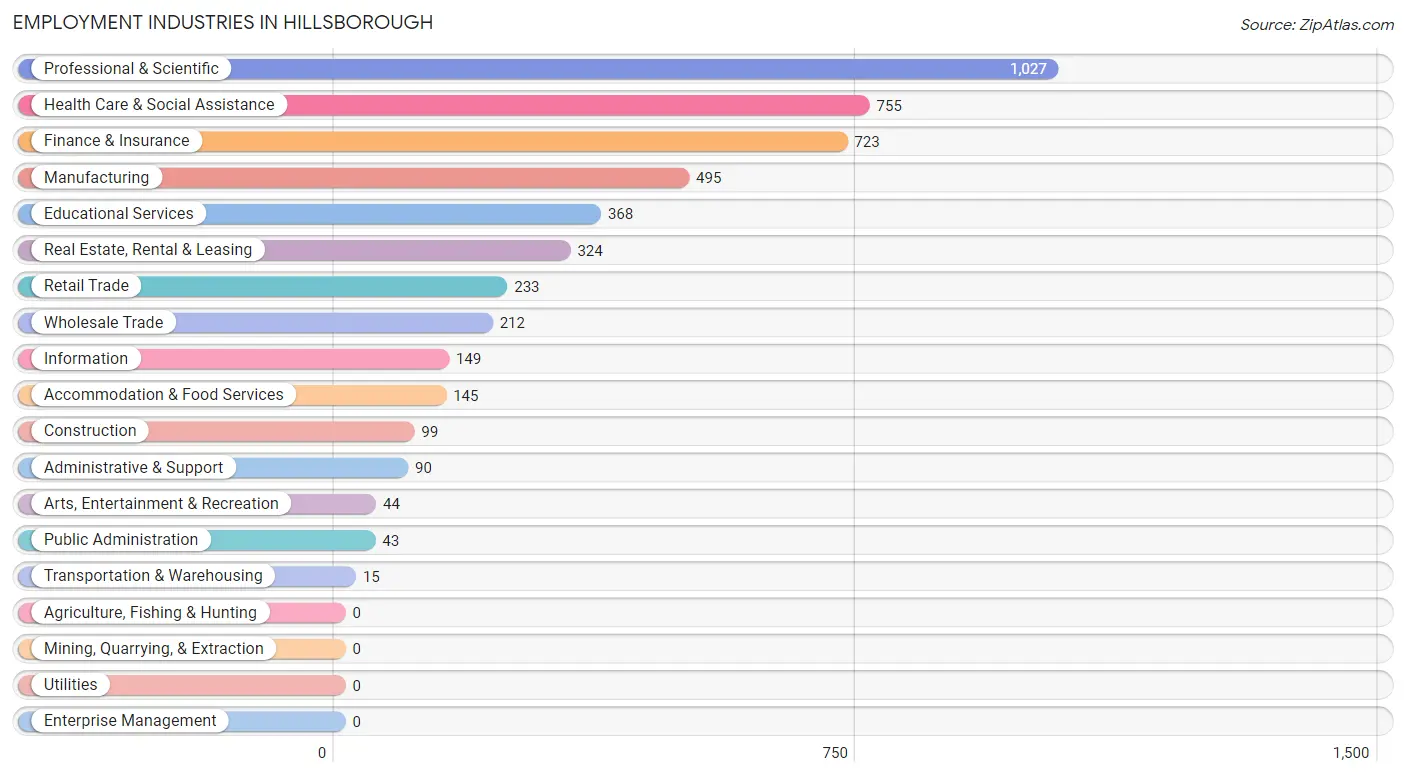
Employment Industries in Hillsborough
The major employment industries in Hillsborough include Professional & Scientific (1,027 | 20.7%), Health Care & Social Assistance (755 | 15.2%), Finance & Insurance (723 | 14.6%), Manufacturing (495 | 10.0%), and Educational Services (368 | 7.4%).
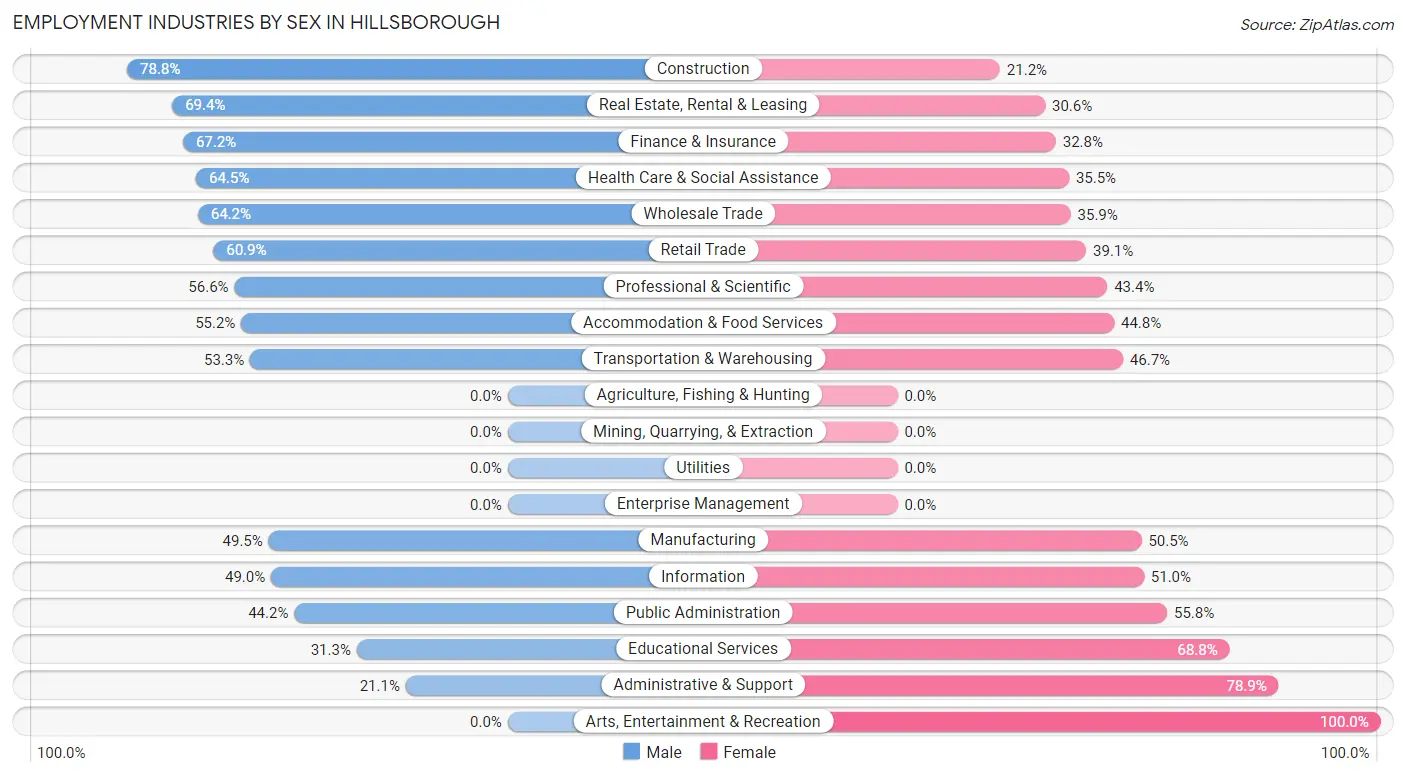
Employment Industries by Sex in Hillsborough
The Hillsborough industries that see more men than women are Construction (78.8%), Real Estate, Rental & Leasing (69.4%), and Finance & Insurance (67.2%), whereas the industries that tend to have a higher number of women are Arts, Entertainment & Recreation (100.0%), Administrative & Support (78.9%), and Educational Services (68.8%).
| Industry | Male | Female |
| Agriculture, Fishing & Hunting | 0 (0.0%) | 0 (0.0%) |
| Mining, Quarrying, & Extraction | 0 (0.0%) | 0 (0.0%) |
| Construction | 78 (78.8%) | 21 (21.2%) |
| Manufacturing | 245 (49.5%) | 250 (50.5%) |
| Wholesale Trade | 136 (64.1%) | 76 (35.8%) |
| Retail Trade | 142 (60.9%) | 91 (39.1%) |
| Transportation & Warehousing | 8 (53.3%) | 7 (46.7%) |
| Utilities | 0 (0.0%) | 0 (0.0%) |
| Information | 73 (49.0%) | 76 (51.0%) |
| Finance & Insurance | 486 (67.2%) | 237 (32.8%) |
| Real Estate, Rental & Leasing | 225 (69.4%) | 99 (30.6%) |
| Professional & Scientific | 581 (56.6%) | 446 (43.4%) |
| Enterprise Management | 0 (0.0%) | 0 (0.0%) |
| Administrative & Support | 19 (21.1%) | 71 (78.9%) |
| Educational Services | 115 (31.2%) | 253 (68.8%) |
| Health Care & Social Assistance | 487 (64.5%) | 268 (35.5%) |
| Arts, Entertainment & Recreation | 0 (0.0%) | 44 (100.0%) |
| Accommodation & Food Services | 80 (55.2%) | 65 (44.8%) |
| Public Administration | 19 (44.2%) | 24 (55.8%) |
| Total | 2,803 (56.6%) | 2,152 (43.4%) |
Education in Hillsborough
School Enrollment in Hillsborough
The most common levels of schooling among the 3,572 students in Hillsborough are high school (903 | 25.3%), elementary school (851 | 23.8%), and middle school (808 | 22.6%).
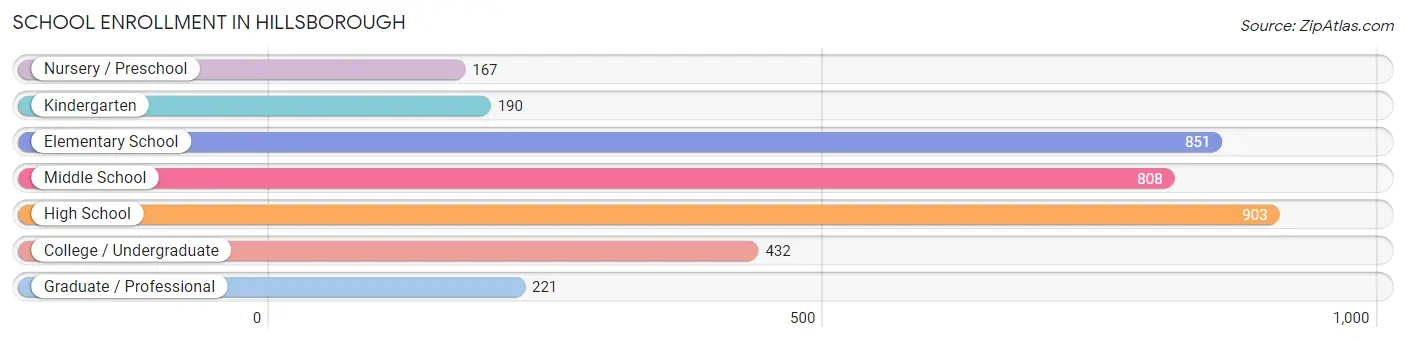
| School Level | # Students | % Students |
| Nursery / Preschool | 167 | 4.7% |
| Kindergarten | 190 | 5.3% |
| Elementary School | 851 | 23.8% |
| Middle School | 808 | 22.6% |
| High School | 903 | 25.3% |
| College / Undergraduate | 432 | 12.1% |
| Graduate / Professional | 221 | 6.2% |
| Total | 3,572 | 100.0% |
School Enrollment by Age by Funding Source in Hillsborough
Out of a total of 3,572 students who are enrolled in schools in Hillsborough, 1,272 (35.6%) attend a private institution, while the remaining 2,300 (64.4%) are enrolled in public schools. The age group of 20 to 24 year olds has the highest likelihood of being enrolled in private schools, with 231 (75.0% in the age bracket) enrolled. Conversely, the age group of 35 years and over has the lowest likelihood of being enrolled in a private school, with 223 (89.9% in the age bracket) attending a public institution.
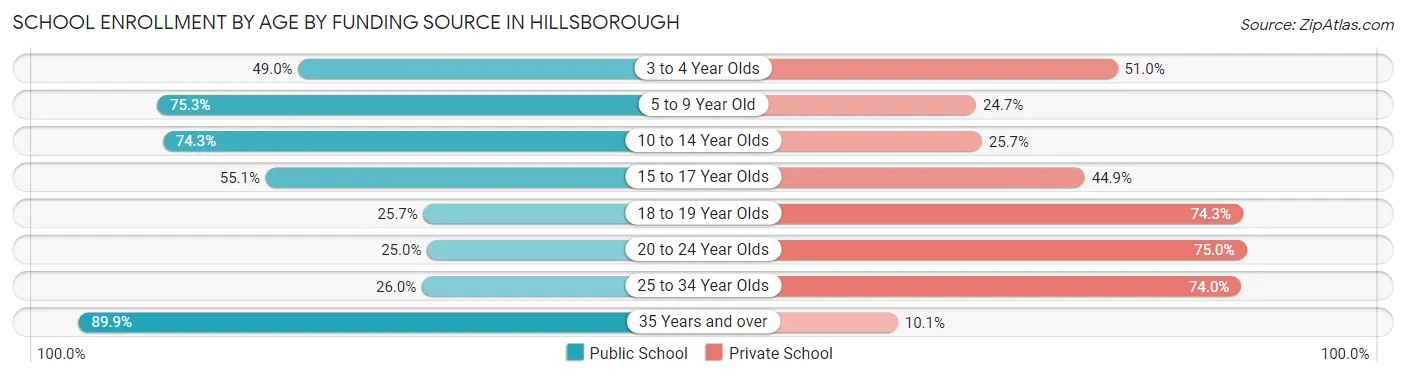
| Age Bracket | Public School | Private School |
| 3 to 4 Year Olds | 49 (49.0%) | 51 (51.0%) |
| 5 to 9 Year Old | 690 (75.3%) | 226 (24.7%) |
| 10 to 14 Year Olds | 880 (74.3%) | 305 (25.7%) |
| 15 to 17 Year Olds | 325 (55.1%) | 265 (44.9%) |
| 18 to 19 Year Olds | 38 (25.7%) | 110 (74.3%) |
| 20 to 24 Year Olds | 77 (25.0%) | 231 (75.0%) |
| 25 to 34 Year Olds | 20 (26.0%) | 57 (74.0%) |
| 35 Years and over | 223 (89.9%) | 25 (10.1%) |
| Total | 2,300 (64.4%) | 1,272 (35.6%) |
Educational Attainment by Field of Study in Hillsborough
Social sciences (1,434 | 21.3%), business (1,325 | 19.7%), engineering (820 | 12.2%), bio, nature & agricultural (683 | 10.1%), and literature & languages (410 | 6.1%) are the most common fields of study among 6,737 individuals in Hillsborough who have obtained a bachelor's degree or higher.
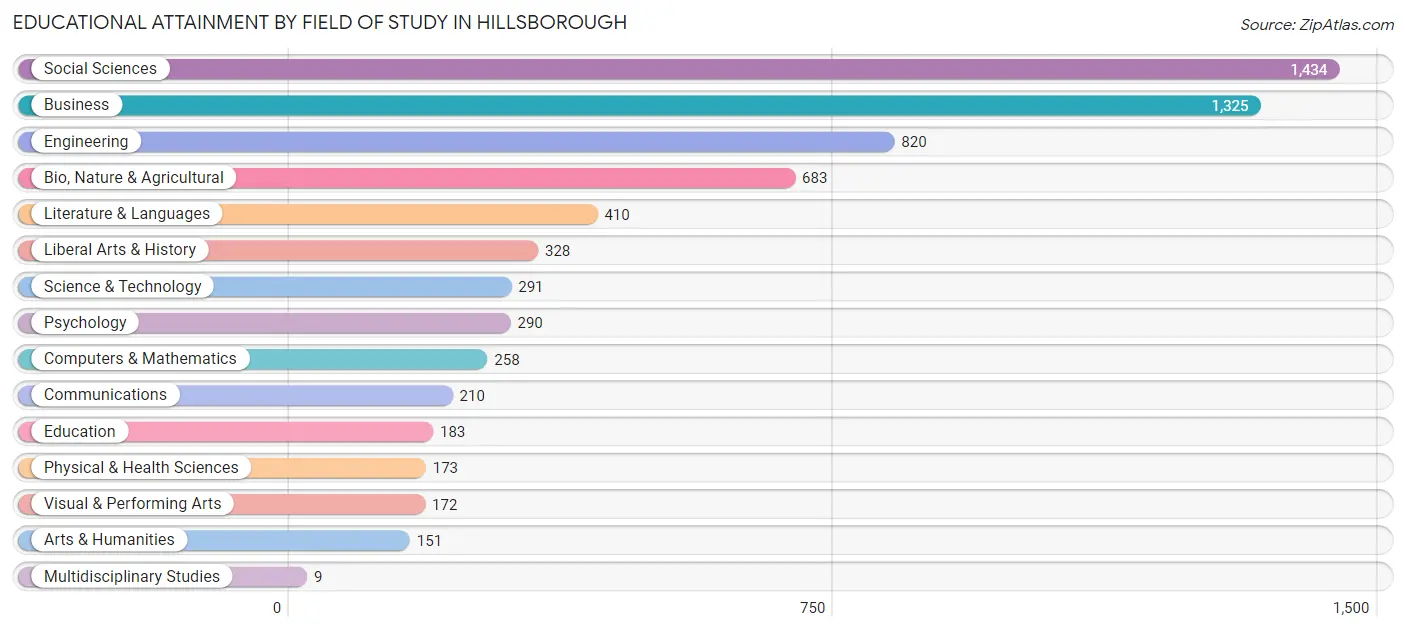
| Field of Study | # Graduates | % Graduates |
| Computers & Mathematics | 258 | 3.8% |
| Bio, Nature & Agricultural | 683 | 10.1% |
| Physical & Health Sciences | 173 | 2.6% |
| Psychology | 290 | 4.3% |
| Social Sciences | 1,434 | 21.3% |
| Engineering | 820 | 12.2% |
| Multidisciplinary Studies | 9 | 0.1% |
| Science & Technology | 291 | 4.3% |
| Business | 1,325 | 19.7% |
| Education | 183 | 2.7% |
| Literature & Languages | 410 | 6.1% |
| Liberal Arts & History | 328 | 4.9% |
| Visual & Performing Arts | 172 | 2.5% |
| Communications | 210 | 3.1% |
| Arts & Humanities | 151 | 2.2% |
| Total | 6,737 | 100.0% |
Transportation & Commute in Hillsborough
Vehicle Availability by Sex in Hillsborough
The most prevalent vehicle ownership categories in Hillsborough are males with 3 vehicles (1,018, accounting for 36.5%) and females with 3 vehicles (814, making up 48.5%).
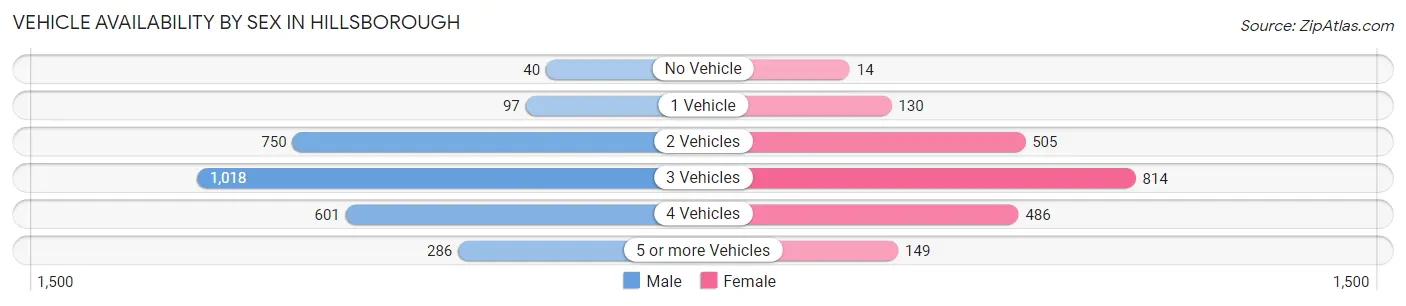
| Vehicles Available | Male | Female |
| No Vehicle | 40 (1.4%) | 14 (0.7%) |
| 1 Vehicle | 97 (3.5%) | 130 (6.2%) |
| 2 Vehicles | 750 (26.9%) | 505 (24.1%) |
| 3 Vehicles | 1,018 (36.5%) | 814 (38.8%) |
| 4 Vehicles | 601 (21.5%) | 486 (23.2%) |
| 5 or more Vehicles | 286 (10.2%) | 149 (7.1%) |
| Total | 2,792 (100.0%) | 2,098 (100.0%) |
Commute Time in Hillsborough
The most frequently occuring commute durations in Hillsborough are 15 to 19 minutes (675 commuters, 19.0%), 30 to 34 minutes (538 commuters, 15.1%), and 10 to 14 minutes (379 commuters, 10.7%).
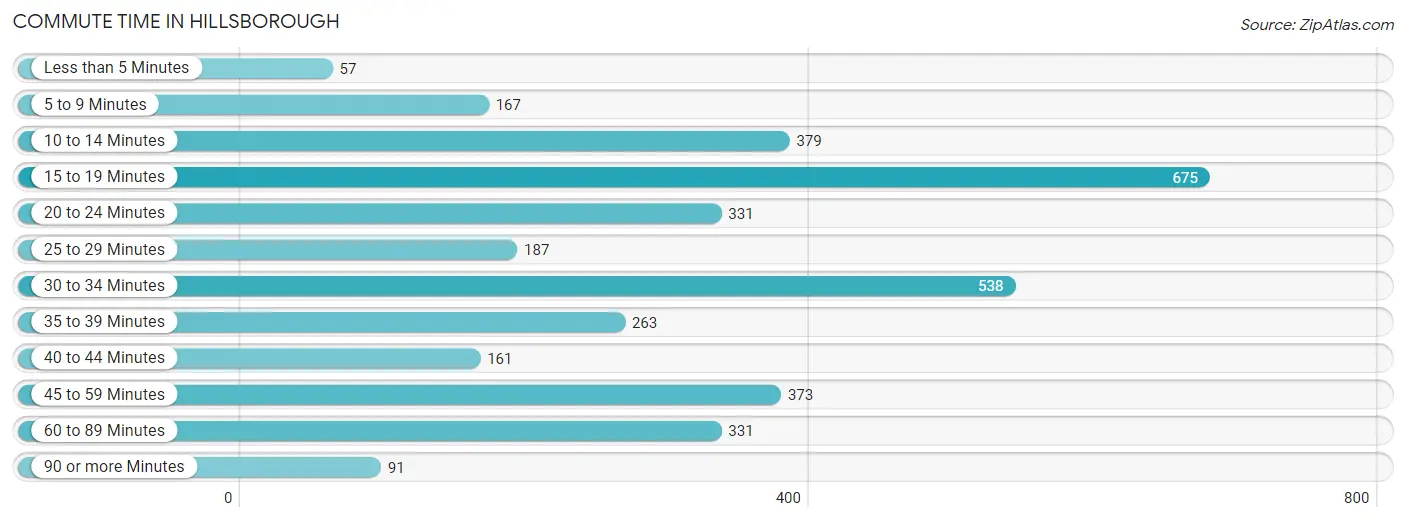
| Commute Time | # Commuters | % Commuters |
| Less than 5 Minutes | 57 | 1.6% |
| 5 to 9 Minutes | 167 | 4.7% |
| 10 to 14 Minutes | 379 | 10.7% |
| 15 to 19 Minutes | 675 | 19.0% |
| 20 to 24 Minutes | 331 | 9.3% |
| 25 to 29 Minutes | 187 | 5.3% |
| 30 to 34 Minutes | 538 | 15.1% |
| 35 to 39 Minutes | 263 | 7.4% |
| 40 to 44 Minutes | 161 | 4.5% |
| 45 to 59 Minutes | 373 | 10.5% |
| 60 to 89 Minutes | 331 | 9.3% |
| 90 or more Minutes | 91 | 2.6% |
Commute Time by Sex in Hillsborough
The most common commute times in Hillsborough are 30 to 34 minutes (365 commuters, 18.2%) for males and 15 to 19 minutes (372 commuters, 24.1%) for females.
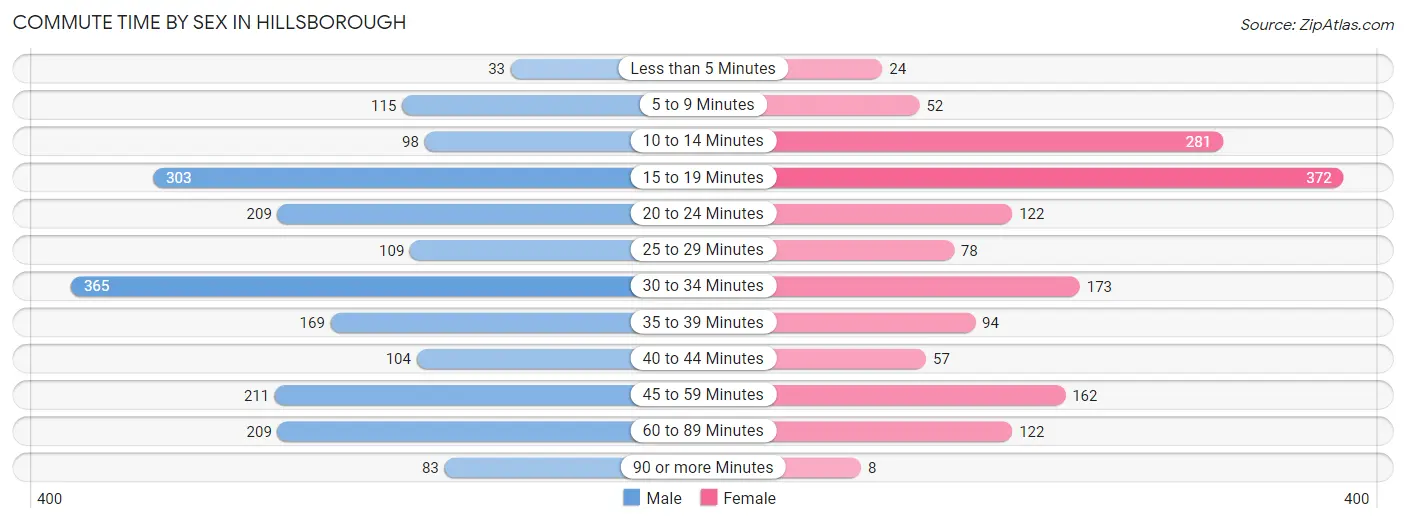
| Commute Time | Male | Female |
| Less than 5 Minutes | 33 (1.6%) | 24 (1.5%) |
| 5 to 9 Minutes | 115 (5.7%) | 52 (3.4%) |
| 10 to 14 Minutes | 98 (4.9%) | 281 (18.2%) |
| 15 to 19 Minutes | 303 (15.1%) | 372 (24.1%) |
| 20 to 24 Minutes | 209 (10.4%) | 122 (7.9%) |
| 25 to 29 Minutes | 109 (5.4%) | 78 (5.1%) |
| 30 to 34 Minutes | 365 (18.2%) | 173 (11.2%) |
| 35 to 39 Minutes | 169 (8.4%) | 94 (6.1%) |
| 40 to 44 Minutes | 104 (5.2%) | 57 (3.7%) |
| 45 to 59 Minutes | 211 (10.5%) | 162 (10.5%) |
| 60 to 89 Minutes | 209 (10.4%) | 122 (7.9%) |
| 90 or more Minutes | 83 (4.1%) | 8 (0.5%) |
Time of Departure to Work by Sex in Hillsborough
The most frequent times of departure to work in Hillsborough are 8:00 AM to 8:29 AM (454, 22.6%) for males and 8:00 AM to 8:29 AM (343, 22.2%) for females.
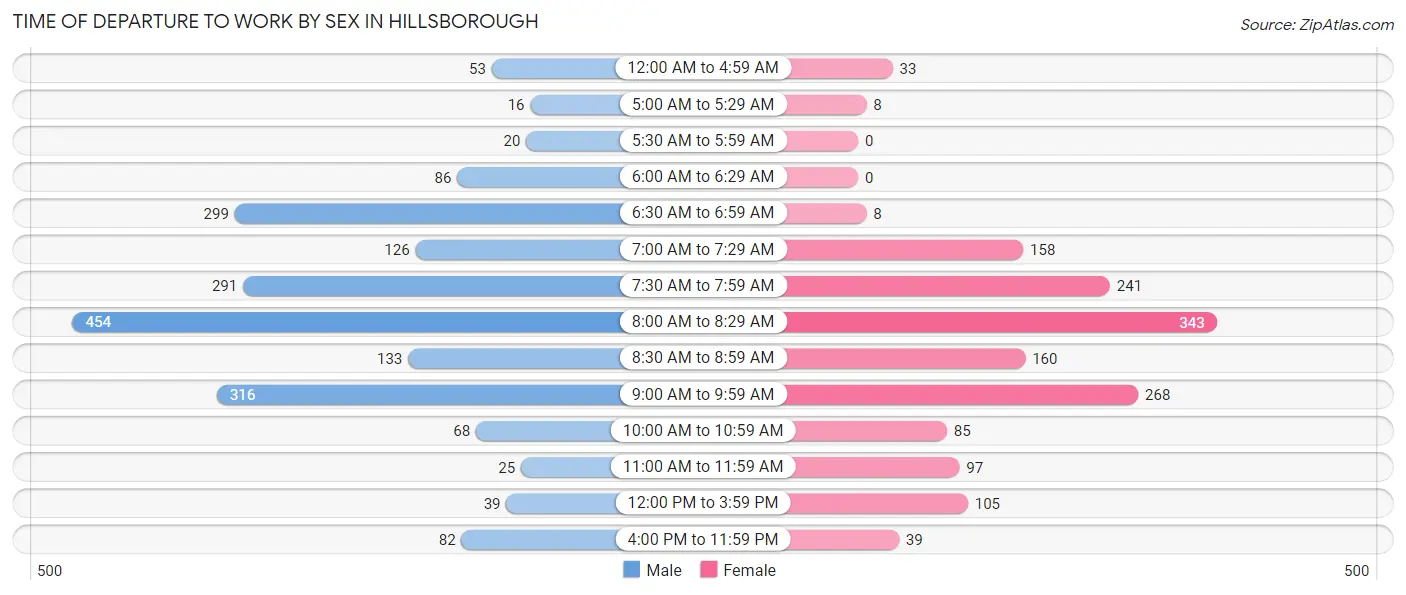
| Time of Departure | Male | Female |
| 12:00 AM to 4:59 AM | 53 (2.6%) | 33 (2.1%) |
| 5:00 AM to 5:29 AM | 16 (0.8%) | 8 (0.5%) |
| 5:30 AM to 5:59 AM | 20 (1.0%) | 0 (0.0%) |
| 6:00 AM to 6:29 AM | 86 (4.3%) | 0 (0.0%) |
| 6:30 AM to 6:59 AM | 299 (14.9%) | 8 (0.5%) |
| 7:00 AM to 7:29 AM | 126 (6.3%) | 158 (10.2%) |
| 7:30 AM to 7:59 AM | 291 (14.5%) | 241 (15.6%) |
| 8:00 AM to 8:29 AM | 454 (22.6%) | 343 (22.2%) |
| 8:30 AM to 8:59 AM | 133 (6.6%) | 160 (10.4%) |
| 9:00 AM to 9:59 AM | 316 (15.7%) | 268 (17.3%) |
| 10:00 AM to 10:59 AM | 68 (3.4%) | 85 (5.5%) |
| 11:00 AM to 11:59 AM | 25 (1.3%) | 97 (6.3%) |
| 12:00 PM to 3:59 PM | 39 (1.9%) | 105 (6.8%) |
| 4:00 PM to 11:59 PM | 82 (4.1%) | 39 (2.5%) |
| Total | 2,008 (100.0%) | 1,545 (100.0%) |
Housing Occupancy in Hillsborough
Occupancy by Ownership in Hillsborough
Of the total 3,483 dwellings in Hillsborough, owner-occupied units account for 3,267 (93.8%), while renter-occupied units make up 216 (6.2%).
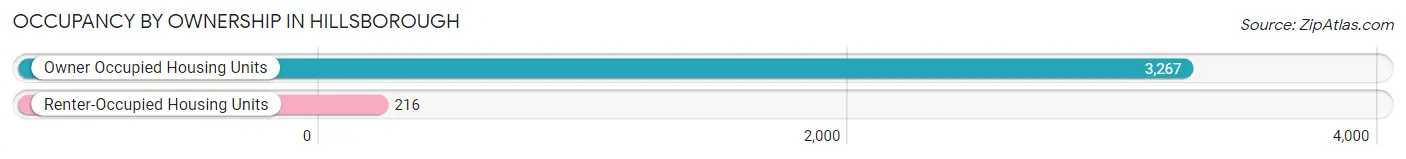
| Occupancy | # Housing Units | % Housing Units |
| Owner Occupied Housing Units | 3,267 | 93.8% |
| Renter-Occupied Housing Units | 216 | 6.2% |
| Total Occupied Housing Units | 3,483 | 100.0% |
Occupancy by Household Size in Hillsborough
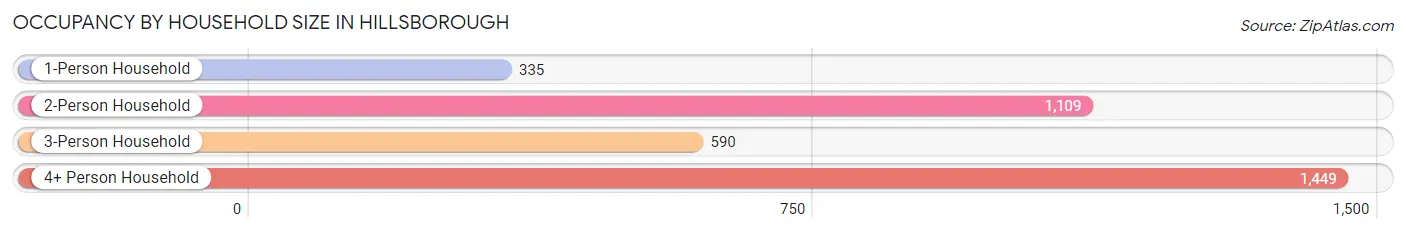
| Household Size | # Housing Units | % Housing Units |
| 1-Person Household | 335 | 9.6% |
| 2-Person Household | 1,109 | 31.8% |
| 3-Person Household | 590 | 16.9% |
| 4+ Person Household | 1,449 | 41.6% |
| Total Housing Units | 3,483 | 100.0% |
Occupancy by Ownership by Household Size in Hillsborough
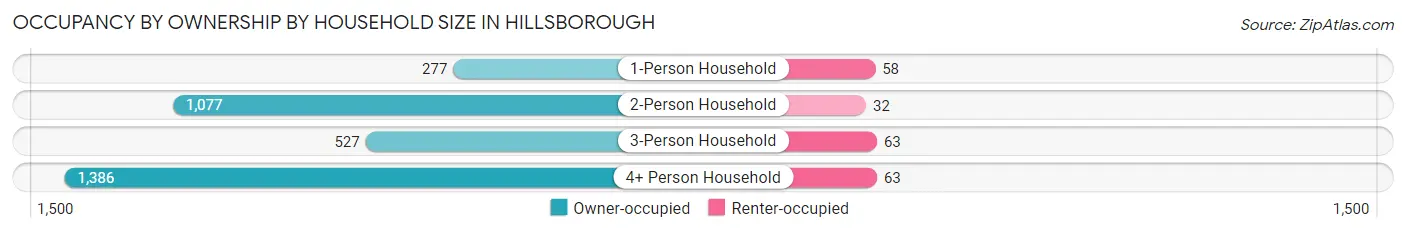
| Household Size | Owner-occupied | Renter-occupied |
| 1-Person Household | 277 (82.7%) | 58 (17.3%) |
| 2-Person Household | 1,077 (97.1%) | 32 (2.9%) |
| 3-Person Household | 527 (89.3%) | 63 (10.7%) |
| 4+ Person Household | 1,386 (95.7%) | 63 (4.3%) |
| Total Housing Units | 3,267 (93.8%) | 216 (6.2%) |
Occupancy by Educational Attainment in Hillsborough
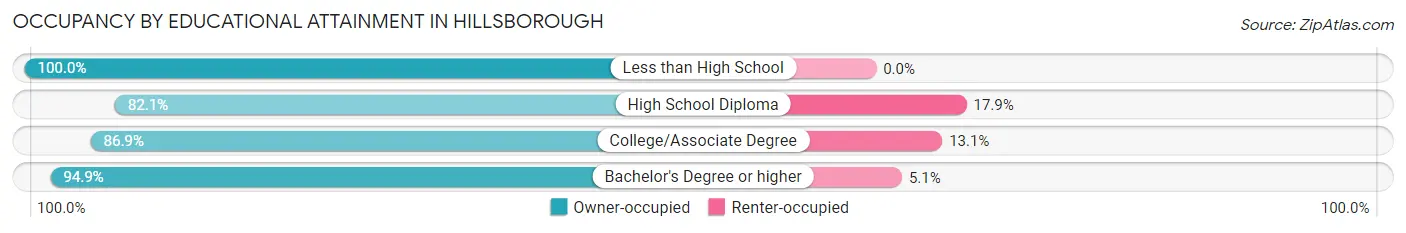
| Household Size | Owner-occupied | Renter-occupied |
| Less than High School | 30 (100.0%) | 0 (0.0%) |
| High School Diploma | 110 (82.1%) | 24 (17.9%) |
| College/Associate Degree | 239 (86.9%) | 36 (13.1%) |
| Bachelor's Degree or higher | 2,888 (94.9%) | 156 (5.1%) |
Occupancy by Age of Householder in Hillsborough
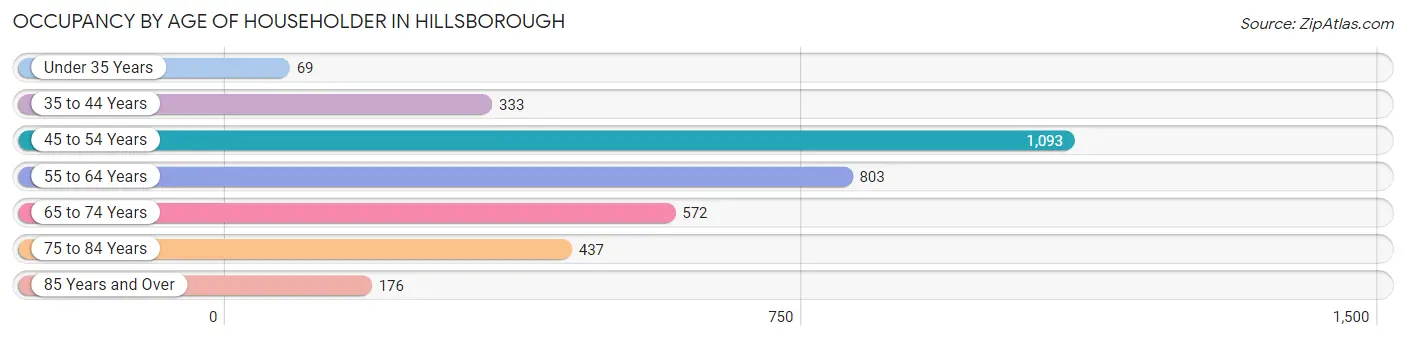
| Age Bracket | # Households | % Households |
| Under 35 Years | 69 | 2.0% |
| 35 to 44 Years | 333 | 9.6% |
| 45 to 54 Years | 1,093 | 31.4% |
| 55 to 64 Years | 803 | 23.1% |
| 65 to 74 Years | 572 | 16.4% |
| 75 to 84 Years | 437 | 12.6% |
| 85 Years and Over | 176 | 5.1% |
| Total | 3,483 | 100.0% |
Housing Finances in Hillsborough
Median Income by Occupancy in Hillsborough
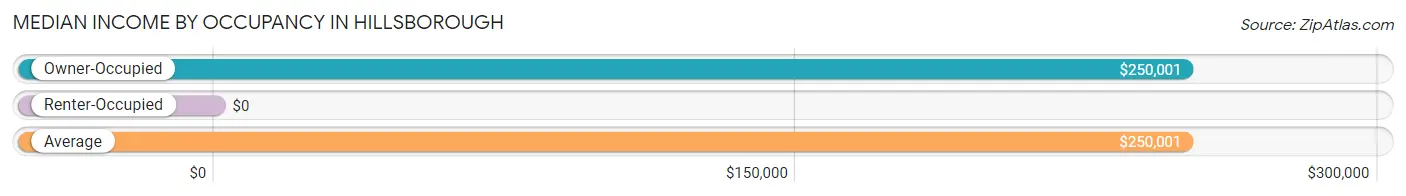
| Occupancy Type | # Households | Median Income |
| Owner-Occupied | 3,267 (93.8%) | $250,001 |
| Renter-Occupied | 216 (6.2%) | $0 |
| Average | 3,483 (100.0%) | $250,001 |
Occupancy by Householder Income Bracket in Hillsborough
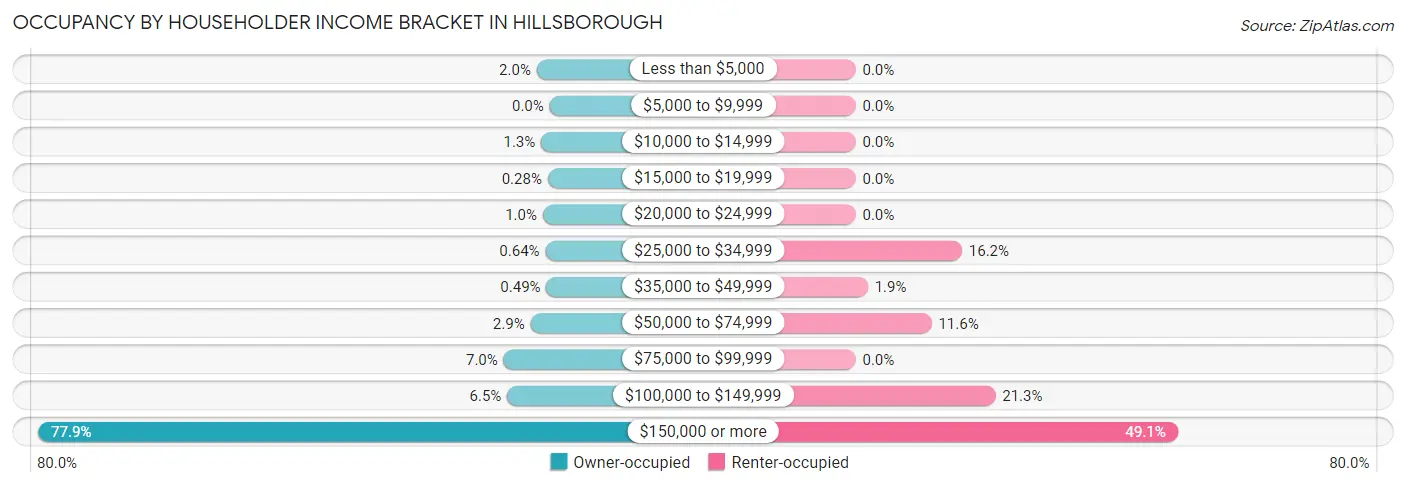
| Income Bracket | Owner-occupied | Renter-occupied |
| Less than $5,000 | 64 (2.0%) | 0 (0.0%) |
| $5,000 to $9,999 | 0 (0.0%) | 0 (0.0%) |
| $10,000 to $14,999 | 42 (1.3%) | 0 (0.0%) |
| $15,000 to $19,999 | 9 (0.3%) | 0 (0.0%) |
| $20,000 to $24,999 | 34 (1.0%) | 0 (0.0%) |
| $25,000 to $34,999 | 21 (0.6%) | 35 (16.2%) |
| $35,000 to $49,999 | 16 (0.5%) | 4 (1.8%) |
| $50,000 to $74,999 | 95 (2.9%) | 25 (11.6%) |
| $75,000 to $99,999 | 229 (7.0%) | 0 (0.0%) |
| $100,000 to $149,999 | 211 (6.5%) | 46 (21.3%) |
| $150,000 or more | 2,546 (77.9%) | 106 (49.1%) |
| Total | 3,267 (100.0%) | 216 (100.0%) |
Monthly Housing Cost Tiers in Hillsborough
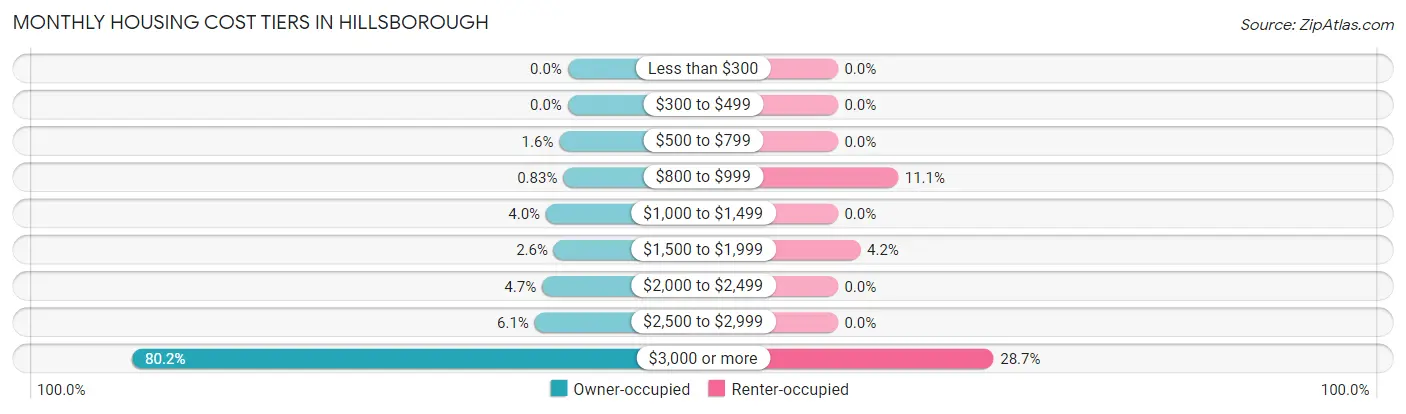
| Monthly Cost | Owner-occupied | Renter-occupied |
| Less than $300 | 0 (0.0%) | 0 (0.0%) |
| $300 to $499 | 0 (0.0%) | 0 (0.0%) |
| $500 to $799 | 51 (1.6%) | 0 (0.0%) |
| $800 to $999 | 27 (0.8%) | 24 (11.1%) |
| $1,000 to $1,499 | 131 (4.0%) | 0 (0.0%) |
| $1,500 to $1,999 | 84 (2.6%) | 9 (4.2%) |
| $2,000 to $2,499 | 155 (4.7%) | 0 (0.0%) |
| $2,500 to $2,999 | 199 (6.1%) | 0 (0.0%) |
| $3,000 or more | 2,620 (80.2%) | 62 (28.7%) |
| Total | 3,267 (100.0%) | 216 (100.0%) |
Physical Housing Characteristics in Hillsborough
Housing Structures in Hillsborough
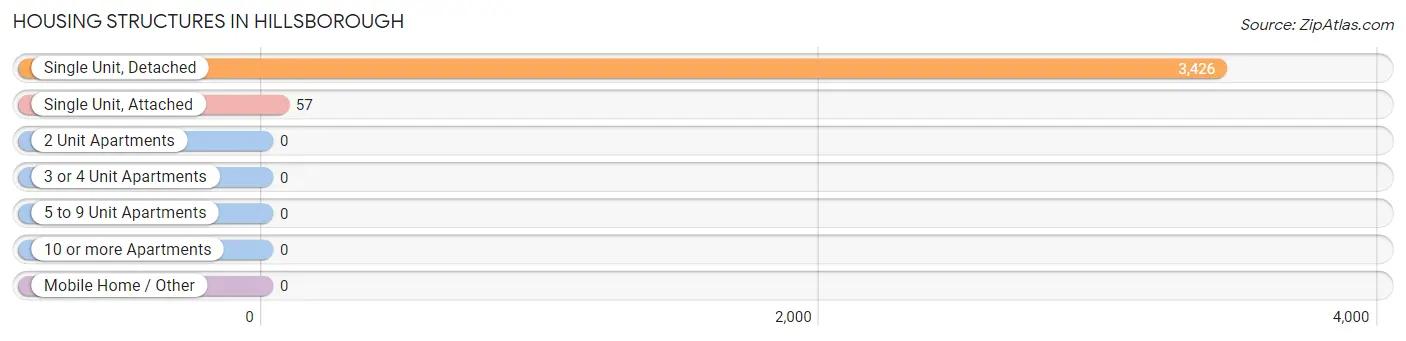
| Structure Type | # Housing Units | % Housing Units |
| Single Unit, Detached | 3,426 | 98.4% |
| Single Unit, Attached | 57 | 1.6% |
| 2 Unit Apartments | 0 | 0.0% |
| 3 or 4 Unit Apartments | 0 | 0.0% |
| 5 to 9 Unit Apartments | 0 | 0.0% |
| 10 or more Apartments | 0 | 0.0% |
| Mobile Home / Other | 0 | 0.0% |
| Total | 3,483 | 100.0% |
Housing Structures by Occupancy in Hillsborough
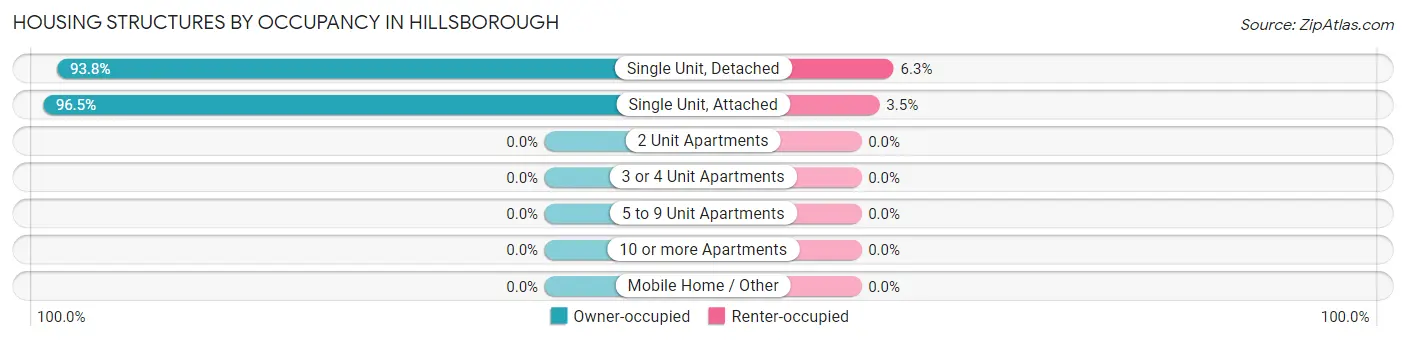
| Structure Type | Owner-occupied | Renter-occupied |
| Single Unit, Detached | 3,212 (93.8%) | 214 (6.2%) |
| Single Unit, Attached | 55 (96.5%) | 2 (3.5%) |
| 2 Unit Apartments | 0 (0.0%) | 0 (0.0%) |
| 3 or 4 Unit Apartments | 0 (0.0%) | 0 (0.0%) |
| 5 to 9 Unit Apartments | 0 (0.0%) | 0 (0.0%) |
| 10 or more Apartments | 0 (0.0%) | 0 (0.0%) |
| Mobile Home / Other | 0 (0.0%) | 0 (0.0%) |
| Total | 3,267 (93.8%) | 216 (6.2%) |
Housing Structures by Number of Rooms in Hillsborough
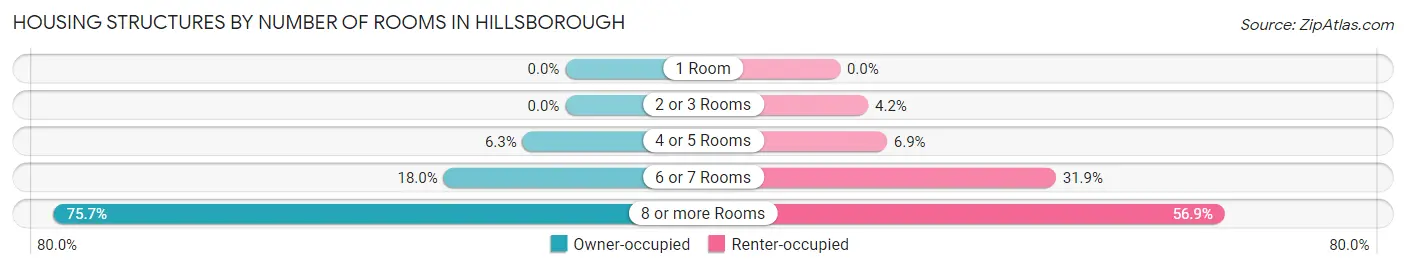
| Number of Rooms | Owner-occupied | Renter-occupied |
| 1 Room | 0 (0.0%) | 0 (0.0%) |
| 2 or 3 Rooms | 0 (0.0%) | 9 (4.2%) |
| 4 or 5 Rooms | 206 (6.3%) | 15 (6.9%) |
| 6 or 7 Rooms | 588 (18.0%) | 69 (31.9%) |
| 8 or more Rooms | 2,473 (75.7%) | 123 (56.9%) |
| Total | 3,267 (100.0%) | 216 (100.0%) |
Housing Structure by Heating Type in Hillsborough
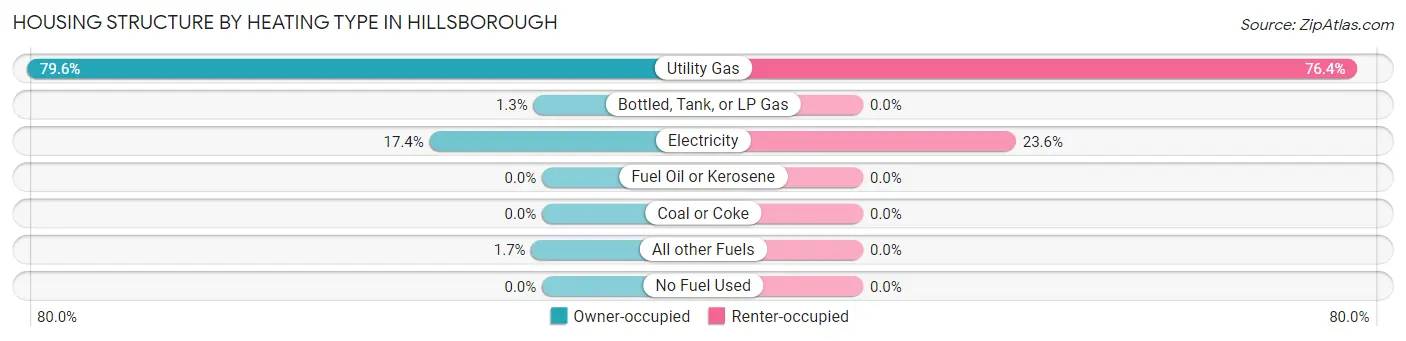
| Heating Type | Owner-occupied | Renter-occupied |
| Utility Gas | 2,602 (79.6%) | 165 (76.4%) |
| Bottled, Tank, or LP Gas | 43 (1.3%) | 0 (0.0%) |
| Electricity | 568 (17.4%) | 51 (23.6%) |
| Fuel Oil or Kerosene | 0 (0.0%) | 0 (0.0%) |
| Coal or Coke | 0 (0.0%) | 0 (0.0%) |
| All other Fuels | 54 (1.7%) | 0 (0.0%) |
| No Fuel Used | 0 (0.0%) | 0 (0.0%) |
| Total | 3,267 (100.0%) | 216 (100.0%) |
Household Vehicle Usage in Hillsborough
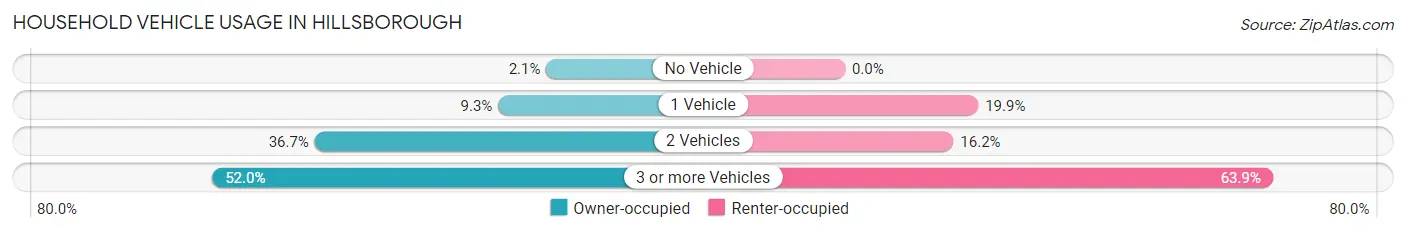
| Vehicles per Household | Owner-occupied | Renter-occupied |
| No Vehicle | 68 (2.1%) | 0 (0.0%) |
| 1 Vehicle | 303 (9.3%) | 43 (19.9%) |
| 2 Vehicles | 1,198 (36.7%) | 35 (16.2%) |
| 3 or more Vehicles | 1,698 (52.0%) | 138 (63.9%) |
| Total | 3,267 (100.0%) | 216 (100.0%) |
Real Estate & Mortgages in Hillsborough
Real Estate and Mortgage Overview in Hillsborough
| Characteristic | Without Mortgage | With Mortgage |
| Housing Units | 1,118 | 2,149 |
| Median Property Value | $2,000,001 | $2,000,001 |
| Median Household Income | $250,001 | $1,734 |
| Monthly Housing Costs | $1,501 | $2,047 |
| Real Estate Taxes | $10,001 | $11 |
Property Value by Mortgage Status in Hillsborough
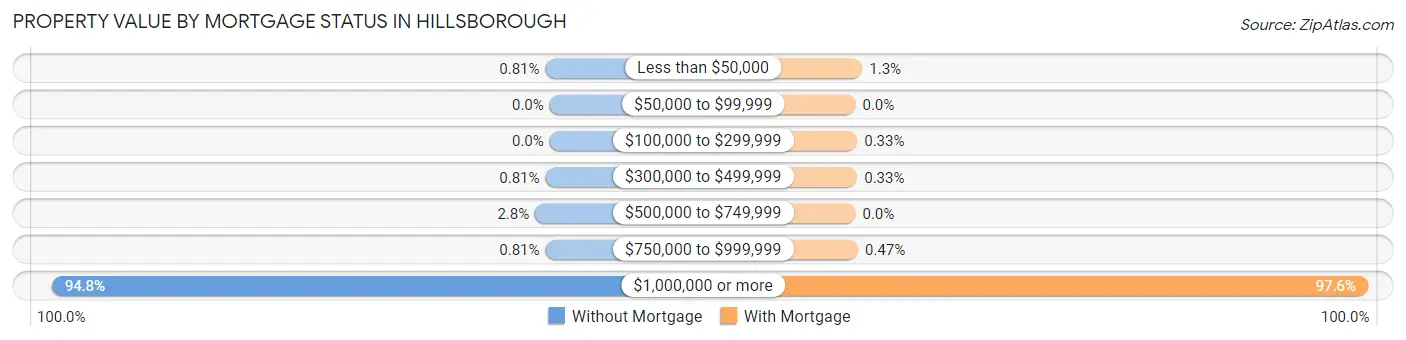
| Property Value | Without Mortgage | With Mortgage |
| Less than $50,000 | 9 (0.8%) | 28 (1.3%) |
| $50,000 to $99,999 | 0 (0.0%) | 0 (0.0%) |
| $100,000 to $299,999 | 0 (0.0%) | 7 (0.3%) |
| $300,000 to $499,999 | 9 (0.8%) | 7 (0.3%) |
| $500,000 to $749,999 | 31 (2.8%) | 0 (0.0%) |
| $750,000 to $999,999 | 9 (0.8%) | 10 (0.5%) |
| $1,000,000 or more | 1,060 (94.8%) | 2,097 (97.6%) |
| Total | 1,118 (100.0%) | 2,149 (100.0%) |
Household Income by Mortgage Status in Hillsborough
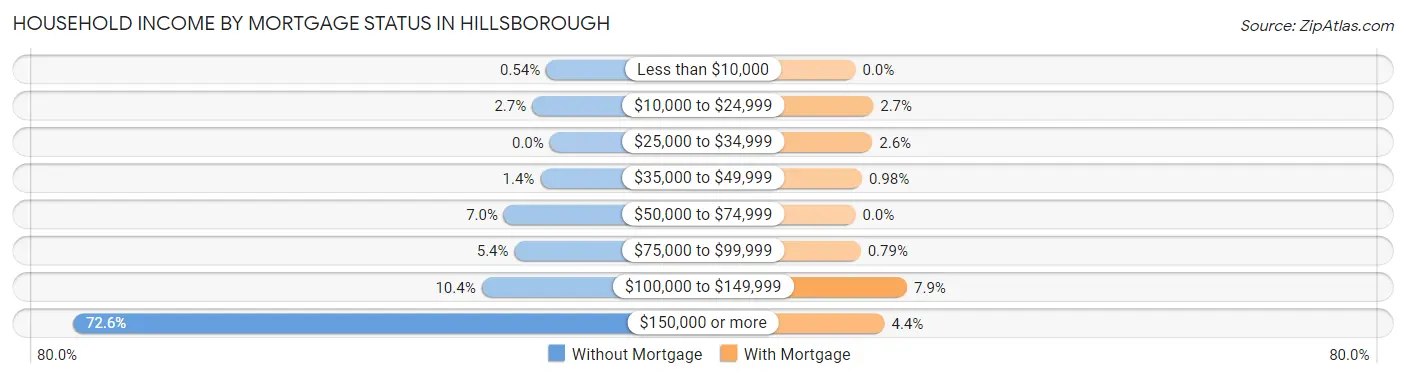
| Household Income | Without Mortgage | With Mortgage |
| Less than $10,000 | 6 (0.5%) | 0 (0.0%) |
| $10,000 to $24,999 | 30 (2.7%) | 58 (2.7%) |
| $25,000 to $34,999 | 0 (0.0%) | 55 (2.6%) |
| $35,000 to $49,999 | 16 (1.4%) | 21 (1.0%) |
| $50,000 to $74,999 | 78 (7.0%) | 0 (0.0%) |
| $75,000 to $99,999 | 60 (5.4%) | 17 (0.8%) |
| $100,000 to $149,999 | 116 (10.4%) | 169 (7.9%) |
| $150,000 or more | 812 (72.6%) | 95 (4.4%) |
| Total | 1,118 (100.0%) | 2,149 (100.0%) |
Property Value to Household Income Ratio in Hillsborough
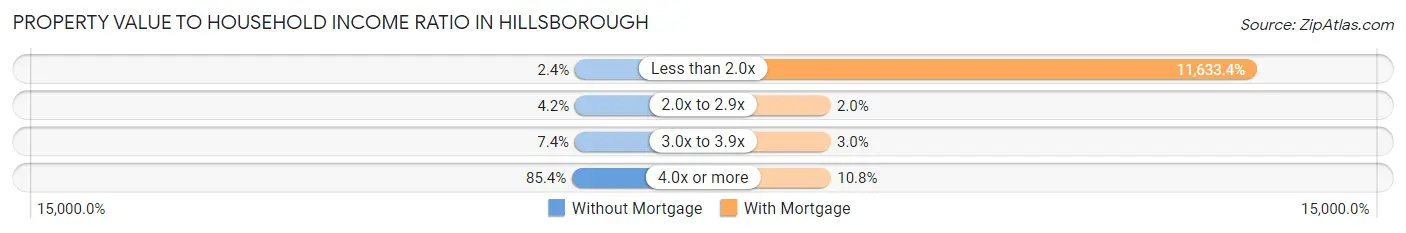
| Value-to-Income Ratio | Without Mortgage | With Mortgage |
| Less than 2.0x | 27 (2.4%) | 250,001 (11,633.4%) |
| 2.0x to 2.9x | 47 (4.2%) | 42 (1.9%) |
| 3.0x to 3.9x | 83 (7.4%) | 65 (3.0%) |
| 4.0x or more | 955 (85.4%) | 232 (10.8%) |
| Total | 1,118 (100.0%) | 2,149 (100.0%) |
Real Estate Taxes by Mortgage Status in Hillsborough
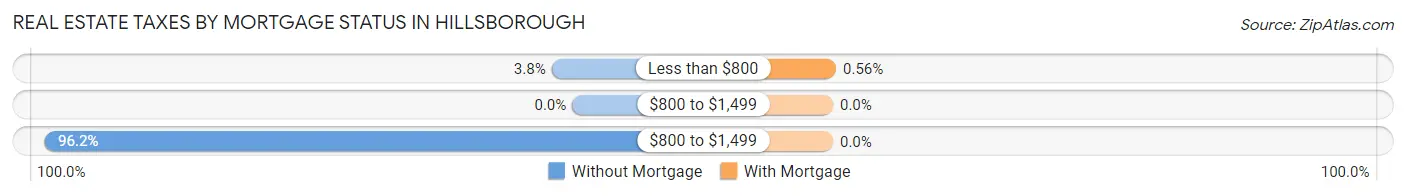
| Property Taxes | Without Mortgage | With Mortgage |
| Less than $800 | 42 (3.8%) | 12 (0.6%) |
| $800 to $1,499 | 0 (0.0%) | 0 (0.0%) |
| $800 to $1,499 | 1,076 (96.2%) | 0 (0.0%) |
| Total | 1,118 (100.0%) | 2,149 (100.0%) |
Health & Disability in Hillsborough
Health Insurance Coverage by Age in Hillsborough
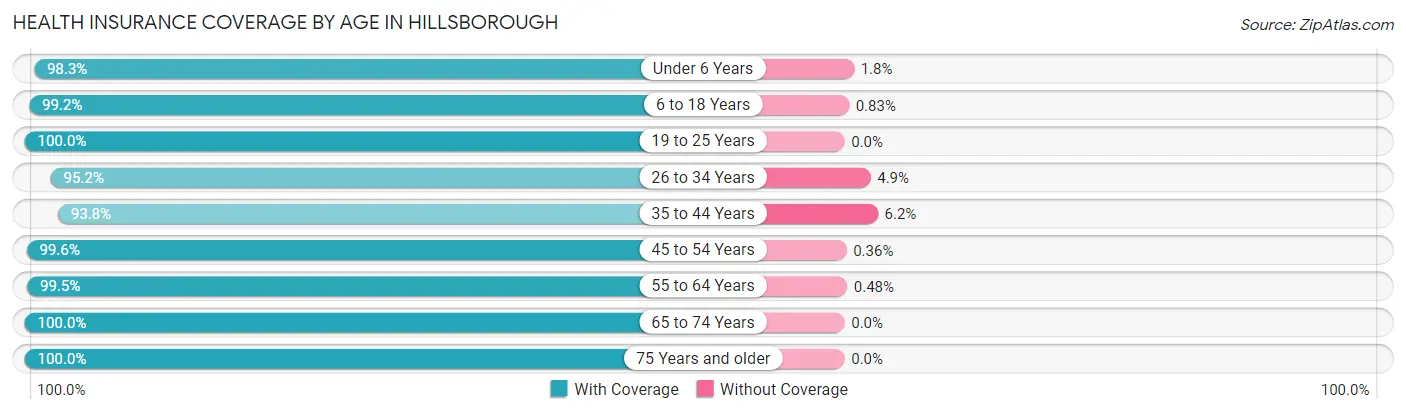
| Age Bracket | With Coverage | Without Coverage |
| Under 6 Years | 563 (98.3%) | 10 (1.8%) |
| 6 to 18 Years | 2,624 (99.2%) | 22 (0.8%) |
| 19 to 25 Years | 607 (100.0%) | 0 (0.0%) |
| 26 to 34 Years | 392 (95.2%) | 20 (4.9%) |
| 35 to 44 Years | 1,058 (93.8%) | 70 (6.2%) |
| 45 to 54 Years | 1,962 (99.6%) | 7 (0.4%) |
| 55 to 64 Years | 1,652 (99.5%) | 8 (0.5%) |
| 65 to 74 Years | 1,139 (100.0%) | 0 (0.0%) |
| 75 Years and older | 1,124 (100.0%) | 0 (0.0%) |
| Total | 11,121 (98.8%) | 137 (1.2%) |
Health Insurance Coverage by Citizenship Status in Hillsborough
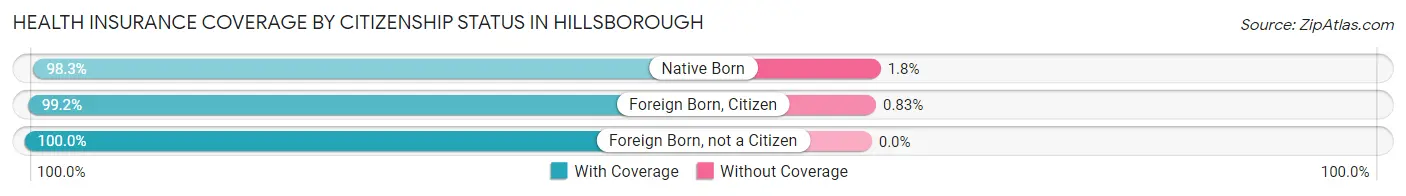
| Citizenship Status | With Coverage | Without Coverage |
| Native Born | 563 (98.3%) | 10 (1.8%) |
| Foreign Born, Citizen | 2,624 (99.2%) | 22 (0.8%) |
| Foreign Born, not a Citizen | 607 (100.0%) | 0 (0.0%) |
Health Insurance Coverage by Household Income in Hillsborough
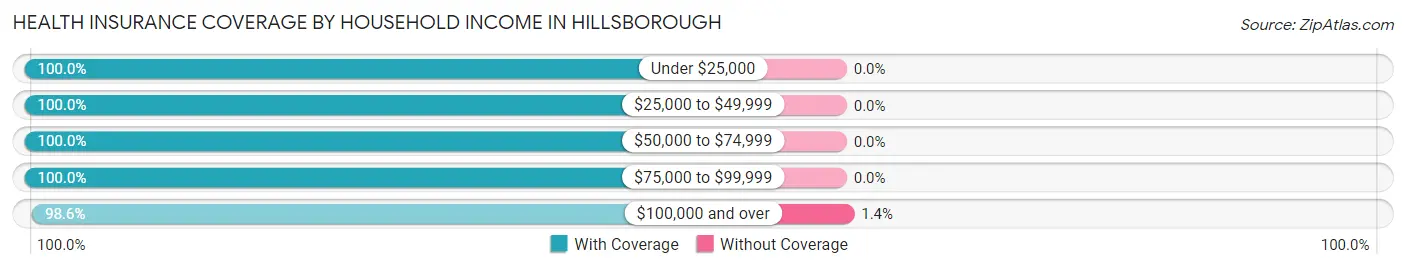
| Household Income | With Coverage | Without Coverage |
| Under $25,000 | 414 (100.0%) | 0 (0.0%) |
| $25,000 to $49,999 | 152 (100.0%) | 0 (0.0%) |
| $50,000 to $74,999 | 310 (100.0%) | 0 (0.0%) |
| $75,000 to $99,999 | 602 (100.0%) | 0 (0.0%) |
| $100,000 and over | 9,637 (98.6%) | 137 (1.4%) |
Public vs Private Health Insurance Coverage by Age in Hillsborough
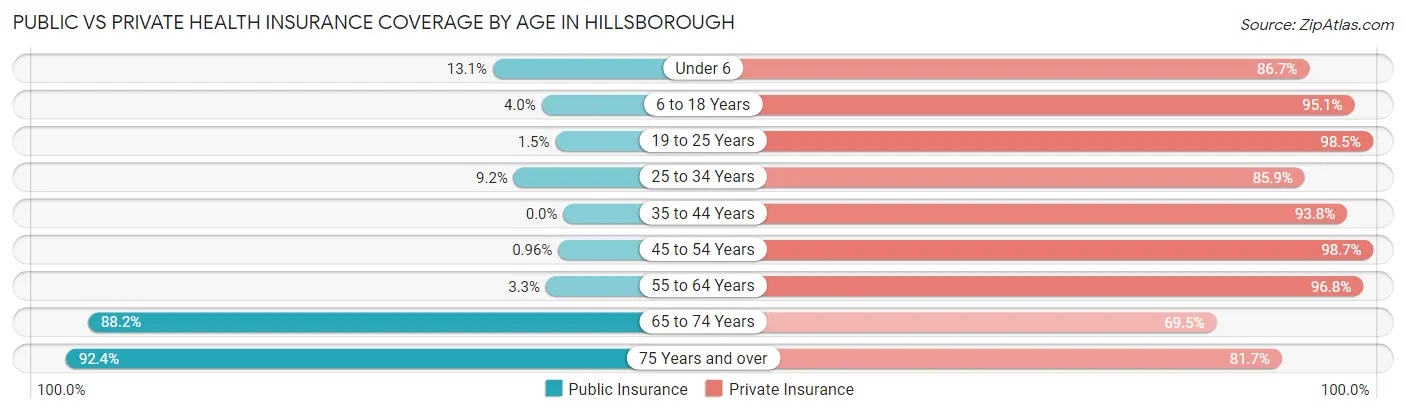
| Age Bracket | Public Insurance | Private Insurance |
| Under 6 | 75 (13.1%) | 497 (86.7%) |
| 6 to 18 Years | 107 (4.0%) | 2,517 (95.1%) |
| 19 to 25 Years | 9 (1.5%) | 598 (98.5%) |
| 25 to 34 Years | 38 (9.2%) | 354 (85.9%) |
| 35 to 44 Years | 0 (0.0%) | 1,058 (93.8%) |
| 45 to 54 Years | 19 (1.0%) | 1,943 (98.7%) |
| 55 to 64 Years | 54 (3.3%) | 1,606 (96.8%) |
| 65 to 74 Years | 1,005 (88.2%) | 792 (69.5%) |
| 75 Years and over | 1,038 (92.3%) | 918 (81.7%) |
| Total | 2,345 (20.8%) | 10,283 (91.3%) |
Disability Status by Sex by Age in Hillsborough
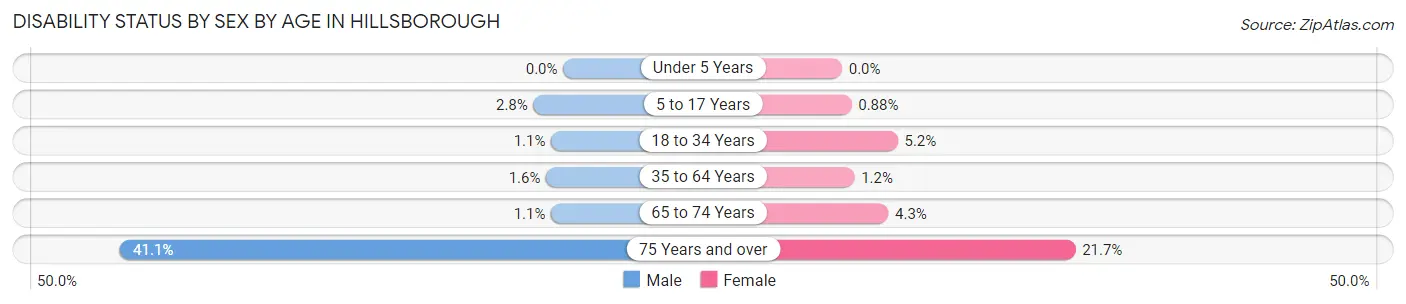
| Age Bracket | Male | Female |
| Under 5 Years | 0 (0.0%) | 0 (0.0%) |
| 5 to 17 Years | 40 (2.8%) | 11 (0.9%) |
| 18 to 34 Years | 6 (1.1%) | 31 (5.2%) |
| 35 to 64 Years | 38 (1.6%) | 27 (1.1%) |
| 65 to 74 Years | 6 (1.1%) | 26 (4.3%) |
| 75 Years and over | 225 (41.1%) | 125 (21.7%) |
Disability Class by Sex by Age in Hillsborough
Disability Class: Hearing Difficulty
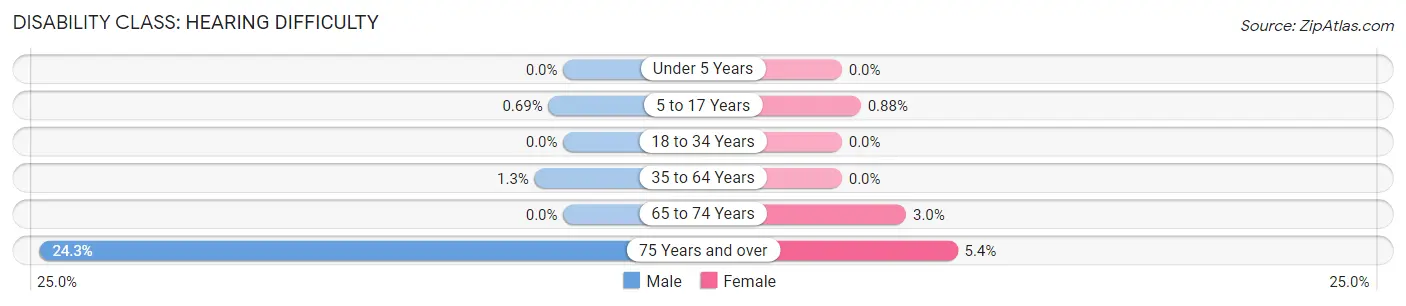
| Age Bracket | Male | Female |
| Under 5 Years | 0 (0.0%) | 0 (0.0%) |
| 5 to 17 Years | 10 (0.7%) | 11 (0.9%) |
| 18 to 34 Years | 0 (0.0%) | 0 (0.0%) |
| 35 to 64 Years | 32 (1.3%) | 0 (0.0%) |
| 65 to 74 Years | 0 (0.0%) | 18 (3.0%) |
| 75 Years and over | 133 (24.3%) | 31 (5.4%) |
Disability Class: Vision Difficulty
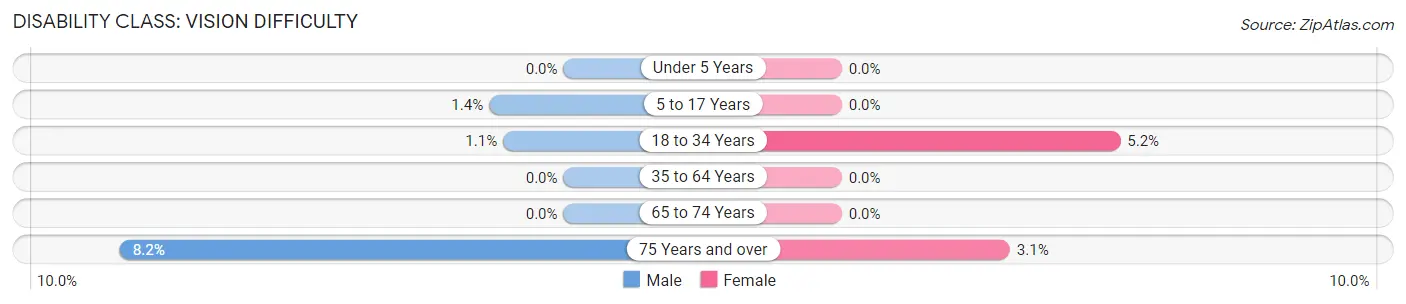
| Age Bracket | Male | Female |
| Under 5 Years | 0 (0.0%) | 0 (0.0%) |
| 5 to 17 Years | 20 (1.4%) | 0 (0.0%) |
| 18 to 34 Years | 6 (1.1%) | 31 (5.2%) |
| 35 to 64 Years | 0 (0.0%) | 0 (0.0%) |
| 65 to 74 Years | 0 (0.0%) | 0 (0.0%) |
| 75 Years and over | 45 (8.2%) | 18 (3.1%) |
Disability Class: Cognitive Difficulty
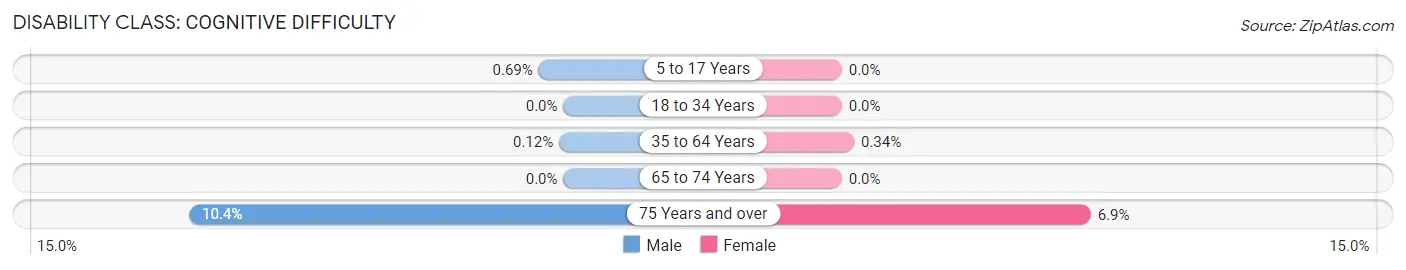
| Age Bracket | Male | Female |
| 5 to 17 Years | 10 (0.7%) | 0 (0.0%) |
| 18 to 34 Years | 0 (0.0%) | 0 (0.0%) |
| 35 to 64 Years | 3 (0.1%) | 8 (0.3%) |
| 65 to 74 Years | 0 (0.0%) | 0 (0.0%) |
| 75 Years and over | 57 (10.4%) | 40 (6.9%) |
Disability Class: Ambulatory Difficulty
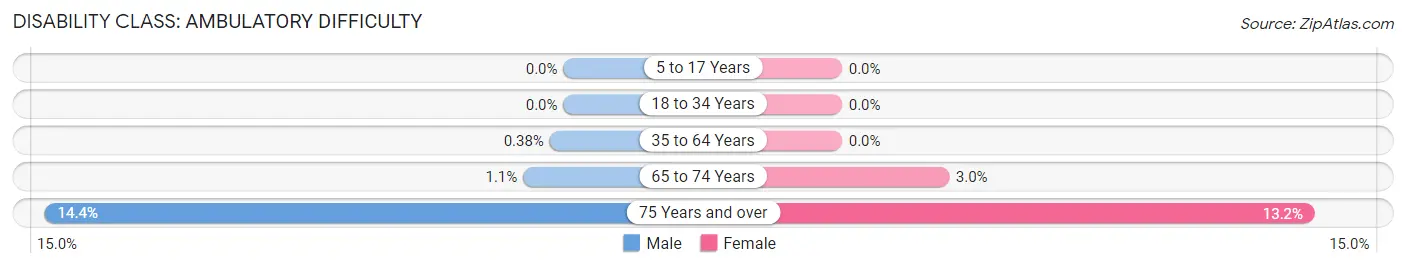
| Age Bracket | Male | Female |
| 5 to 17 Years | 0 (0.0%) | 0 (0.0%) |
| 18 to 34 Years | 0 (0.0%) | 0 (0.0%) |
| 35 to 64 Years | 9 (0.4%) | 0 (0.0%) |
| 65 to 74 Years | 6 (1.1%) | 18 (3.0%) |
| 75 Years and over | 79 (14.4%) | 76 (13.2%) |
Disability Class: Self-Care Difficulty
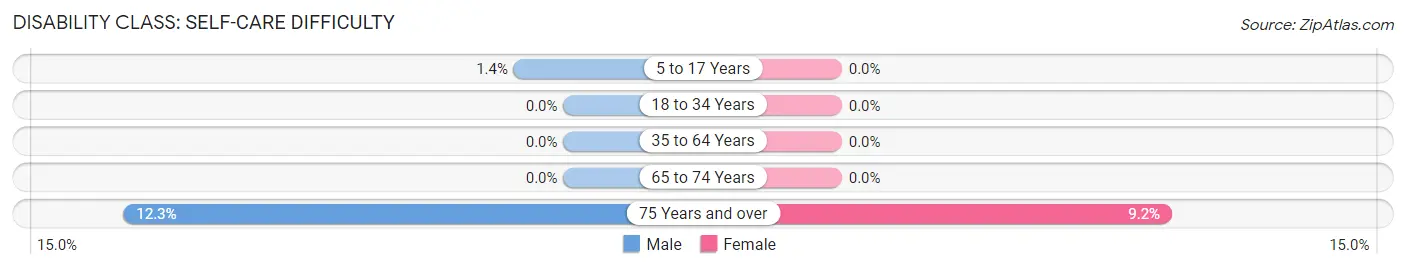
| Age Bracket | Male | Female |
| 5 to 17 Years | 20 (1.4%) | 0 (0.0%) |
| 18 to 34 Years | 0 (0.0%) | 0 (0.0%) |
| 35 to 64 Years | 0 (0.0%) | 0 (0.0%) |
| 65 to 74 Years | 0 (0.0%) | 0 (0.0%) |
| 75 Years and over | 67 (12.2%) | 53 (9.2%) |
Technology Access in Hillsborough
Computing Device Access in Hillsborough
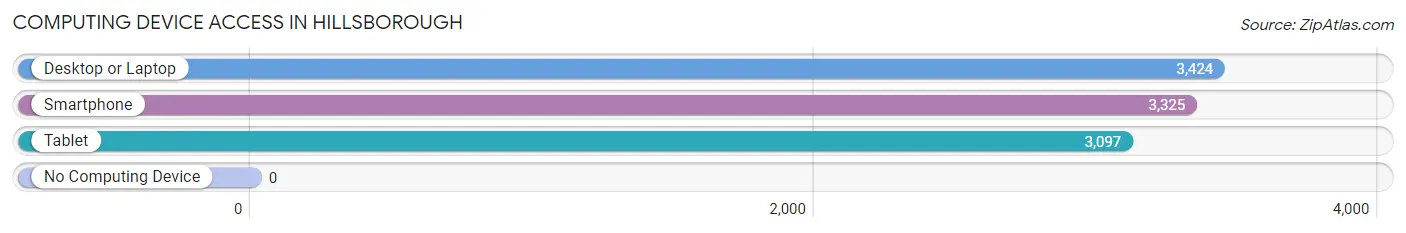
| Device Type | # Households | % Households |
| Desktop or Laptop | 3,424 | 98.3% |
| Smartphone | 3,325 | 95.5% |
| Tablet | 3,097 | 88.9% |
| No Computing Device | 0 | 0.0% |
| Total | 3,483 | 100.0% |
Internet Access in Hillsborough
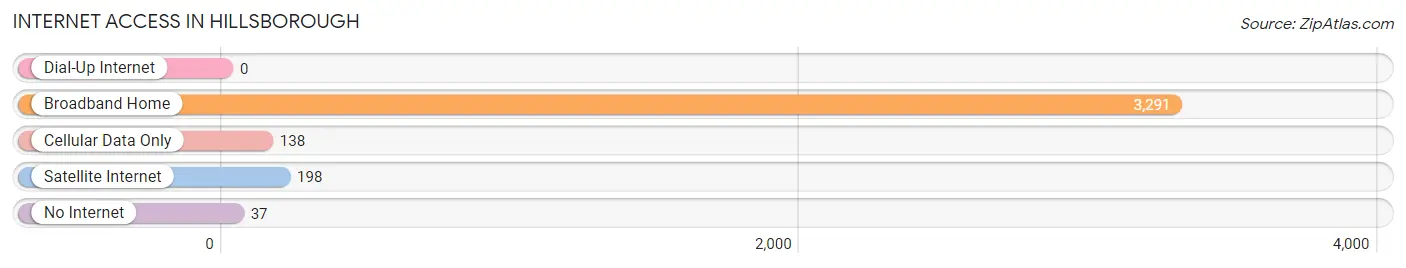
| Internet Type | # Households | % Households |
| Dial-Up Internet | 0 | 0.0% |
| Broadband Home | 3,291 | 94.5% |
| Cellular Data Only | 138 | 4.0% |
| Satellite Internet | 198 | 5.7% |
| No Internet | 37 | 1.1% |
| Total | 3,483 | 100.0% |
Hillsborough Summary
Hillsborough is a small town located in San Mateo County, California, United States. It is situated on the San Francisco Peninsula, about 20 miles south of San Francisco and about 30 miles north of San Jose. The town has a population of approximately 11,000 people and is known for its affluent and exclusive residential neighborhoods.
Geography
Hillsborough is located in the San Francisco Bay Area, in the San Francisco Peninsula. It is bordered by Burlingame to the north, San Mateo to the east, and San Carlos to the south. The town is situated on a plateau, with an elevation of about 500 feet above sea level. The town is surrounded by hills and valleys, with the highest point being the summit of Crystal Springs Mountain, at 1,878 feet. The town is located in a temperate climate, with mild winters and warm summers.
Economy
Hillsborough is a wealthy town, with a median household income of $200,000. The town is home to many affluent and exclusive residential neighborhoods, and is known for its high property values. The town is also home to several corporate headquarters, including Oracle Corporation, Visa, and Charles Schwab. The town is also home to several shopping centers, including Hillsborough Village and Hillsborough Square.
Demographics
As of the 2010 census, Hillsborough had a population of 11,087 people. The racial makeup of the town was 79.2% White, 0.9% African American, 0.2% Native American, 14.3% Asian, 0.1% Pacific Islander, 2.2% from other races, and 3.2% from two or more races. Hispanic or Latino of any race were 6.2% of the population.
The median age in Hillsborough was 44.2 years. About 24.2% of residents were under the age of 18, and 8.2% were 65 years of age or older. The gender makeup of the town was 48.7% male and 51.3% female.
History
Hillsborough was founded in 1846 by William Davis Merry Howard, a wealthy landowner from New England. The town was named after his ancestral home in England. The town was incorporated in 1910, and has since become a wealthy and exclusive residential community. The town is known for its large estates and mansions, and is home to many prominent business and political figures.
Conclusion
Hillsborough is a small town located in San Mateo County, California, United States. It is situated on the San Francisco Peninsula, about 20 miles south of San Francisco and about 30 miles north of San Jose. The town has a population of approximately 11,000 people and is known for its affluent and exclusive residential neighborhoods. The town is located in a temperate climate, with mild winters and warm summers. Hillsborough is a wealthy town, with a median household income of $200,000. The town is home to many corporate headquarters, shopping centers, and affluent residential neighborhoods. As of the 2010 census, Hillsborough had a population of 11,087 people. The town was founded in 1846 by William Davis Merry Howard, and has since become a wealthy and exclusive residential community.
Common Questions
What is Per Capita Income in Hillsborough?
Per Capita income in Hillsborough is $168,494.
What is the Median Family Income in Hillsborough?
Median Family Income in Hillsborough is $250,001.
What is the Median Household income in Hillsborough?
Median Household Income in Hillsborough is $250,001.
What is Income or Wage Gap in Hillsborough?
Income or Wage Gap in Hillsborough is 66.0%.
Women in Hillsborough earn 34.0 cents for every dollar earned by a man.
What is Inequality or Gini Index in Hillsborough?
Inequality or Gini Index in Hillsborough is 0.49.
What is the Total Population of Hillsborough?
Total Population of Hillsborough is 11,258.
What is the Total Male Population of Hillsborough?
Total Male Population of Hillsborough is 5,738.
What is the Total Female Population of Hillsborough?
Total Female Population of Hillsborough is 5,520.
What is the Ratio of Males per 100 Females in Hillsborough?
There are 103.95 Males per 100 Females in Hillsborough.
What is the Ratio of Females per 100 Males in Hillsborough?
There are 96.20 Females per 100 Males in Hillsborough.
What is the Median Population Age in Hillsborough?
Median Population Age in Hillsborough is 46.5 Years.
What is the Average Family Size in Hillsborough
Average Family Size in Hillsborough is 3.4 People.
What is the Average Household Size in Hillsborough
Average Household Size in Hillsborough is 3.2 People.
How Large is the Labor Force in Hillsborough?
There are 5,233 People in the Labor Forcein in Hillsborough.
What is the Percentage of People in the Labor Force in Hillsborough?
61.2% of People are in the Labor Force in Hillsborough.
What is the Unemployment Rate in Hillsborough?
Unemployment Rate in Hillsborough is 5.4%.