Santa Ynez, CA Map & Demographics
Santa Ynez Map
Santa Ynez Overview
$67,300
PER CAPITA INCOME
$176,833
AVG FAMILY INCOME
$144,792
AVG HOUSEHOLD INCOME
64.9%
WAGE / INCOME GAP [ % ]
35.1¢/ $1
WAGE / INCOME GAP [ $ ]
0.47
INEQUALITY / GINI INDEX
4,716
TOTAL POPULATION
2,378
MALE POPULATION
2,338
FEMALE POPULATION
101.71
MALES / 100 FEMALES
98.32
FEMALES / 100 MALES
47.0
MEDIAN AGE
3.0
AVG FAMILY SIZE
2.6
AVG HOUSEHOLD SIZE
2,276
LABOR FORCE [ PEOPLE ]
58.3%
PERCENT IN LABOR FORCE
0.7%
UNEMPLOYMENT RATE
Santa Ynez Zip Codes
Santa Ynez Area Codes
Income in Santa Ynez
Income Overview in Santa Ynez
Per Capita Income in Santa Ynez is $67,300, while median incomes of families and households are $176,833 and $144,792 respectively.
| Characteristic | Number | Measure |
| Per Capita Income | 4,716 | $67,300 |
| Median Family Income | 1,250 | $176,833 |
| Mean Family Income | 1,250 | $209,280 |
| Median Household Income | 1,829 | $144,792 |
| Mean Household Income | 1,829 | $173,147 |
| Income Deficit | 1,250 | $0 |
| Wage / Income Gap (%) | 4,716 | 64.88% |
| Wage / Income Gap ($) | 4,716 | 35.12¢ per $1 |
| Gini / Inequality Index | 4,716 | 0.47 |
Earnings by Sex in Santa Ynez
Average Earnings in Santa Ynez are $58,750, $77,946 for men and $27,375 for women, a difference of 64.9%.
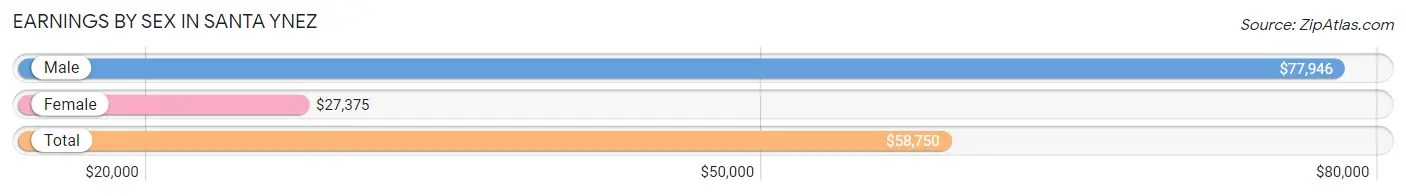
| Sex | Number | Average Earnings |
| Male | 1,457 (57.0%) | $77,946 |
| Female | 1,099 (43.0%) | $27,375 |
| Total | 2,556 (100.0%) | $58,750 |
Earnings by Sex by Income Bracket in Santa Ynez
The most common earnings brackets in Santa Ynez are $100,000+ for men (600 | 41.2%) and $100,000+ for women (277 | 25.2%).
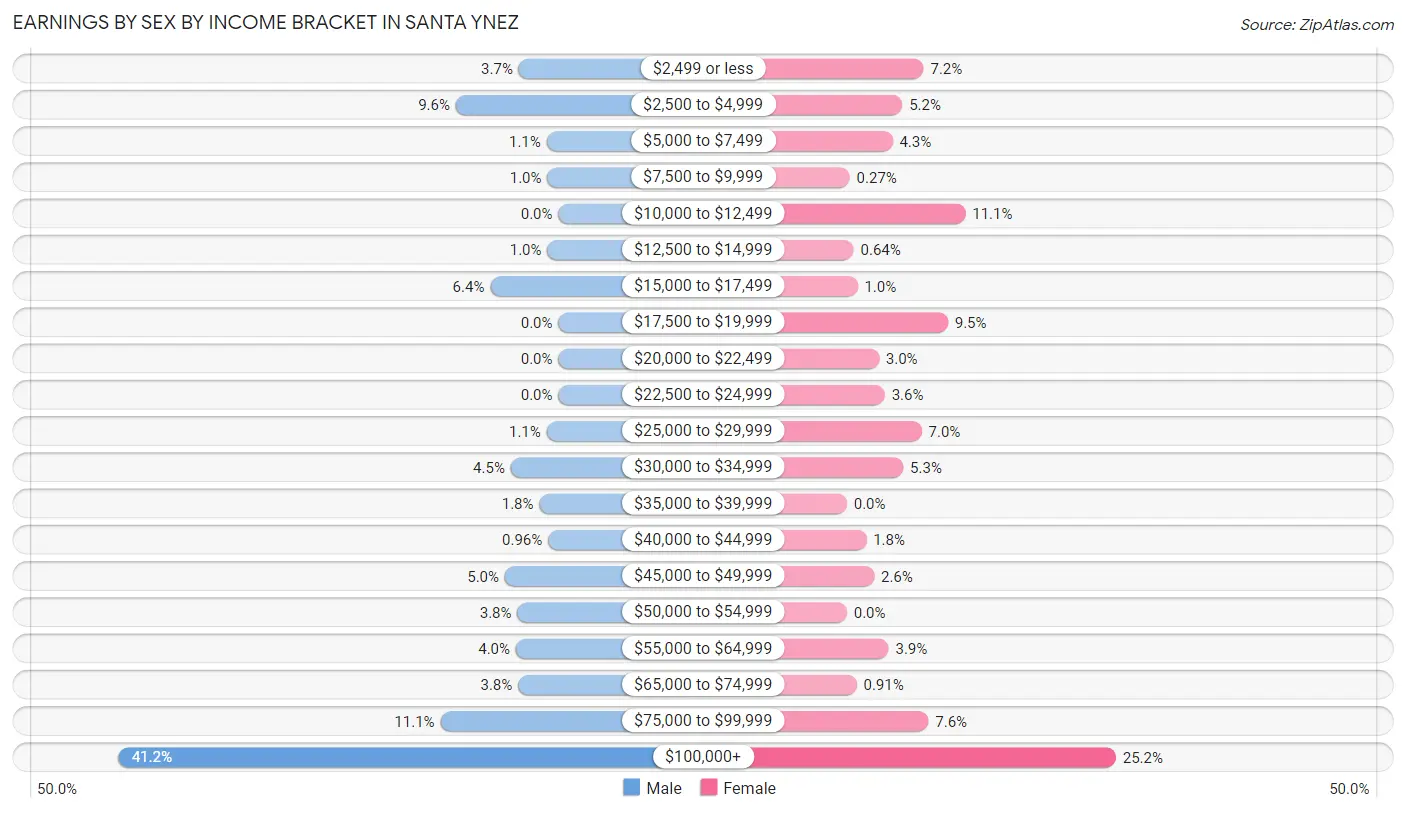
| Income | Male | Female |
| $2,499 or less | 54 (3.7%) | 79 (7.2%) |
| $2,500 to $4,999 | 140 (9.6%) | 57 (5.2%) |
| $5,000 to $7,499 | 16 (1.1%) | 47 (4.3%) |
| $7,500 to $9,999 | 15 (1.0%) | 3 (0.3%) |
| $10,000 to $12,499 | 0 (0.0%) | 122 (11.1%) |
| $12,500 to $14,999 | 15 (1.0%) | 7 (0.6%) |
| $15,000 to $17,499 | 93 (6.4%) | 11 (1.0%) |
| $17,500 to $19,999 | 0 (0.0%) | 104 (9.5%) |
| $20,000 to $22,499 | 0 (0.0%) | 33 (3.0%) |
| $22,500 to $24,999 | 0 (0.0%) | 39 (3.5%) |
| $25,000 to $29,999 | 16 (1.1%) | 77 (7.0%) |
| $30,000 to $34,999 | 65 (4.5%) | 58 (5.3%) |
| $35,000 to $39,999 | 26 (1.8%) | 0 (0.0%) |
| $40,000 to $44,999 | 14 (1.0%) | 20 (1.8%) |
| $45,000 to $49,999 | 73 (5.0%) | 28 (2.5%) |
| $50,000 to $54,999 | 56 (3.8%) | 0 (0.0%) |
| $55,000 to $64,999 | 58 (4.0%) | 43 (3.9%) |
| $65,000 to $74,999 | 55 (3.8%) | 10 (0.9%) |
| $75,000 to $99,999 | 161 (11.1%) | 84 (7.6%) |
| $100,000+ | 600 (41.2%) | 277 (25.2%) |
| Total | 1,457 (100.0%) | 1,099 (100.0%) |
Earnings by Sex by Educational Attainment in Santa Ynez
Average earnings in Santa Ynez are $93,833 for men and $30,714 for women, a difference of 67.3%. Men with an educational attainment of graduate degree enjoy the highest average annual earnings of $111,314, while those with college or associate's degree education earn the least with $103,864. Women with an educational attainment of bachelor's degree earn the most with the average annual earnings of $81,623, while those with high school diploma education have the smallest earnings of $10,806.
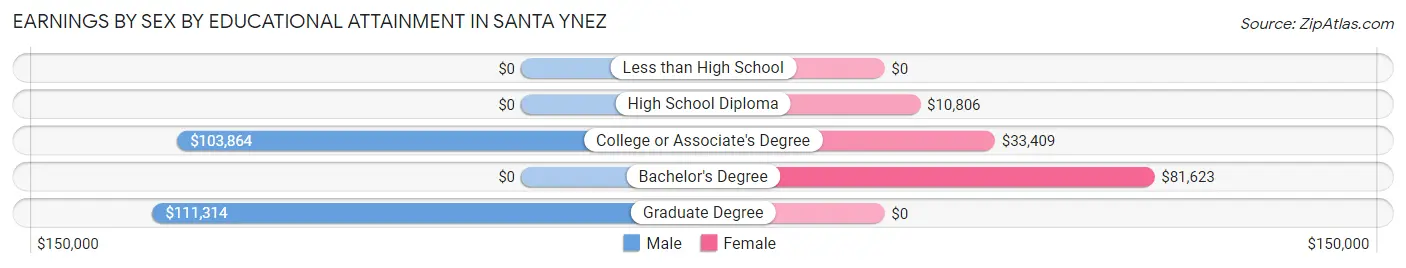
| Educational Attainment | Male Income | Female Income |
| Less than High School | - | - |
| High School Diploma | - | - |
| College or Associate's Degree | $103,864 | $33,409 |
| Bachelor's Degree | - | - |
| Graduate Degree | $111,314 | $0 |
| Total | $93,833 | $30,714 |
Family Income in Santa Ynez
Family Income Brackets in Santa Ynez
According to the Santa Ynez family income data, there are 551 families falling into the $200,000+ income range, which is the most common income bracket and makes up 44.1% of all families. Conversely, the $25,000 to $34,999 income bracket is the least frequent group with only 15 families (1.2%) belonging to this category.
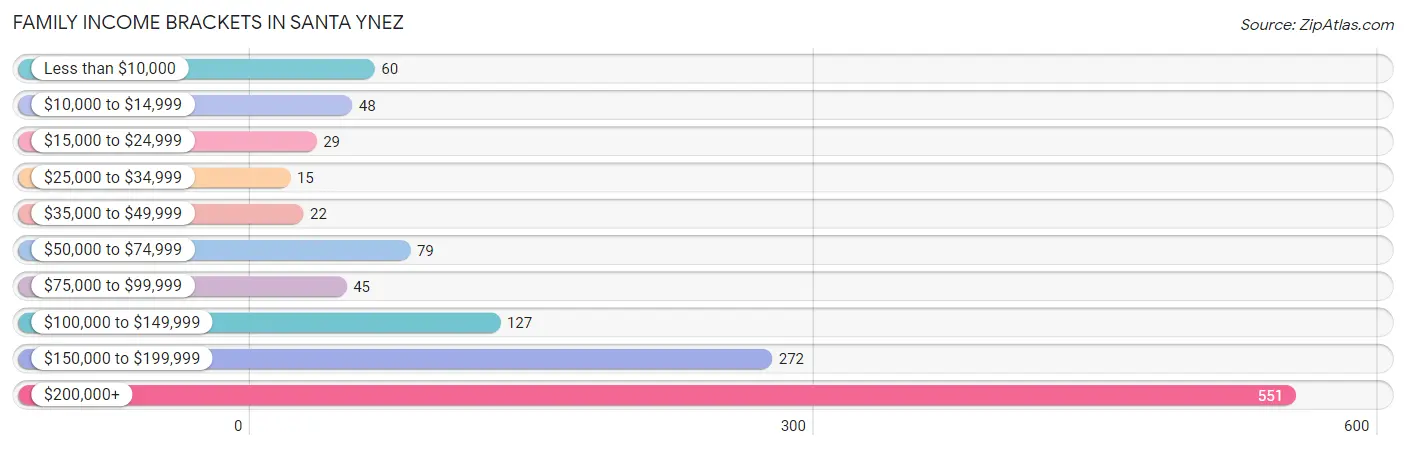
| Income Bracket | # Families | % Families |
| Less than $10,000 | 60 | 4.8% |
| $10,000 to $14,999 | 48 | 3.8% |
| $15,000 to $24,999 | 29 | 2.3% |
| $25,000 to $34,999 | 15 | 1.2% |
| $35,000 to $49,999 | 22 | 1.8% |
| $50,000 to $74,999 | 79 | 6.3% |
| $75,000 to $99,999 | 45 | 3.6% |
| $100,000 to $149,999 | 127 | 10.2% |
| $150,000 to $199,999 | 272 | 21.8% |
| $200,000+ | 551 | 44.1% |
Family Income by Famaliy Size in Santa Ynez
5-person families (82 | 6.6%) account for the highest median family income in Santa Ynez with $250,001 per family, while 2-person families (596 | 47.7%) have the highest median income of $100,132 per family member.
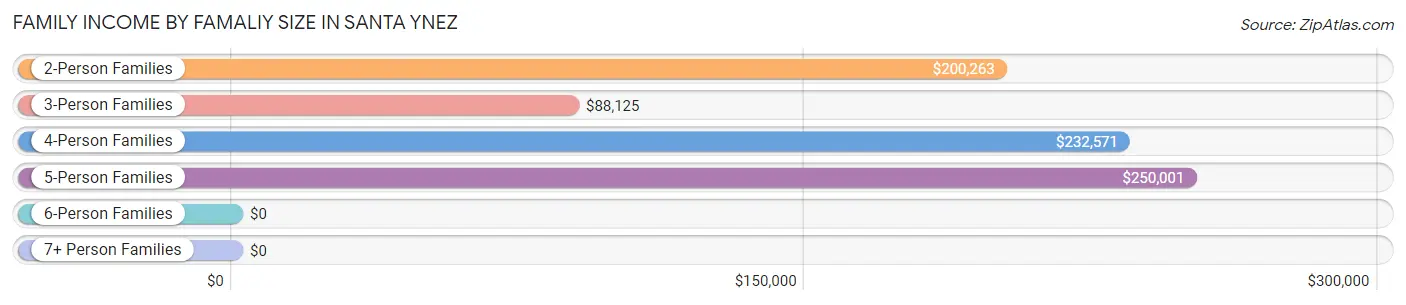
| Income Bracket | # Families | Median Income |
| 2-Person Families | 596 (47.7%) | $200,263 |
| 3-Person Families | 286 (22.9%) | $88,125 |
| 4-Person Families | 227 (18.2%) | $232,571 |
| 5-Person Families | 82 (6.6%) | $250,001 |
| 6-Person Families | 56 (4.5%) | $0 |
| 7+ Person Families | 3 (0.2%) | $0 |
| Total | 1,250 (100.0%) | $176,833 |
Family Income by Number of Earners in Santa Ynez
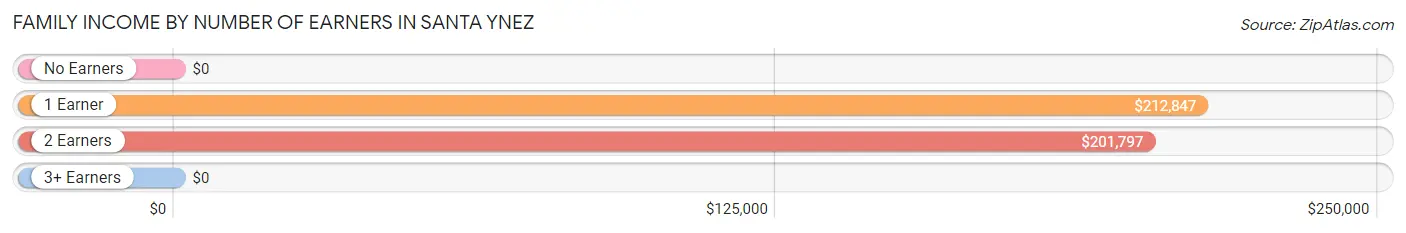
| Number of Earners | # Families | Median Income |
| No Earners | 268 (21.4%) | $0 |
| 1 Earner | 331 (26.5%) | $212,847 |
| 2 Earners | 455 (36.4%) | $201,797 |
| 3+ Earners | 196 (15.7%) | $0 |
| Total | 1,250 (100.0%) | $176,833 |
Household Income in Santa Ynez
Household Income Brackets in Santa Ynez
With 600 households falling in the category, the $200,000+ income range is the most frequent in Santa Ynez, accounting for 32.8% of all households. In contrast, only 15 households (0.8%) fall into the $25,000 to $34,999 income bracket, making it the least populous group.
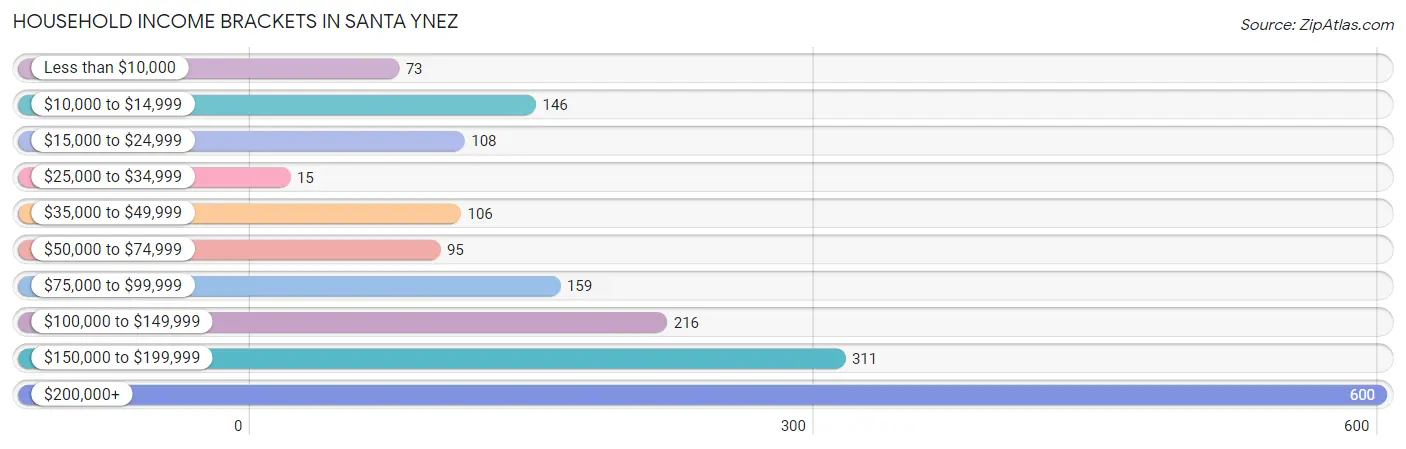
| Income Bracket | # Households | % Households |
| Less than $10,000 | 73 | 4.0% |
| $10,000 to $14,999 | 146 | 8.0% |
| $15,000 to $24,999 | 108 | 5.9% |
| $25,000 to $34,999 | 15 | 0.8% |
| $35,000 to $49,999 | 106 | 5.8% |
| $50,000 to $74,999 | 95 | 5.2% |
| $75,000 to $99,999 | 159 | 8.7% |
| $100,000 to $149,999 | 216 | 11.8% |
| $150,000 to $199,999 | 311 | 17.0% |
| $200,000+ | 600 | 32.8% |
Household Income by Householder Age in Santa Ynez
The median household income in Santa Ynez is $144,792, with the highest median household income of $164,487 found in the 45 to 64 years age bracket for the primary householder. A total of 691 households (37.8%) fall into this category.
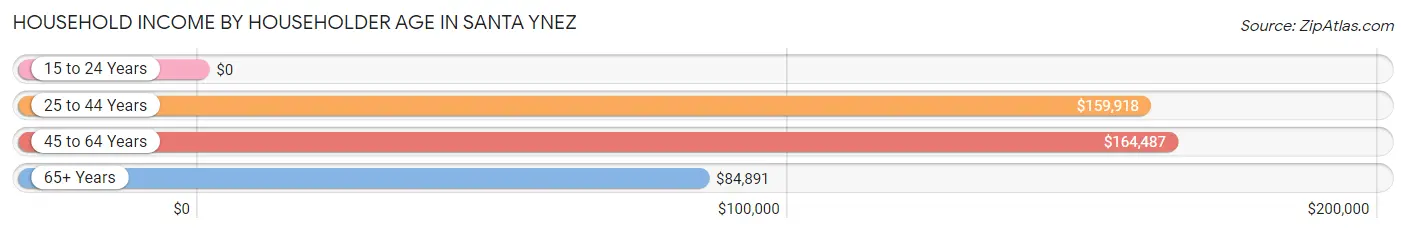
| Income Bracket | # Households | Median Income |
| 15 to 24 Years | 0 (0.0%) | $0 |
| 25 to 44 Years | 424 (23.2%) | $159,918 |
| 45 to 64 Years | 691 (37.8%) | $164,487 |
| 65+ Years | 714 (39.0%) | $84,891 |
| Total | 1,829 (100.0%) | $144,792 |
Poverty in Santa Ynez
Income Below Poverty by Sex and Age in Santa Ynez
With 13.2% poverty level for males and 10.2% for females among the residents of Santa Ynez, 12 to 14 year old males and 35 to 44 year old females are the most vulnerable to poverty, with 67 males (49.3%) and 83 females (33.1%) in their respective age groups living below the poverty level.
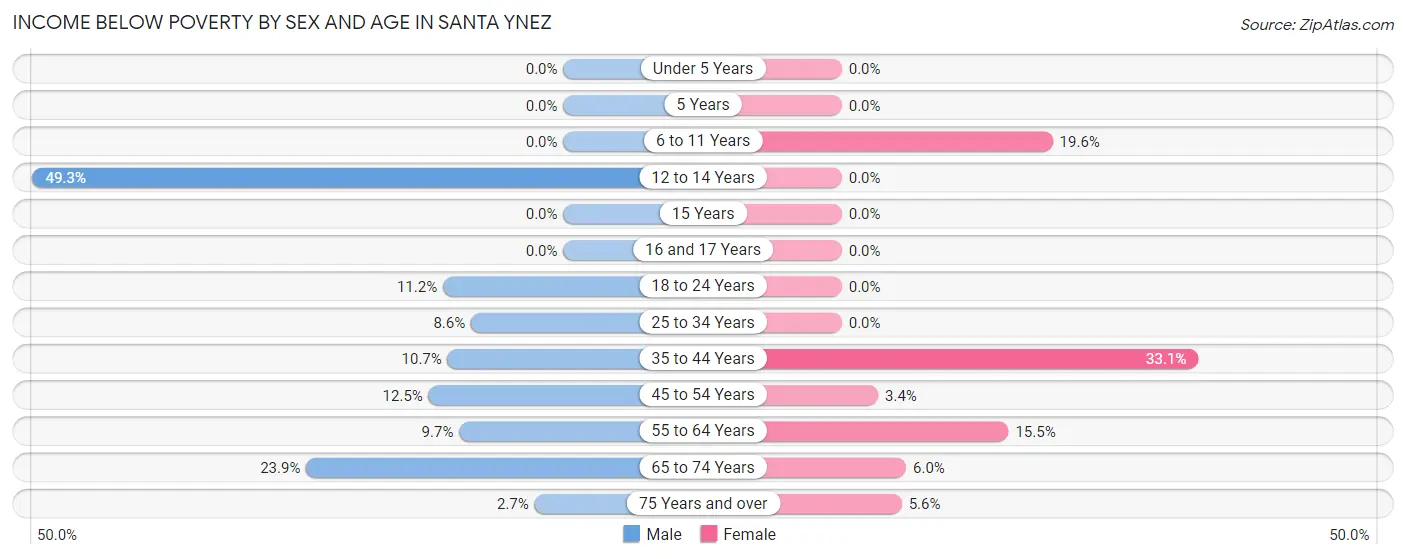
| Age Bracket | Male | Female |
| Under 5 Years | 0 (0.0%) | 0 (0.0%) |
| 5 Years | 0 (0.0%) | 0 (0.0%) |
| 6 to 11 Years | 0 (0.0%) | 63 (19.6%) |
| 12 to 14 Years | 67 (49.3%) | 0 (0.0%) |
| 15 Years | 0 (0.0%) | 0 (0.0%) |
| 16 and 17 Years | 0 (0.0%) | 0 (0.0%) |
| 18 to 24 Years | 40 (11.2%) | 0 (0.0%) |
| 25 to 34 Years | 15 (8.6%) | 0 (0.0%) |
| 35 to 44 Years | 29 (10.7%) | 83 (33.1%) |
| 45 to 54 Years | 41 (12.5%) | 13 (3.4%) |
| 55 to 64 Years | 34 (9.7%) | 43 (15.5%) |
| 65 to 74 Years | 84 (23.9%) | 23 (6.0%) |
| 75 Years and over | 4 (2.7%) | 14 (5.6%) |
| Total | 314 (13.2%) | 239 (10.2%) |
Income Above Poverty by Sex and Age in Santa Ynez
According to the poverty statistics in Santa Ynez, males aged under 5 years and females aged under 5 years are the age groups that are most secure financially, with 100.0% of males and 100.0% of females in these age groups living above the poverty line.
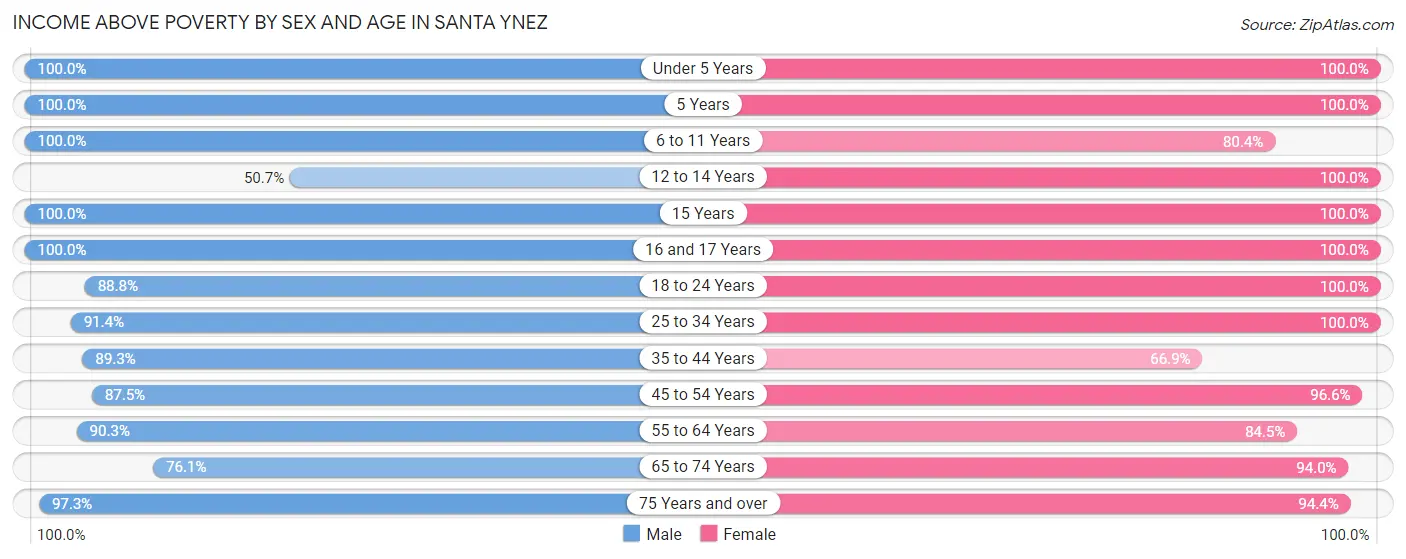
| Age Bracket | Male | Female |
| Under 5 Years | 58 (100.0%) | 100 (100.0%) |
| 5 Years | 9 (100.0%) | 58 (100.0%) |
| 6 to 11 Years | 85 (100.0%) | 259 (80.4%) |
| 12 to 14 Years | 69 (50.7%) | 3 (100.0%) |
| 15 Years | 23 (100.0%) | 15 (100.0%) |
| 16 and 17 Years | 82 (100.0%) | 19 (100.0%) |
| 18 to 24 Years | 318 (88.8%) | 55 (100.0%) |
| 25 to 34 Years | 160 (91.4%) | 211 (100.0%) |
| 35 to 44 Years | 241 (89.3%) | 168 (66.9%) |
| 45 to 54 Years | 287 (87.5%) | 373 (96.6%) |
| 55 to 64 Years | 318 (90.3%) | 235 (84.5%) |
| 65 to 74 Years | 268 (76.1%) | 362 (94.0%) |
| 75 Years and over | 146 (97.3%) | 238 (94.4%) |
| Total | 2,064 (86.8%) | 2,096 (89.8%) |
Income Below Poverty Among Married-Couple Families in Santa Ynez
The poverty statistics for married-couple families in Santa Ynez show that 8.0% or 79 of the total 984 families live below the poverty line. Families with 1 or 2 children have the highest poverty rate of 15.2%, comprising of 60 families. On the other hand, families with 3 or 4 children have the lowest poverty rate of 0.0%, which includes 0 families.
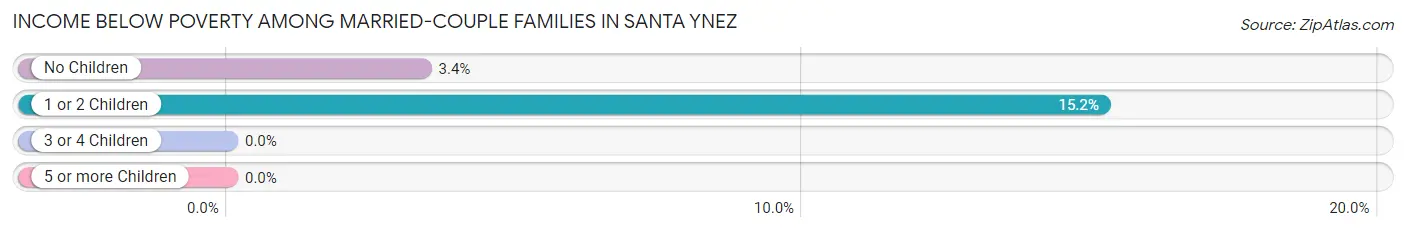
| Children | Above Poverty | Below Poverty |
| No Children | 544 (96.6%) | 19 (3.4%) |
| 1 or 2 Children | 335 (84.8%) | 60 (15.2%) |
| 3 or 4 Children | 23 (100.0%) | 0 (0.0%) |
| 5 or more Children | 3 (100.0%) | 0 (0.0%) |
| Total | 905 (92.0%) | 79 (8.0%) |
Income Below Poverty Among Single-Parent Households in Santa Ynez
According to the poverty data in Santa Ynez, 13.7% or 28 single-father households and 22.6% or 14 single-mother households are living below the poverty line. Among single-father households, those with 1 or 2 children have the highest poverty rate, with 28 households (17.8%) experiencing poverty. Likewise, among single-mother households, those with no children have the highest poverty rate, with 14 households (37.8%) falling below the poverty line.
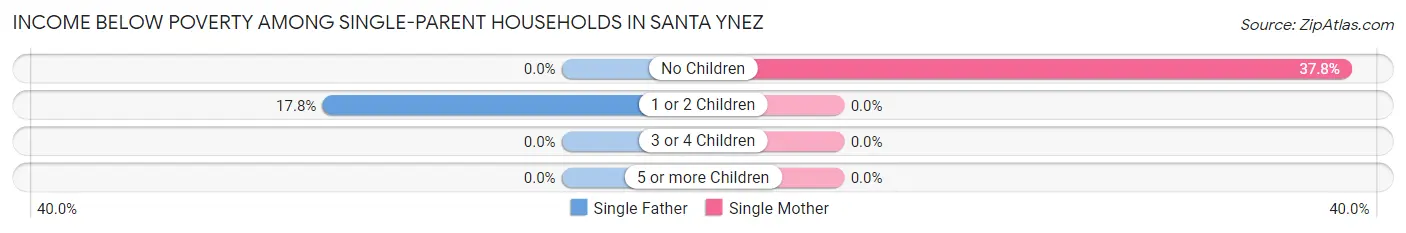
| Children | Single Father | Single Mother |
| No Children | 0 (0.0%) | 14 (37.8%) |
| 1 or 2 Children | 28 (17.8%) | 0 (0.0%) |
| 3 or 4 Children | 0 (0.0%) | 0 (0.0%) |
| 5 or more Children | 0 (0.0%) | 0 (0.0%) |
| Total | 28 (13.7%) | 14 (22.6%) |
Income Below Poverty Among Married-Couple vs Single-Parent Households in Santa Ynez
The poverty data for Santa Ynez shows that 79 of the married-couple family households (8.0%) and 42 of the single-parent households (15.8%) are living below the poverty level. Within the married-couple family households, those with 1 or 2 children have the highest poverty rate, with 60 households (15.2%) falling below the poverty line. Among the single-parent households, those with no children have the highest poverty rate, with 14 household (16.7%) living below poverty.
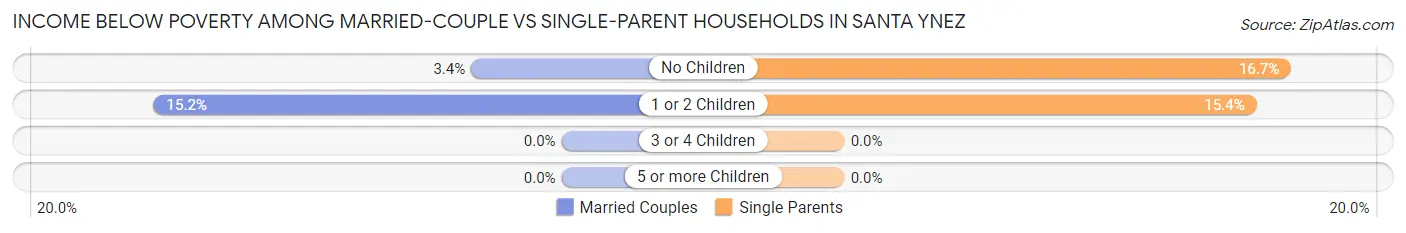
| Children | Married-Couple Families | Single-Parent Households |
| No Children | 19 (3.4%) | 14 (16.7%) |
| 1 or 2 Children | 60 (15.2%) | 28 (15.4%) |
| 3 or 4 Children | 0 (0.0%) | 0 (0.0%) |
| 5 or more Children | 0 (0.0%) | 0 (0.0%) |
| Total | 79 (8.0%) | 42 (15.8%) |
Race in Santa Ynez
The most populous races in Santa Ynez are White / Caucasian (4,124 | 87.5%), Hispanic or Latino (921 | 19.5%), and Native / Alaskan (206 | 4.4%).
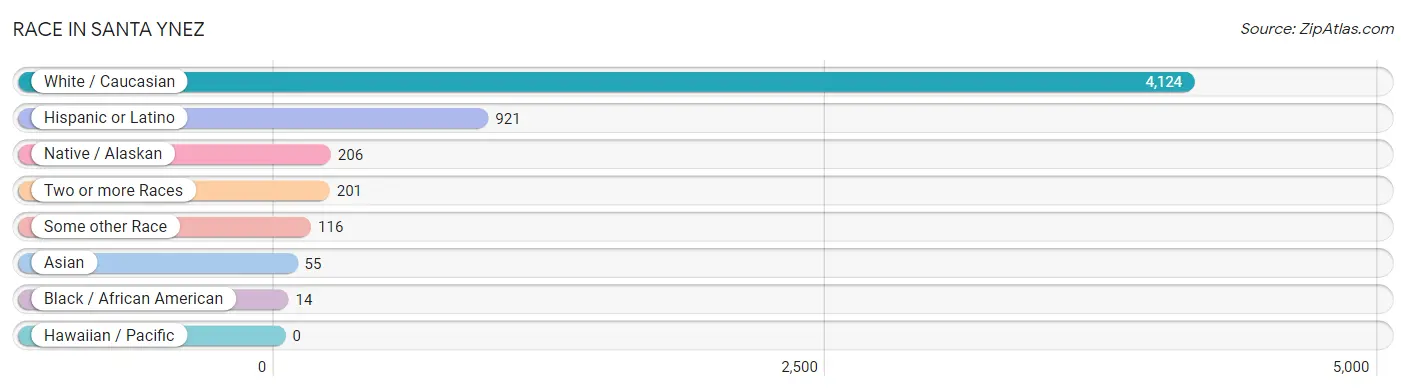
| Race | # Population | % Population |
| Asian | 55 | 1.2% |
| Black / African American | 14 | 0.3% |
| Hawaiian / Pacific | 0 | 0.0% |
| Hispanic or Latino | 921 | 19.5% |
| Native / Alaskan | 206 | 4.4% |
| White / Caucasian | 4,124 | 87.5% |
| Two or more Races | 201 | 4.3% |
| Some other Race | 116 | 2.5% |
| Total | 4,716 | 100.0% |
Ancestry in Santa Ynez
The most populous ancestries reported in Santa Ynez are Irish (979 | 20.8%), Mexican (744 | 15.8%), English (606 | 12.9%), German (570 | 12.1%), and Norwegian (338 | 7.2%), together accounting for 68.6% of all Santa Ynez residents.
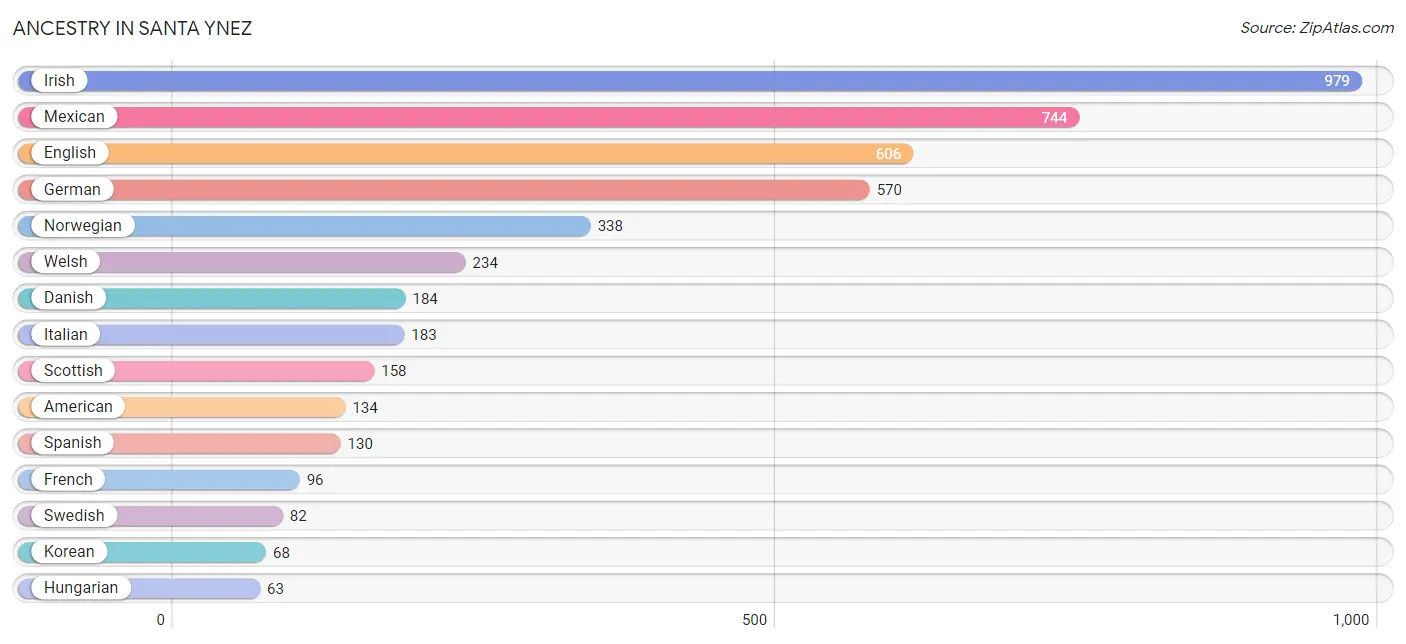
| Ancestry | # Population | % Population |
| American | 134 | 2.8% |
| Armenian | 14 | 0.3% |
| Austrian | 40 | 0.9% |
| Basque | 17 | 0.4% |
| Belgian | 3 | 0.1% |
| Bhutanese | 44 | 0.9% |
| British | 52 | 1.1% |
| Burmese | 5 | 0.1% |
| Canadian | 14 | 0.3% |
| Cherokee | 29 | 0.6% |
| Croatian | 25 | 0.5% |
| Czechoslovakian | 9 | 0.2% |
| Danish | 184 | 3.9% |
| Dutch | 15 | 0.3% |
| Eastern European | 3 | 0.1% |
| English | 606 | 12.9% |
| European | 38 | 0.8% |
| Finnish | 3 | 0.1% |
| French | 96 | 2.0% |
| French American Indian | 12 | 0.3% |
| French Canadian | 3 | 0.1% |
| German | 570 | 12.1% |
| Greek | 26 | 0.5% |
| Guamanian / Chamorro | 55 | 1.2% |
| Hungarian | 63 | 1.3% |
| Indian (Asian) | 26 | 0.5% |
| Iranian | 15 | 0.3% |
| Irish | 979 | 20.8% |
| Italian | 183 | 3.9% |
| Jamaican | 14 | 0.3% |
| Korean | 68 | 1.4% |
| Lithuanian | 14 | 0.3% |
| Mexican | 744 | 15.8% |
| Native Hawaiian | 26 | 0.5% |
| Northern European | 30 | 0.6% |
| Norwegian | 338 | 7.2% |
| Polish | 28 | 0.6% |
| Puerto Rican | 47 | 1.0% |
| Romanian | 14 | 0.3% |
| Russian | 20 | 0.4% |
| Scandinavian | 16 | 0.3% |
| Scotch-Irish | 10 | 0.2% |
| Scottish | 158 | 3.4% |
| Slovene | 16 | 0.3% |
| Spanish | 130 | 2.8% |
| Swedish | 82 | 1.7% |
| Swiss | 57 | 1.2% |
| Welsh | 234 | 5.0% | View All 48 Rows |
Immigrants in Santa Ynez
The most numerous immigrant groups reported in Santa Ynez came from Central America (548 | 11.6%), Latin America (548 | 11.6%), Mexico (548 | 11.6%), Europe (122 | 2.6%), and Northern Europe (107 | 2.3%), together accounting for 39.7% of all Santa Ynez residents.
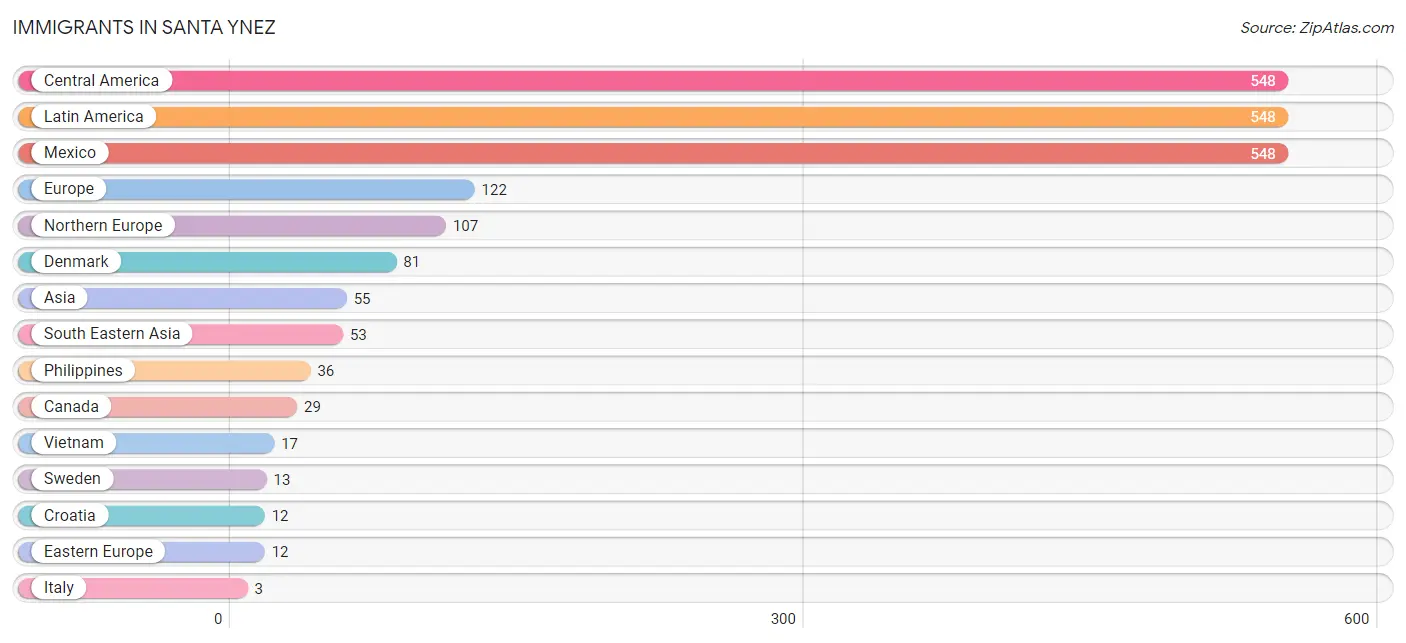
| Immigration Origin | # Population | % Population |
| Asia | 55 | 1.2% |
| Canada | 29 | 0.6% |
| Central America | 548 | 11.6% |
| Croatia | 12 | 0.3% |
| Denmark | 81 | 1.7% |
| Eastern Asia | 2 | 0.0% |
| Eastern Europe | 12 | 0.3% |
| Europe | 122 | 2.6% |
| Italy | 3 | 0.1% |
| Korea | 2 | 0.0% |
| Latin America | 548 | 11.6% |
| Mexico | 548 | 11.6% |
| Northern Europe | 107 | 2.3% |
| Oceania | 1 | 0.0% |
| Philippines | 36 | 0.8% |
| South Eastern Asia | 53 | 1.1% |
| Southern Europe | 3 | 0.1% |
| Sweden | 13 | 0.3% |
| Vietnam | 17 | 0.4% | View All 19 Rows |
Sex and Age in Santa Ynez
Sex and Age in Santa Ynez
The most populous age groups in Santa Ynez are 15 to 19 Years (314 | 13.2%) for men and 50 to 54 Years (283 | 12.1%) for women.
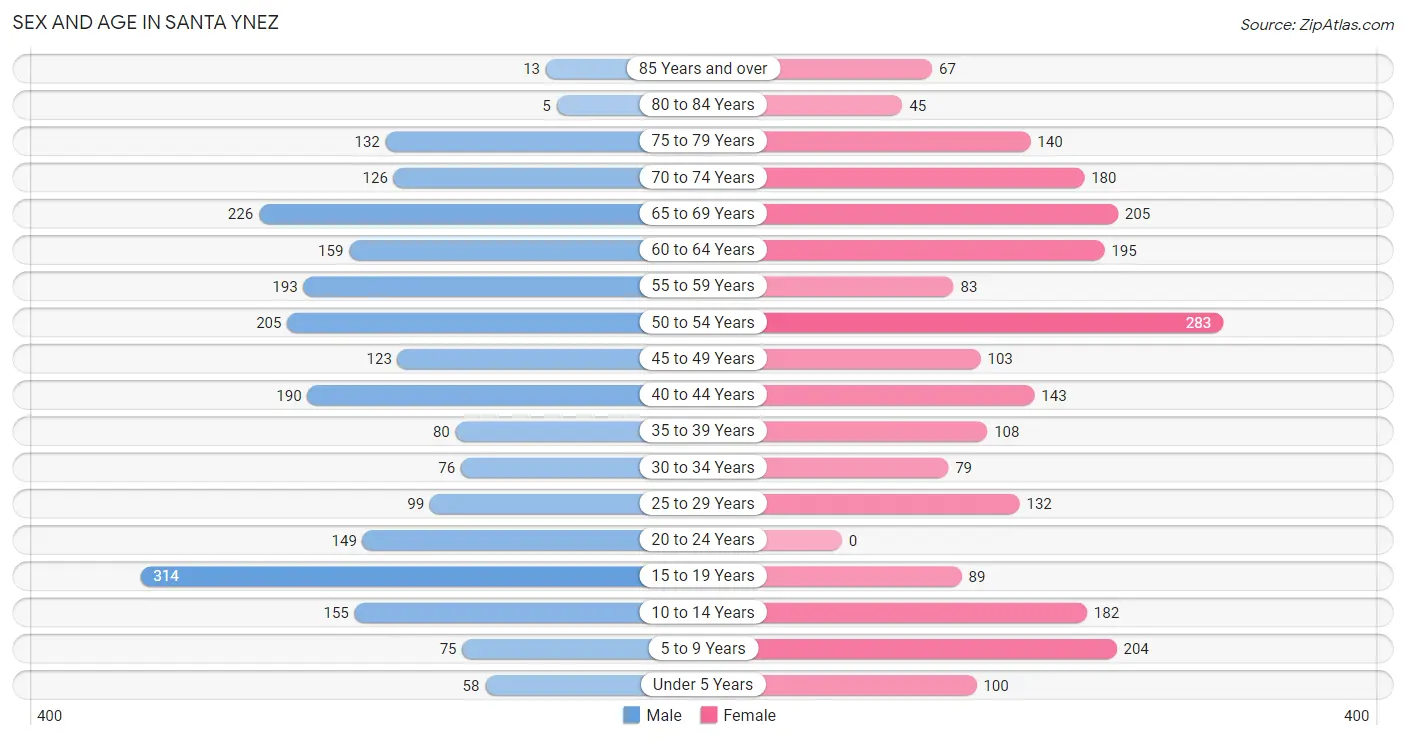
| Age Bracket | Male | Female |
| Under 5 Years | 58 (2.4%) | 100 (4.3%) |
| 5 to 9 Years | 75 (3.2%) | 204 (8.7%) |
| 10 to 14 Years | 155 (6.5%) | 182 (7.8%) |
| 15 to 19 Years | 314 (13.2%) | 89 (3.8%) |
| 20 to 24 Years | 149 (6.3%) | 0 (0.0%) |
| 25 to 29 Years | 99 (4.2%) | 132 (5.7%) |
| 30 to 34 Years | 76 (3.2%) | 79 (3.4%) |
| 35 to 39 Years | 80 (3.4%) | 108 (4.6%) |
| 40 to 44 Years | 190 (8.0%) | 143 (6.1%) |
| 45 to 49 Years | 123 (5.2%) | 103 (4.4%) |
| 50 to 54 Years | 205 (8.6%) | 283 (12.1%) |
| 55 to 59 Years | 193 (8.1%) | 83 (3.5%) |
| 60 to 64 Years | 159 (6.7%) | 195 (8.3%) |
| 65 to 69 Years | 226 (9.5%) | 205 (8.8%) |
| 70 to 74 Years | 126 (5.3%) | 180 (7.7%) |
| 75 to 79 Years | 132 (5.6%) | 140 (6.0%) |
| 80 to 84 Years | 5 (0.2%) | 45 (1.9%) |
| 85 Years and over | 13 (0.5%) | 67 (2.9%) |
| Total | 2,378 (100.0%) | 2,338 (100.0%) |
Families and Households in Santa Ynez
Median Family Size in Santa Ynez
The median family size in Santa Ynez is 3.01 persons per family, with married-couple families (984 | 78.7%) accounting for the largest median family size of 3.11 persons per family. On the other hand, single female/mother families (62 | 5.0%) represent the smallest median family size with 2.47 persons per family.
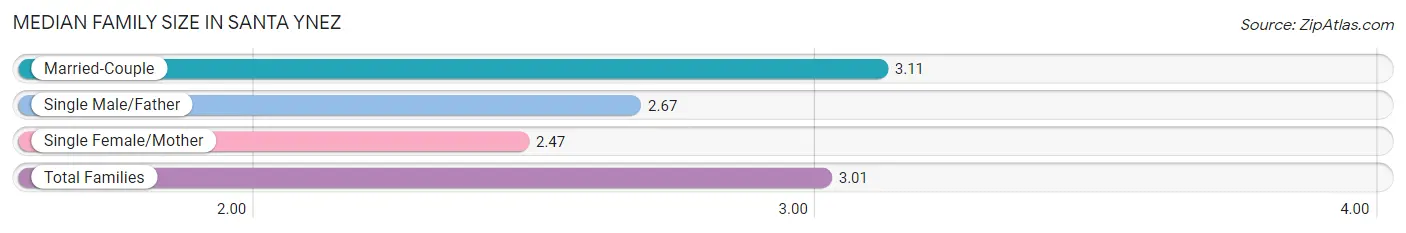
| Family Type | # Families | Family Size |
| Married-Couple | 984 (78.7%) | 3.11 |
| Single Male/Father | 204 (16.3%) | 2.67 |
| Single Female/Mother | 62 (5.0%) | 2.47 |
| Total Families | 1,250 (100.0%) | 3.01 |
Median Household Size in Santa Ynez
The median household size in Santa Ynez is 2.57 persons per household, with single male/father households (204 | 11.2%) accounting for the largest median household size of 3.46 persons per household. non-family households (579 | 31.7%) represent the smallest median household size with 1.23 persons per household.
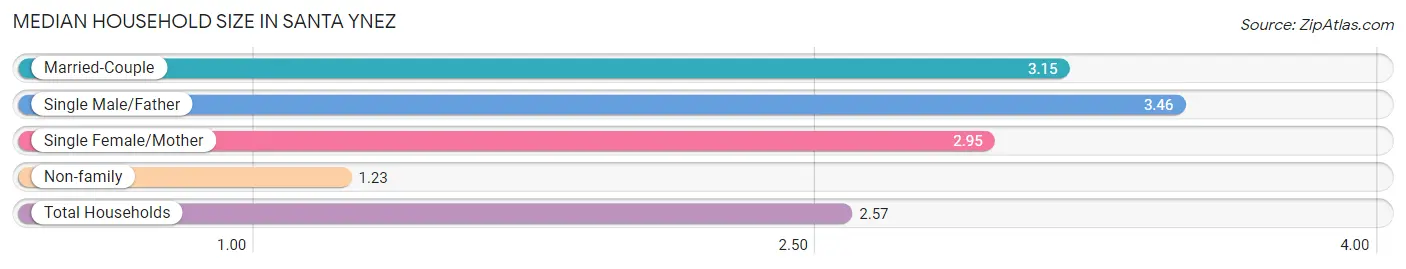
| Household Type | # Households | Household Size |
| Married-Couple | 984 (53.8%) | 3.15 |
| Single Male/Father | 204 (11.2%) | 3.46 |
| Single Female/Mother | 62 (3.4%) | 2.95 |
| Non-family | 579 (31.7%) | 1.23 |
| Total Households | 1,829 (100.0%) | 2.57 |
Household Size by Marriage Status in Santa Ynez
Out of a total of 1,829 households in Santa Ynez, 1,250 (68.3%) are family households, while 579 (31.7%) are nonfamily households. The most numerous type of family households are 2-person households, comprising 514, and the most common type of nonfamily households are 1-person households, comprising 471.
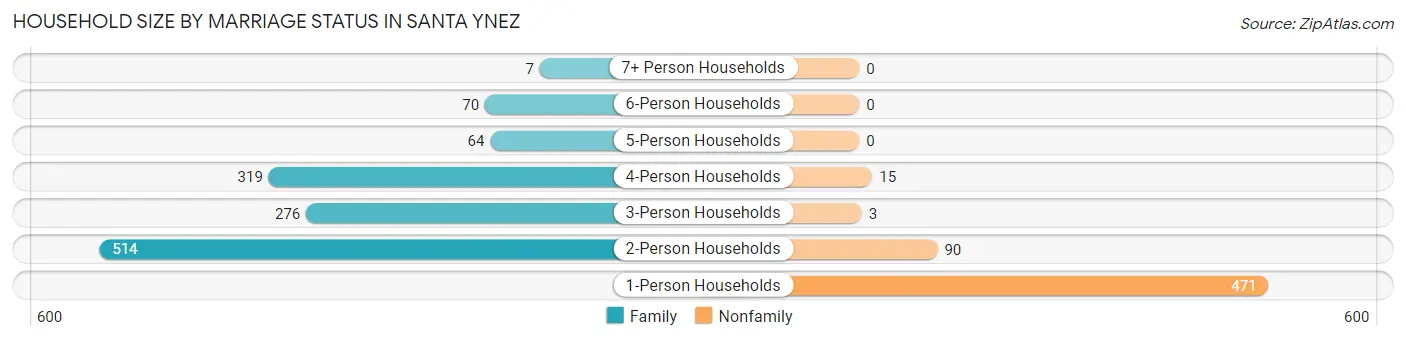
| Household Size | Family Households | Nonfamily Households |
| 1-Person Households | - | 471 (25.8%) |
| 2-Person Households | 514 (28.1%) | 90 (4.9%) |
| 3-Person Households | 276 (15.1%) | 3 (0.2%) |
| 4-Person Households | 319 (17.4%) | 15 (0.8%) |
| 5-Person Households | 64 (3.5%) | 0 (0.0%) |
| 6-Person Households | 70 (3.8%) | 0 (0.0%) |
| 7+ Person Households | 7 (0.4%) | 0 (0.0%) |
| Total | 1,250 (68.3%) | 579 (31.7%) |
Female Fertility in Santa Ynez
Fertility by Age in Santa Ynez
Average fertility rate in Santa Ynez is 87.0 births per 1,000 women. Women in the age bracket of 20 to 34 years have the highest fertility rate with 270.0 births per 1,000 women. Women in the age bracket of 20 to 34 years acount for 100.0% of all women with births.
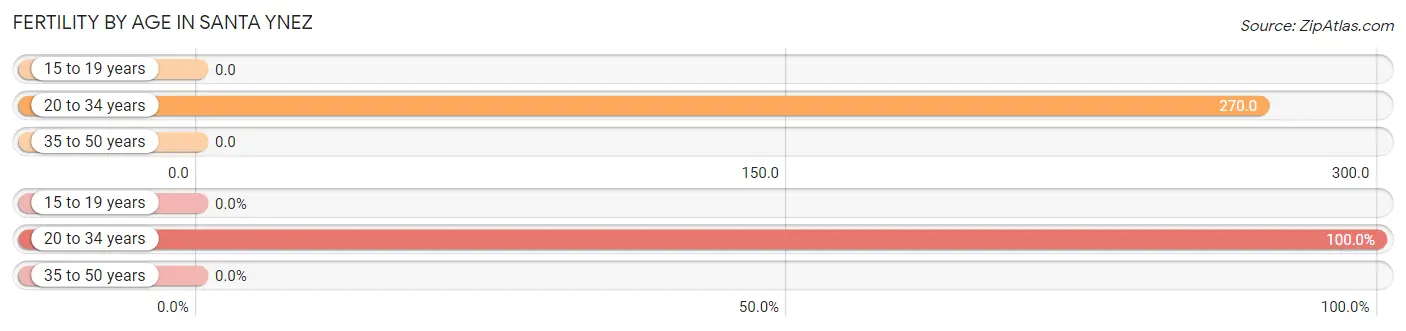
| Age Bracket | Women with Births | Births / 1,000 Women |
| 15 to 19 years | 0 (0.0%) | 0.0 |
| 20 to 34 years | 57 (100.0%) | 270.0 |
| 35 to 50 years | 0 (0.0%) | 0.0 |
| Total | 57 (100.0%) | 87.0 |
Fertility by Age by Marriage Status in Santa Ynez
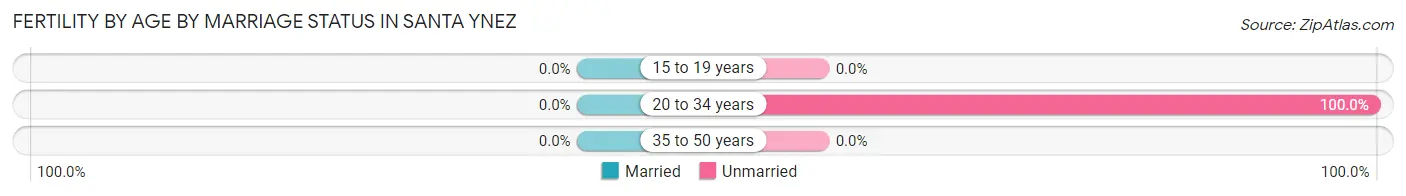
| Age Bracket | Married | Unmarried |
| 15 to 19 years | 0 (0.0%) | 0 (0.0%) |
| 20 to 34 years | 0 (0.0%) | 57 (100.0%) |
| 35 to 50 years | 0 (0.0%) | 0 (0.0%) |
| Total | 0 (0.0%) | 57 (100.0%) |
Fertility by Education in Santa Ynez
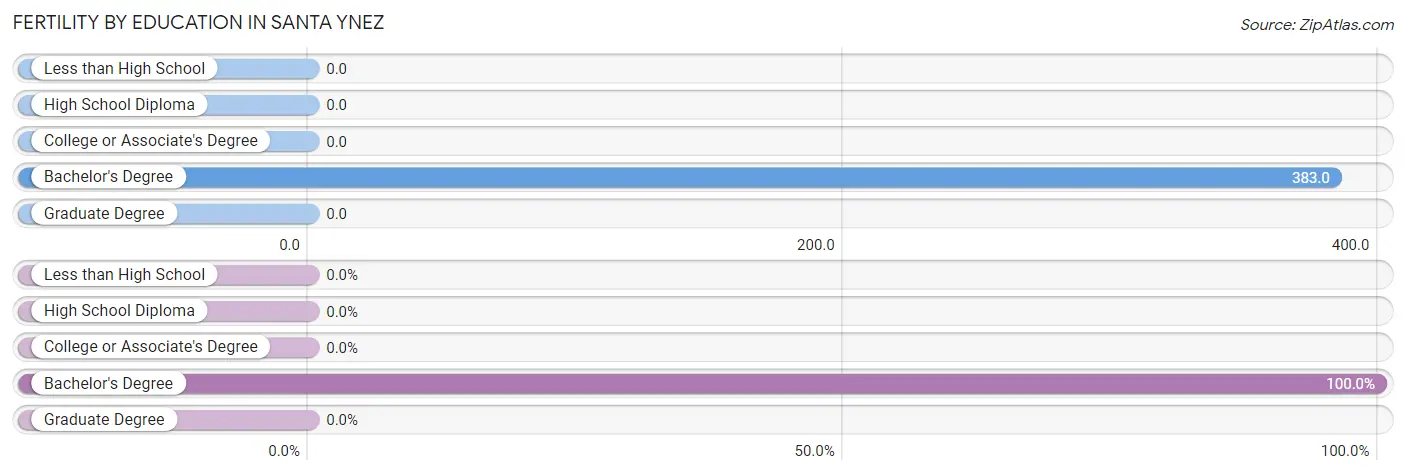
| Educational Attainment | Women with Births | Births / 1,000 Women |
| Less than High School | 0 (0.0%) | 0.0 |
| High School Diploma | 0 (0.0%) | 0.0 |
| College or Associate's Degree | 0 (0.0%) | 0.0 |
| Bachelor's Degree | 57 (100.0%) | 383.0 |
| Graduate Degree | 0 (0.0%) | 0.0 |
| Total | 57 (100.0%) | 87.0 |
Fertility by Education by Marriage Status in Santa Ynez
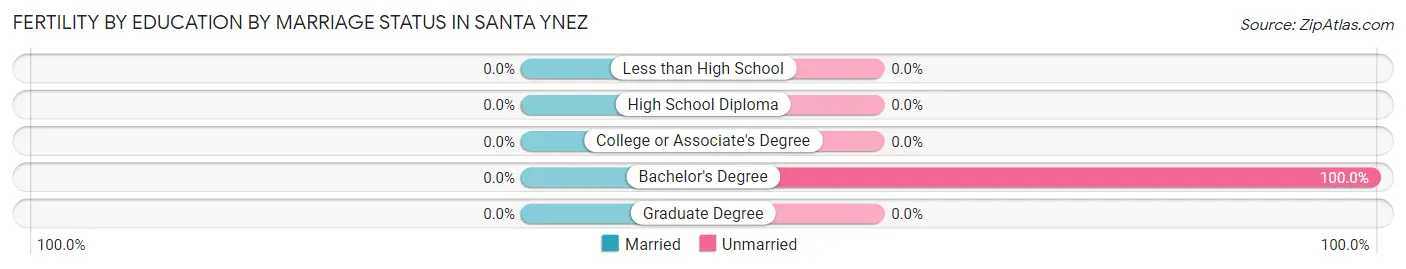
| Educational Attainment | Married | Unmarried |
| Less than High School | 0 (0.0%) | 0 (0.0%) |
| High School Diploma | 0 (0.0%) | 0 (0.0%) |
| College or Associate's Degree | 0 (0.0%) | 0 (0.0%) |
| Bachelor's Degree | 0 (0.0%) | 57 (100.0%) |
| Graduate Degree | 0 (0.0%) | 0 (0.0%) |
| Total | 0 (0.0%) | 57 (100.0%) |
Employment Characteristics in Santa Ynez
Employment by Class of Employer in Santa Ynez
Among the 2,240 employed individuals in Santa Ynez, private company employees (1,271 | 56.7%), self-employed (incorporated) (271 | 12.1%), and self-employed (not incorporated) (244 | 10.9%) make up the most common classes of employment.
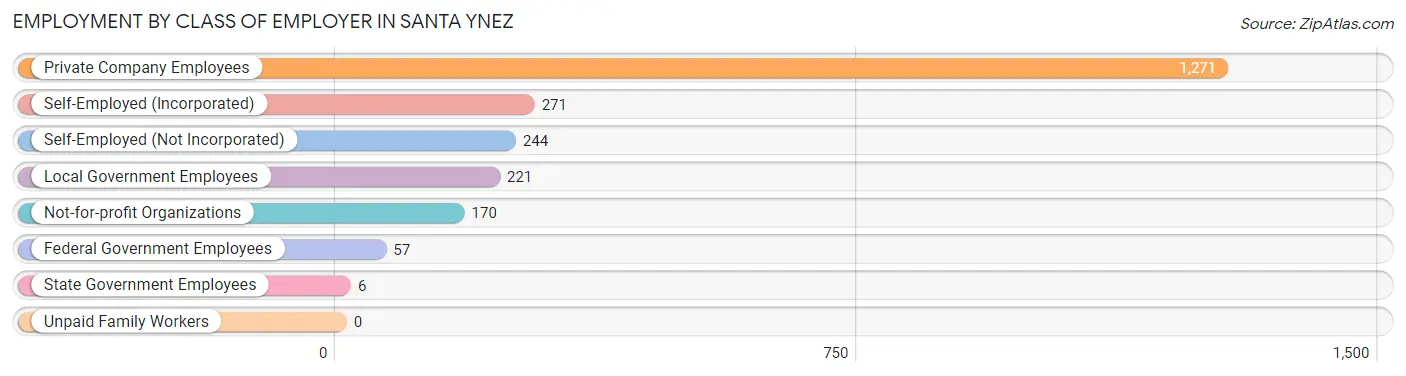
| Employer Class | # Employees | % Employees |
| Private Company Employees | 1,271 | 56.7% |
| Self-Employed (Incorporated) | 271 | 12.1% |
| Self-Employed (Not Incorporated) | 244 | 10.9% |
| Not-for-profit Organizations | 170 | 7.6% |
| Local Government Employees | 221 | 9.9% |
| State Government Employees | 6 | 0.3% |
| Federal Government Employees | 57 | 2.5% |
| Unpaid Family Workers | 0 | 0.0% |
| Total | 2,240 | 100.0% |
Employment Status by Age in Santa Ynez
According to the labor force statistics for Santa Ynez, out of the total population over 16 years of age (3,904), 58.3% or 2,276 individuals are in the labor force, with 0.7% or 16 of them unemployed. The age group with the highest labor force participation rate is 30 to 34 years, with 97.4% or 151 individuals in the labor force. Within the labor force, the 55 to 59 years age range has the highest percentage of unemployed individuals, with 6.5% or 14 of them being unemployed.
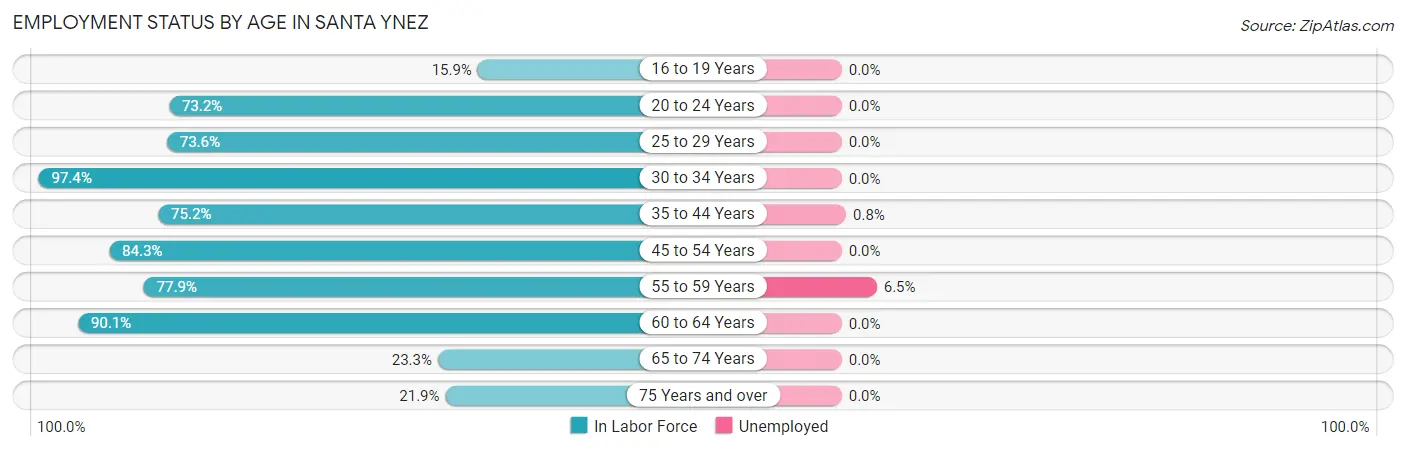
| Age Bracket | In Labor Force | Unemployed |
| 16 to 19 Years | 58 (15.9%) | 0 (0.0%) |
| 20 to 24 Years | 109 (73.2%) | 0 (0.0%) |
| 25 to 29 Years | 170 (73.6%) | 0 (0.0%) |
| 30 to 34 Years | 151 (97.4%) | 0 (0.0%) |
| 35 to 44 Years | 392 (75.2%) | 3 (0.8%) |
| 45 to 54 Years | 602 (84.3%) | 0 (0.0%) |
| 55 to 59 Years | 215 (77.9%) | 14 (6.5%) |
| 60 to 64 Years | 319 (90.1%) | 0 (0.0%) |
| 65 to 74 Years | 172 (23.3%) | 0 (0.0%) |
| 75 Years and over | 88 (21.9%) | 0 (0.0%) |
| Total | 2,276 (58.3%) | 16 (0.7%) |
Employment Status by Educational Attainment in Santa Ynez
According to labor force statistics for Santa Ynez, 82.1% of individuals (1,848) out of the total population between 25 and 64 years of age (2,251) are in the labor force, with 0.9% or 17 of them being unemployed. The group with the highest labor force participation rate are those with the educational attainment of bachelor's degree or higher, with 90.0% or 672 individuals in the labor force. Within the labor force, individuals with college / associate degree education have the highest percentage of unemployment, with 1.8% or 17 of them being unemployed.
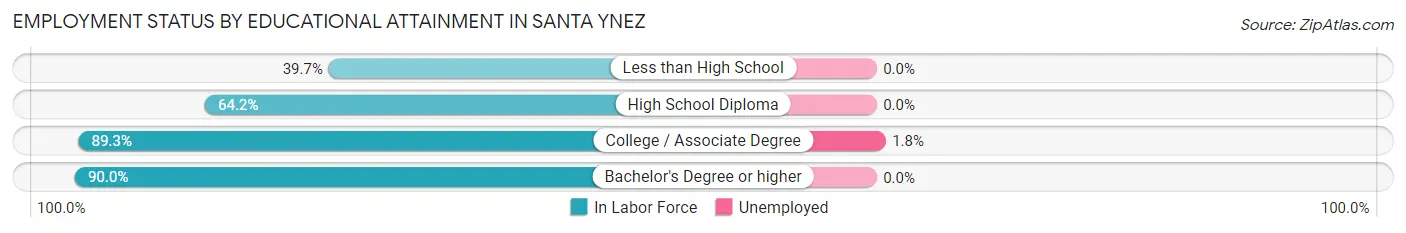
| Educational Attainment | In Labor Force | Unemployed |
| Less than High School | 81 (39.7%) | 0 (0.0%) |
| High School Diploma | 167 (64.2%) | 0 (0.0%) |
| College / Associate Degree | 929 (89.3%) | 19 (1.8%) |
| Bachelor's Degree or higher | 672 (90.0%) | 0 (0.0%) |
| Total | 1,848 (82.1%) | 20 (0.9%) |
Employment Occupations by Sex in Santa Ynez
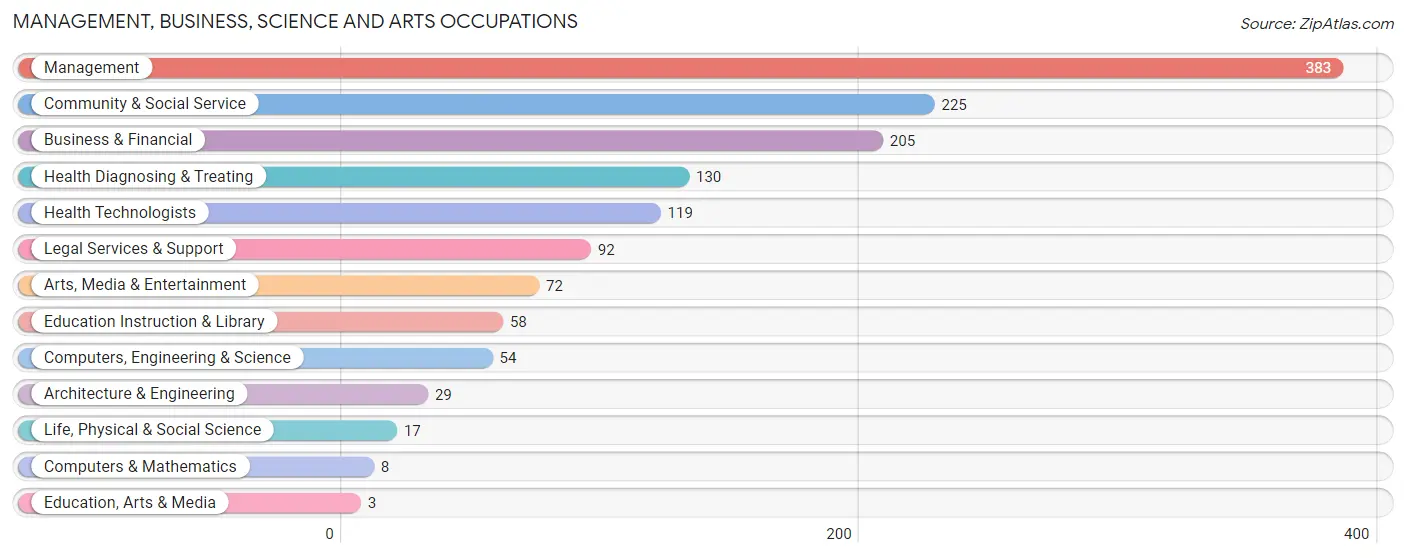
Management, Business, Science and Arts Occupations
The most common Management, Business, Science and Arts occupations in Santa Ynez are Management (383 | 17.0%), Community & Social Service (225 | 10.0%), Business & Financial (205 | 9.1%), Health Diagnosing & Treating (130 | 5.8%), and Health Technologists (119 | 5.3%).
Management, Business, Science and Arts Occupations by Sex
Within the Management, Business, Science and Arts occupations in Santa Ynez, the most male-oriented occupations are Architecture & Engineering (100.0%), Business & Financial (83.4%), and Life, Physical & Social Science (82.4%), while the most female-oriented occupations are Computers & Mathematics (100.0%), Education, Arts & Media (100.0%), and Legal Services & Support (100.0%).
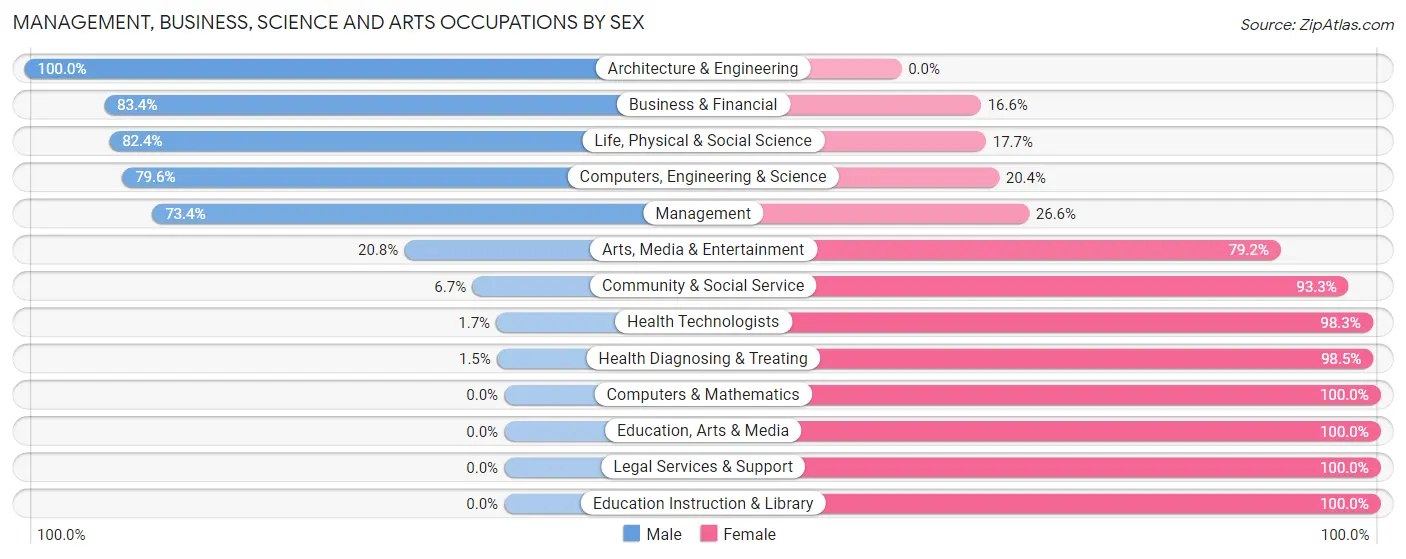
| Occupation | Male | Female |
| Management | 281 (73.4%) | 102 (26.6%) |
| Business & Financial | 171 (83.4%) | 34 (16.6%) |
| Computers, Engineering & Science | 43 (79.6%) | 11 (20.4%) |
| Computers & Mathematics | 0 (0.0%) | 8 (100.0%) |
| Architecture & Engineering | 29 (100.0%) | 0 (0.0%) |
| Life, Physical & Social Science | 14 (82.4%) | 3 (17.6%) |
| Community & Social Service | 15 (6.7%) | 210 (93.3%) |
| Education, Arts & Media | 0 (0.0%) | 3 (100.0%) |
| Legal Services & Support | 0 (0.0%) | 92 (100.0%) |
| Education Instruction & Library | 0 (0.0%) | 58 (100.0%) |
| Arts, Media & Entertainment | 15 (20.8%) | 57 (79.2%) |
| Health Diagnosing & Treating | 2 (1.5%) | 128 (98.5%) |
| Health Technologists | 2 (1.7%) | 117 (98.3%) |
| Total (Category) | 512 (51.3%) | 485 (48.6%) |
| Total (Overall) | 1,264 (55.9%) | 995 (44.1%) |
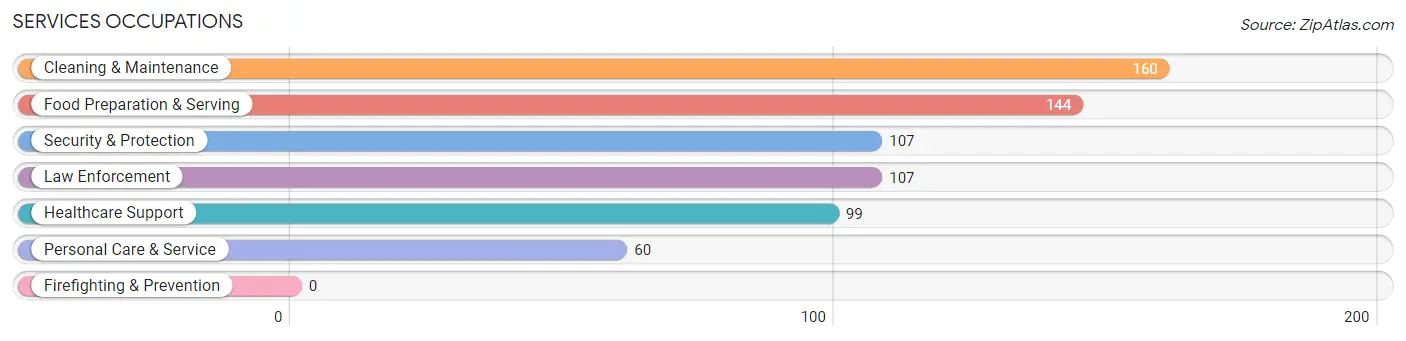
Services Occupations
The most common Services occupations in Santa Ynez are Cleaning & Maintenance (160 | 7.1%), Food Preparation & Serving (144 | 6.4%), Security & Protection (107 | 4.7%), Law Enforcement (107 | 4.7%), and Healthcare Support (99 | 4.4%).
Services Occupations by Sex
Within the Services occupations in Santa Ynez, the most male-oriented occupations are Security & Protection (100.0%), Law Enforcement (100.0%), and Food Preparation & Serving (44.4%), while the most female-oriented occupations are Healthcare Support (100.0%), Cleaning & Maintenance (70.6%), and Personal Care & Service (70.0%).
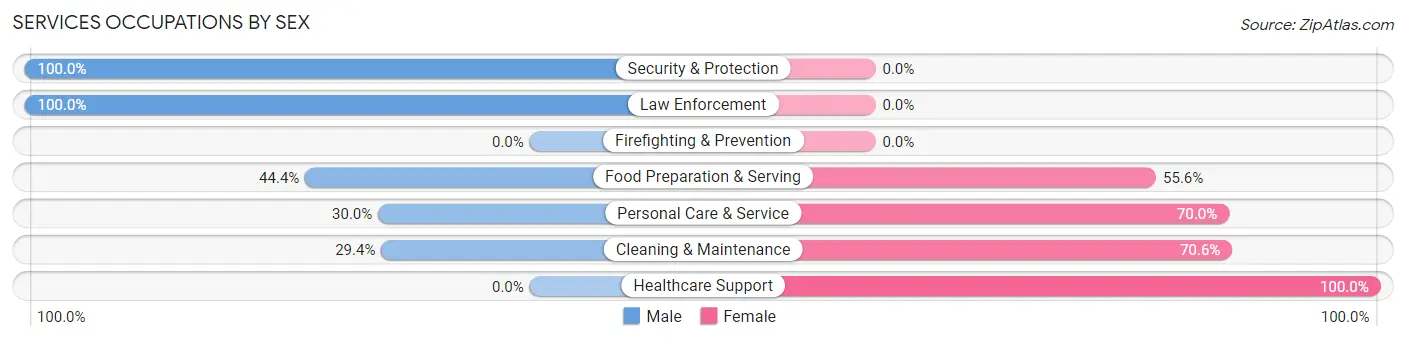
| Occupation | Male | Female |
| Healthcare Support | 0 (0.0%) | 99 (100.0%) |
| Security & Protection | 107 (100.0%) | 0 (0.0%) |
| Firefighting & Prevention | 0 (0.0%) | 0 (0.0%) |
| Law Enforcement | 107 (100.0%) | 0 (0.0%) |
| Food Preparation & Serving | 64 (44.4%) | 80 (55.6%) |
| Cleaning & Maintenance | 47 (29.4%) | 113 (70.6%) |
| Personal Care & Service | 18 (30.0%) | 42 (70.0%) |
| Total (Category) | 236 (41.4%) | 334 (58.6%) |
| Total (Overall) | 1,264 (55.9%) | 995 (44.1%) |
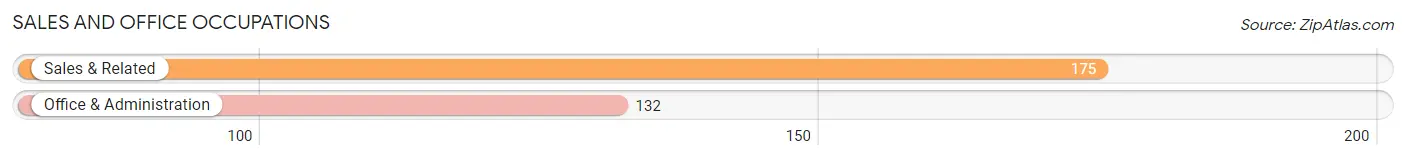
Sales and Office Occupations
The most common Sales and Office occupations in Santa Ynez are Sales & Related (175 | 7.7%), and Office & Administration (132 | 5.8%).
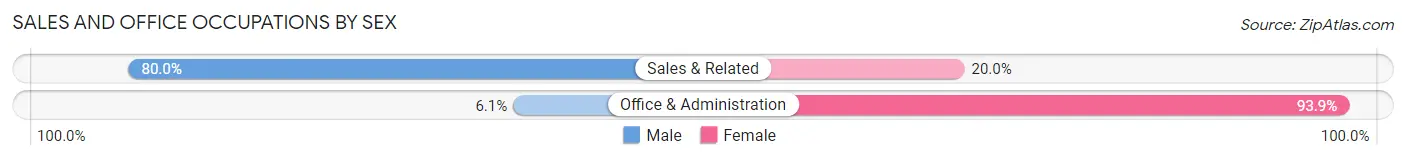
Sales and Office Occupations by Sex
| Occupation | Male | Female |
| Sales & Related | 140 (80.0%) | 35 (20.0%) |
| Office & Administration | 8 (6.1%) | 124 (93.9%) |
| Total (Category) | 148 (48.2%) | 159 (51.8%) |
| Total (Overall) | 1,264 (55.9%) | 995 (44.1%) |
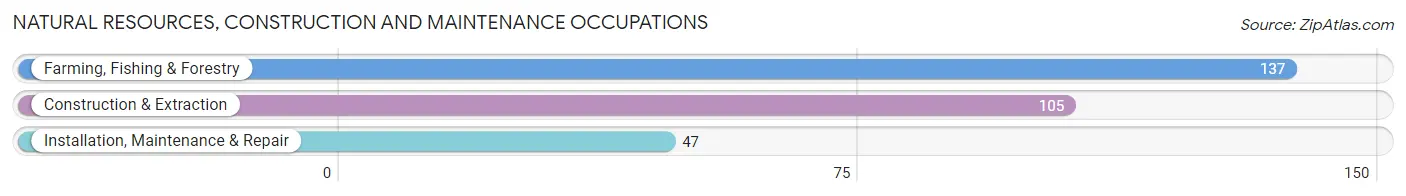
Natural Resources, Construction and Maintenance Occupations
The most common Natural Resources, Construction and Maintenance occupations in Santa Ynez are Farming, Fishing & Forestry (137 | 6.1%), Construction & Extraction (105 | 4.6%), and Installation, Maintenance & Repair (47 | 2.1%).
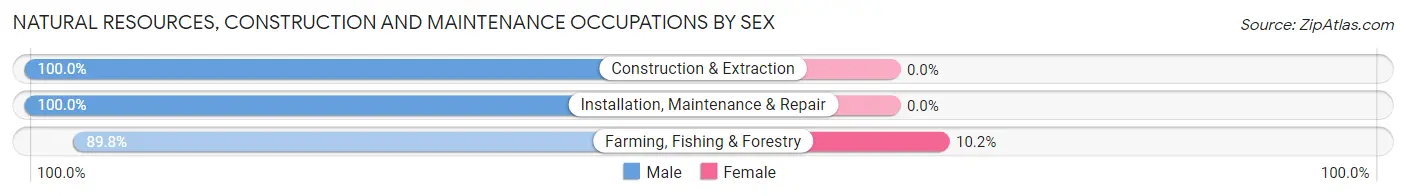
Natural Resources, Construction and Maintenance Occupations by Sex
| Occupation | Male | Female |
| Farming, Fishing & Forestry | 123 (89.8%) | 14 (10.2%) |
| Construction & Extraction | 105 (100.0%) | 0 (0.0%) |
| Installation, Maintenance & Repair | 47 (100.0%) | 0 (0.0%) |
| Total (Category) | 275 (95.2%) | 14 (4.8%) |
| Total (Overall) | 1,264 (55.9%) | 995 (44.1%) |
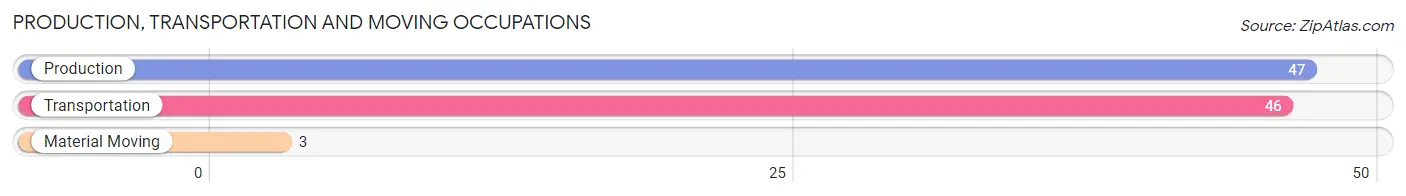
Production, Transportation and Moving Occupations
The most common Production, Transportation and Moving occupations in Santa Ynez are Production (47 | 2.1%), Transportation (46 | 2.0%), and Material Moving (3 | 0.1%).
Production, Transportation and Moving Occupations by Sex
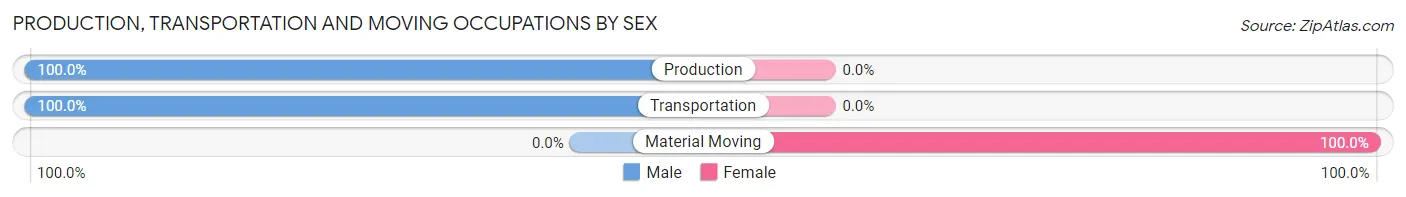
| Occupation | Male | Female |
| Production | 47 (100.0%) | 0 (0.0%) |
| Transportation | 46 (100.0%) | 0 (0.0%) |
| Material Moving | 0 (0.0%) | 3 (100.0%) |
| Total (Category) | 93 (96.9%) | 3 (3.1%) |
| Total (Overall) | 1,264 (55.9%) | 995 (44.1%) |
Employment Industries by Sex in Santa Ynez
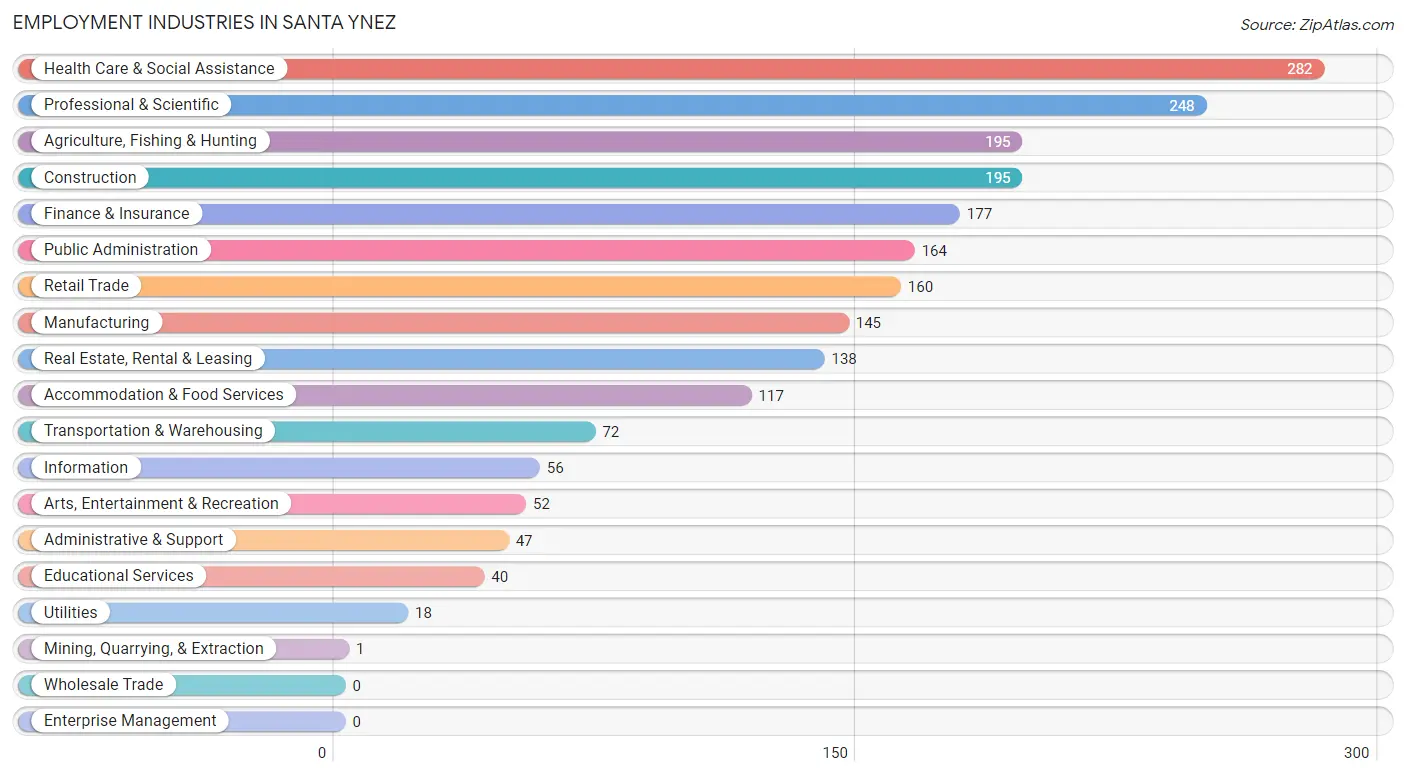
Employment Industries in Santa Ynez
The major employment industries in Santa Ynez include Health Care & Social Assistance (282 | 12.5%), Professional & Scientific (248 | 11.0%), Agriculture, Fishing & Hunting (195 | 8.6%), Construction (195 | 8.6%), and Finance & Insurance (177 | 7.8%).
Employment Industries by Sex in Santa Ynez
The Santa Ynez industries that see more men than women are Mining, Quarrying, & Extraction (100.0%), Manufacturing (100.0%), and Utilities (100.0%), whereas the industries that tend to have a higher number of women are Educational Services (100.0%), Arts, Entertainment & Recreation (100.0%), and Health Care & Social Assistance (87.2%).
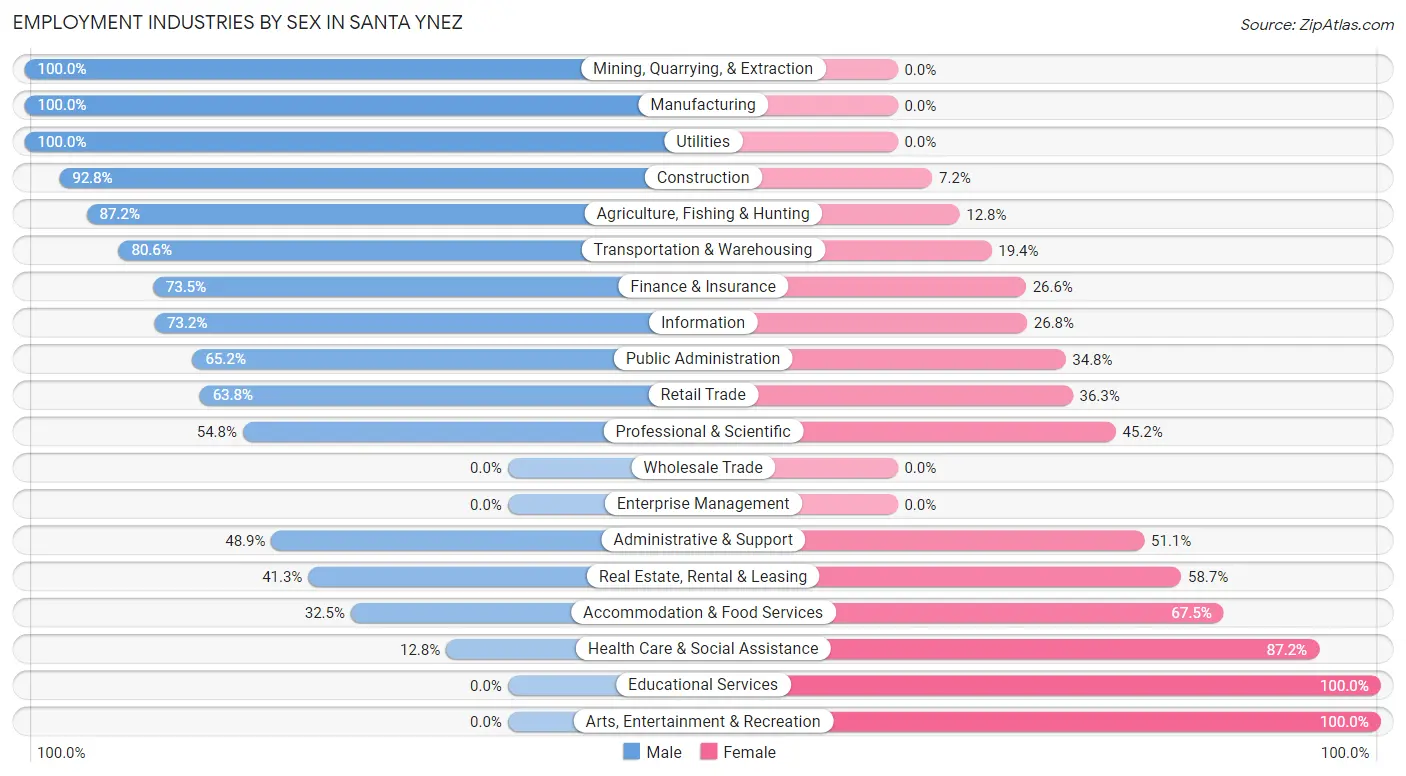
| Industry | Male | Female |
| Agriculture, Fishing & Hunting | 170 (87.2%) | 25 (12.8%) |
| Mining, Quarrying, & Extraction | 1 (100.0%) | 0 (0.0%) |
| Construction | 181 (92.8%) | 14 (7.2%) |
| Manufacturing | 145 (100.0%) | 0 (0.0%) |
| Wholesale Trade | 0 (0.0%) | 0 (0.0%) |
| Retail Trade | 102 (63.7%) | 58 (36.2%) |
| Transportation & Warehousing | 58 (80.6%) | 14 (19.4%) |
| Utilities | 18 (100.0%) | 0 (0.0%) |
| Information | 41 (73.2%) | 15 (26.8%) |
| Finance & Insurance | 130 (73.5%) | 47 (26.6%) |
| Real Estate, Rental & Leasing | 57 (41.3%) | 81 (58.7%) |
| Professional & Scientific | 136 (54.8%) | 112 (45.2%) |
| Enterprise Management | 0 (0.0%) | 0 (0.0%) |
| Administrative & Support | 23 (48.9%) | 24 (51.1%) |
| Educational Services | 0 (0.0%) | 40 (100.0%) |
| Health Care & Social Assistance | 36 (12.8%) | 246 (87.2%) |
| Arts, Entertainment & Recreation | 0 (0.0%) | 52 (100.0%) |
| Accommodation & Food Services | 38 (32.5%) | 79 (67.5%) |
| Public Administration | 107 (65.2%) | 57 (34.8%) |
| Total | 1,264 (55.9%) | 995 (44.1%) |
Education in Santa Ynez
School Enrollment in Santa Ynez
The most common levels of schooling among the 1,051 students in Santa Ynez are middle school (283 | 26.9%), college / undergraduate (233 | 22.2%), and high school (229 | 21.8%).
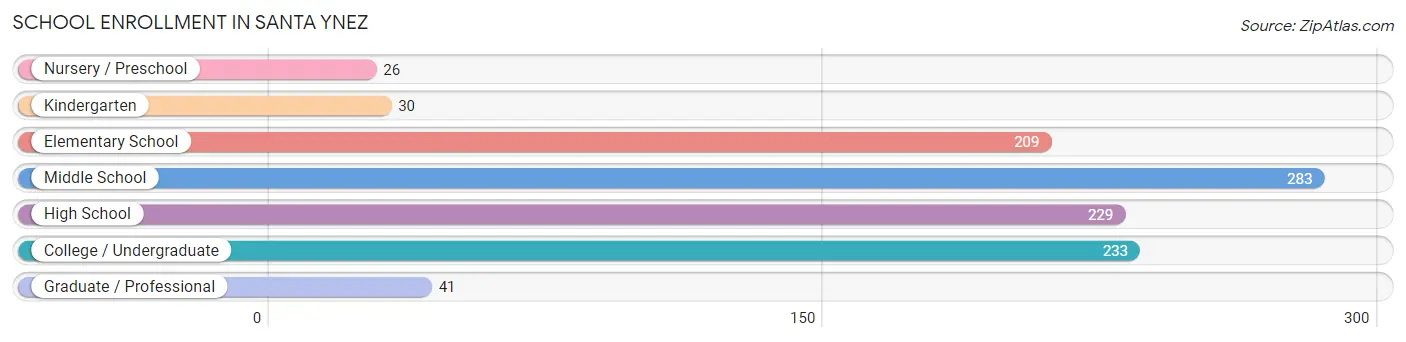
| School Level | # Students | % Students |
| Nursery / Preschool | 26 | 2.5% |
| Kindergarten | 30 | 2.9% |
| Elementary School | 209 | 19.9% |
| Middle School | 283 | 26.9% |
| High School | 229 | 21.8% |
| College / Undergraduate | 233 | 22.2% |
| Graduate / Professional | 41 | 3.9% |
| Total | 1,051 | 100.0% |
School Enrollment by Age by Funding Source in Santa Ynez
Out of a total of 1,051 students who are enrolled in schools in Santa Ynez, 206 (19.6%) attend a private institution, while the remaining 845 (80.4%) are enrolled in public schools. The age group of 3 to 4 year olds has the highest likelihood of being enrolled in private schools, with 23 (100.0% in the age bracket) enrolled. Conversely, the age group of 20 to 24 year olds has the lowest likelihood of being enrolled in a private school, with 47 (100.0% in the age bracket) attending a public institution.
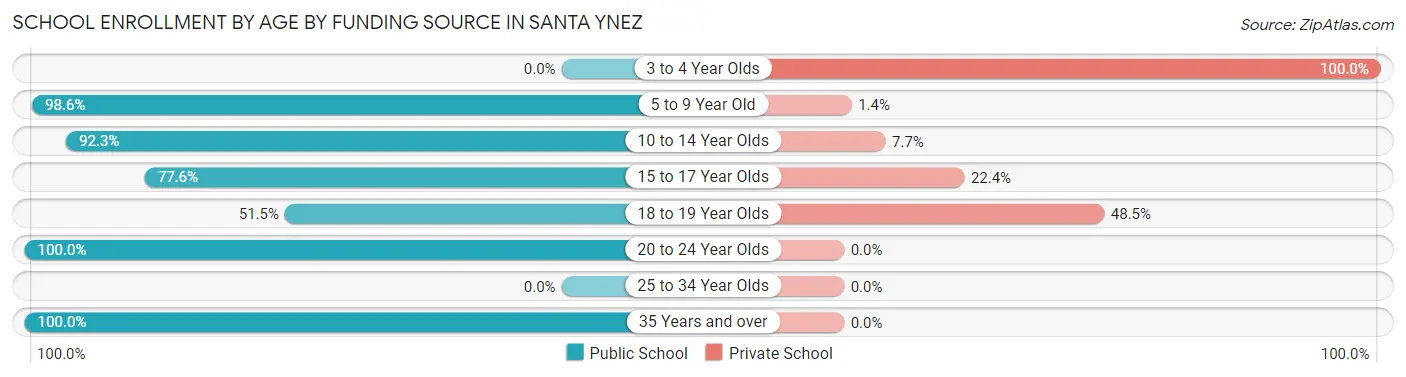
| Age Bracket | Public School | Private School |
| 3 to 4 Year Olds | 0 (0.0%) | 23 (100.0%) |
| 5 to 9 Year Old | 210 (98.6%) | 3 (1.4%) |
| 10 to 14 Year Olds | 311 (92.3%) | 26 (7.7%) |
| 15 to 17 Year Olds | 97 (77.6%) | 28 (22.4%) |
| 18 to 19 Year Olds | 134 (51.5%) | 126 (48.5%) |
| 20 to 24 Year Olds | 47 (100.0%) | 0 (0.0%) |
| 25 to 34 Year Olds | 0 (0.0%) | 0 (0.0%) |
| 35 Years and over | 46 (100.0%) | 0 (0.0%) |
| Total | 845 (80.4%) | 206 (19.6%) |
Educational Attainment by Field of Study in Santa Ynez
Business (219 | 18.1%), science & technology (137 | 11.3%), education (128 | 10.6%), computers & mathematics (114 | 9.4%), and visual & performing arts (98 | 8.1%) are the most common fields of study among 1,208 individuals in Santa Ynez who have obtained a bachelor's degree or higher.
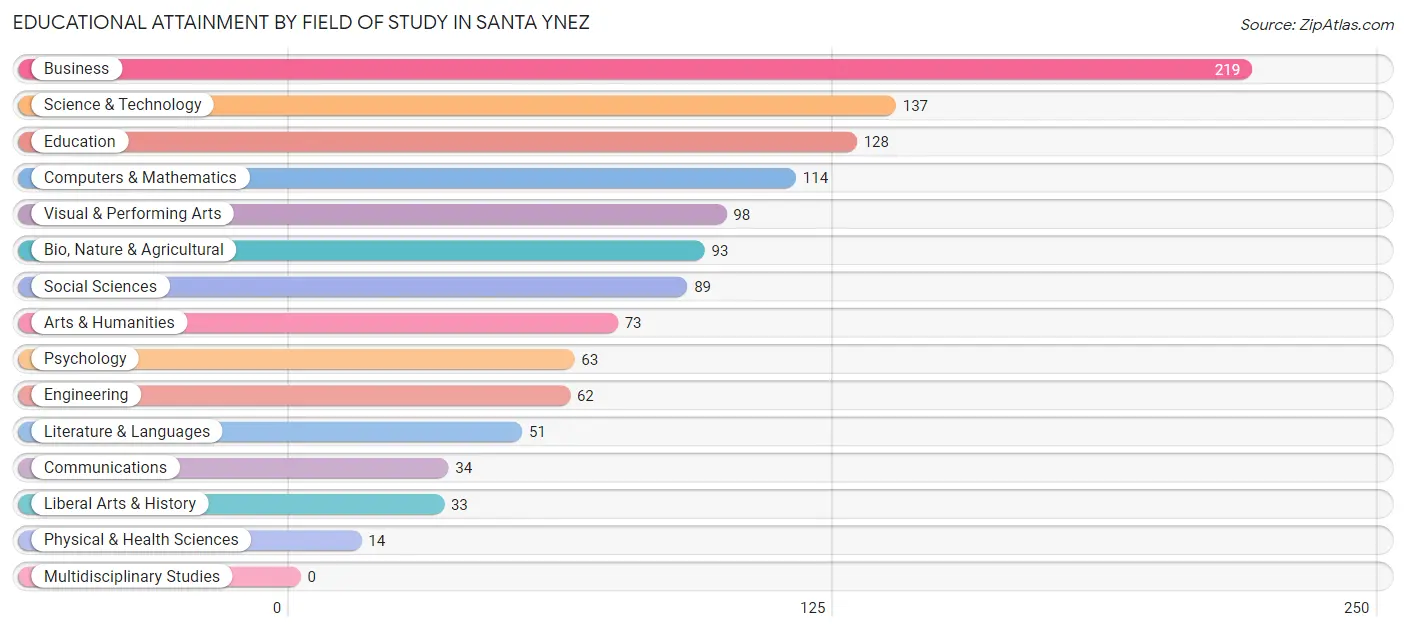
| Field of Study | # Graduates | % Graduates |
| Computers & Mathematics | 114 | 9.4% |
| Bio, Nature & Agricultural | 93 | 7.7% |
| Physical & Health Sciences | 14 | 1.2% |
| Psychology | 63 | 5.2% |
| Social Sciences | 89 | 7.4% |
| Engineering | 62 | 5.1% |
| Multidisciplinary Studies | 0 | 0.0% |
| Science & Technology | 137 | 11.3% |
| Business | 219 | 18.1% |
| Education | 128 | 10.6% |
| Literature & Languages | 51 | 4.2% |
| Liberal Arts & History | 33 | 2.7% |
| Visual & Performing Arts | 98 | 8.1% |
| Communications | 34 | 2.8% |
| Arts & Humanities | 73 | 6.0% |
| Total | 1,208 | 100.0% |
Transportation & Commute in Santa Ynez
Vehicle Availability by Sex in Santa Ynez
The most prevalent vehicle ownership categories in Santa Ynez are males with 3 vehicles (379, accounting for 30.2%) and females with 3 vehicles (251, making up 38.4%).
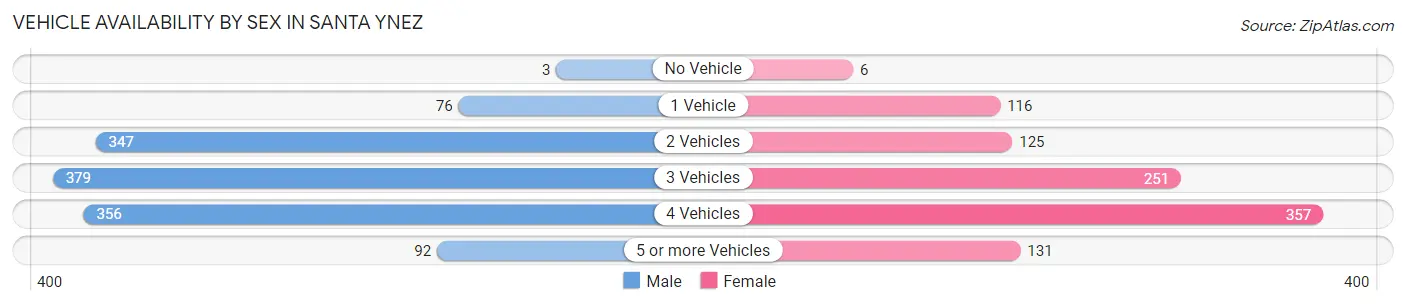
| Vehicles Available | Male | Female |
| No Vehicle | 3 (0.2%) | 6 (0.6%) |
| 1 Vehicle | 76 (6.1%) | 116 (11.8%) |
| 2 Vehicles | 347 (27.7%) | 125 (12.7%) |
| 3 Vehicles | 379 (30.2%) | 251 (25.5%) |
| 4 Vehicles | 356 (28.4%) | 357 (36.2%) |
| 5 or more Vehicles | 92 (7.3%) | 131 (13.3%) |
| Total | 1,253 (100.0%) | 986 (100.0%) |
Commute Time in Santa Ynez
The most frequently occuring commute durations in Santa Ynez are 10 to 14 minutes (327 commuters, 18.1%), 45 to 59 minutes (317 commuters, 17.6%), and 35 to 39 minutes (217 commuters, 12.0%).
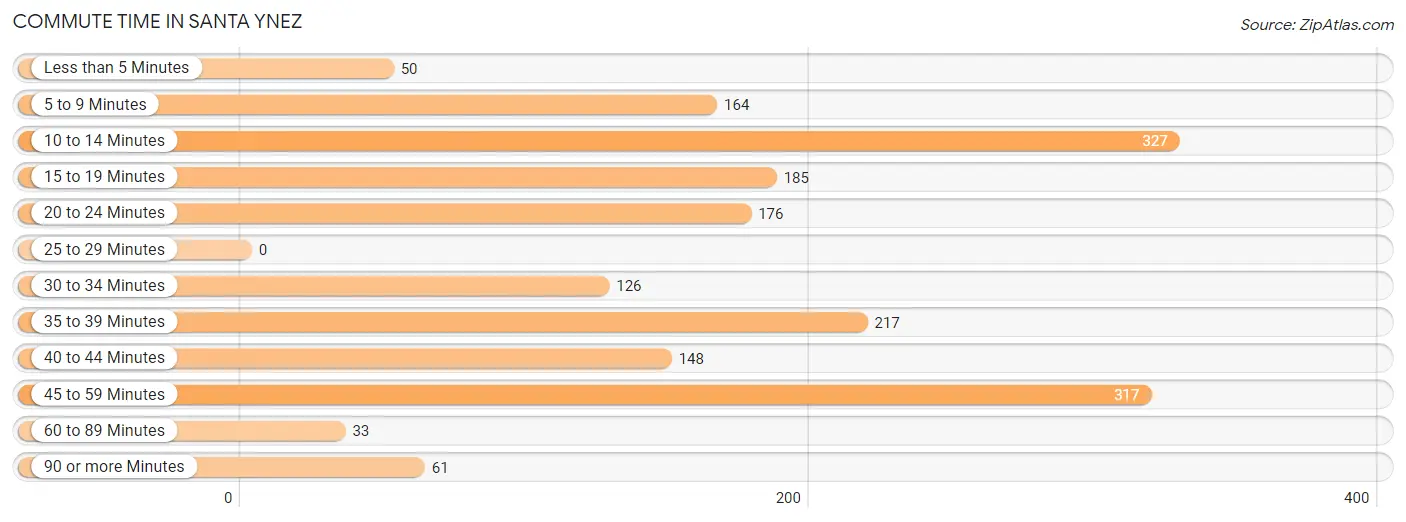
| Commute Time | # Commuters | % Commuters |
| Less than 5 Minutes | 50 | 2.8% |
| 5 to 9 Minutes | 164 | 9.1% |
| 10 to 14 Minutes | 327 | 18.1% |
| 15 to 19 Minutes | 185 | 10.2% |
| 20 to 24 Minutes | 176 | 9.8% |
| 25 to 29 Minutes | 0 | 0.0% |
| 30 to 34 Minutes | 126 | 7.0% |
| 35 to 39 Minutes | 217 | 12.0% |
| 40 to 44 Minutes | 148 | 8.2% |
| 45 to 59 Minutes | 317 | 17.6% |
| 60 to 89 Minutes | 33 | 1.8% |
| 90 or more Minutes | 61 | 3.4% |
Commute Time by Sex in Santa Ynez
The most common commute times in Santa Ynez are 45 to 59 minutes (212 commuters, 24.1%) for males and 10 to 14 minutes (261 commuters, 28.2%) for females.
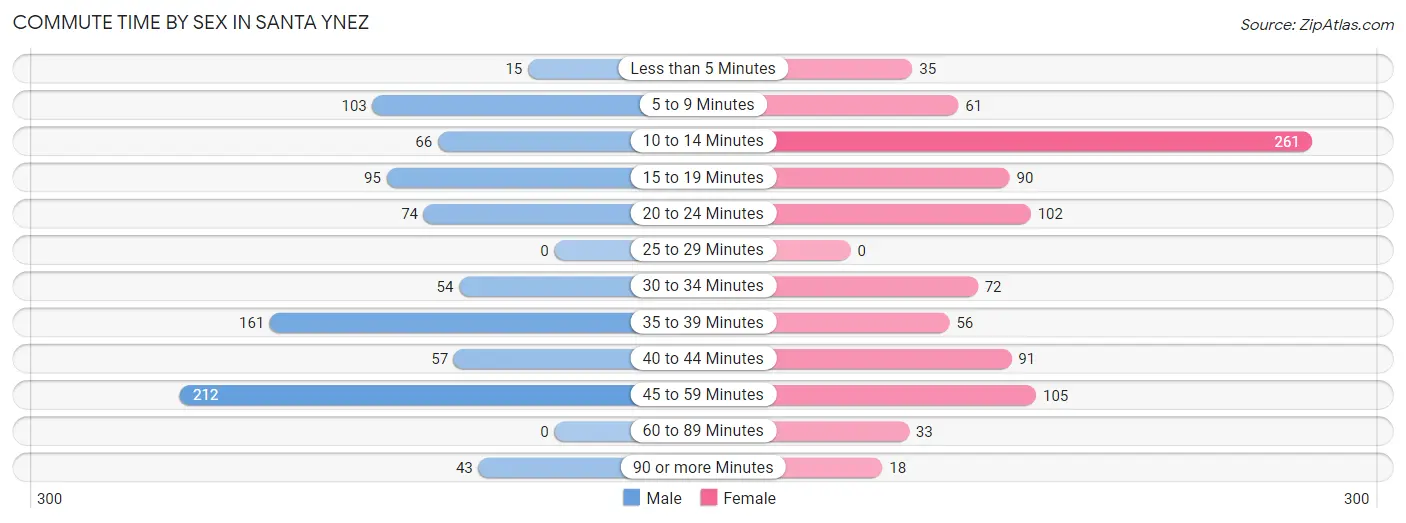
| Commute Time | Male | Female |
| Less than 5 Minutes | 15 (1.7%) | 35 (3.8%) |
| 5 to 9 Minutes | 103 (11.7%) | 61 (6.6%) |
| 10 to 14 Minutes | 66 (7.5%) | 261 (28.2%) |
| 15 to 19 Minutes | 95 (10.8%) | 90 (9.7%) |
| 20 to 24 Minutes | 74 (8.4%) | 102 (11.0%) |
| 25 to 29 Minutes | 0 (0.0%) | 0 (0.0%) |
| 30 to 34 Minutes | 54 (6.1%) | 72 (7.8%) |
| 35 to 39 Minutes | 161 (18.3%) | 56 (6.1%) |
| 40 to 44 Minutes | 57 (6.5%) | 91 (9.9%) |
| 45 to 59 Minutes | 212 (24.1%) | 105 (11.4%) |
| 60 to 89 Minutes | 0 (0.0%) | 33 (3.6%) |
| 90 or more Minutes | 43 (4.9%) | 18 (1.9%) |
Time of Departure to Work by Sex in Santa Ynez
The most frequent times of departure to work in Santa Ynez are 8:00 AM to 8:29 AM (303, 34.4%) for males and 8:00 AM to 8:29 AM (274, 29.6%) for females.
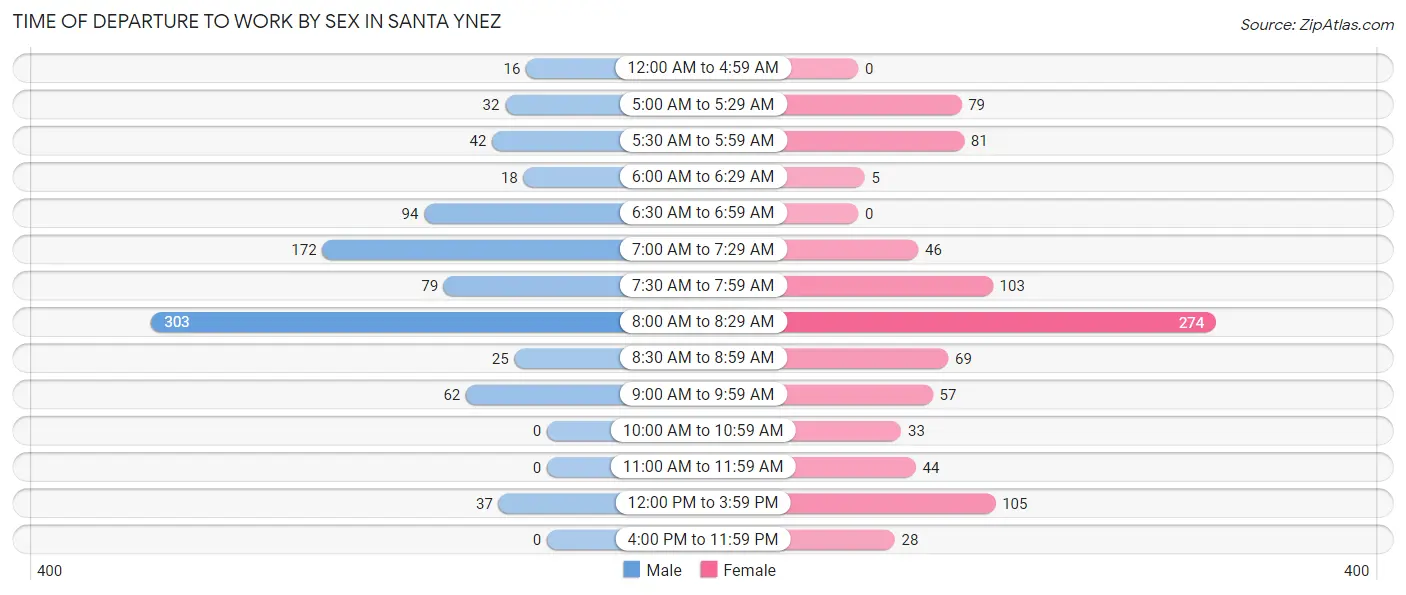
| Time of Departure | Male | Female |
| 12:00 AM to 4:59 AM | 16 (1.8%) | 0 (0.0%) |
| 5:00 AM to 5:29 AM | 32 (3.6%) | 79 (8.6%) |
| 5:30 AM to 5:59 AM | 42 (4.8%) | 81 (8.8%) |
| 6:00 AM to 6:29 AM | 18 (2.1%) | 5 (0.5%) |
| 6:30 AM to 6:59 AM | 94 (10.7%) | 0 (0.0%) |
| 7:00 AM to 7:29 AM | 172 (19.6%) | 46 (5.0%) |
| 7:30 AM to 7:59 AM | 79 (9.0%) | 103 (11.2%) |
| 8:00 AM to 8:29 AM | 303 (34.4%) | 274 (29.6%) |
| 8:30 AM to 8:59 AM | 25 (2.8%) | 69 (7.5%) |
| 9:00 AM to 9:59 AM | 62 (7.0%) | 57 (6.2%) |
| 10:00 AM to 10:59 AM | 0 (0.0%) | 33 (3.6%) |
| 11:00 AM to 11:59 AM | 0 (0.0%) | 44 (4.8%) |
| 12:00 PM to 3:59 PM | 37 (4.2%) | 105 (11.4%) |
| 4:00 PM to 11:59 PM | 0 (0.0%) | 28 (3.0%) |
| Total | 880 (100.0%) | 924 (100.0%) |
Housing Occupancy in Santa Ynez
Occupancy by Ownership in Santa Ynez
Of the total 1,829 dwellings in Santa Ynez, owner-occupied units account for 1,298 (71.0%), while renter-occupied units make up 531 (29.0%).
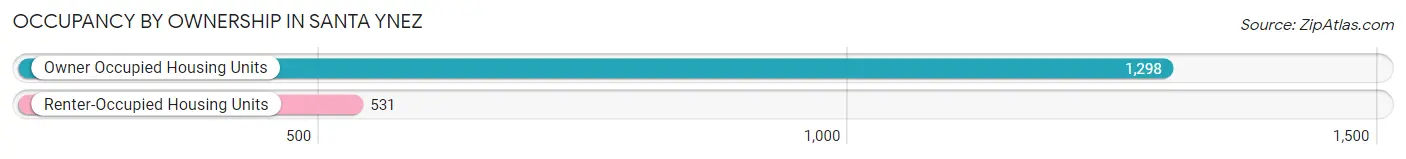
| Occupancy | # Housing Units | % Housing Units |
| Owner Occupied Housing Units | 1,298 | 71.0% |
| Renter-Occupied Housing Units | 531 | 29.0% |
| Total Occupied Housing Units | 1,829 | 100.0% |
Occupancy by Household Size in Santa Ynez
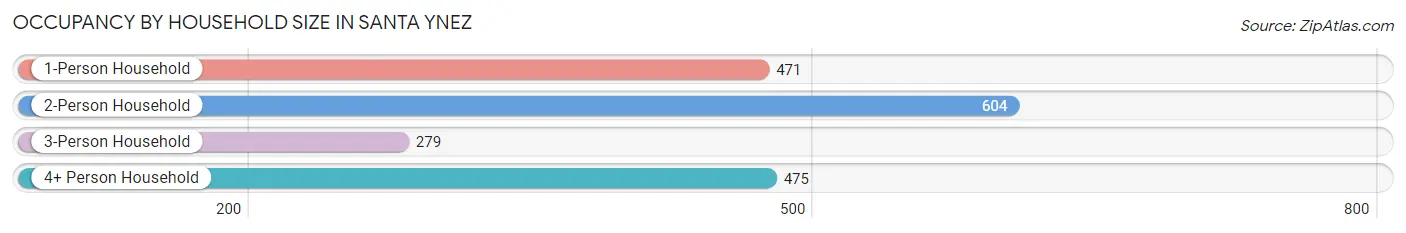
| Household Size | # Housing Units | % Housing Units |
| 1-Person Household | 471 | 25.8% |
| 2-Person Household | 604 | 33.0% |
| 3-Person Household | 279 | 15.2% |
| 4+ Person Household | 475 | 26.0% |
| Total Housing Units | 1,829 | 100.0% |
Occupancy by Ownership by Household Size in Santa Ynez
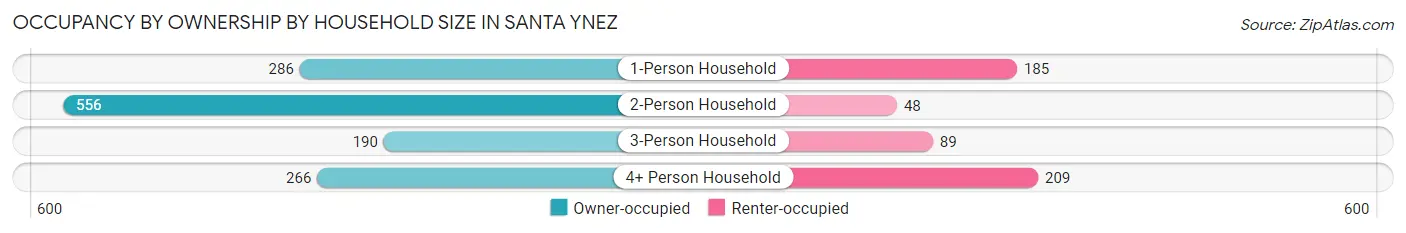
| Household Size | Owner-occupied | Renter-occupied |
| 1-Person Household | 286 (60.7%) | 185 (39.3%) |
| 2-Person Household | 556 (92.0%) | 48 (8.0%) |
| 3-Person Household | 190 (68.1%) | 89 (31.9%) |
| 4+ Person Household | 266 (56.0%) | 209 (44.0%) |
| Total Housing Units | 1,298 (71.0%) | 531 (29.0%) |
Occupancy by Educational Attainment in Santa Ynez
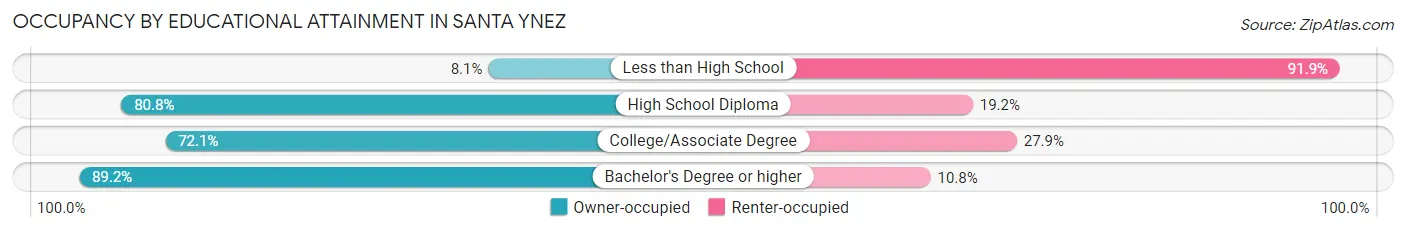
| Household Size | Owner-occupied | Renter-occupied |
| Less than High School | 18 (8.1%) | 205 (91.9%) |
| High School Diploma | 173 (80.8%) | 41 (19.2%) |
| College/Associate Degree | 569 (72.1%) | 220 (27.9%) |
| Bachelor's Degree or higher | 538 (89.2%) | 65 (10.8%) |
Occupancy by Age of Householder in Santa Ynez
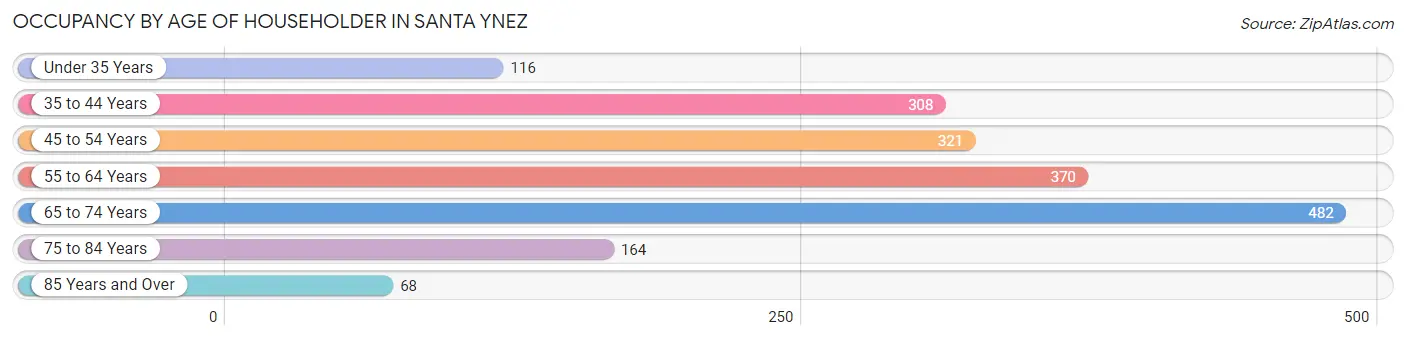
| Age Bracket | # Households | % Households |
| Under 35 Years | 116 | 6.3% |
| 35 to 44 Years | 308 | 16.8% |
| 45 to 54 Years | 321 | 17.5% |
| 55 to 64 Years | 370 | 20.2% |
| 65 to 74 Years | 482 | 26.4% |
| 75 to 84 Years | 164 | 9.0% |
| 85 Years and Over | 68 | 3.7% |
| Total | 1,829 | 100.0% |
Housing Finances in Santa Ynez
Median Income by Occupancy in Santa Ynez
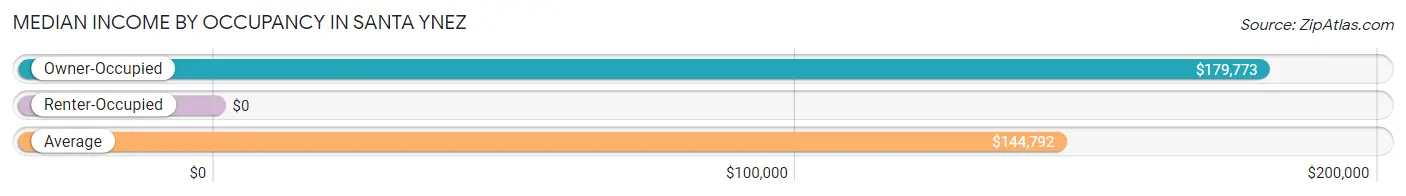
| Occupancy Type | # Households | Median Income |
| Owner-Occupied | 1,298 (71.0%) | $179,773 |
| Renter-Occupied | 531 (29.0%) | $0 |
| Average | 1,829 (100.0%) | $144,792 |
Occupancy by Householder Income Bracket in Santa Ynez
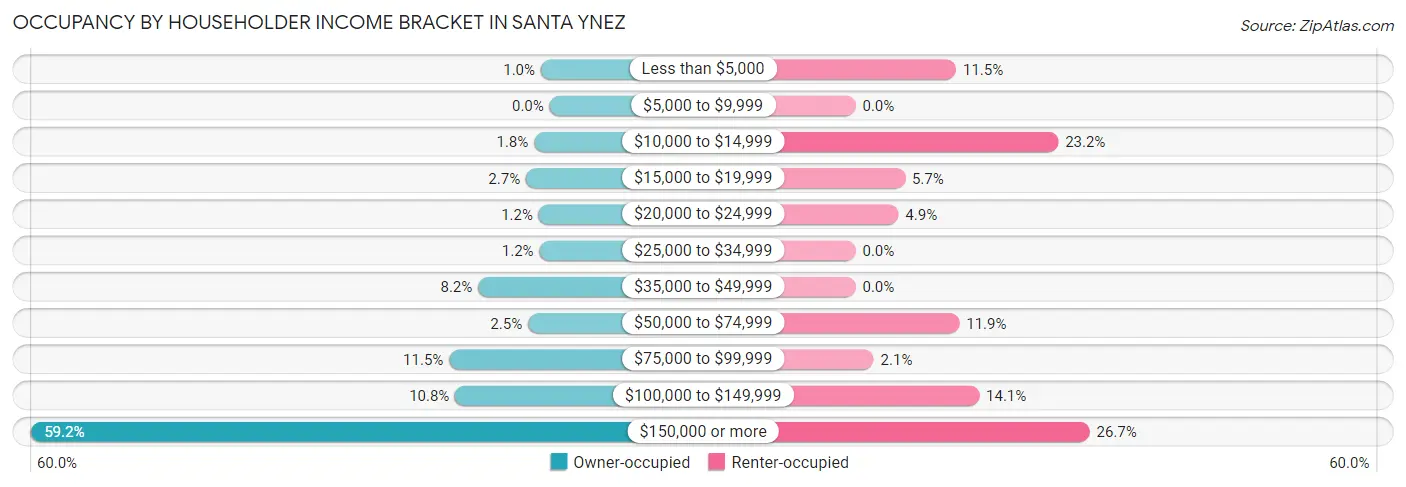
| Income Bracket | Owner-occupied | Renter-occupied |
| Less than $5,000 | 13 (1.0%) | 61 (11.5%) |
| $5,000 to $9,999 | 0 (0.0%) | 0 (0.0%) |
| $10,000 to $14,999 | 23 (1.8%) | 123 (23.2%) |
| $15,000 to $19,999 | 35 (2.7%) | 30 (5.7%) |
| $20,000 to $24,999 | 16 (1.2%) | 26 (4.9%) |
| $25,000 to $34,999 | 15 (1.2%) | 0 (0.0%) |
| $35,000 to $49,999 | 106 (8.2%) | 0 (0.0%) |
| $50,000 to $74,999 | 32 (2.5%) | 63 (11.9%) |
| $75,000 to $99,999 | 149 (11.5%) | 11 (2.1%) |
| $100,000 to $149,999 | 140 (10.8%) | 75 (14.1%) |
| $150,000 or more | 769 (59.2%) | 142 (26.7%) |
| Total | 1,298 (100.0%) | 531 (100.0%) |
Monthly Housing Cost Tiers in Santa Ynez
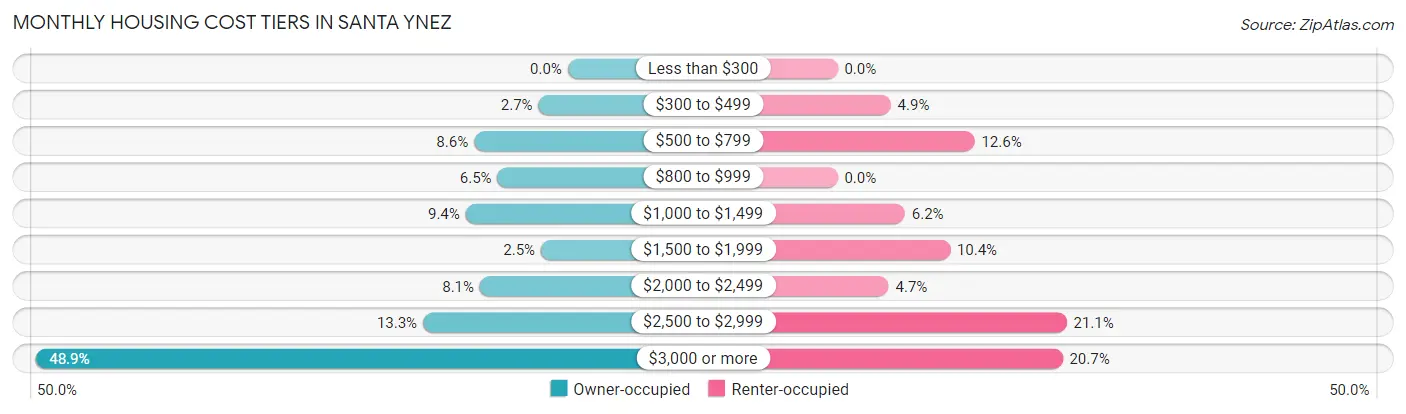
| Monthly Cost | Owner-occupied | Renter-occupied |
| Less than $300 | 0 (0.0%) | 0 (0.0%) |
| $300 to $499 | 35 (2.7%) | 26 (4.9%) |
| $500 to $799 | 112 (8.6%) | 67 (12.6%) |
| $800 to $999 | 84 (6.5%) | 0 (0.0%) |
| $1,000 to $1,499 | 122 (9.4%) | 33 (6.2%) |
| $1,500 to $1,999 | 32 (2.5%) | 55 (10.4%) |
| $2,000 to $2,499 | 105 (8.1%) | 25 (4.7%) |
| $2,500 to $2,999 | 173 (13.3%) | 112 (21.1%) |
| $3,000 or more | 635 (48.9%) | 110 (20.7%) |
| Total | 1,298 (100.0%) | 531 (100.0%) |
Physical Housing Characteristics in Santa Ynez
Housing Structures in Santa Ynez
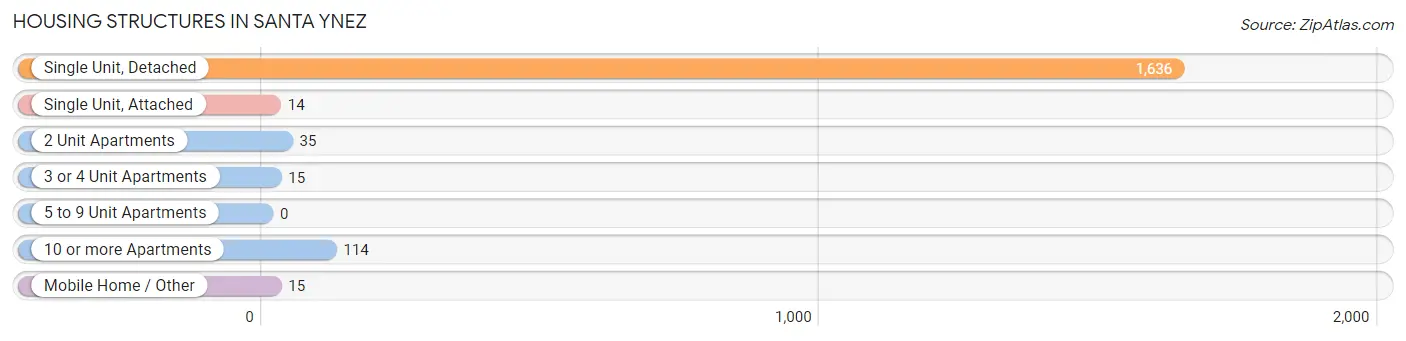
| Structure Type | # Housing Units | % Housing Units |
| Single Unit, Detached | 1,636 | 89.4% |
| Single Unit, Attached | 14 | 0.8% |
| 2 Unit Apartments | 35 | 1.9% |
| 3 or 4 Unit Apartments | 15 | 0.8% |
| 5 to 9 Unit Apartments | 0 | 0.0% |
| 10 or more Apartments | 114 | 6.2% |
| Mobile Home / Other | 15 | 0.8% |
| Total | 1,829 | 100.0% |
Housing Structures by Occupancy in Santa Ynez
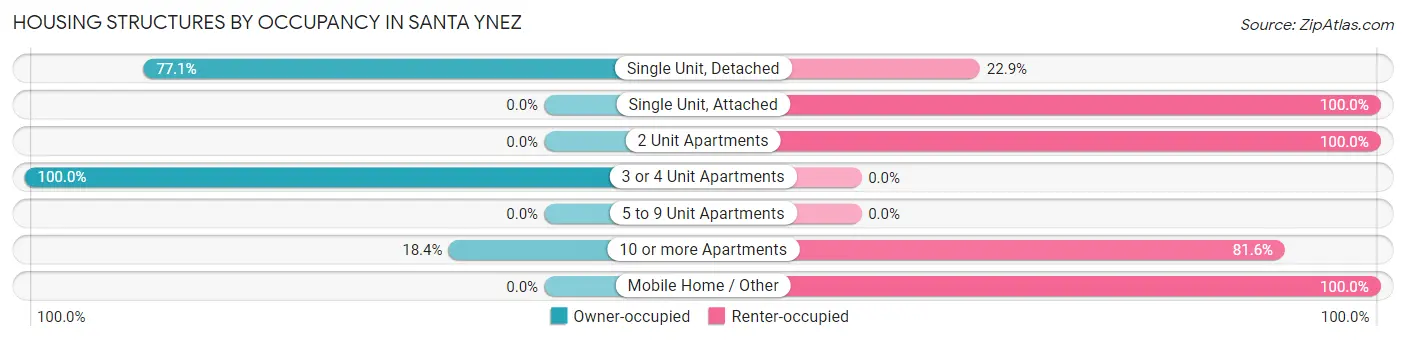
| Structure Type | Owner-occupied | Renter-occupied |
| Single Unit, Detached | 1,262 (77.1%) | 374 (22.9%) |
| Single Unit, Attached | 0 (0.0%) | 14 (100.0%) |
| 2 Unit Apartments | 0 (0.0%) | 35 (100.0%) |
| 3 or 4 Unit Apartments | 15 (100.0%) | 0 (0.0%) |
| 5 to 9 Unit Apartments | 0 (0.0%) | 0 (0.0%) |
| 10 or more Apartments | 21 (18.4%) | 93 (81.6%) |
| Mobile Home / Other | 0 (0.0%) | 15 (100.0%) |
| Total | 1,298 (71.0%) | 531 (29.0%) |
Housing Structures by Number of Rooms in Santa Ynez
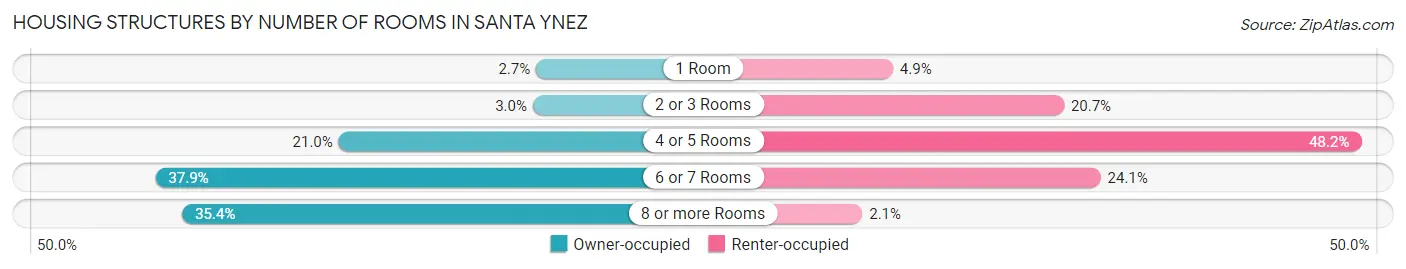
| Number of Rooms | Owner-occupied | Renter-occupied |
| 1 Room | 35 (2.7%) | 26 (4.9%) |
| 2 or 3 Rooms | 39 (3.0%) | 110 (20.7%) |
| 4 or 5 Rooms | 272 (21.0%) | 256 (48.2%) |
| 6 or 7 Rooms | 492 (37.9%) | 128 (24.1%) |
| 8 or more Rooms | 460 (35.4%) | 11 (2.1%) |
| Total | 1,298 (100.0%) | 531 (100.0%) |
Housing Structure by Heating Type in Santa Ynez
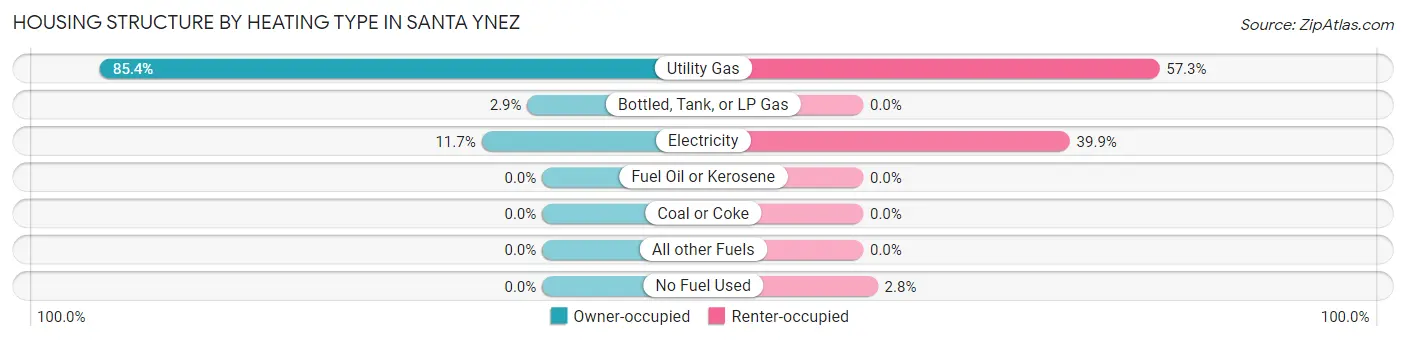
| Heating Type | Owner-occupied | Renter-occupied |
| Utility Gas | 1,109 (85.4%) | 304 (57.3%) |
| Bottled, Tank, or LP Gas | 37 (2.9%) | 0 (0.0%) |
| Electricity | 152 (11.7%) | 212 (39.9%) |
| Fuel Oil or Kerosene | 0 (0.0%) | 0 (0.0%) |
| Coal or Coke | 0 (0.0%) | 0 (0.0%) |
| All other Fuels | 0 (0.0%) | 0 (0.0%) |
| No Fuel Used | 0 (0.0%) | 15 (2.8%) |
| Total | 1,298 (100.0%) | 531 (100.0%) |
Household Vehicle Usage in Santa Ynez
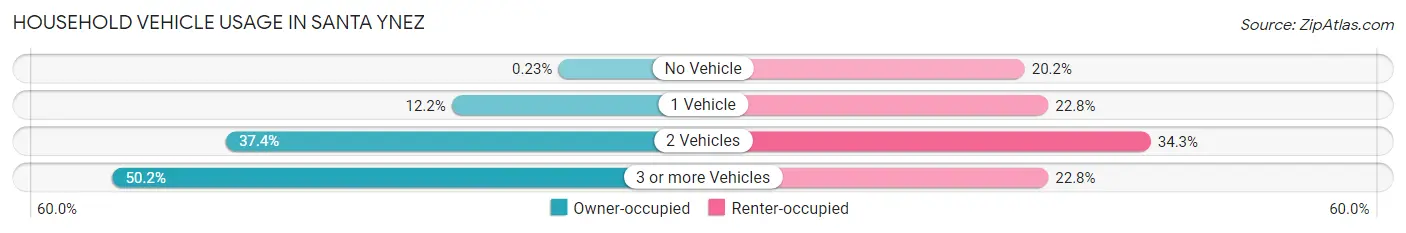
| Vehicles per Household | Owner-occupied | Renter-occupied |
| No Vehicle | 3 (0.2%) | 107 (20.2%) |
| 1 Vehicle | 158 (12.2%) | 121 (22.8%) |
| 2 Vehicles | 486 (37.4%) | 182 (34.3%) |
| 3 or more Vehicles | 651 (50.1%) | 121 (22.8%) |
| Total | 1,298 (100.0%) | 531 (100.0%) |
Real Estate & Mortgages in Santa Ynez
Real Estate and Mortgage Overview in Santa Ynez
| Characteristic | Without Mortgage | With Mortgage |
| Housing Units | 399 | 899 |
| Median Property Value | $979,300 | $1,089,100 |
| Median Household Income | $167,589 | $569 |
| Monthly Housing Costs | $977 | $601 |
| Real Estate Taxes | $7,065 | $0 |
Property Value by Mortgage Status in Santa Ynez
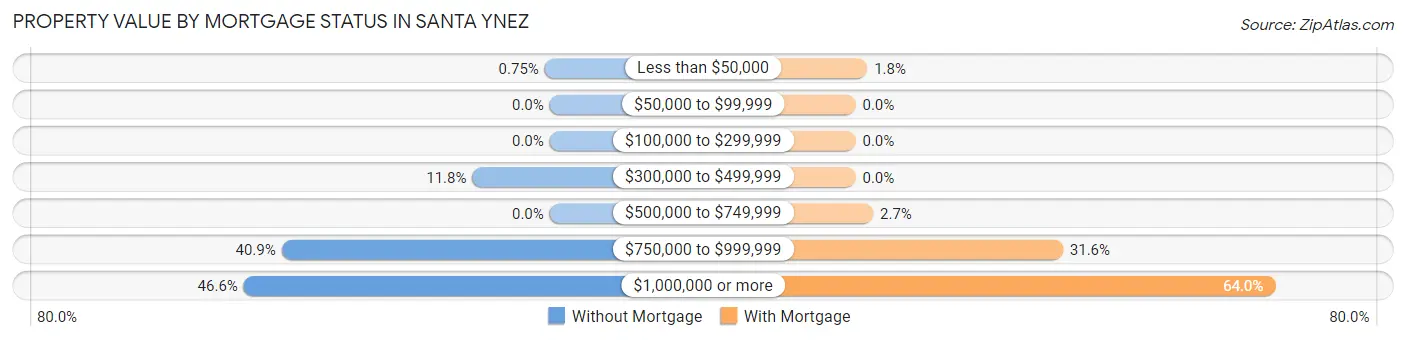
| Property Value | Without Mortgage | With Mortgage |
| Less than $50,000 | 3 (0.7%) | 16 (1.8%) |
| $50,000 to $99,999 | 0 (0.0%) | 0 (0.0%) |
| $100,000 to $299,999 | 0 (0.0%) | 0 (0.0%) |
| $300,000 to $499,999 | 47 (11.8%) | 0 (0.0%) |
| $500,000 to $749,999 | 0 (0.0%) | 24 (2.7%) |
| $750,000 to $999,999 | 163 (40.8%) | 284 (31.6%) |
| $1,000,000 or more | 186 (46.6%) | 575 (64.0%) |
| Total | 399 (100.0%) | 899 (100.0%) |
Household Income by Mortgage Status in Santa Ynez
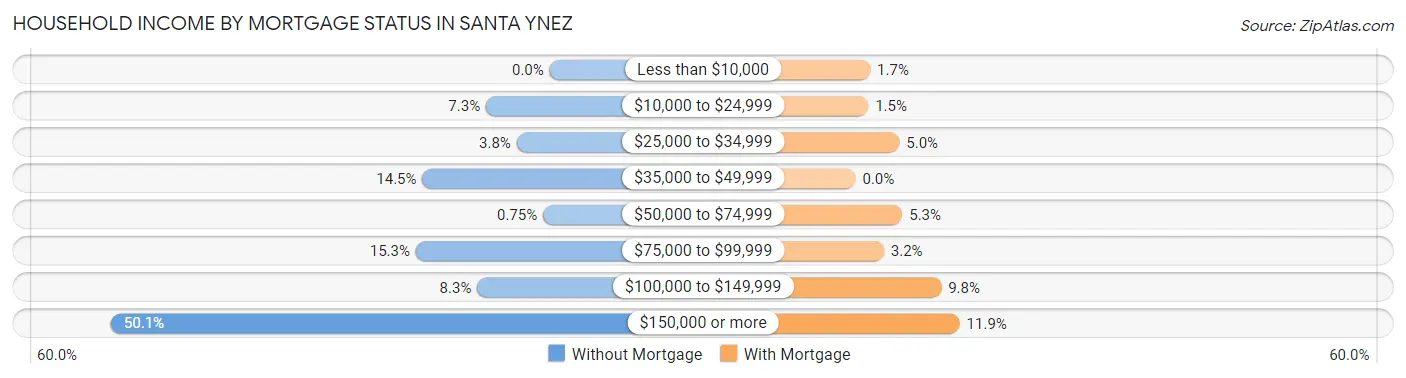
| Household Income | Without Mortgage | With Mortgage |
| Less than $10,000 | 0 (0.0%) | 15 (1.7%) |
| $10,000 to $24,999 | 29 (7.3%) | 13 (1.5%) |
| $25,000 to $34,999 | 15 (3.8%) | 45 (5.0%) |
| $35,000 to $49,999 | 58 (14.5%) | 0 (0.0%) |
| $50,000 to $74,999 | 3 (0.7%) | 48 (5.3%) |
| $75,000 to $99,999 | 61 (15.3%) | 29 (3.2%) |
| $100,000 to $149,999 | 33 (8.3%) | 88 (9.8%) |
| $150,000 or more | 200 (50.1%) | 107 (11.9%) |
| Total | 399 (100.0%) | 899 (100.0%) |
Property Value to Household Income Ratio in Santa Ynez
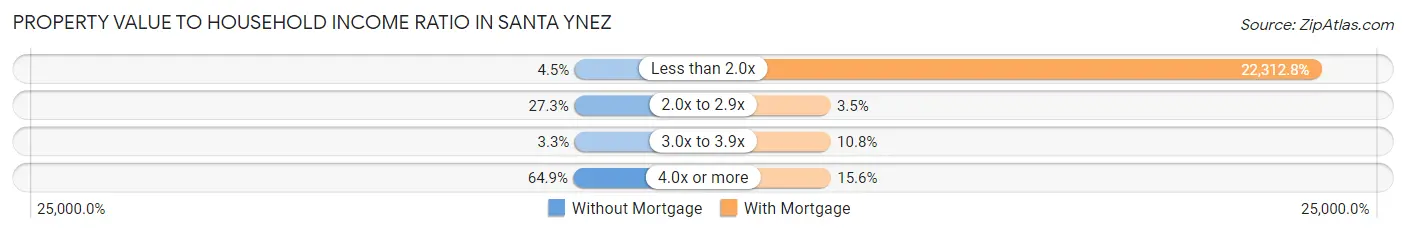
| Value-to-Income Ratio | Without Mortgage | With Mortgage |
| Less than 2.0x | 18 (4.5%) | 200,592 (22,312.8%) |
| 2.0x to 2.9x | 109 (27.3%) | 31 (3.5%) |
| 3.0x to 3.9x | 13 (3.3%) | 97 (10.8%) |
| 4.0x or more | 259 (64.9%) | 140 (15.6%) |
| Total | 399 (100.0%) | 899 (100.0%) |
Real Estate Taxes by Mortgage Status in Santa Ynez
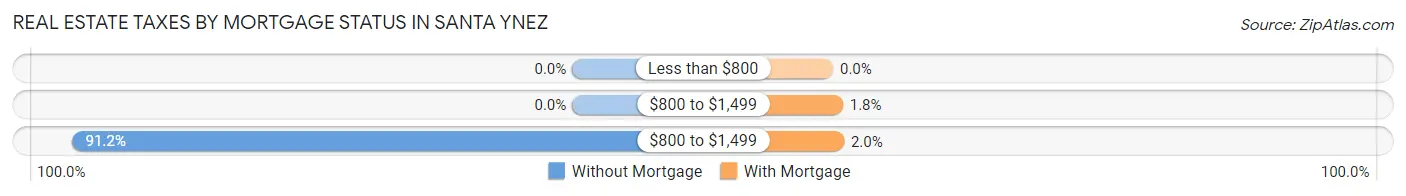
| Property Taxes | Without Mortgage | With Mortgage |
| Less than $800 | 0 (0.0%) | 0 (0.0%) |
| $800 to $1,499 | 0 (0.0%) | 16 (1.8%) |
| $800 to $1,499 | 364 (91.2%) | 18 (2.0%) |
| Total | 399 (100.0%) | 899 (100.0%) |
Health & Disability in Santa Ynez
Health Insurance Coverage by Age in Santa Ynez
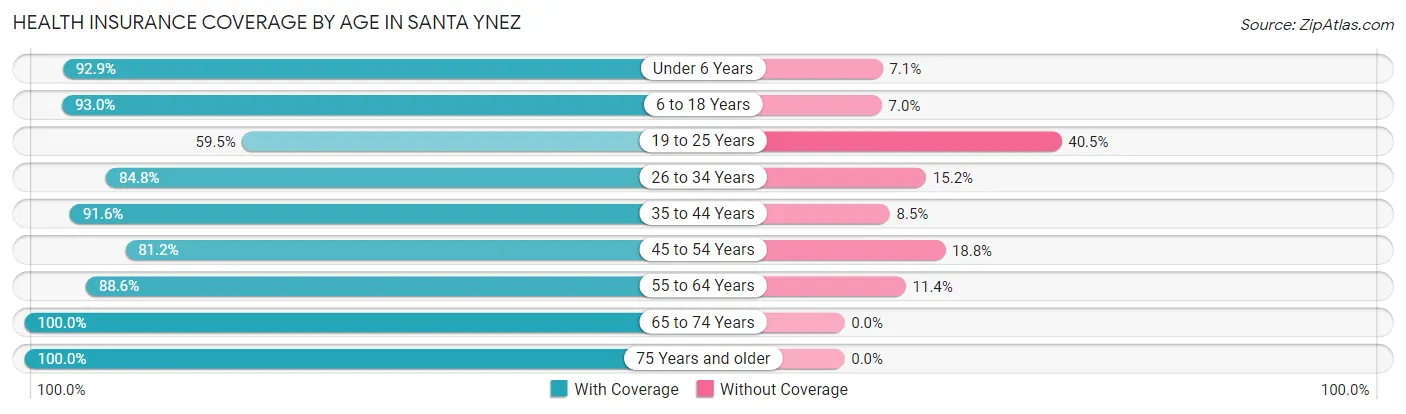
| Age Bracket | With Coverage | Without Coverage |
| Under 6 Years | 209 (92.9%) | 16 (7.1%) |
| 6 to 18 Years | 841 (93.0%) | 63 (7.0%) |
| 19 to 25 Years | 128 (59.5%) | 87 (40.5%) |
| 26 to 34 Years | 312 (84.8%) | 56 (15.2%) |
| 35 to 44 Years | 477 (91.5%) | 44 (8.5%) |
| 45 to 54 Years | 580 (81.2%) | 134 (18.8%) |
| 55 to 64 Years | 558 (88.6%) | 72 (11.4%) |
| 65 to 74 Years | 737 (100.0%) | 0 (0.0%) |
| 75 Years and older | 402 (100.0%) | 0 (0.0%) |
| Total | 4,244 (90.0%) | 472 (10.0%) |
Health Insurance Coverage by Citizenship Status in Santa Ynez
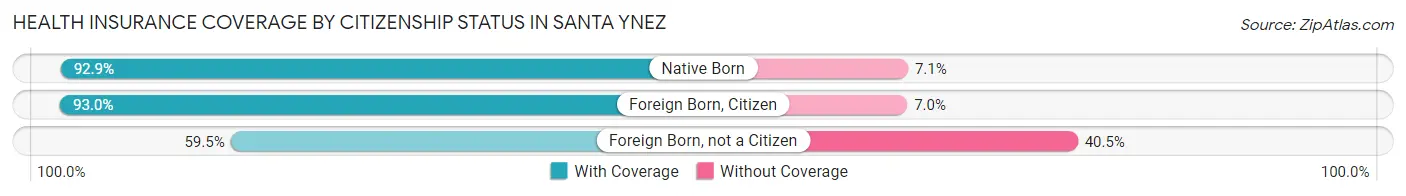
| Citizenship Status | With Coverage | Without Coverage |
| Native Born | 209 (92.9%) | 16 (7.1%) |
| Foreign Born, Citizen | 841 (93.0%) | 63 (7.0%) |
| Foreign Born, not a Citizen | 128 (59.5%) | 87 (40.5%) |
Health Insurance Coverage by Household Income in Santa Ynez
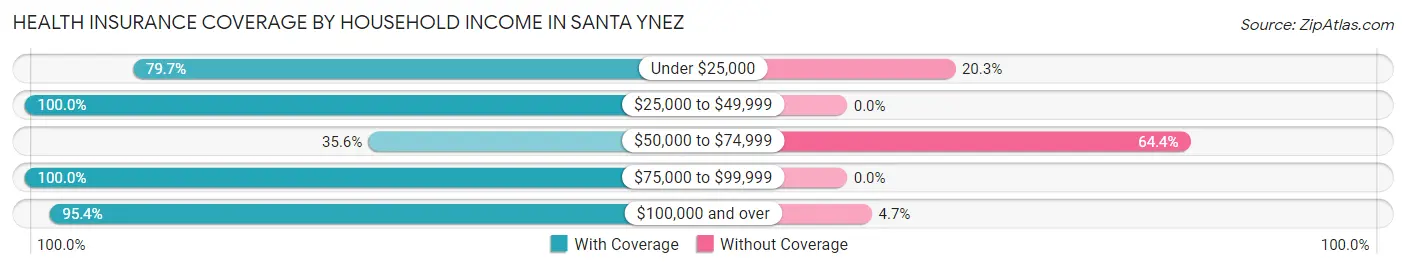
| Household Income | With Coverage | Without Coverage |
| Under $25,000 | 472 (79.7%) | 120 (20.3%) |
| $25,000 to $49,999 | 166 (100.0%) | 0 (0.0%) |
| $50,000 to $74,999 | 108 (35.6%) | 195 (64.4%) |
| $75,000 to $99,999 | 263 (100.0%) | 0 (0.0%) |
| $100,000 and over | 3,219 (95.4%) | 157 (4.6%) |
Public vs Private Health Insurance Coverage by Age in Santa Ynez
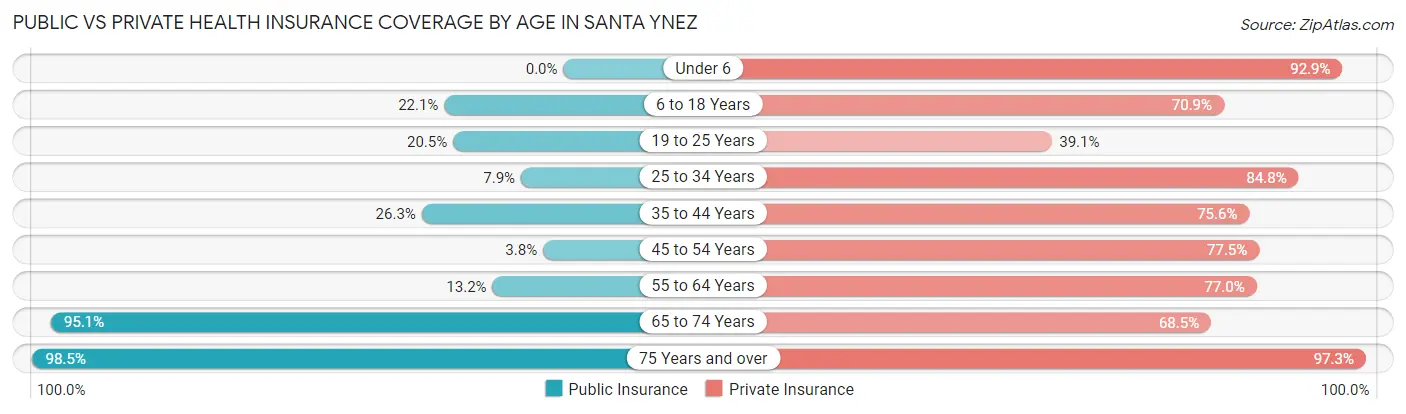
| Age Bracket | Public Insurance | Private Insurance |
| Under 6 | 0 (0.0%) | 209 (92.9%) |
| 6 to 18 Years | 200 (22.1%) | 641 (70.9%) |
| 19 to 25 Years | 44 (20.5%) | 84 (39.1%) |
| 25 to 34 Years | 29 (7.9%) | 312 (84.8%) |
| 35 to 44 Years | 137 (26.3%) | 394 (75.6%) |
| 45 to 54 Years | 27 (3.8%) | 553 (77.4%) |
| 55 to 64 Years | 83 (13.2%) | 485 (77.0%) |
| 65 to 74 Years | 701 (95.1%) | 505 (68.5%) |
| 75 Years and over | 396 (98.5%) | 391 (97.3%) |
| Total | 1,617 (34.3%) | 3,574 (75.8%) |
Disability Status by Sex by Age in Santa Ynez
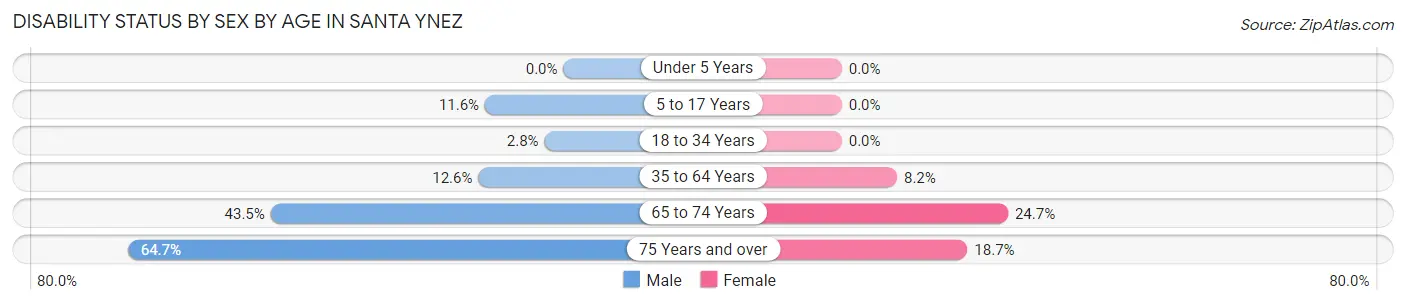
| Age Bracket | Male | Female |
| Under 5 Years | 0 (0.0%) | 0 (0.0%) |
| 5 to 17 Years | 39 (11.6%) | 0 (0.0%) |
| 18 to 34 Years | 15 (2.8%) | 0 (0.0%) |
| 35 to 64 Years | 120 (12.6%) | 75 (8.2%) |
| 65 to 74 Years | 153 (43.5%) | 95 (24.7%) |
| 75 Years and over | 97 (64.7%) | 47 (18.6%) |
Disability Class by Sex by Age in Santa Ynez
Disability Class: Hearing Difficulty
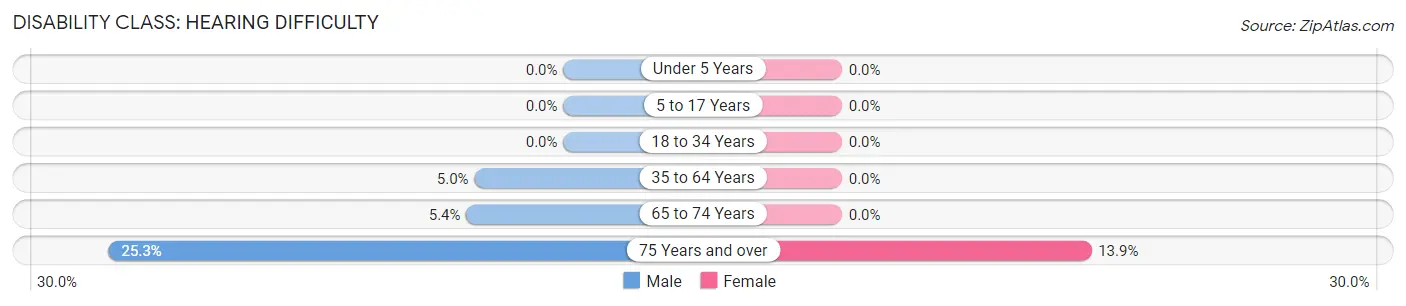
| Age Bracket | Male | Female |
| Under 5 Years | 0 (0.0%) | 0 (0.0%) |
| 5 to 17 Years | 0 (0.0%) | 0 (0.0%) |
| 18 to 34 Years | 0 (0.0%) | 0 (0.0%) |
| 35 to 64 Years | 47 (5.0%) | 0 (0.0%) |
| 65 to 74 Years | 19 (5.4%) | 0 (0.0%) |
| 75 Years and over | 38 (25.3%) | 35 (13.9%) |
Disability Class: Vision Difficulty
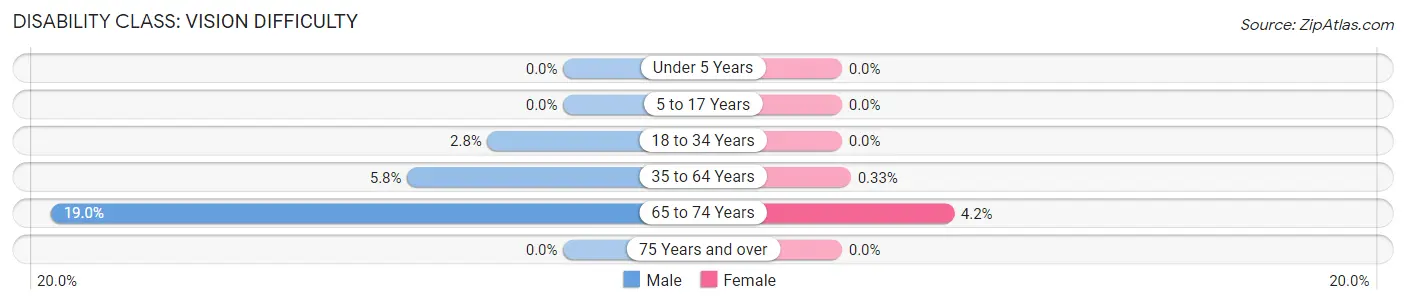
| Age Bracket | Male | Female |
| Under 5 Years | 0 (0.0%) | 0 (0.0%) |
| 5 to 17 Years | 0 (0.0%) | 0 (0.0%) |
| 18 to 34 Years | 15 (2.8%) | 0 (0.0%) |
| 35 to 64 Years | 55 (5.8%) | 3 (0.3%) |
| 65 to 74 Years | 67 (19.0%) | 16 (4.2%) |
| 75 Years and over | 0 (0.0%) | 0 (0.0%) |
Disability Class: Cognitive Difficulty
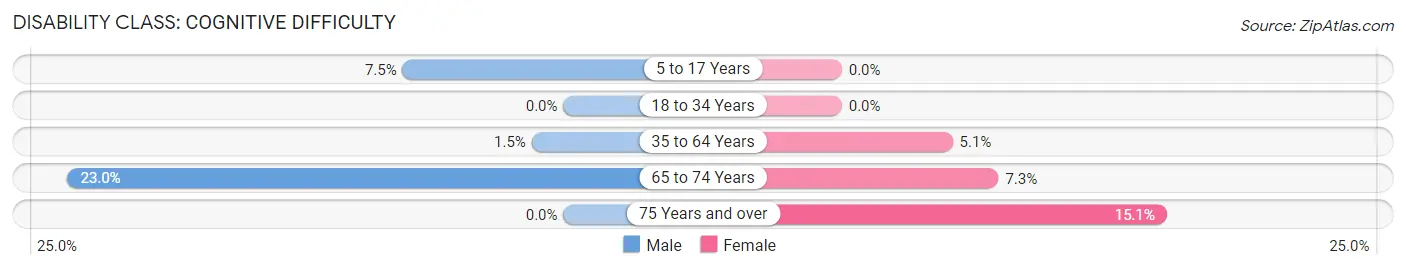
| Age Bracket | Male | Female |
| 5 to 17 Years | 25 (7.5%) | 0 (0.0%) |
| 18 to 34 Years | 0 (0.0%) | 0 (0.0%) |
| 35 to 64 Years | 14 (1.5%) | 47 (5.1%) |
| 65 to 74 Years | 81 (23.0%) | 28 (7.3%) |
| 75 Years and over | 0 (0.0%) | 38 (15.1%) |
Disability Class: Ambulatory Difficulty
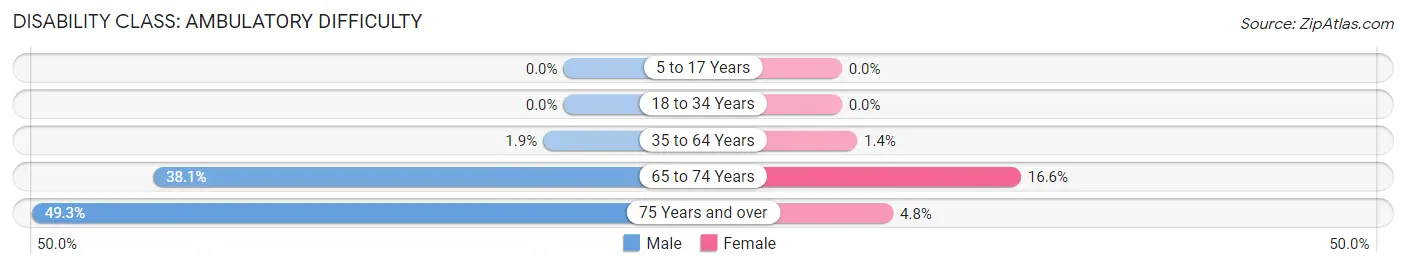
| Age Bracket | Male | Female |
| 5 to 17 Years | 0 (0.0%) | 0 (0.0%) |
| 18 to 34 Years | 0 (0.0%) | 0 (0.0%) |
| 35 to 64 Years | 18 (1.9%) | 13 (1.4%) |
| 65 to 74 Years | 134 (38.1%) | 64 (16.6%) |
| 75 Years and over | 74 (49.3%) | 12 (4.8%) |
Disability Class: Self-Care Difficulty
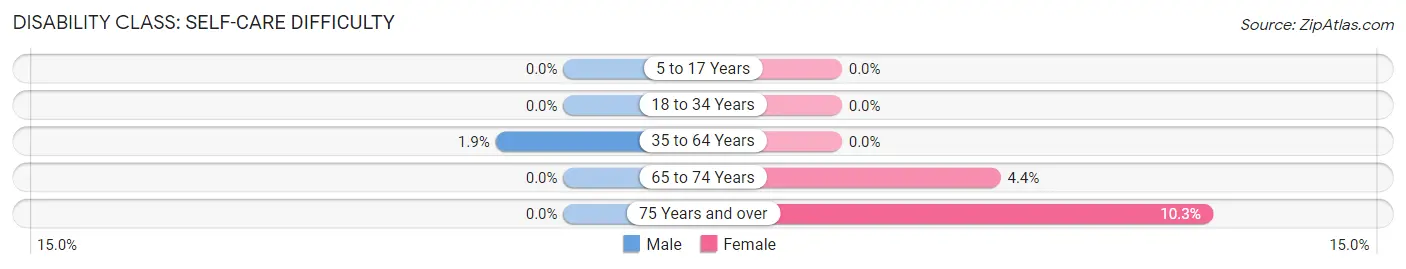
| Age Bracket | Male | Female |
| 5 to 17 Years | 0 (0.0%) | 0 (0.0%) |
| 18 to 34 Years | 0 (0.0%) | 0 (0.0%) |
| 35 to 64 Years | 18 (1.9%) | 0 (0.0%) |
| 65 to 74 Years | 0 (0.0%) | 17 (4.4%) |
| 75 Years and over | 0 (0.0%) | 26 (10.3%) |
Technology Access in Santa Ynez
Computing Device Access in Santa Ynez
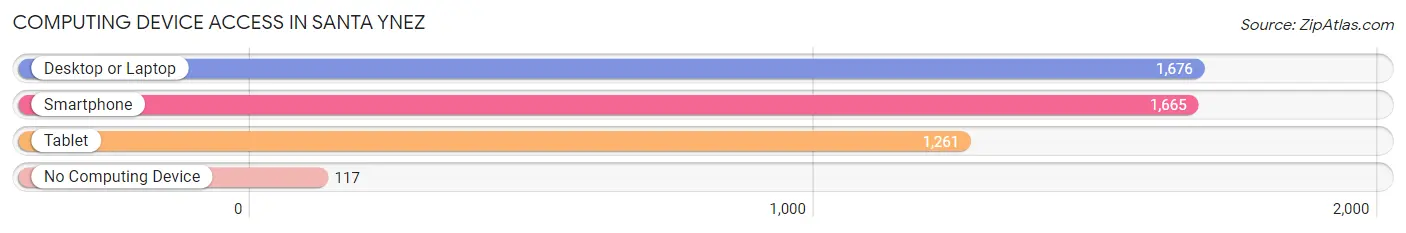
| Device Type | # Households | % Households |
| Desktop or Laptop | 1,676 | 91.6% |
| Smartphone | 1,665 | 91.0% |
| Tablet | 1,261 | 68.9% |
| No Computing Device | 117 | 6.4% |
| Total | 1,829 | 100.0% |
Internet Access in Santa Ynez
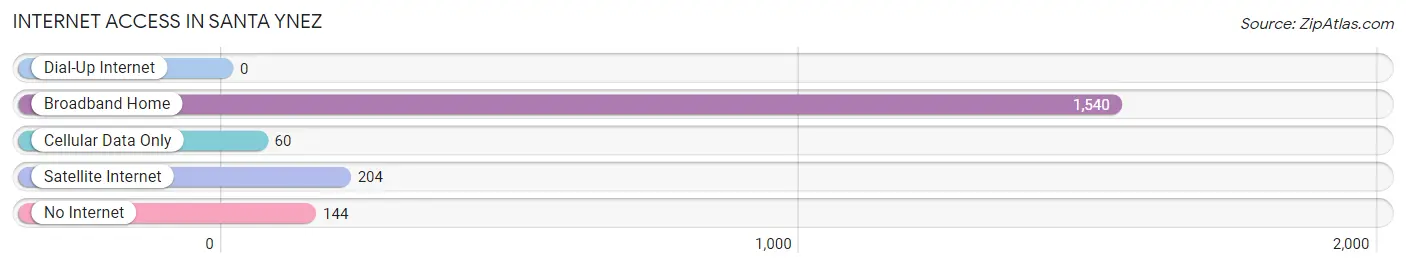
| Internet Type | # Households | % Households |
| Dial-Up Internet | 0 | 0.0% |
| Broadband Home | 1,540 | 84.2% |
| Cellular Data Only | 60 | 3.3% |
| Satellite Internet | 204 | 11.2% |
| No Internet | 144 | 7.9% |
| Total | 1,829 | 100.0% |
Santa Ynez Summary
Santa Ynez, CA is a small town located in the Santa Ynez Valley of Santa Barbara County, California. It is situated about 30 miles north of Santa Barbara and about 20 miles south of Solvang. The population of Santa Ynez was estimated to be 4,418 in 2019.
History
The Santa Ynez Valley was originally inhabited by the Chumash people, who were hunter-gatherers and fishermen. The first European settlers arrived in the area in the late 1700s, and the town of Santa Ynez was founded in 1804. The town was named after Saint Agnes of Rome, who was the patron saint of the Chumash people.
In the late 1800s, the Santa Ynez Valley became a popular destination for wealthy ranchers and farmers. The area was known for its fertile soil and mild climate, and it was home to some of the largest ranches in California. The town of Santa Ynez was incorporated in 1885.
In the early 1900s, the Santa Ynez Valley became a popular tourist destination. The area was known for its beautiful scenery and mild climate, and it was home to several resorts and spas. The town of Santa Ynez was also home to several wineries, which produced some of the finest wines in California.
Geography
Santa Ynez is located in the Santa Ynez Valley of Santa Barbara County, California. The town is situated about 30 miles north of Santa Barbara and about 20 miles south of Solvang. The Santa Ynez River runs through the town, and the Santa Ynez Mountains are located to the east.
The climate in Santa Ynez is Mediterranean, with mild winters and warm, dry summers. The average high temperature in July is 85°F, and the average low temperature in January is 45°F. The area receives an average of 15 inches of rain per year.
Economy
The economy of Santa Ynez is largely based on agriculture and tourism. The area is home to several wineries, which produce some of the finest wines in California. The town is also home to several resorts and spas, which attract tourists from all over the world.
In addition, Santa Ynez is home to several small businesses, including restaurants, shops, and art galleries. The town is also home to several horse ranches, which offer horseback riding and other equestrian activities.
Demographics
As of 2019, the population of Santa Ynez was estimated to be 4,418. The population is predominantly white (90.2%), followed by Hispanic or Latino (4.7%), Asian (2.2%), and African American (1.2%). The median household income in Santa Ynez is $77,917, and the median home value is $717,400.
Common Questions
What is Per Capita Income in Santa Ynez?
Per Capita income in Santa Ynez is $67,300.
What is the Median Family Income in Santa Ynez?
Median Family Income in Santa Ynez is $176,833.
What is the Median Household income in Santa Ynez?
Median Household Income in Santa Ynez is $144,792.
What is Income or Wage Gap in Santa Ynez?
Income or Wage Gap in Santa Ynez is 64.9%.
Women in Santa Ynez earn 35.1 cents for every dollar earned by a man.
What is Inequality or Gini Index in Santa Ynez?
Inequality or Gini Index in Santa Ynez is 0.47.
What is the Total Population of Santa Ynez?
Total Population of Santa Ynez is 4,716.
What is the Total Male Population of Santa Ynez?
Total Male Population of Santa Ynez is 2,378.
What is the Total Female Population of Santa Ynez?
Total Female Population of Santa Ynez is 2,338.
What is the Ratio of Males per 100 Females in Santa Ynez?
There are 101.71 Males per 100 Females in Santa Ynez.
What is the Ratio of Females per 100 Males in Santa Ynez?
There are 98.32 Females per 100 Males in Santa Ynez.
What is the Median Population Age in Santa Ynez?
Median Population Age in Santa Ynez is 47.0 Years.
What is the Average Family Size in Santa Ynez
Average Family Size in Santa Ynez is 3.0 People.
What is the Average Household Size in Santa Ynez
Average Household Size in Santa Ynez is 2.6 People.
How Large is the Labor Force in Santa Ynez?
There are 2,276 People in the Labor Forcein in Santa Ynez.
What is the Percentage of People in the Labor Force in Santa Ynez?
58.3% of People are in the Labor Force in Santa Ynez.
What is the Unemployment Rate in Santa Ynez?
Unemployment Rate in Santa Ynez is 0.7%.