Cities with the Highest Percentage of Population Employed in Legal Services & Support in North Dakota
RELATED REPORTS & OPTIONS
Legal Services & Support
North Dakota
Compare Cities
Map of Cities with the Highest Percentage of Population Employed in Legal Services & Support in North Dakota
0.0%
25.0%
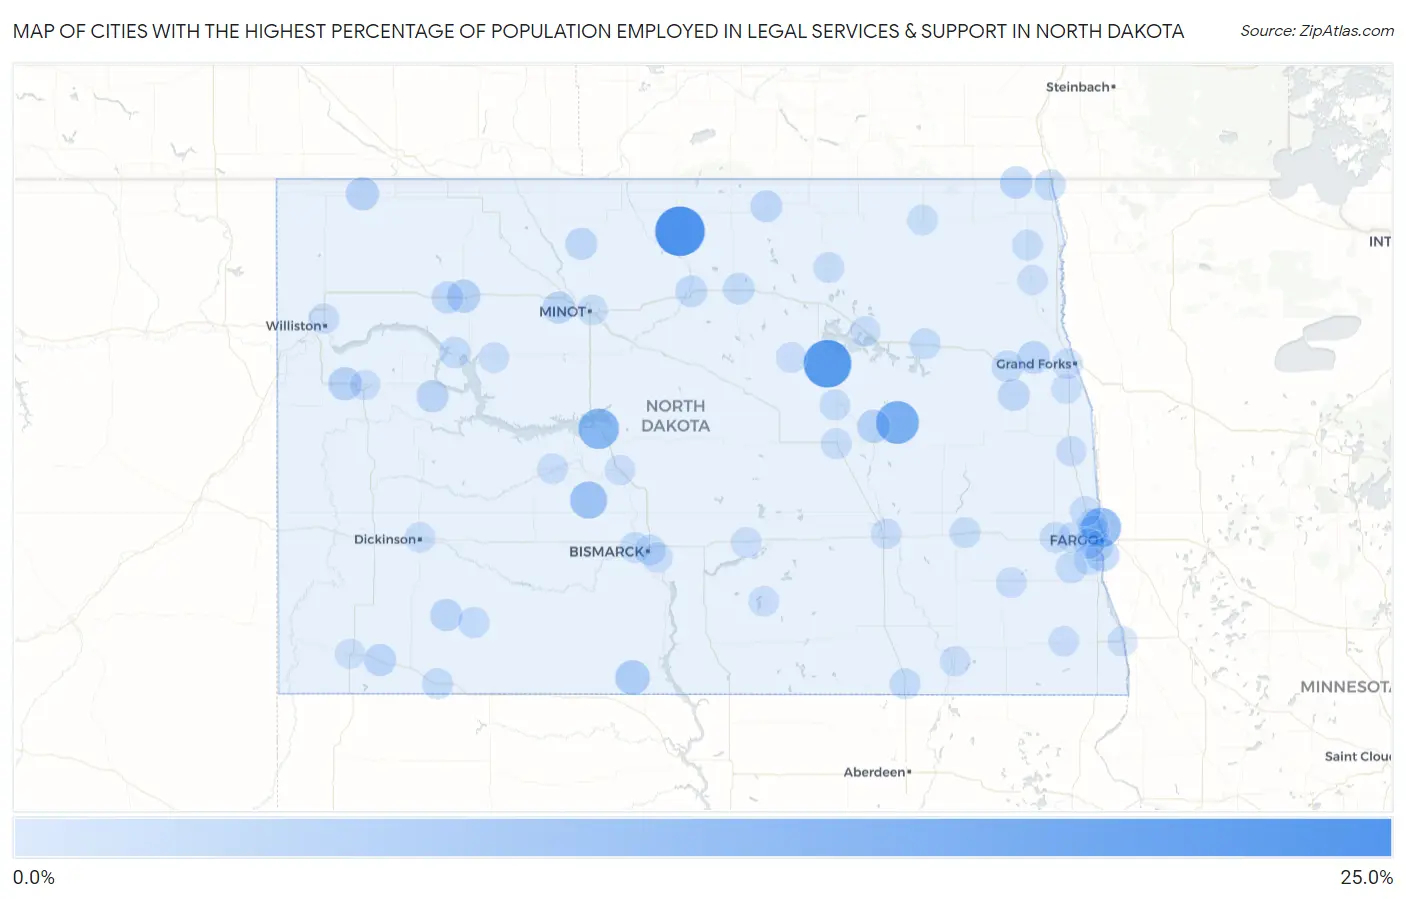
Cities with the Highest Percentage of Population Employed in Legal Services & Support in North Dakota
| City | % Employed | vs State | vs National | |
| 1. | Gardena | 22.2% | 0.59%(+21.6)#1 | 1.2%(+21.0)#48 |
| 2. | Oberon | 20.0% | 0.59%(+19.4)#2 | 1.2%(+18.8)#57 |
| 3. | Mchenry | 14.3% | 0.59%(+13.7)#3 | 1.2%(+13.1)#117 |
| 4. | Coleharbor | 11.5% | 0.59%(+10.9)#4 | 1.2%(+10.4)#167 |
| 5. | North River | 10.5% | 0.59%(+9.94)#5 | 1.2%(+9.34)#197 |
| 6. | Center | 7.8% | 0.59%(+7.24)#6 | 1.2%(+6.65)#350 |
| 7. | Selfridge | 5.1% | 0.59%(+4.46)#7 | 1.2%(+3.87)#831 |
| 8. | Arnegard | 3.5% | 0.59%(+2.94)#8 | 1.2%(+2.35)#1,513 |
| 9. | Stanley | 3.5% | 0.59%(+2.90)#9 | 1.2%(+2.30)#1,544 |
| 10. | Grace City | 3.3% | 0.59%(+2.74)#10 | 1.2%(+2.15)#1,657 |
| 11. | Crosby | 3.2% | 0.59%(+2.66)#11 | 1.2%(+2.06)#1,718 |
| 12. | Briarwood | 3.2% | 0.59%(+2.64)#12 | 1.2%(+2.04)#1,739 |
| 13. | Grand Forks Afb | 2.8% | 0.59%(+2.21)#13 | 1.2%(+1.62)#2,126 |
| 14. | Neche | 2.5% | 0.59%(+1.91)#14 | 1.2%(+1.32)#2,443 |
| 15. | Mandaree | 2.4% | 0.59%(+1.76)#15 | 1.2%(+1.17)#2,646 |
| 16. | Regent | 2.2% | 0.59%(+1.61)#16 | 1.2%(+1.01)#2,872 |
| 17. | Scranton | 2.2% | 0.59%(+1.58)#17 | 1.2%(+0.990)#2,918 |
| 18. | Des Lacs | 2.2% | 0.59%(+1.58)#18 | 1.2%(+0.990)#2,920 |
| 19. | Lansford | 2.0% | 0.59%(+1.41)#19 | 1.2%(+0.816)#3,218 |
| 20. | Ross | 1.9% | 0.59%(+1.33)#20 | 1.2%(+0.739)#3,360 |
| 21. | Belcourt | 1.9% | 0.59%(+1.30)#21 | 1.2%(+0.709)#3,419 |
| 22. | Northwood | 1.8% | 0.59%(+1.25)#22 | 1.2%(+0.655)#3,537 |
| 23. | Larimore | 1.7% | 0.59%(+1.12)#23 | 1.2%(+0.522)#3,874 |
| 24. | Rugby | 1.6% | 0.59%(+0.996)#24 | 1.2%(+0.401)#4,161 |
| 25. | Reile S Acres | 1.6% | 0.59%(+0.967)#25 | 1.2%(+0.373)#4,235 |
| 26. | Towner | 1.5% | 0.59%(+0.911)#26 | 1.2%(+0.316)#4,409 |
| 27. | New Town | 1.3% | 0.59%(+0.717)#27 | 1.2%(+0.122)#5,041 |
| 28. | Davenport | 1.3% | 0.59%(+0.661)#28 | 1.2%(+0.066)#5,261 |
| 29. | Pembina | 1.2% | 0.59%(+0.601)#29 | 1.2%(+0.007)#5,490 |
| 30. | Hettinger | 1.1% | 0.59%(+0.545)#30 | 1.2%(-0.050)#5,714 |
| 31. | Mott | 1.1% | 0.59%(+0.490)#31 | 1.2%(-0.105)#5,970 |
| 32. | Ellendale | 1.1% | 0.59%(+0.475)#32 | 1.2%(-0.120)#6,045 |
| 33. | Lakota | 1.1% | 0.59%(+0.475)#33 | 1.2%(-0.120)#6,046 |
| 34. | Mandan | 0.91% | 0.59%(+0.317)#34 | 1.2%(-0.277)#6,852 |
| 35. | New Rockford | 0.88% | 0.59%(+0.287)#35 | 1.2%(-0.308)#7,006 |
| 36. | Cando | 0.87% | 0.59%(+0.276)#36 | 1.2%(-0.319)#7,067 |
| 37. | Casselton | 0.86% | 0.59%(+0.271)#37 | 1.2%(-0.324)#7,093 |
| 38. | Bismarck | 0.85% | 0.59%(+0.264)#38 | 1.2%(-0.331)#7,134 |
| 39. | Fargo | 0.83% | 0.59%(+0.239)#39 | 1.2%(-0.355)#7,254 |
| 40. | Carrington | 0.78% | 0.59%(+0.193)#40 | 1.2%(-0.401)#7,531 |
| 41. | Valley City | 0.76% | 0.59%(+0.175)#41 | 1.2%(-0.420)#7,652 |
| 42. | Mapleton | 0.73% | 0.59%(+0.145)#42 | 1.2%(-0.450)#7,845 |
| 43. | St Thomas | 0.68% | 0.59%(+0.091)#43 | 1.2%(-0.504)#8,222 |
| 44. | Enderlin | 0.66% | 0.59%(+0.070)#44 | 1.2%(-0.524)#8,360 |
| 45. | Maddock | 0.65% | 0.59%(+0.056)#45 | 1.2%(-0.539)#8,451 |
| 46. | Grand Forks | 0.64% | 0.59%(+0.047)#46 | 1.2%(-0.547)#8,509 |
| 47. | Langdon | 0.63% | 0.59%(+0.044)#47 | 1.2%(-0.551)#8,551 |
| 48. | Hazen | 0.60% | 0.59%(+0.015)#48 | 1.2%(-0.580)#8,749 |
| 49. | Lincoln | 0.58% | 0.59%(-0.009)#49 | 1.2%(-0.603)#8,938 |
| 50. | Minot | 0.57% | 0.59%(-0.022)#50 | 1.2%(-0.617)#9,023 |
| 51. | Horace | 0.54% | 0.59%(-0.046)#51 | 1.2%(-0.641)#9,196 |
| 52. | Harwood | 0.53% | 0.59%(-0.063)#52 | 1.2%(-0.657)#9,306 |
| 53. | Steele | 0.52% | 0.59%(-0.071)#53 | 1.2%(-0.666)#9,353 |
| 54. | Williston | 0.51% | 0.59%(-0.077)#54 | 1.2%(-0.672)#9,400 |
| 55. | Napoleon | 0.51% | 0.59%(-0.080)#55 | 1.2%(-0.675)#9,433 |
| 56. | West Fargo | 0.44% | 0.59%(-0.147)#56 | 1.2%(-0.741)#9,944 |
| 57. | Parshall | 0.42% | 0.59%(-0.165)#57 | 1.2%(-0.759)#10,076 |
| 58. | Devils Lake | 0.40% | 0.59%(-0.187)#58 | 1.2%(-0.782)#10,222 |
| 59. | Wyndmere | 0.39% | 0.59%(-0.200)#59 | 1.2%(-0.795)#10,305 |
| 60. | Washburn | 0.37% | 0.59%(-0.216)#60 | 1.2%(-0.811)#10,410 |
| 61. | Dickinson | 0.37% | 0.59%(-0.217)#61 | 1.2%(-0.811)#10,420 |
| 62. | Watford City | 0.37% | 0.59%(-0.221)#62 | 1.2%(-0.816)#10,452 |
| 63. | Oakes | 0.35% | 0.59%(-0.240)#63 | 1.2%(-0.835)#10,595 |
| 64. | Hillsboro | 0.34% | 0.59%(-0.250)#64 | 1.2%(-0.844)#10,671 |
| 65. | Jamestown | 0.31% | 0.59%(-0.282)#65 | 1.2%(-0.877)#10,889 |
| 66. | Argusville | 0.31% | 0.59%(-0.282)#66 | 1.2%(-0.877)#10,892 |
| 67. | Wahpeton | 0.30% | 0.59%(-0.288)#67 | 1.2%(-0.883)#10,920 |
| 68. | Grafton | 0.24% | 0.59%(-0.350)#68 | 1.2%(-0.945)#11,254 |
| 69. | Thompson | 0.16% | 0.59%(-0.431)#69 | 1.2%(-1.03)#11,587 |
| 70. | Bowman | 0.12% | 0.59%(-0.468)#70 | 1.2%(-1.06)#11,702 |
Common Questions
What are the Top 10 Cities with the Highest Percentage of Population Employed in Legal Services & Support in North Dakota?
Top 10 Cities with the Highest Percentage of Population Employed in Legal Services & Support in North Dakota are:
#1
22.2%
#2
20.0%
#3
14.3%
#4
11.5%
#5
10.5%
#6
7.8%
#7
5.1%
#8
3.5%
#9
3.5%
#10
3.3%
What city has the Highest Percentage of Population Employed in Legal Services & Support in North Dakota?
Gardena has the Highest Percentage of Population Employed in Legal Services & Support in North Dakota with 22.2%.
What is the Percentage of Population Employed in Legal Services & Support in the State of North Dakota?
Percentage of Population Employed in Legal Services & Support in North Dakota is 0.59%.
What is the Percentage of Population Employed in Legal Services & Support in the United States?
Percentage of Population Employed in Legal Services & Support in the United States is 1.2%.