Hidden Hills, CA Map & Demographics
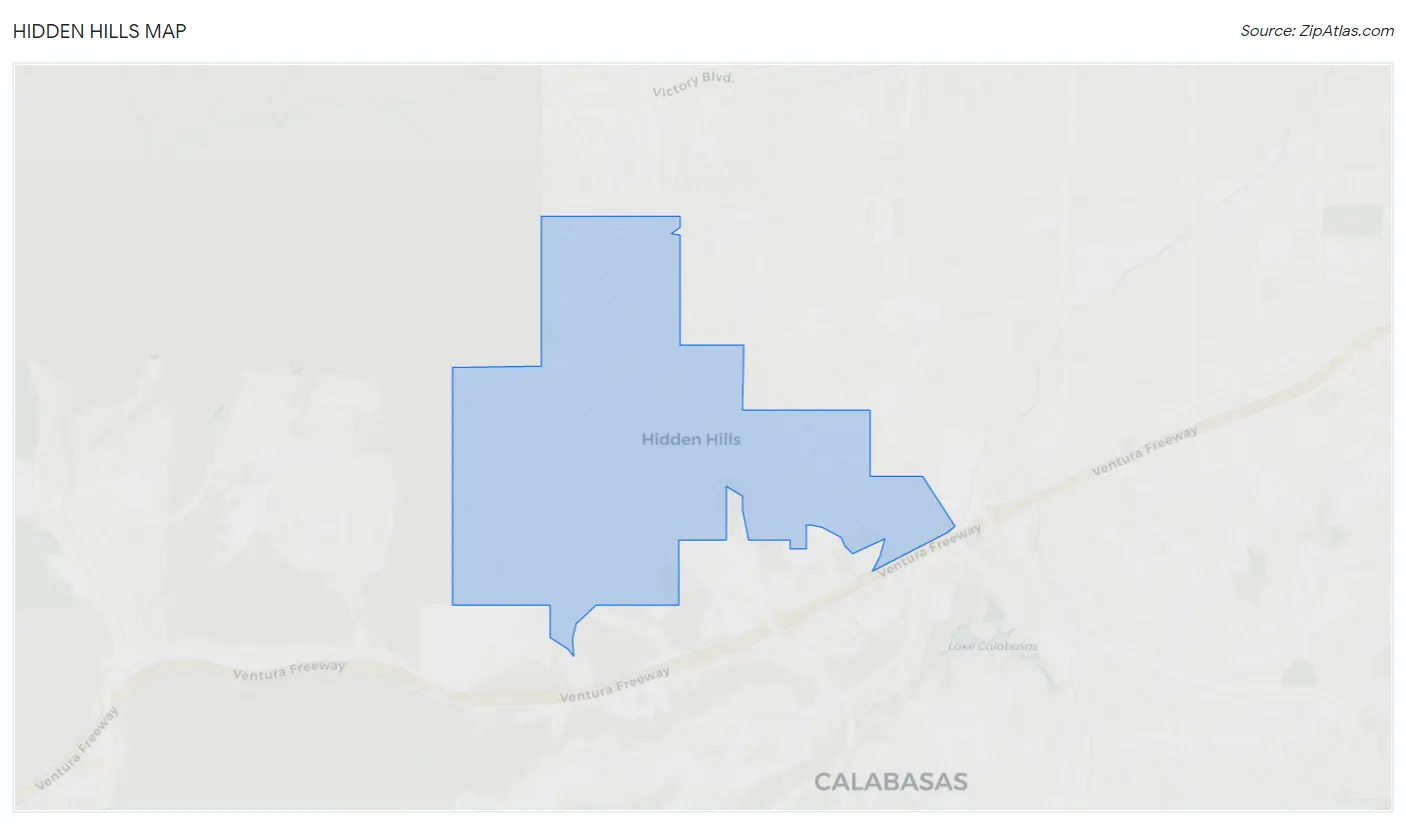
Hidden Hills Map
Hidden Hills Overview
$134,423
PER CAPITA INCOME
$250,001
AVG FAMILY INCOME
$250,001
AVG HOUSEHOLD INCOME
62.2%
WAGE / INCOME GAP [ % ]
37.8¢/ $1
WAGE / INCOME GAP [ $ ]
0.46
INEQUALITY / GINI INDEX
2,107
TOTAL POPULATION
932
MALE POPULATION
1,175
FEMALE POPULATION
79.32
MALES / 100 FEMALES
126.07
FEMALES / 100 MALES
46.5
MEDIAN AGE
3.4
AVG FAMILY SIZE
3.3
AVG HOUSEHOLD SIZE
930
LABOR FORCE [ PEOPLE ]
57.6%
PERCENT IN LABOR FORCE
4.7%
UNEMPLOYMENT RATE
Hidden Hills Area Codes
Income in Hidden Hills
Income Overview in Hidden Hills
Per Capita Income in Hidden Hills is $134,423, while median incomes of families and households are $250,001 and $250,001 respectively.
| Characteristic | Number | Measure |
| Per Capita Income | 2,107 | $134,423 |
| Median Family Income | 581 | $250,001 |
| Mean Family Income | 581 | $427,007 |
| Median Household Income | 646 | $250,001 |
| Mean Household Income | 646 | $423,224 |
| Income Deficit | 581 | $0 |
| Wage / Income Gap (%) | 2,107 | 62.22% |
| Wage / Income Gap ($) | 2,107 | 37.78¢ per $1 |
| Gini / Inequality Index | 2,107 | 0.46 |
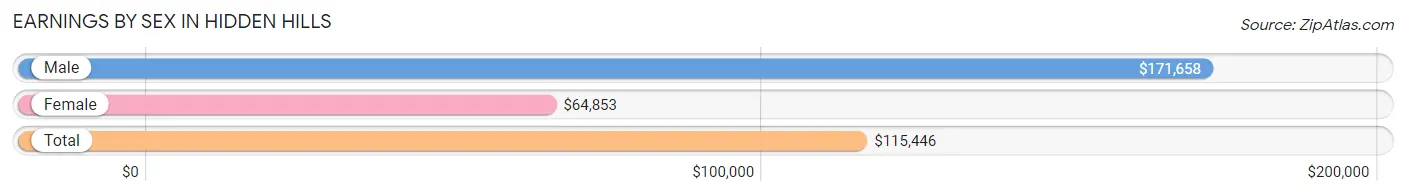
Earnings by Sex in Hidden Hills
Average Earnings in Hidden Hills are $115,446, $171,658 for men and $64,853 for women, a difference of 62.2%.
| Sex | Number | Average Earnings |
| Male | 539 (56.8%) | $171,658 |
| Female | 410 (43.2%) | $64,853 |
| Total | 949 (100.0%) | $115,446 |
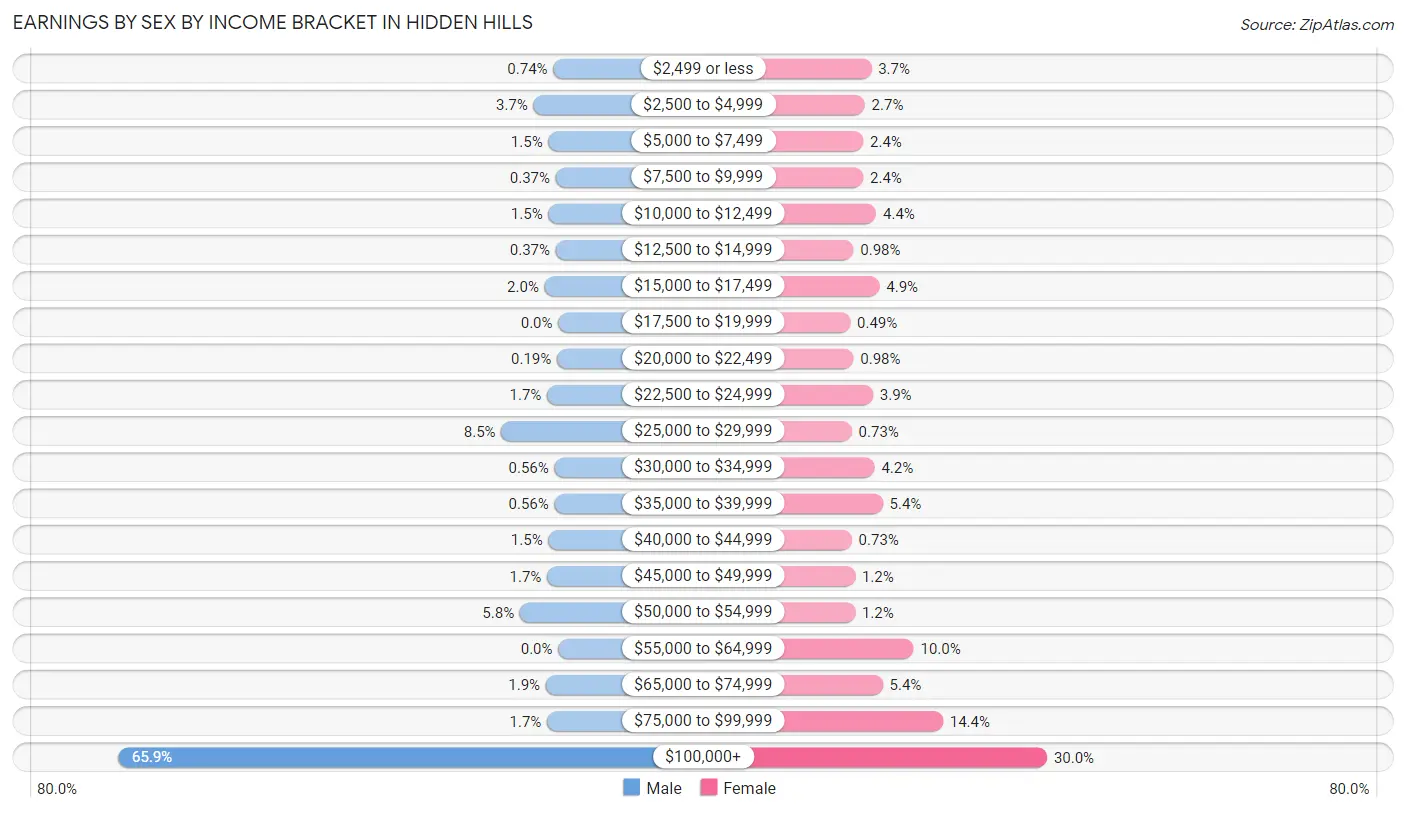
Earnings by Sex by Income Bracket in Hidden Hills
The most common earnings brackets in Hidden Hills are $100,000+ for men (355 | 65.9%) and $100,000+ for women (123 | 30.0%).
| Income | Male | Female |
| $2,499 or less | 4 (0.7%) | 15 (3.7%) |
| $2,500 to $4,999 | 20 (3.7%) | 11 (2.7%) |
| $5,000 to $7,499 | 8 (1.5%) | 10 (2.4%) |
| $7,500 to $9,999 | 2 (0.4%) | 10 (2.4%) |
| $10,000 to $12,499 | 8 (1.5%) | 18 (4.4%) |
| $12,500 to $14,999 | 2 (0.4%) | 4 (1.0%) |
| $15,000 to $17,499 | 11 (2.0%) | 20 (4.9%) |
| $17,500 to $19,999 | 0 (0.0%) | 2 (0.5%) |
| $20,000 to $22,499 | 1 (0.2%) | 4 (1.0%) |
| $22,500 to $24,999 | 9 (1.7%) | 16 (3.9%) |
| $25,000 to $29,999 | 46 (8.5%) | 3 (0.7%) |
| $30,000 to $34,999 | 3 (0.6%) | 17 (4.2%) |
| $35,000 to $39,999 | 3 (0.6%) | 22 (5.4%) |
| $40,000 to $44,999 | 8 (1.5%) | 3 (0.7%) |
| $45,000 to $49,999 | 9 (1.7%) | 5 (1.2%) |
| $50,000 to $54,999 | 31 (5.8%) | 5 (1.2%) |
| $55,000 to $64,999 | 0 (0.0%) | 41 (10.0%) |
| $65,000 to $74,999 | 10 (1.9%) | 22 (5.4%) |
| $75,000 to $99,999 | 9 (1.7%) | 59 (14.4%) |
| $100,000+ | 355 (65.9%) | 123 (30.0%) |
| Total | 539 (100.0%) | 410 (100.0%) |
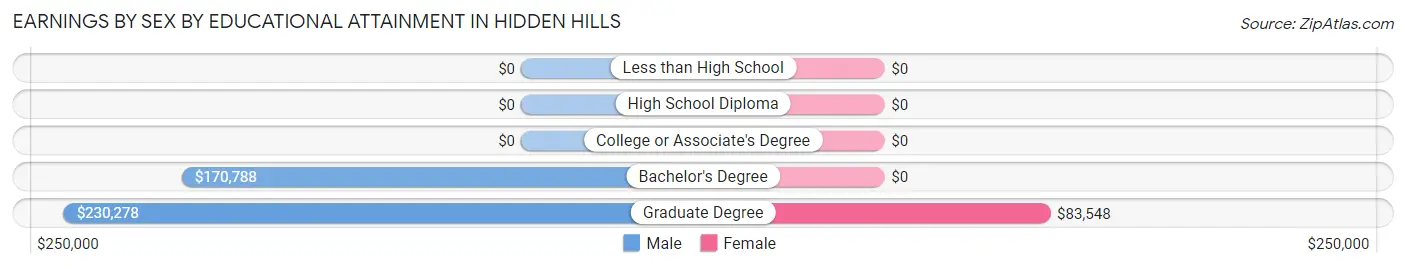
Earnings by Sex by Educational Attainment in Hidden Hills
Average earnings in Hidden Hills are $173,750 for men and $71,042 for women, a difference of 59.1%. Men with an educational attainment of graduate degree enjoy the highest average annual earnings of $230,278, while those with bachelor's degree education earn the least with $170,788. Women with an educational attainment of graduate degree earn the most with the average annual earnings of $83,548, while those with graduate degree education have the smallest earnings of $83,548.
| Educational Attainment | Male Income | Female Income |
| Less than High School | - | - |
| High School Diploma | - | - |
| College or Associate's Degree | - | - |
| Bachelor's Degree | $170,788 | $0 |
| Graduate Degree | $230,278 | $83,548 |
| Total | $173,750 | $71,042 |
Family Income in Hidden Hills
Family Income Brackets in Hidden Hills
According to the Hidden Hills family income data, there are 427 families falling into the $200,000+ income range, which is the most common income bracket and makes up 73.5% of all families.
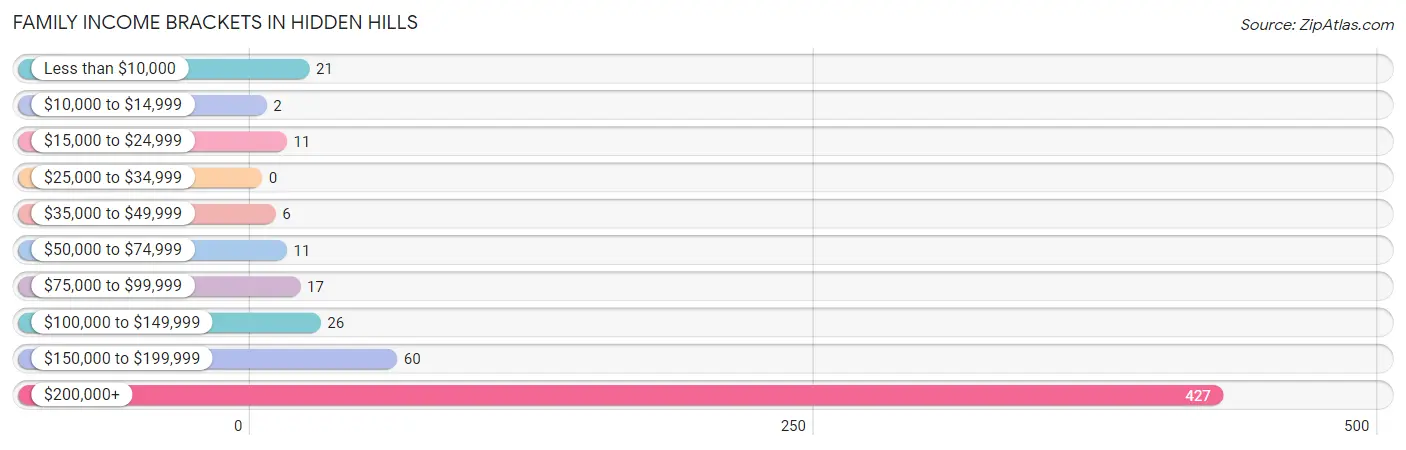
| Income Bracket | # Families | % Families |
| Less than $10,000 | 21 | 3.6% |
| $10,000 to $14,999 | 2 | 0.3% |
| $15,000 to $24,999 | 11 | 1.9% |
| $25,000 to $34,999 | 0 | 0.0% |
| $35,000 to $49,999 | 6 | 1.0% |
| $50,000 to $74,999 | 11 | 1.9% |
| $75,000 to $99,999 | 17 | 2.9% |
| $100,000 to $149,999 | 26 | 4.5% |
| $150,000 to $199,999 | 60 | 10.3% |
| $200,000+ | 427 | 73.5% |
Family Income by Famaliy Size in Hidden Hills
2-person families (296 | 50.9%) account for the highest median family income in Hidden Hills with $250,001 per family, while 2-person families (296 | 50.9%) have the highest median income of $125,000 per family member.
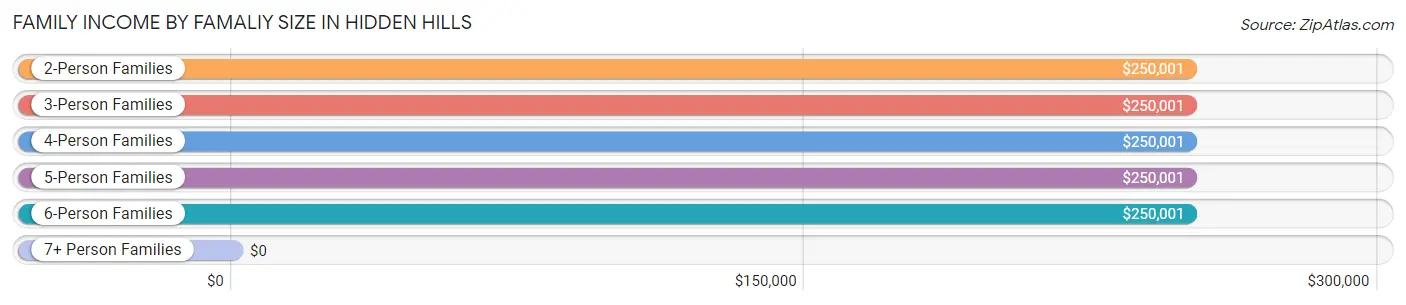
| Income Bracket | # Families | Median Income |
| 2-Person Families | 296 (50.9%) | $250,001 |
| 3-Person Families | 73 (12.6%) | $250,001 |
| 4-Person Families | 100 (17.2%) | $250,001 |
| 5-Person Families | 55 (9.5%) | $250,001 |
| 6-Person Families | 48 (8.3%) | $250,001 |
| 7+ Person Families | 9 (1.5%) | $0 |
| Total | 581 (100.0%) | $250,001 |
Family Income by Number of Earners in Hidden Hills
The median family income in Hidden Hills is $250,001, with families comprising 1 earner (263) having the highest median family income of $250,001, while families with no earners (71) have the lowest median family income of $183,750, accounting for 45.3% and 12.2% of families, respectively.
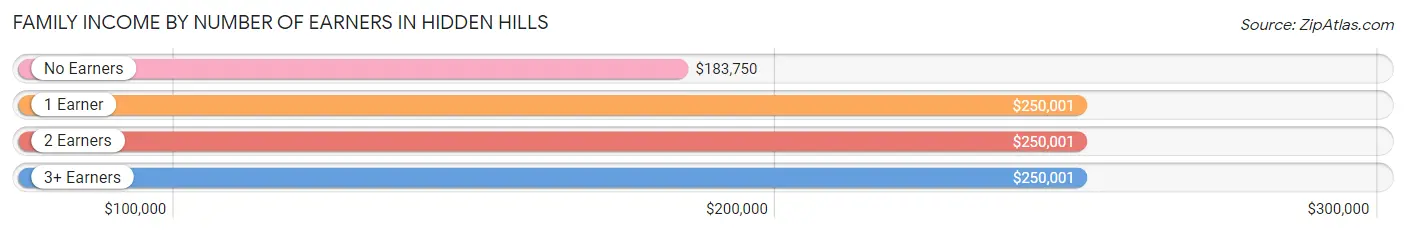
| Number of Earners | # Families | Median Income |
| No Earners | 71 (12.2%) | $183,750 |
| 1 Earner | 263 (45.3%) | $250,001 |
| 2 Earners | 219 (37.7%) | $250,001 |
| 3+ Earners | 28 (4.8%) | $250,001 |
| Total | 581 (100.0%) | $250,001 |
Household Income in Hidden Hills
Household Income Brackets in Hidden Hills
With 449 households falling in the category, the $200,000+ income range is the most frequent in Hidden Hills, accounting for 69.5% of all households. In contrast, only 2 households (0.3%) fall into the $10,000 to $14,999 income bracket, making it the least populous group.
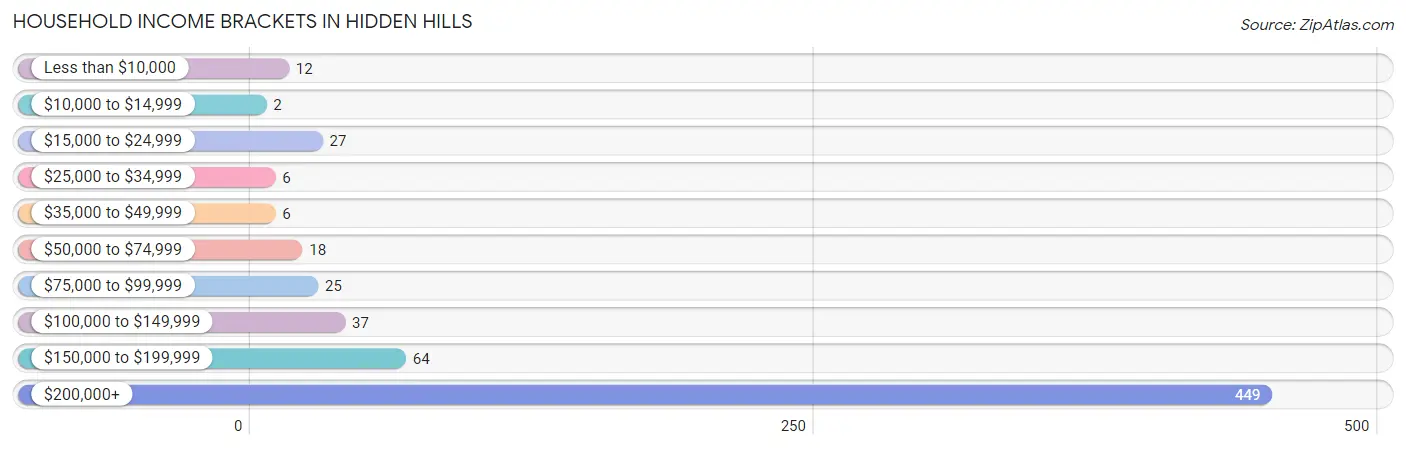
| Income Bracket | # Households | % Households |
| Less than $10,000 | 12 | 1.9% |
| $10,000 to $14,999 | 2 | 0.3% |
| $15,000 to $24,999 | 27 | 4.2% |
| $25,000 to $34,999 | 6 | 0.9% |
| $35,000 to $49,999 | 6 | 0.9% |
| $50,000 to $74,999 | 18 | 2.8% |
| $75,000 to $99,999 | 25 | 3.9% |
| $100,000 to $149,999 | 37 | 5.7% |
| $150,000 to $199,999 | 64 | 9.9% |
| $200,000+ | 449 | 69.5% |
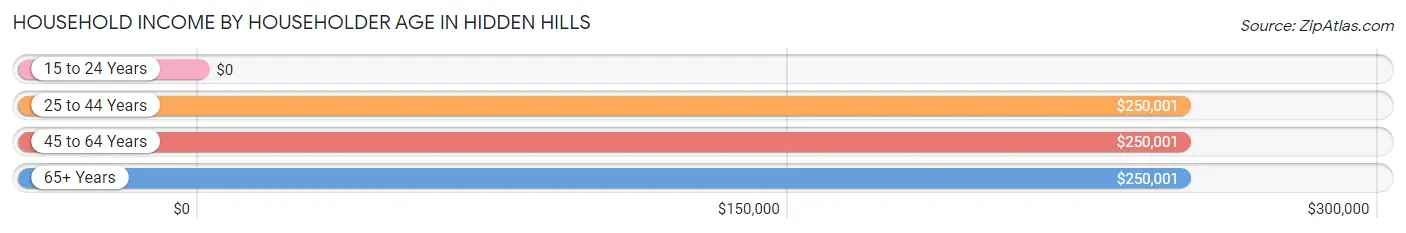
Household Income by Householder Age in Hidden Hills
The median household income in Hidden Hills is $250,001, with the highest median household income of $250,001 found in the 25 to 44 years age bracket for the primary householder. A total of 89 households (13.8%) fall into this category. Meanwhile, the 15 to 24 years age bracket for the primary householder has the lowest median household income of $0, with 3 households (0.5%) in this group.
| Income Bracket | # Households | Median Income |
| 15 to 24 Years | 3 (0.5%) | $0 |
| 25 to 44 Years | 89 (13.8%) | $250,001 |
| 45 to 64 Years | 363 (56.2%) | $250,001 |
| 65+ Years | 191 (29.6%) | $250,001 |
| Total | 646 (100.0%) | $250,001 |
Poverty in Hidden Hills
Income Below Poverty by Sex and Age in Hidden Hills
With 9.7% poverty level for males and 9.5% for females among the residents of Hidden Hills, 16 and 17 year old males and 15 year old females are the most vulnerable to poverty, with 16 males (38.1%) and 24 females (66.7%) in their respective age groups living below the poverty level.
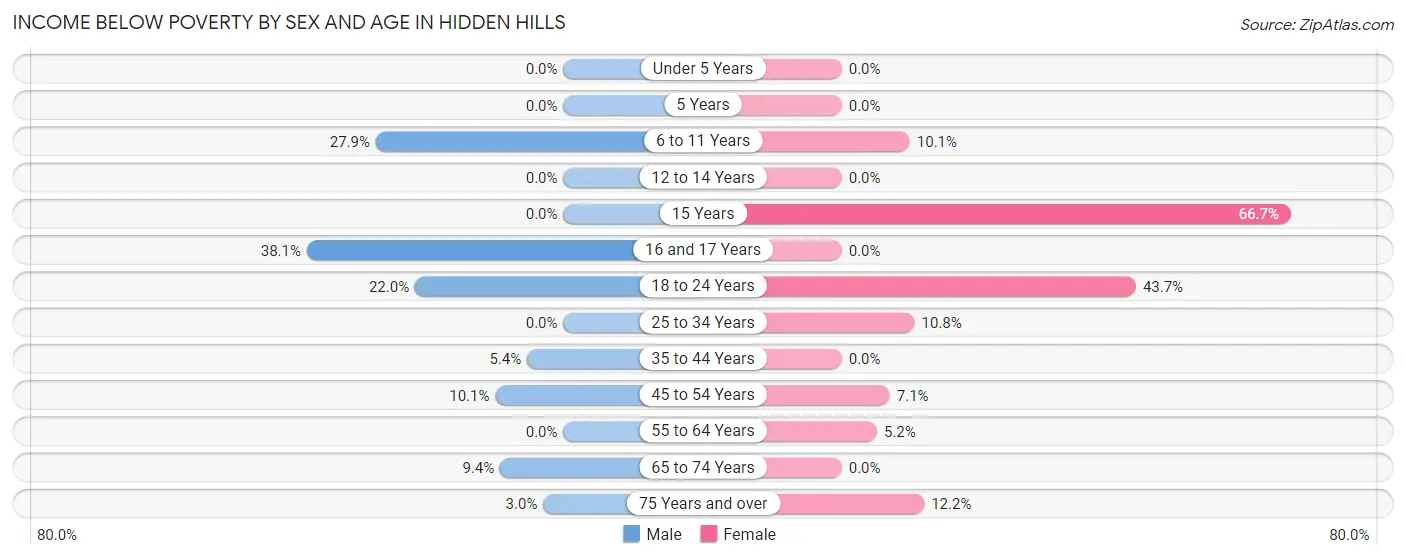
| Age Bracket | Male | Female |
| Under 5 Years | 0 (0.0%) | 0 (0.0%) |
| 5 Years | 0 (0.0%) | 0 (0.0%) |
| 6 to 11 Years | 22 (27.9%) | 19 (10.1%) |
| 12 to 14 Years | 0 (0.0%) | 0 (0.0%) |
| 15 Years | 0 (0.0%) | 24 (66.7%) |
| 16 and 17 Years | 16 (38.1%) | 0 (0.0%) |
| 18 to 24 Years | 13 (22.0%) | 38 (43.7%) |
| 25 to 34 Years | 0 (0.0%) | 4 (10.8%) |
| 35 to 44 Years | 5 (5.4%) | 0 (0.0%) |
| 45 to 54 Years | 21 (10.1%) | 9 (7.1%) |
| 55 to 64 Years | 0 (0.0%) | 12 (5.2%) |
| 65 to 74 Years | 11 (9.4%) | 0 (0.0%) |
| 75 Years and over | 2 (3.0%) | 6 (12.2%) |
| Total | 90 (9.7%) | 112 (9.5%) |
Income Above Poverty by Sex and Age in Hidden Hills
According to the poverty statistics in Hidden Hills, males aged under 5 years and females aged under 5 years are the age groups that are most secure financially, with 100.0% of males and 100.0% of females in these age groups living above the poverty line.
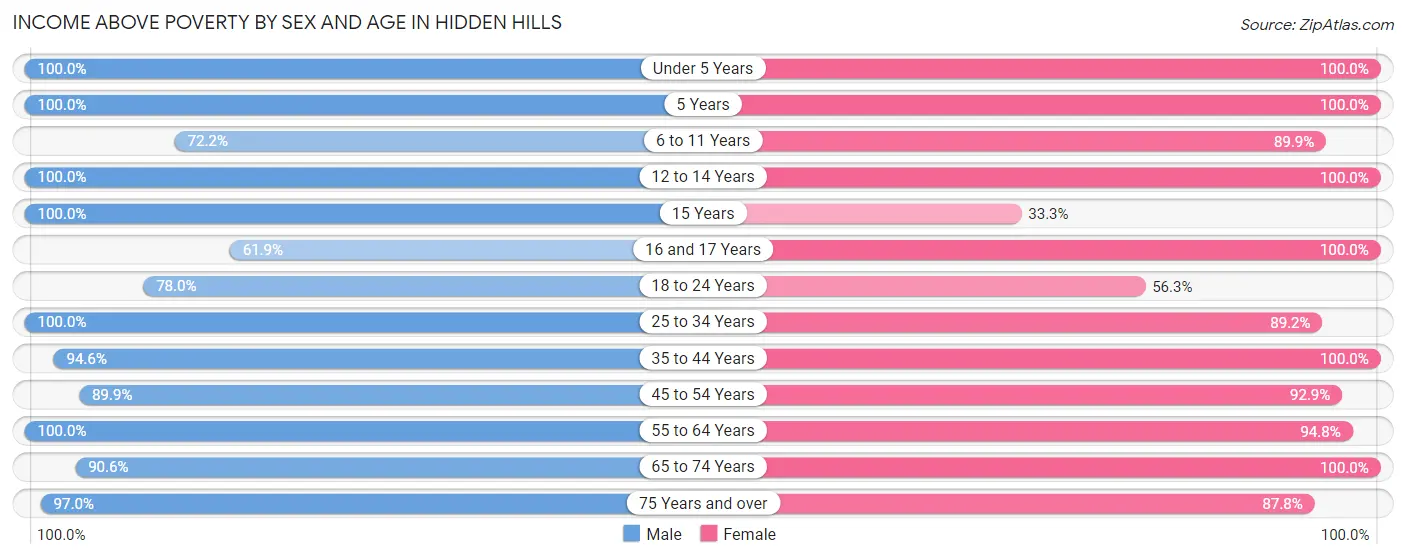
| Age Bracket | Male | Female |
| Under 5 Years | 9 (100.0%) | 28 (100.0%) |
| 5 Years | 10 (100.0%) | 56 (100.0%) |
| 6 to 11 Years | 57 (72.2%) | 169 (89.9%) |
| 12 to 14 Years | 36 (100.0%) | 47 (100.0%) |
| 15 Years | 4 (100.0%) | 12 (33.3%) |
| 16 and 17 Years | 26 (61.9%) | 25 (100.0%) |
| 18 to 24 Years | 46 (78.0%) | 49 (56.3%) |
| 25 to 34 Years | 26 (100.0%) | 33 (89.2%) |
| 35 to 44 Years | 88 (94.6%) | 146 (100.0%) |
| 45 to 54 Years | 187 (89.9%) | 117 (92.9%) |
| 55 to 64 Years | 182 (100.0%) | 218 (94.8%) |
| 65 to 74 Years | 106 (90.6%) | 120 (100.0%) |
| 75 Years and over | 65 (97.0%) | 43 (87.8%) |
| Total | 842 (90.3%) | 1,063 (90.5%) |
Income Below Poverty Among Married-Couple Families in Hidden Hills
The poverty statistics for married-couple families in Hidden Hills show that 4.5% or 22 of the total 484 families live below the poverty line. Families with 1 or 2 children have the highest poverty rate of 18.7%, comprising of 20 families. On the other hand, families with 3 or 4 children have the lowest poverty rate of 0.0%, which includes 0 families.
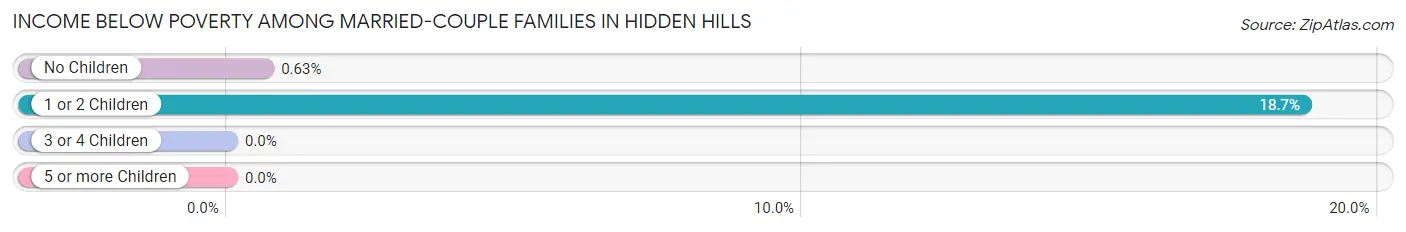
| Children | Above Poverty | Below Poverty |
| No Children | 315 (99.4%) | 2 (0.6%) |
| 1 or 2 Children | 87 (81.3%) | 20 (18.7%) |
| 3 or 4 Children | 51 (100.0%) | 0 (0.0%) |
| 5 or more Children | 9 (100.0%) | 0 (0.0%) |
| Total | 462 (95.5%) | 22 (4.5%) |
Income Below Poverty Among Single-Parent Households in Hidden Hills
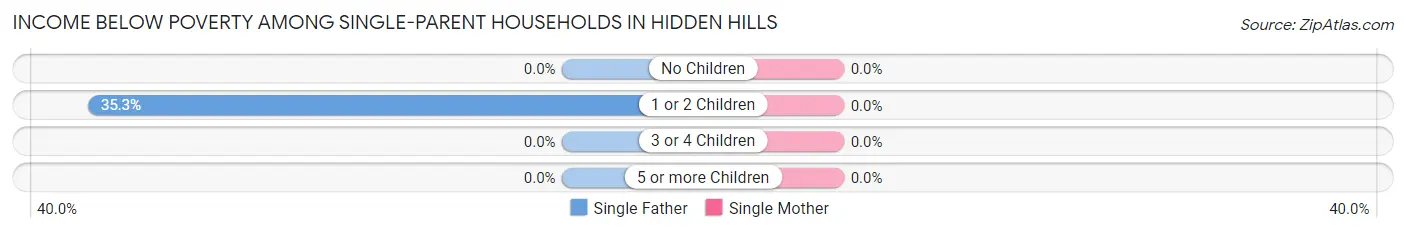
| Children | Single Father | Single Mother |
| No Children | 0 (0.0%) | 0 (0.0%) |
| 1 or 2 Children | 12 (35.3%) | 0 (0.0%) |
| 3 or 4 Children | 0 (0.0%) | 0 (0.0%) |
| 5 or more Children | 0 (0.0%) | 0 (0.0%) |
| Total | 12 (28.6%) | 0 (0.0%) |
Income Below Poverty Among Married-Couple vs Single-Parent Households in Hidden Hills
The poverty data for Hidden Hills shows that 22 of the married-couple family households (4.5%) and 12 of the single-parent households (12.4%) are living below the poverty level. Within the married-couple family households, those with 1 or 2 children have the highest poverty rate, with 20 households (18.7%) falling below the poverty line. Among the single-parent households, those with 1 or 2 children have the highest poverty rate, with 12 household (16.7%) living below poverty.
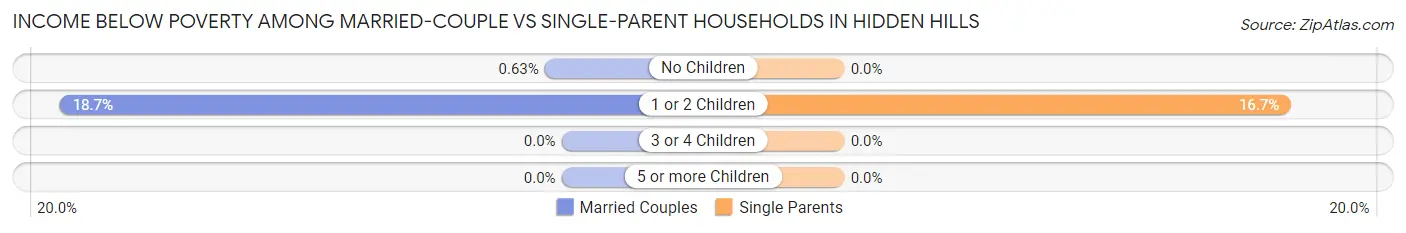
| Children | Married-Couple Families | Single-Parent Households |
| No Children | 2 (0.6%) | 0 (0.0%) |
| 1 or 2 Children | 20 (18.7%) | 12 (16.7%) |
| 3 or 4 Children | 0 (0.0%) | 0 (0.0%) |
| 5 or more Children | 0 (0.0%) | 0 (0.0%) |
| Total | 22 (4.5%) | 12 (12.4%) |
Race in Hidden Hills
The most populous races in Hidden Hills are White / Caucasian (1,889 | 89.6%), Hispanic or Latino (123 | 5.8%), and Two or more Races (120 | 5.7%).
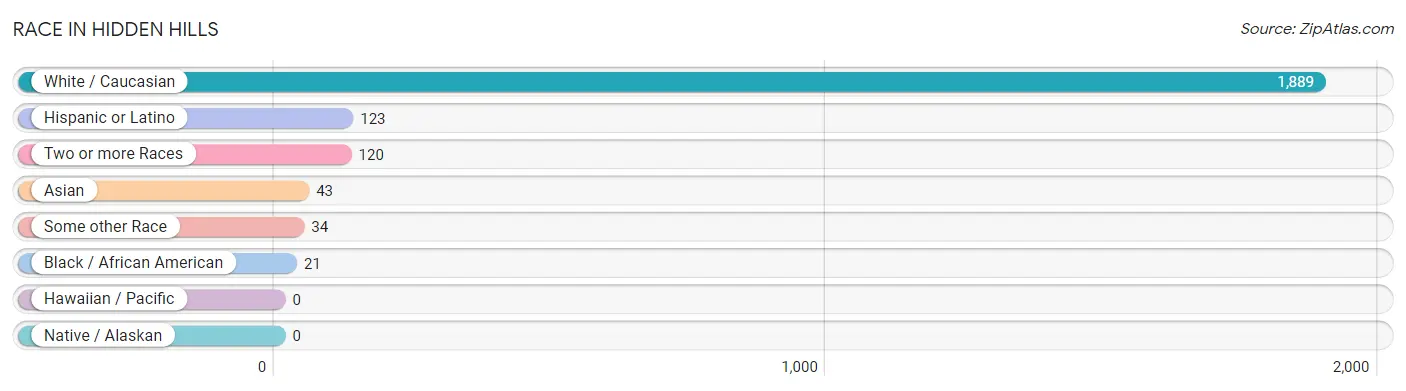
| Race | # Population | % Population |
| Asian | 43 | 2.0% |
| Black / African American | 21 | 1.0% |
| Hawaiian / Pacific | 0 | 0.0% |
| Hispanic or Latino | 123 | 5.8% |
| Native / Alaskan | 0 | 0.0% |
| White / Caucasian | 1,889 | 89.6% |
| Two or more Races | 120 | 5.7% |
| Some other Race | 34 | 1.6% |
| Total | 2,107 | 100.0% |
Ancestry in Hidden Hills
The most populous ancestries reported in Hidden Hills are American (218 | 10.3%), German (179 | 8.5%), Russian (156 | 7.4%), Irish (147 | 7.0%), and British (123 | 5.8%), together accounting for 39.1% of all Hidden Hills residents.
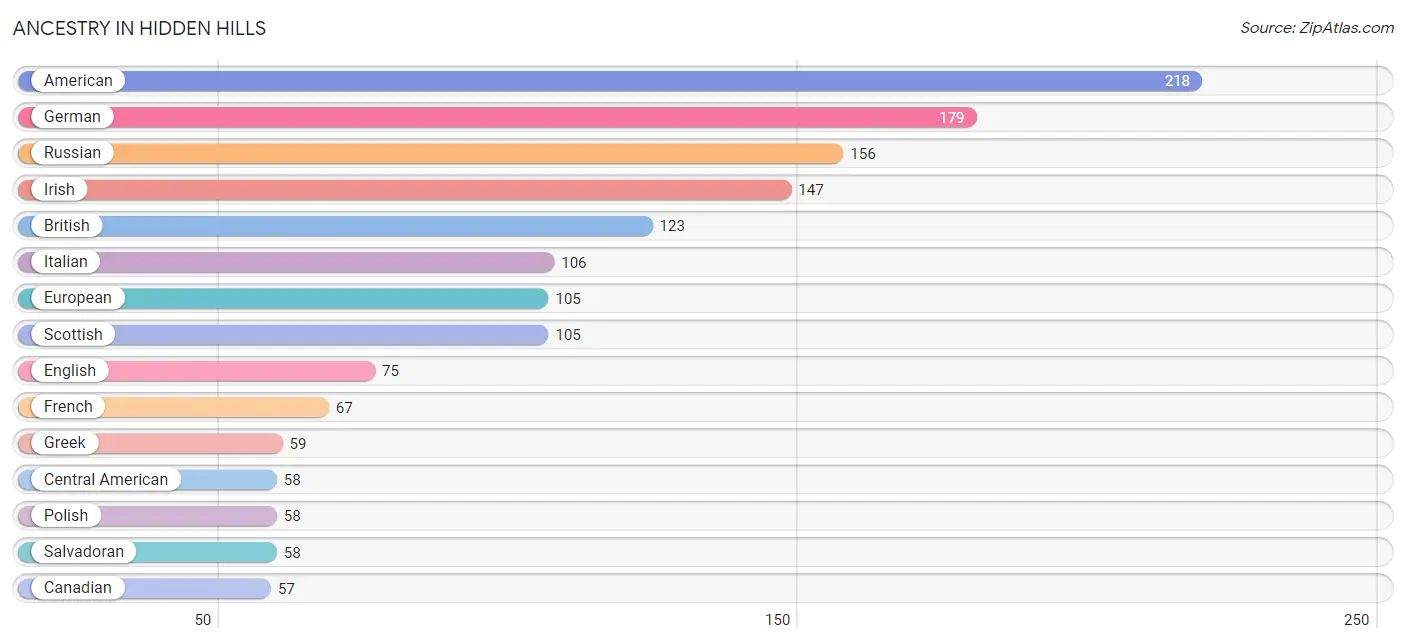
| Ancestry | # Population | % Population |
| American | 218 | 10.3% |
| Arab | 6 | 0.3% |
| Argentinean | 3 | 0.1% |
| Armenian | 4 | 0.2% |
| Australian | 11 | 0.5% |
| Austrian | 10 | 0.5% |
| Basque | 4 | 0.2% |
| Bhutanese | 3 | 0.1% |
| Brazilian | 2 | 0.1% |
| British | 123 | 5.8% |
| Burmese | 14 | 0.7% |
| Canadian | 57 | 2.7% |
| Central American | 58 | 2.8% |
| Czech | 13 | 0.6% |
| Danish | 2 | 0.1% |
| Dutch | 12 | 0.6% |
| Eastern European | 35 | 1.7% |
| English | 75 | 3.6% |
| European | 105 | 5.0% |
| French | 67 | 3.2% |
| French Canadian | 3 | 0.1% |
| German | 179 | 8.5% |
| Greek | 59 | 2.8% |
| Hungarian | 8 | 0.4% |
| Indian (Asian) | 9 | 0.4% |
| Iranian | 11 | 0.5% |
| Irish | 147 | 7.0% |
| Israeli | 3 | 0.1% |
| Italian | 106 | 5.0% |
| Lebanese | 6 | 0.3% |
| Lithuanian | 10 | 0.5% |
| Mexican | 30 | 1.4% |
| Northern European | 9 | 0.4% |
| Norwegian | 45 | 2.1% |
| Polish | 58 | 2.8% |
| Puerto Rican | 19 | 0.9% |
| Romanian | 17 | 0.8% |
| Russian | 156 | 7.4% |
| Salvadoran | 58 | 2.8% |
| Scandinavian | 6 | 0.3% |
| Scotch-Irish | 14 | 0.7% |
| Scottish | 105 | 5.0% |
| Slovak | 15 | 0.7% |
| South American | 3 | 0.1% |
| Spanish | 13 | 0.6% |
| Swedish | 43 | 2.0% |
| Thai | 17 | 0.8% |
| Ukrainian | 28 | 1.3% |
| Welsh | 3 | 0.1% | View All 49 Rows |
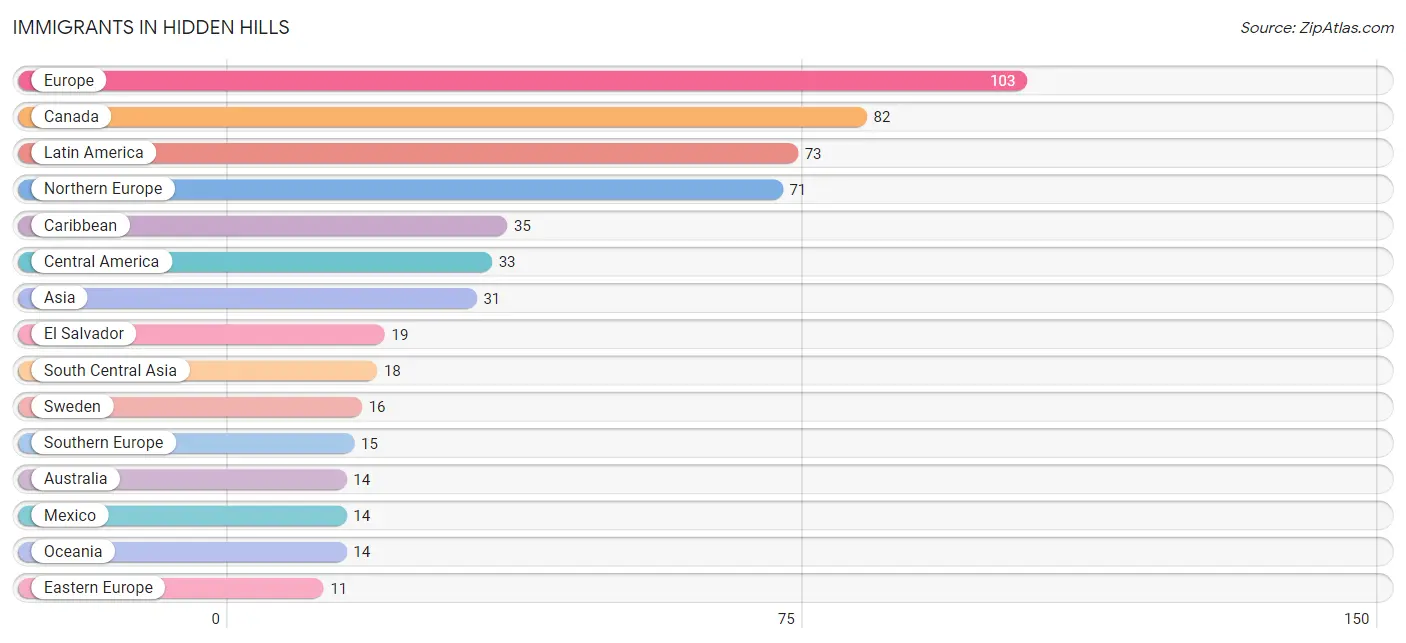
Immigrants in Hidden Hills
The most numerous immigrant groups reported in Hidden Hills came from Europe (103 | 4.9%), Canada (82 | 3.9%), Latin America (73 | 3.5%), Northern Europe (71 | 3.4%), and Caribbean (35 | 1.7%), together accounting for 17.3% of all Hidden Hills residents.
| Immigration Origin | # Population | % Population |
| Africa | 5 | 0.2% |
| Argentina | 3 | 0.1% |
| Asia | 31 | 1.5% |
| Australia | 14 | 0.7% |
| Brazil | 2 | 0.1% |
| Canada | 82 | 3.9% |
| Caribbean | 35 | 1.7% |
| Central America | 33 | 1.6% |
| China | 7 | 0.3% |
| Czechoslovakia | 5 | 0.2% |
| Eastern Asia | 7 | 0.3% |
| Eastern Europe | 11 | 0.5% |
| El Salvador | 19 | 0.9% |
| England | 9 | 0.4% |
| Europe | 103 | 4.9% |
| Germany | 6 | 0.3% |
| Greece | 8 | 0.4% |
| Iran | 10 | 0.5% |
| Kazakhstan | 8 | 0.4% |
| Latin America | 73 | 3.5% |
| Lebanon | 6 | 0.3% |
| Mexico | 14 | 0.7% |
| Northern Europe | 71 | 3.4% |
| Oceania | 14 | 0.7% |
| Poland | 5 | 0.2% |
| Romania | 1 | 0.1% |
| South Africa | 5 | 0.2% |
| South America | 5 | 0.2% |
| South Central Asia | 18 | 0.9% |
| Southern Europe | 15 | 0.7% |
| Spain | 4 | 0.2% |
| Sweden | 16 | 0.8% |
| Taiwan | 7 | 0.3% |
| Western Asia | 6 | 0.3% |
| Western Europe | 6 | 0.3% | View All 35 Rows |
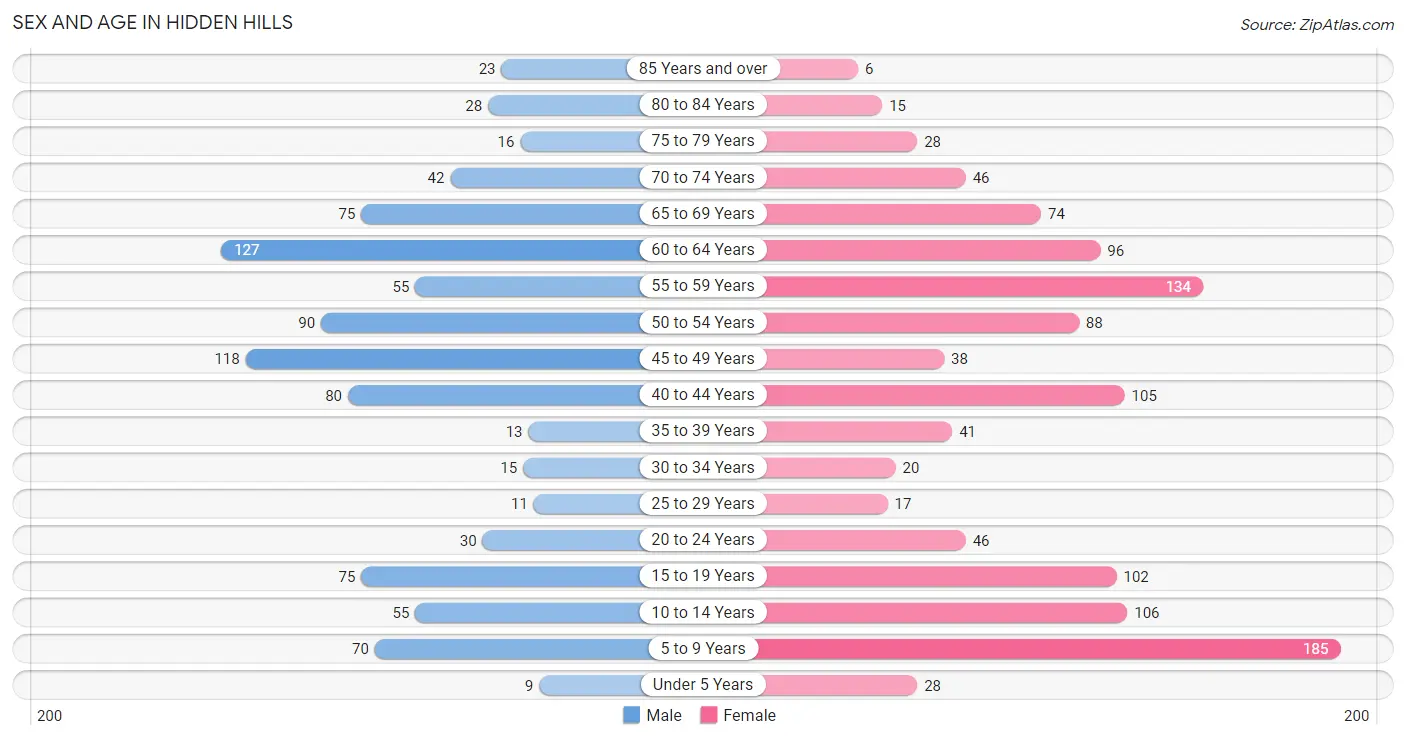
Sex and Age in Hidden Hills
Sex and Age in Hidden Hills
The most populous age groups in Hidden Hills are 60 to 64 Years (127 | 13.6%) for men and 5 to 9 Years (185 | 15.7%) for women.
| Age Bracket | Male | Female |
| Under 5 Years | 9 (1.0%) | 28 (2.4%) |
| 5 to 9 Years | 70 (7.5%) | 185 (15.7%) |
| 10 to 14 Years | 55 (5.9%) | 106 (9.0%) |
| 15 to 19 Years | 75 (8.1%) | 102 (8.7%) |
| 20 to 24 Years | 30 (3.2%) | 46 (3.9%) |
| 25 to 29 Years | 11 (1.2%) | 17 (1.5%) |
| 30 to 34 Years | 15 (1.6%) | 20 (1.7%) |
| 35 to 39 Years | 13 (1.4%) | 41 (3.5%) |
| 40 to 44 Years | 80 (8.6%) | 105 (8.9%) |
| 45 to 49 Years | 118 (12.7%) | 38 (3.2%) |
| 50 to 54 Years | 90 (9.7%) | 88 (7.5%) |
| 55 to 59 Years | 55 (5.9%) | 134 (11.4%) |
| 60 to 64 Years | 127 (13.6%) | 96 (8.2%) |
| 65 to 69 Years | 75 (8.1%) | 74 (6.3%) |
| 70 to 74 Years | 42 (4.5%) | 46 (3.9%) |
| 75 to 79 Years | 16 (1.7%) | 28 (2.4%) |
| 80 to 84 Years | 28 (3.0%) | 15 (1.3%) |
| 85 Years and over | 23 (2.5%) | 6 (0.5%) |
| Total | 932 (100.0%) | 1,175 (100.0%) |
Families and Households in Hidden Hills
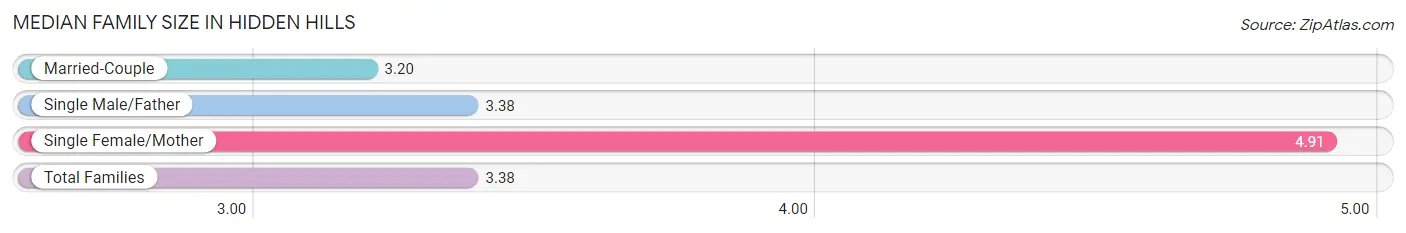
Median Family Size in Hidden Hills
The median family size in Hidden Hills is 3.38 persons per family, with single female/mother families (55 | 9.5%) accounting for the largest median family size of 4.91 persons per family. On the other hand, married-couple families (484 | 83.3%) represent the smallest median family size with 3.20 persons per family.
| Family Type | # Families | Family Size |
| Married-Couple | 484 (83.3%) | 3.20 |
| Single Male/Father | 42 (7.2%) | 3.38 |
| Single Female/Mother | 55 (9.5%) | 4.91 |
| Total Families | 581 (100.0%) | 3.38 |
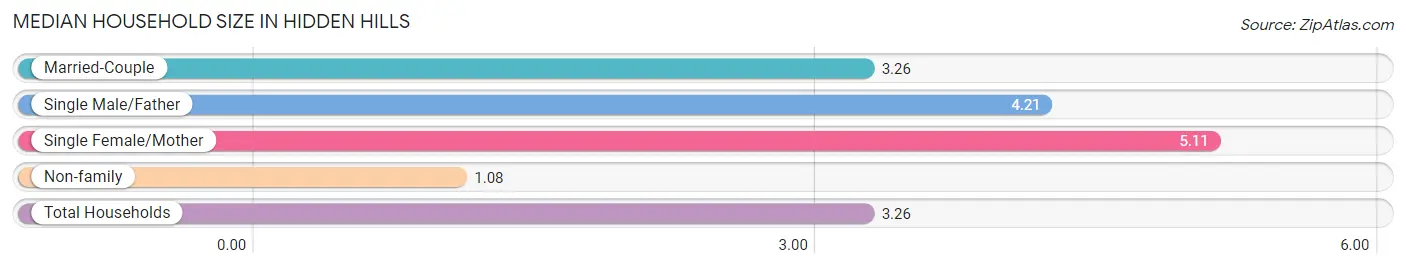
Median Household Size in Hidden Hills
The median household size in Hidden Hills is 3.26 persons per household, with single female/mother households (55 | 8.5%) accounting for the largest median household size of 5.11 persons per household. non-family households (65 | 10.1%) represent the smallest median household size with 1.08 persons per household.
| Household Type | # Households | Household Size |
| Married-Couple | 484 (74.9%) | 3.26 |
| Single Male/Father | 42 (6.5%) | 4.21 |
| Single Female/Mother | 55 (8.5%) | 5.11 |
| Non-family | 65 (10.1%) | 1.08 |
| Total Households | 646 (100.0%) | 3.26 |
Household Size by Marriage Status in Hidden Hills
Out of a total of 646 households in Hidden Hills, 581 (89.9%) are family households, while 65 (10.1%) are nonfamily households. The most numerous type of family households are 2-person households, comprising 250, and the most common type of nonfamily households are 1-person households, comprising 62.
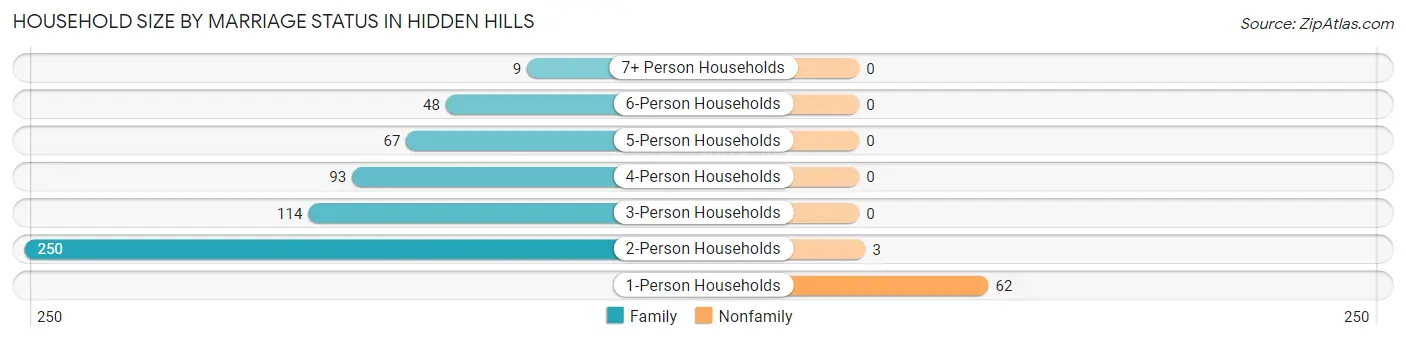
| Household Size | Family Households | Nonfamily Households |
| 1-Person Households | - | 62 (9.6%) |
| 2-Person Households | 250 (38.7%) | 3 (0.5%) |
| 3-Person Households | 114 (17.6%) | 0 (0.0%) |
| 4-Person Households | 93 (14.4%) | 0 (0.0%) |
| 5-Person Households | 67 (10.4%) | 0 (0.0%) |
| 6-Person Households | 48 (7.4%) | 0 (0.0%) |
| 7+ Person Households | 9 (1.4%) | 0 (0.0%) |
| Total | 581 (89.9%) | 65 (10.1%) |
Female Fertility in Hidden Hills
Fertility by Age in Hidden Hills
Average fertility rate in Hidden Hills is 33.0 births per 1,000 women. Women in the age bracket of 35 to 50 years have the highest fertility rate with 61.0 births per 1,000 women. Women in the age bracket of 35 to 50 years acount for 100.0% of all women with births.
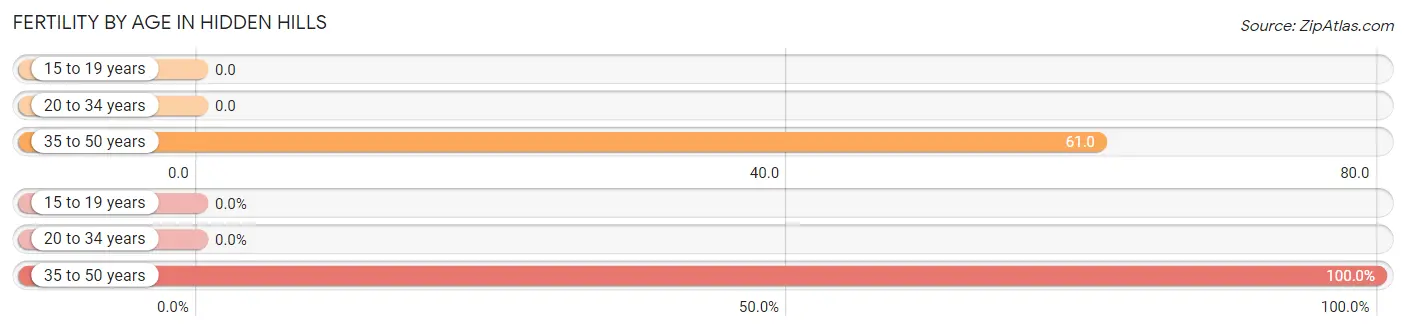
| Age Bracket | Women with Births | Births / 1,000 Women |
| 15 to 19 years | 0 (0.0%) | 0.0 |
| 20 to 34 years | 0 (0.0%) | 0.0 |
| 35 to 50 years | 13 (100.0%) | 61.0 |
| Total | 13 (100.0%) | 33.0 |
Fertility by Age by Marriage Status in Hidden Hills
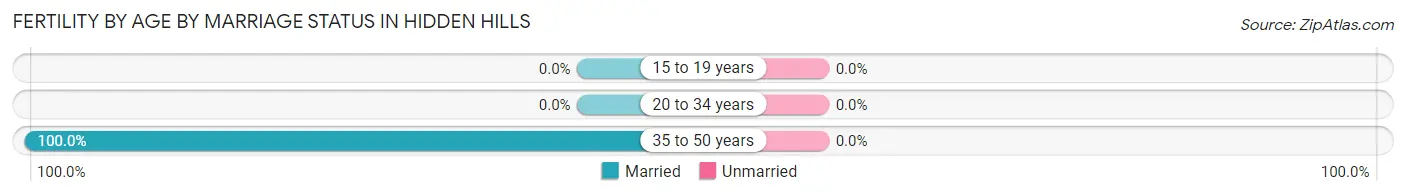
| Age Bracket | Married | Unmarried |
| 15 to 19 years | 0 (0.0%) | 0 (0.0%) |
| 20 to 34 years | 0 (0.0%) | 0 (0.0%) |
| 35 to 50 years | 13 (100.0%) | 0 (0.0%) |
| Total | 13 (100.0%) | 0 (0.0%) |
Fertility by Education in Hidden Hills
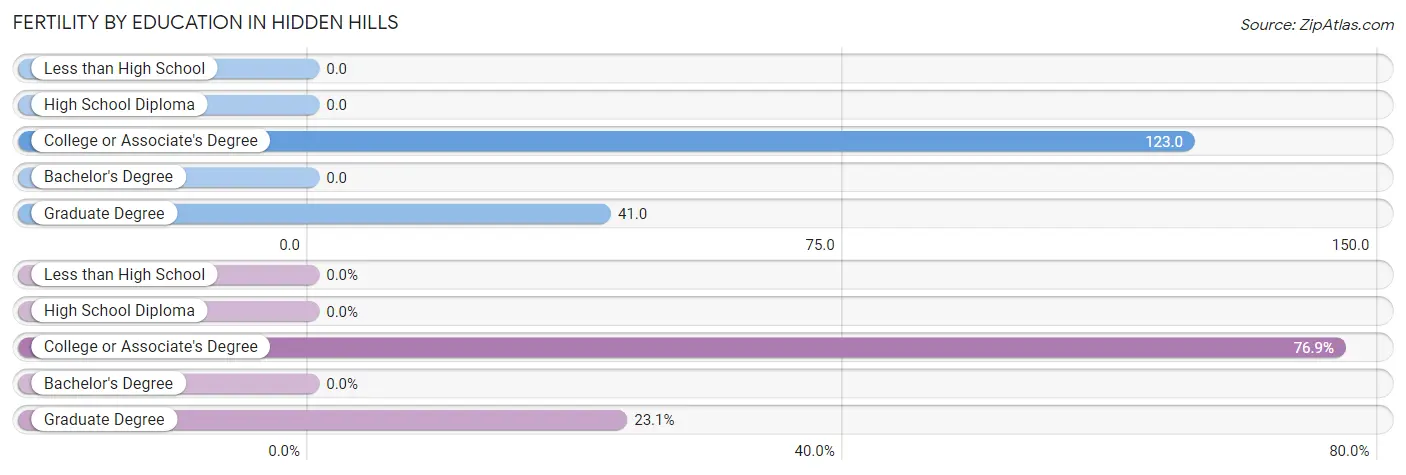
| Educational Attainment | Women with Births | Births / 1,000 Women |
| Less than High School | 0 (0.0%) | 0.0 |
| High School Diploma | 0 (0.0%) | 0.0 |
| College or Associate's Degree | 10 (76.9%) | 123.0 |
| Bachelor's Degree | 0 (0.0%) | 0.0 |
| Graduate Degree | 3 (23.1%) | 41.0 |
| Total | 13 (100.0%) | 33.0 |
Fertility by Education by Marriage Status in Hidden Hills
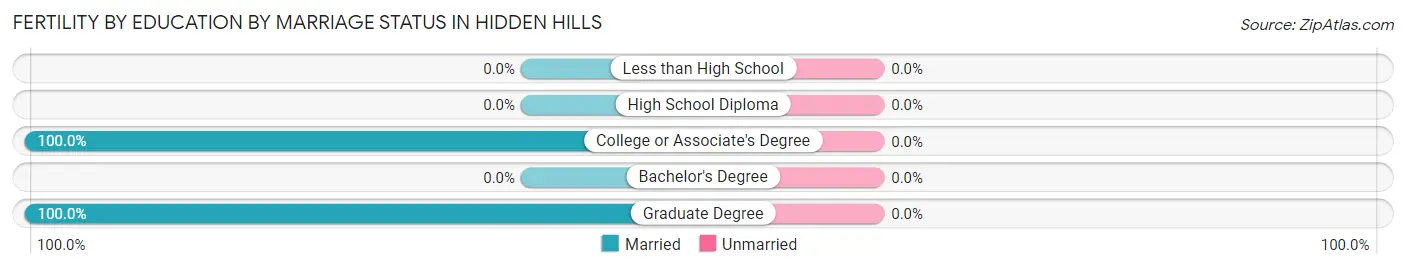
| Educational Attainment | Married | Unmarried |
| Less than High School | 0 (0.0%) | 0 (0.0%) |
| High School Diploma | 0 (0.0%) | 0 (0.0%) |
| College or Associate's Degree | 10 (100.0%) | 0 (0.0%) |
| Bachelor's Degree | 0 (0.0%) | 0 (0.0%) |
| Graduate Degree | 3 (100.0%) | 0 (0.0%) |
| Total | 13 (100.0%) | 0 (0.0%) |
Employment Characteristics in Hidden Hills
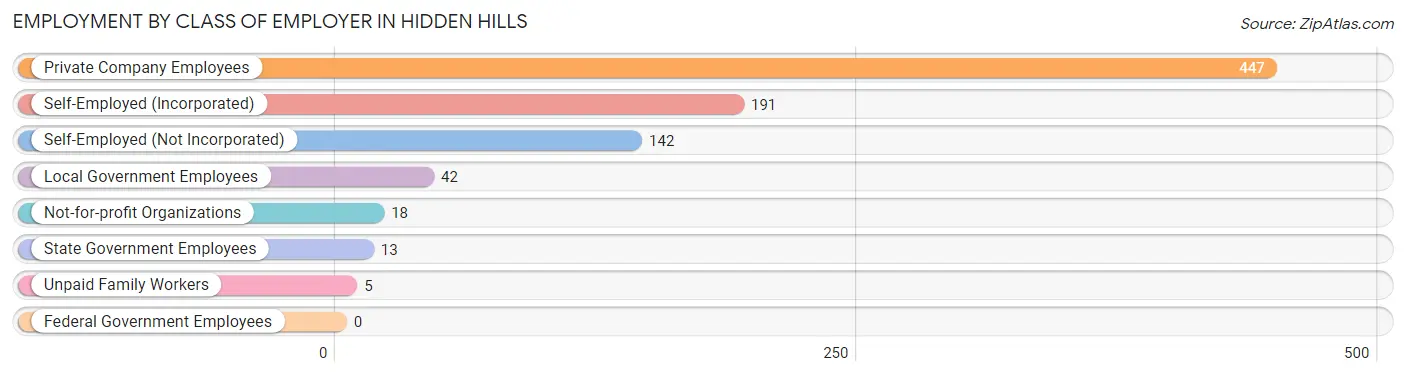
Employment by Class of Employer in Hidden Hills
Among the 858 employed individuals in Hidden Hills, private company employees (447 | 52.1%), self-employed (incorporated) (191 | 22.3%), and self-employed (not incorporated) (142 | 16.6%) make up the most common classes of employment.
| Employer Class | # Employees | % Employees |
| Private Company Employees | 447 | 52.1% |
| Self-Employed (Incorporated) | 191 | 22.3% |
| Self-Employed (Not Incorporated) | 142 | 16.6% |
| Not-for-profit Organizations | 18 | 2.1% |
| Local Government Employees | 42 | 4.9% |
| State Government Employees | 13 | 1.5% |
| Federal Government Employees | 0 | 0.0% |
| Unpaid Family Workers | 5 | 0.6% |
| Total | 858 | 100.0% |
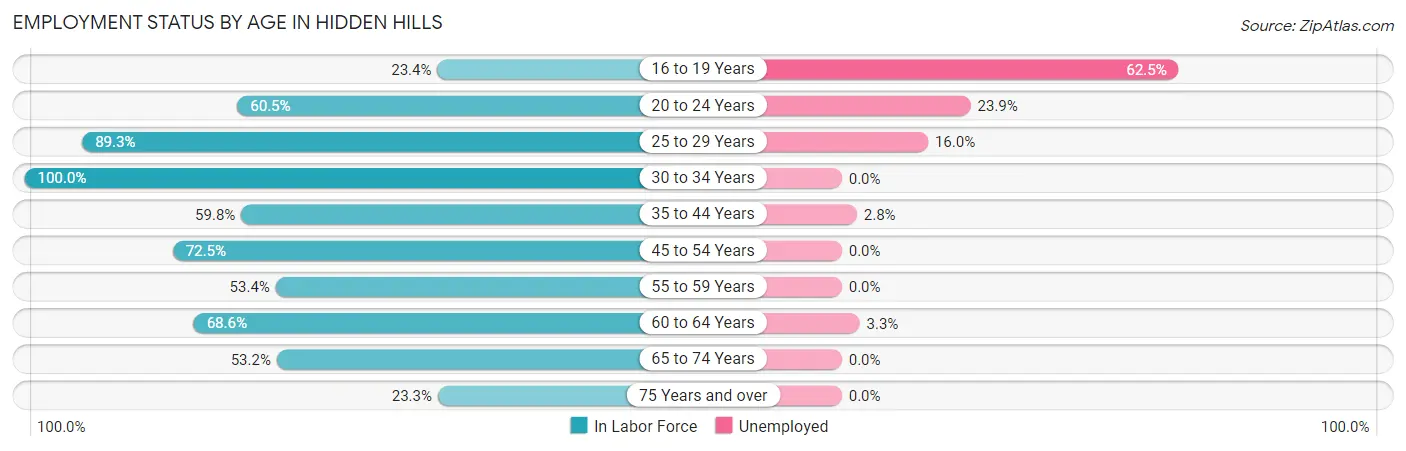
Employment Status by Age in Hidden Hills
According to the labor force statistics for Hidden Hills, out of the total population over 16 years of age (1,614), 57.6% or 930 individuals are in the labor force, with 4.7% or 44 of them unemployed. The age group with the highest labor force participation rate is 30 to 34 years, with 100.0% or 35 individuals in the labor force. Within the labor force, the 16 to 19 years age range has the highest percentage of unemployed individuals, with 62.5% or 20 of them being unemployed.
| Age Bracket | In Labor Force | Unemployed |
| 16 to 19 Years | 32 (23.4%) | 20 (62.5%) |
| 20 to 24 Years | 46 (60.5%) | 11 (23.9%) |
| 25 to 29 Years | 25 (89.3%) | 4 (16.0%) |
| 30 to 34 Years | 35 (100.0%) | 0 (0.0%) |
| 35 to 44 Years | 143 (59.8%) | 4 (2.8%) |
| 45 to 54 Years | 242 (72.5%) | 0 (0.0%) |
| 55 to 59 Years | 101 (53.4%) | 0 (0.0%) |
| 60 to 64 Years | 153 (68.6%) | 5 (3.3%) |
| 65 to 74 Years | 126 (53.2%) | 0 (0.0%) |
| 75 Years and over | 27 (23.3%) | 0 (0.0%) |
| Total | 930 (57.6%) | 44 (4.7%) |
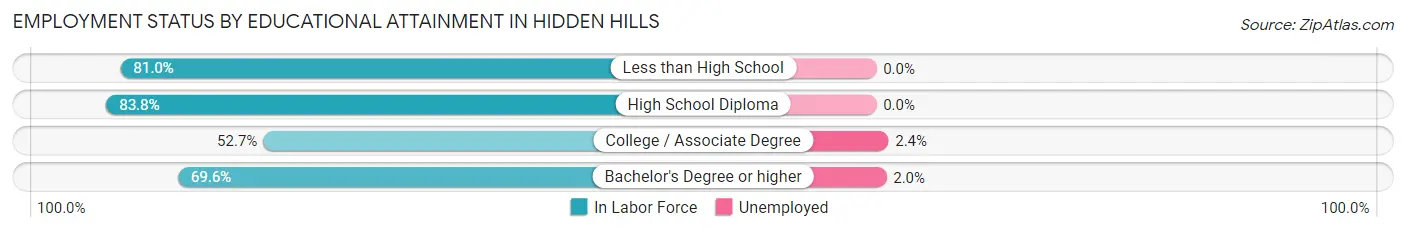
Employment Status by Educational Attainment in Hidden Hills
According to labor force statistics for Hidden Hills, 66.7% of individuals (699) out of the total population between 25 and 64 years of age (1,048) are in the labor force, with 1.9% or 13 of them being unemployed. The group with the highest labor force participation rate are those with the educational attainment of high school diploma, with 83.8% or 31 individuals in the labor force. Within the labor force, individuals with college / associate degree education have the highest percentage of unemployment, with 2.4% or 3 of them being unemployed.
| Educational Attainment | In Labor Force | Unemployed |
| Less than High School | 34 (81.0%) | 0 (0.0%) |
| High School Diploma | 31 (83.8%) | 0 (0.0%) |
| College / Associate Degree | 127 (52.7%) | 6 (2.4%) |
| Bachelor's Degree or higher | 507 (69.6%) | 15 (2.0%) |
| Total | 699 (66.7%) | 20 (1.9%) |
Employment Occupations by Sex in Hidden Hills
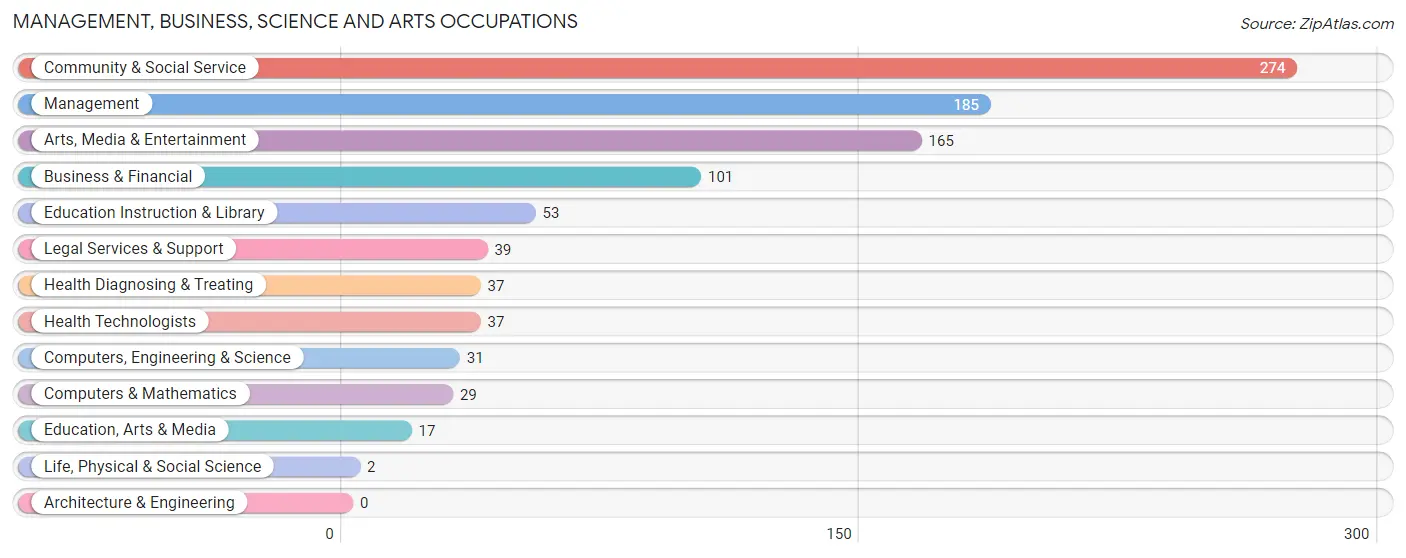
Management, Business, Science and Arts Occupations
The most common Management, Business, Science and Arts occupations in Hidden Hills are Community & Social Service (274 | 30.9%), Management (185 | 20.9%), Arts, Media & Entertainment (165 | 18.6%), Business & Financial (101 | 11.4%), and Education Instruction & Library (53 | 6.0%).
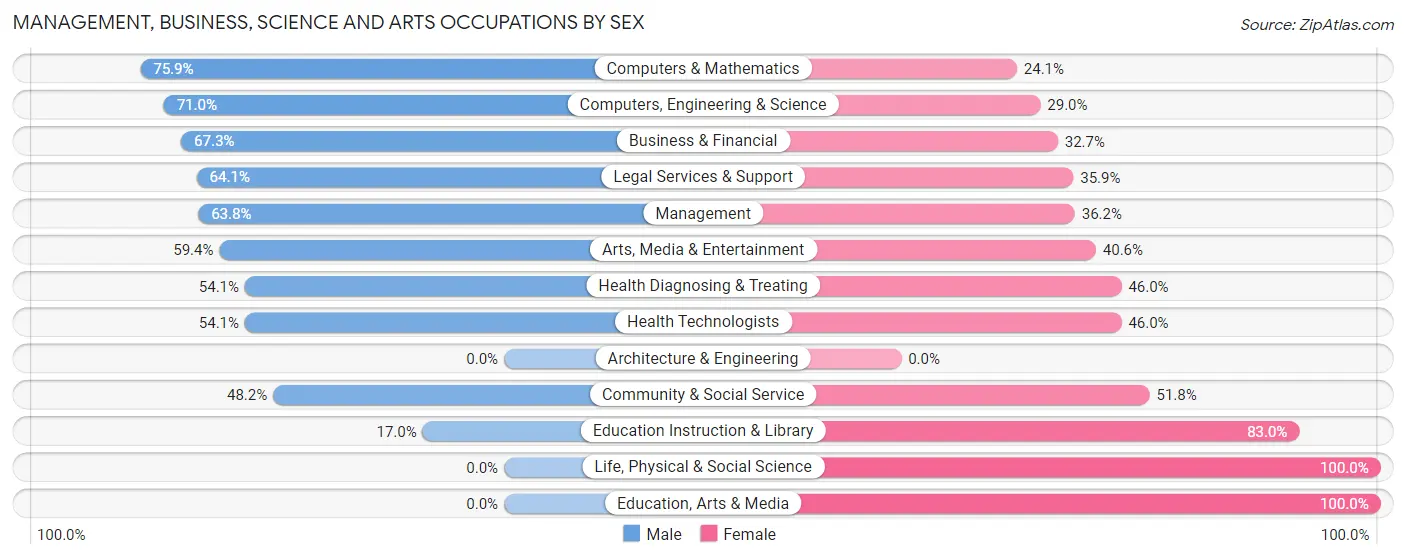
Management, Business, Science and Arts Occupations by Sex
Within the Management, Business, Science and Arts occupations in Hidden Hills, the most male-oriented occupations are Computers & Mathematics (75.9%), Computers, Engineering & Science (71.0%), and Business & Financial (67.3%), while the most female-oriented occupations are Life, Physical & Social Science (100.0%), Education, Arts & Media (100.0%), and Education Instruction & Library (83.0%).
| Occupation | Male | Female |
| Management | 118 (63.8%) | 67 (36.2%) |
| Business & Financial | 68 (67.3%) | 33 (32.7%) |
| Computers, Engineering & Science | 22 (71.0%) | 9 (29.0%) |
| Computers & Mathematics | 22 (75.9%) | 7 (24.1%) |
| Architecture & Engineering | 0 (0.0%) | 0 (0.0%) |
| Life, Physical & Social Science | 0 (0.0%) | 2 (100.0%) |
| Community & Social Service | 132 (48.2%) | 142 (51.8%) |
| Education, Arts & Media | 0 (0.0%) | 17 (100.0%) |
| Legal Services & Support | 25 (64.1%) | 14 (35.9%) |
| Education Instruction & Library | 9 (17.0%) | 44 (83.0%) |
| Arts, Media & Entertainment | 98 (59.4%) | 67 (40.6%) |
| Health Diagnosing & Treating | 20 (54.0%) | 17 (46.0%) |
| Health Technologists | 20 (54.0%) | 17 (46.0%) |
| Total (Category) | 360 (57.3%) | 268 (42.7%) |
| Total (Overall) | 501 (56.6%) | 385 (43.4%) |
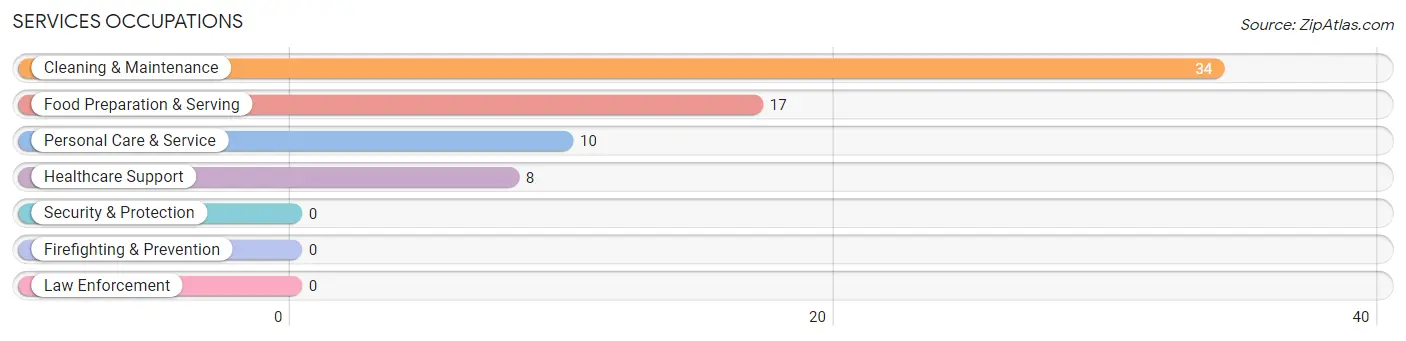
Services Occupations
The most common Services occupations in Hidden Hills are Cleaning & Maintenance (34 | 3.8%), Food Preparation & Serving (17 | 1.9%), Personal Care & Service (10 | 1.1%), and Healthcare Support (8 | 0.9%).
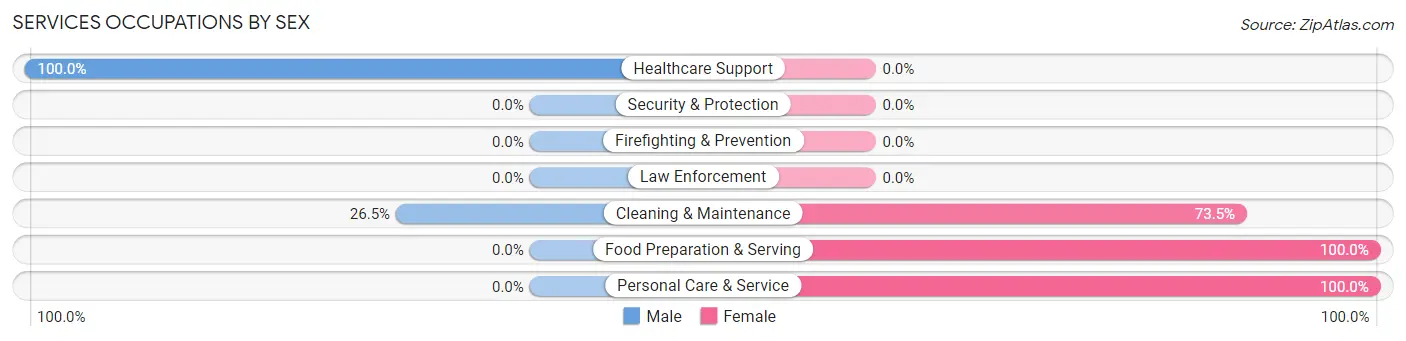
Services Occupations by Sex
Within the Services occupations in Hidden Hills, the most male-oriented occupations are Healthcare Support (100.0%), and Cleaning & Maintenance (26.5%), while the most female-oriented occupations are Food Preparation & Serving (100.0%), Personal Care & Service (100.0%), and Cleaning & Maintenance (73.5%).
| Occupation | Male | Female |
| Healthcare Support | 8 (100.0%) | 0 (0.0%) |
| Security & Protection | 0 (0.0%) | 0 (0.0%) |
| Firefighting & Prevention | 0 (0.0%) | 0 (0.0%) |
| Law Enforcement | 0 (0.0%) | 0 (0.0%) |
| Food Preparation & Serving | 0 (0.0%) | 17 (100.0%) |
| Cleaning & Maintenance | 9 (26.5%) | 25 (73.5%) |
| Personal Care & Service | 0 (0.0%) | 10 (100.0%) |
| Total (Category) | 17 (24.6%) | 52 (75.4%) |
| Total (Overall) | 501 (56.6%) | 385 (43.4%) |
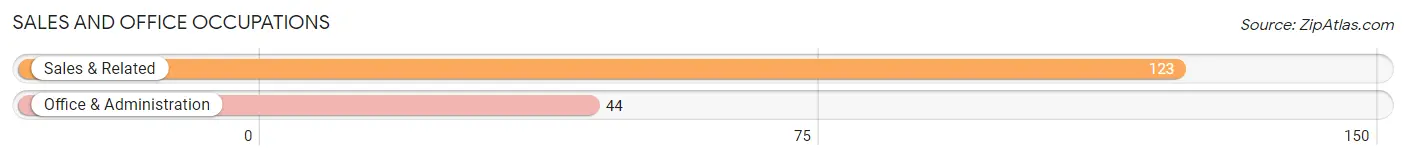
Sales and Office Occupations
The most common Sales and Office occupations in Hidden Hills are Sales & Related (123 | 13.9%), and Office & Administration (44 | 5.0%).
Sales and Office Occupations by Sex
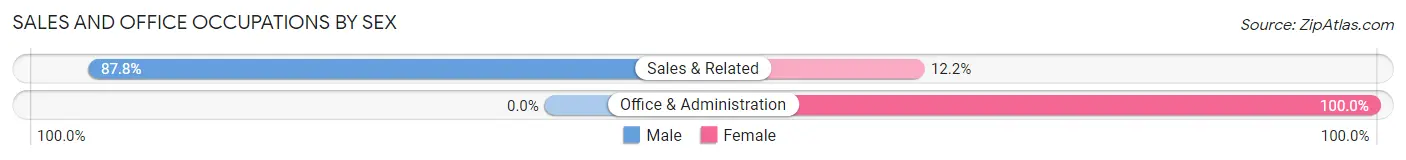
| Occupation | Male | Female |
| Sales & Related | 108 (87.8%) | 15 (12.2%) |
| Office & Administration | 0 (0.0%) | 44 (100.0%) |
| Total (Category) | 108 (64.7%) | 59 (35.3%) |
| Total (Overall) | 501 (56.6%) | 385 (43.4%) |
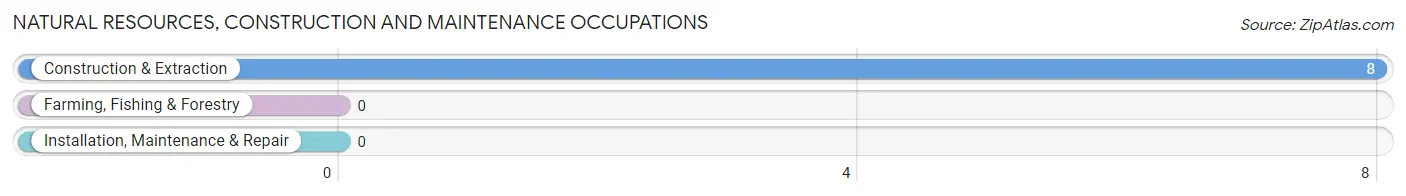
Natural Resources, Construction and Maintenance Occupations
The most common Natural Resources, Construction and Maintenance occupations in Hidden Hills are , and Construction & Extraction (8 | 0.9%).
Natural Resources, Construction and Maintenance Occupations by Sex
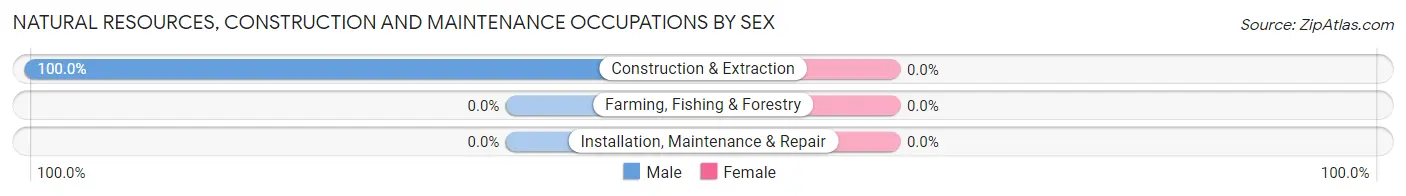
| Occupation | Male | Female |
| Farming, Fishing & Forestry | 0 (0.0%) | 0 (0.0%) |
| Construction & Extraction | 8 (100.0%) | 0 (0.0%) |
| Installation, Maintenance & Repair | 0 (0.0%) | 0 (0.0%) |
| Total (Category) | 8 (100.0%) | 0 (0.0%) |
| Total (Overall) | 501 (56.6%) | 385 (43.4%) |
Production, Transportation and Moving Occupations
The most common Production, Transportation and Moving occupations in Hidden Hills are , and Transportation (14 | 1.6%).
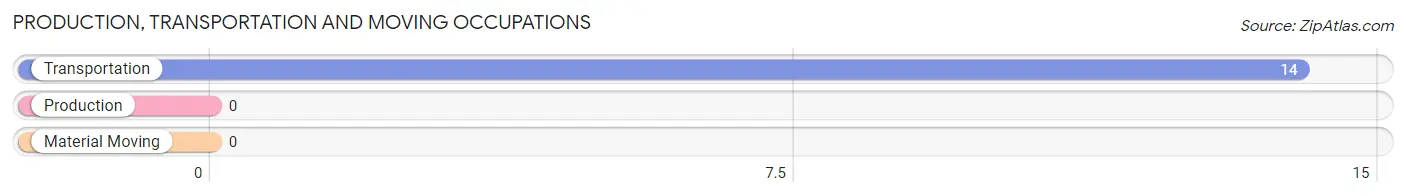
Production, Transportation and Moving Occupations by Sex
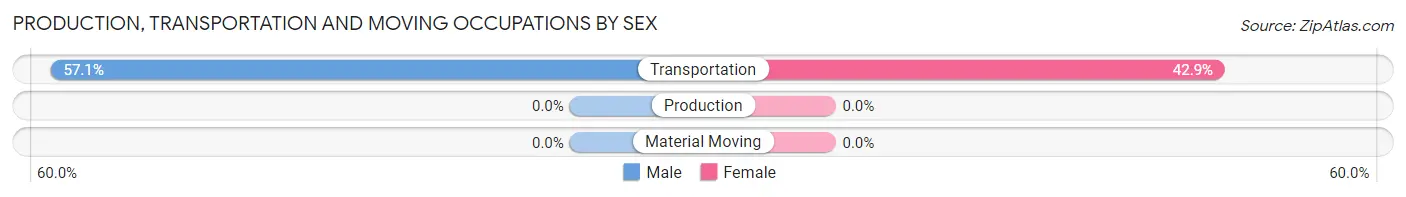
| Occupation | Male | Female |
| Production | 0 (0.0%) | 0 (0.0%) |
| Transportation | 8 (57.1%) | 6 (42.9%) |
| Material Moving | 0 (0.0%) | 0 (0.0%) |
| Total (Category) | 8 (57.1%) | 6 (42.9%) |
| Total (Overall) | 501 (56.6%) | 385 (43.4%) |
Employment Industries by Sex in Hidden Hills
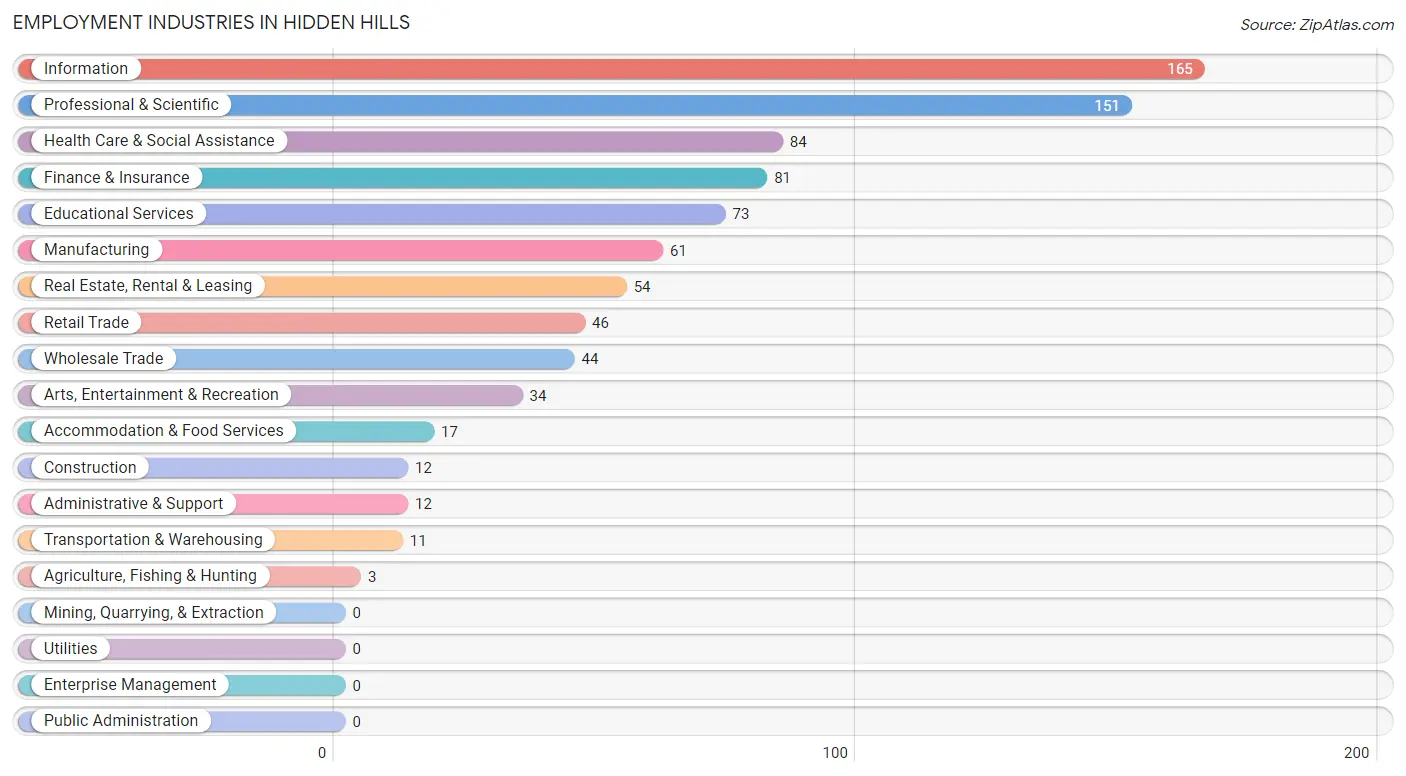
Employment Industries in Hidden Hills
The major employment industries in Hidden Hills include Information (165 | 18.6%), Professional & Scientific (151 | 17.0%), Health Care & Social Assistance (84 | 9.5%), Finance & Insurance (81 | 9.1%), and Educational Services (73 | 8.2%).
Employment Industries by Sex in Hidden Hills
The Hidden Hills industries that see more men than women are Agriculture, Fishing & Hunting (100.0%), Construction (100.0%), and Professional & Scientific (83.4%), whereas the industries that tend to have a higher number of women are Transportation & Warehousing (100.0%), Accommodation & Food Services (100.0%), and Educational Services (87.7%).
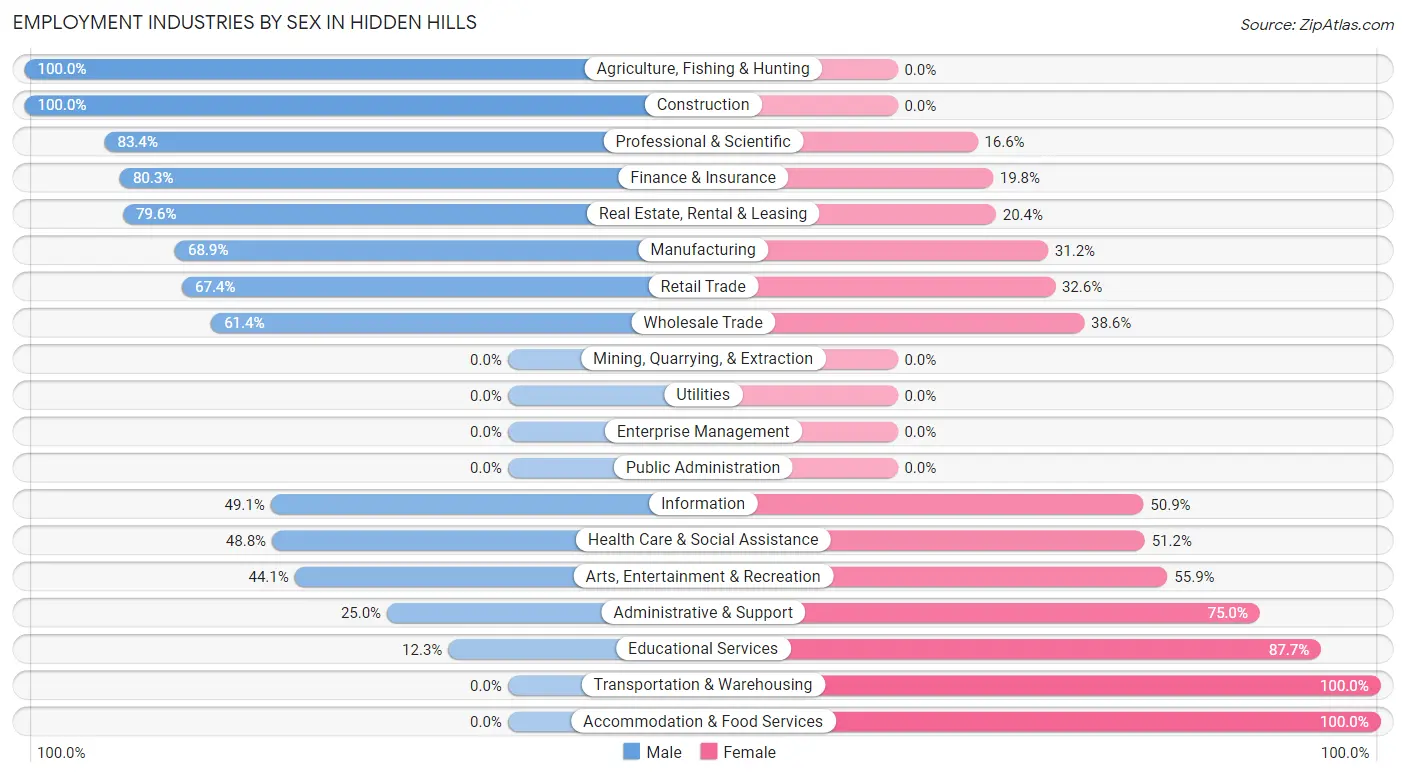
| Industry | Male | Female |
| Agriculture, Fishing & Hunting | 3 (100.0%) | 0 (0.0%) |
| Mining, Quarrying, & Extraction | 0 (0.0%) | 0 (0.0%) |
| Construction | 12 (100.0%) | 0 (0.0%) |
| Manufacturing | 42 (68.9%) | 19 (31.1%) |
| Wholesale Trade | 27 (61.4%) | 17 (38.6%) |
| Retail Trade | 31 (67.4%) | 15 (32.6%) |
| Transportation & Warehousing | 0 (0.0%) | 11 (100.0%) |
| Utilities | 0 (0.0%) | 0 (0.0%) |
| Information | 81 (49.1%) | 84 (50.9%) |
| Finance & Insurance | 65 (80.2%) | 16 (19.8%) |
| Real Estate, Rental & Leasing | 43 (79.6%) | 11 (20.4%) |
| Professional & Scientific | 126 (83.4%) | 25 (16.6%) |
| Enterprise Management | 0 (0.0%) | 0 (0.0%) |
| Administrative & Support | 3 (25.0%) | 9 (75.0%) |
| Educational Services | 9 (12.3%) | 64 (87.7%) |
| Health Care & Social Assistance | 41 (48.8%) | 43 (51.2%) |
| Arts, Entertainment & Recreation | 15 (44.1%) | 19 (55.9%) |
| Accommodation & Food Services | 0 (0.0%) | 17 (100.0%) |
| Public Administration | 0 (0.0%) | 0 (0.0%) |
| Total | 501 (56.6%) | 385 (43.4%) |
Education in Hidden Hills
School Enrollment in Hidden Hills
The most common levels of schooling among the 647 students in Hidden Hills are elementary school (183 | 28.3%), high school (166 | 25.7%), and middle school (114 | 17.6%).
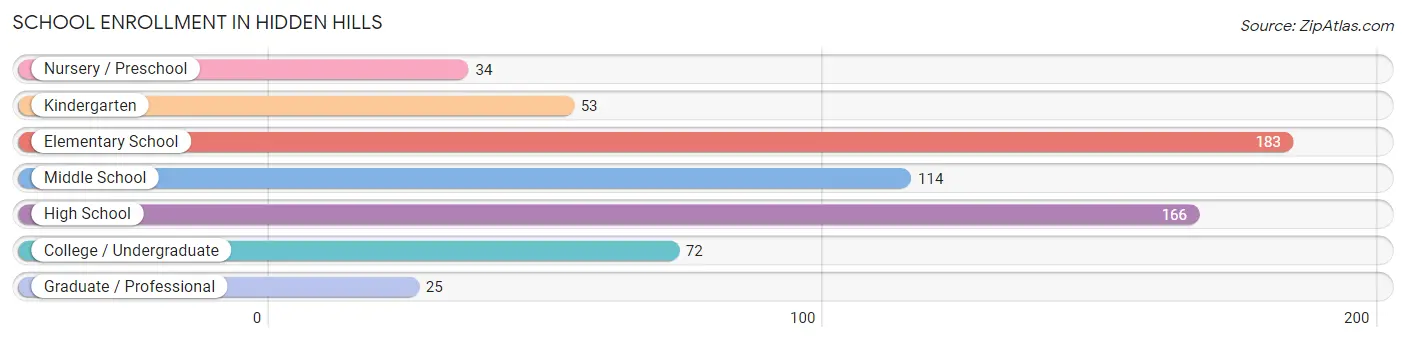
| School Level | # Students | % Students |
| Nursery / Preschool | 34 | 5.3% |
| Kindergarten | 53 | 8.2% |
| Elementary School | 183 | 28.3% |
| Middle School | 114 | 17.6% |
| High School | 166 | 25.7% |
| College / Undergraduate | 72 | 11.1% |
| Graduate / Professional | 25 | 3.9% |
| Total | 647 | 100.0% |
School Enrollment by Age by Funding Source in Hidden Hills
Out of a total of 647 students who are enrolled in schools in Hidden Hills, 288 (44.5%) attend a private institution, while the remaining 359 (55.5%) are enrolled in public schools. The age group of 35 years and over has the highest likelihood of being enrolled in private schools, with 21 (95.5% in the age bracket) enrolled. Conversely, the age group of 18 to 19 year olds has the lowest likelihood of being enrolled in a private school, with 51 (100.0% in the age bracket) attending a public institution.
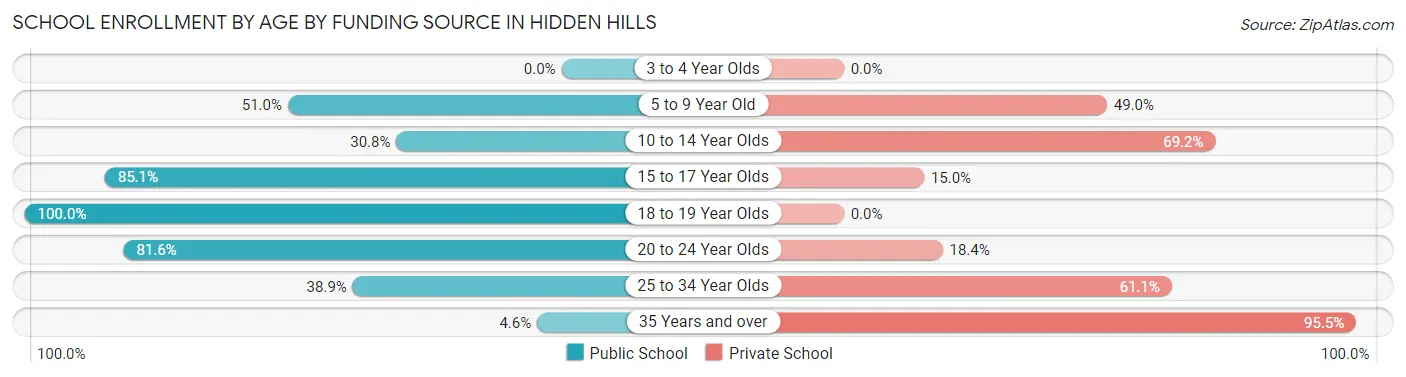
| Age Bracket | Public School | Private School |
| 3 to 4 Year Olds | 0 (0.0%) | 0 (0.0%) |
| 5 to 9 Year Old | 130 (51.0%) | 125 (49.0%) |
| 10 to 14 Year Olds | 48 (30.8%) | 108 (69.2%) |
| 15 to 17 Year Olds | 91 (85.1%) | 16 (14.9%) |
| 18 to 19 Year Olds | 51 (100.0%) | 0 (0.0%) |
| 20 to 24 Year Olds | 31 (81.6%) | 7 (18.4%) |
| 25 to 34 Year Olds | 7 (38.9%) | 11 (61.1%) |
| 35 Years and over | 1 (4.5%) | 21 (95.5%) |
| Total | 359 (55.5%) | 288 (44.5%) |
Educational Attainment by Field of Study in Hidden Hills
Social sciences (218 | 20.7%), business (210 | 19.9%), visual & performing arts (162 | 15.4%), psychology (83 | 7.9%), and science & technology (66 | 6.3%) are the most common fields of study among 1,053 individuals in Hidden Hills who have obtained a bachelor's degree or higher.
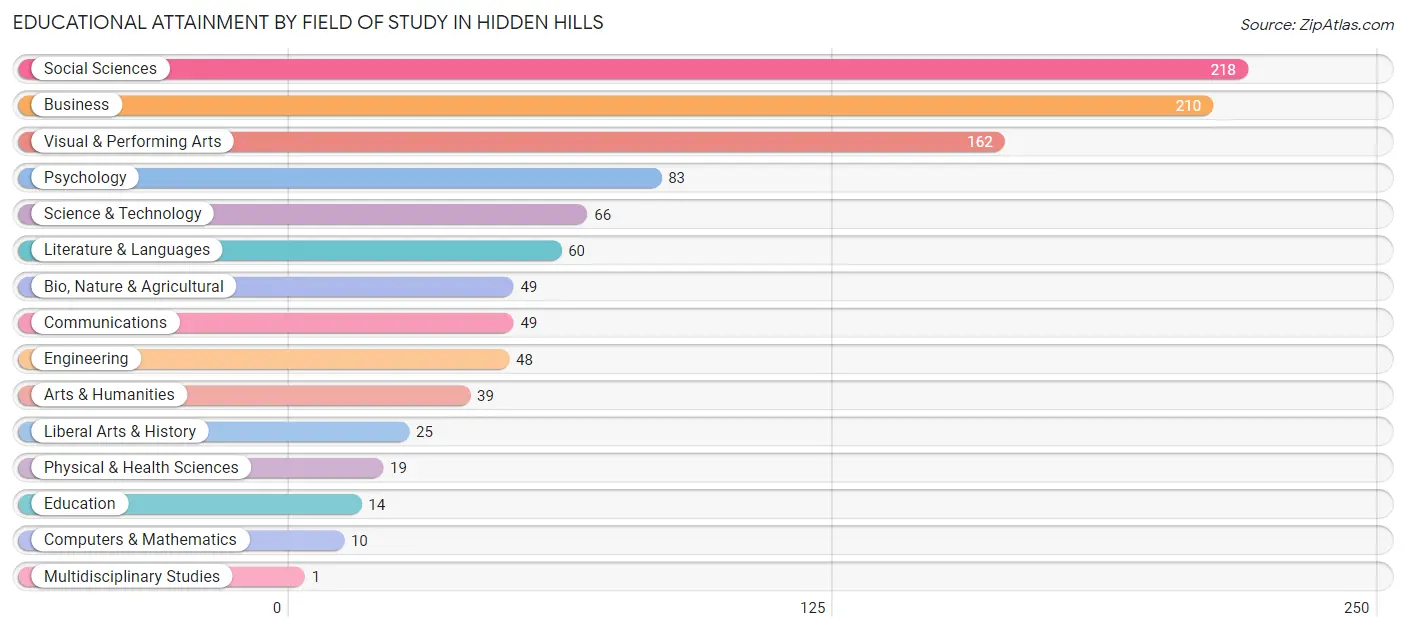
| Field of Study | # Graduates | % Graduates |
| Computers & Mathematics | 10 | 0.9% |
| Bio, Nature & Agricultural | 49 | 4.6% |
| Physical & Health Sciences | 19 | 1.8% |
| Psychology | 83 | 7.9% |
| Social Sciences | 218 | 20.7% |
| Engineering | 48 | 4.6% |
| Multidisciplinary Studies | 1 | 0.1% |
| Science & Technology | 66 | 6.3% |
| Business | 210 | 19.9% |
| Education | 14 | 1.3% |
| Literature & Languages | 60 | 5.7% |
| Liberal Arts & History | 25 | 2.4% |
| Visual & Performing Arts | 162 | 15.4% |
| Communications | 49 | 4.6% |
| Arts & Humanities | 39 | 3.7% |
| Total | 1,053 | 100.0% |
Transportation & Commute in Hidden Hills
Vehicle Availability by Sex in Hidden Hills
The most prevalent vehicle ownership categories in Hidden Hills are males with 2 vehicles (166, accounting for 33.9%) and females with 2 vehicles (67, making up 45.1%).
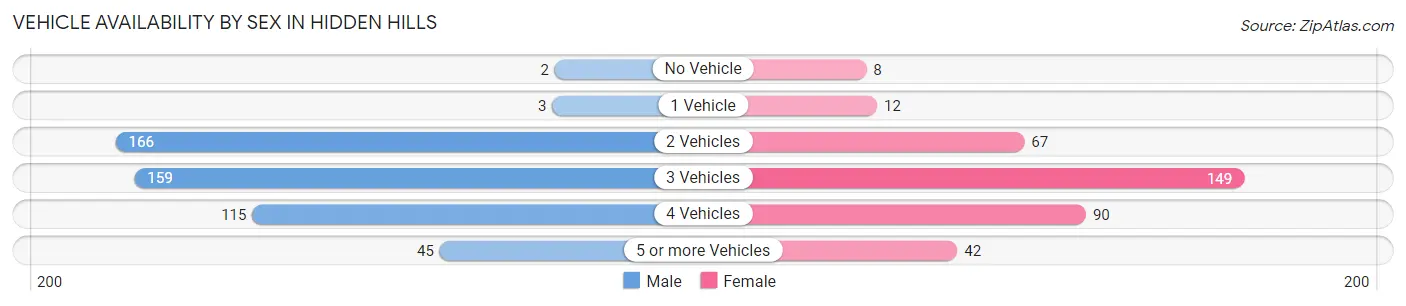
| Vehicles Available | Male | Female |
| No Vehicle | 2 (0.4%) | 8 (2.2%) |
| 1 Vehicle | 3 (0.6%) | 12 (3.3%) |
| 2 Vehicles | 166 (33.9%) | 67 (18.2%) |
| 3 Vehicles | 159 (32.5%) | 149 (40.5%) |
| 4 Vehicles | 115 (23.5%) | 90 (24.5%) |
| 5 or more Vehicles | 45 (9.2%) | 42 (11.4%) |
| Total | 490 (100.0%) | 368 (100.0%) |
Commute Time in Hidden Hills
The most frequently occuring commute durations in Hidden Hills are 15 to 19 minutes (146 commuters, 25.0%), 20 to 24 minutes (107 commuters, 18.3%), and 30 to 34 minutes (85 commuters, 14.5%).
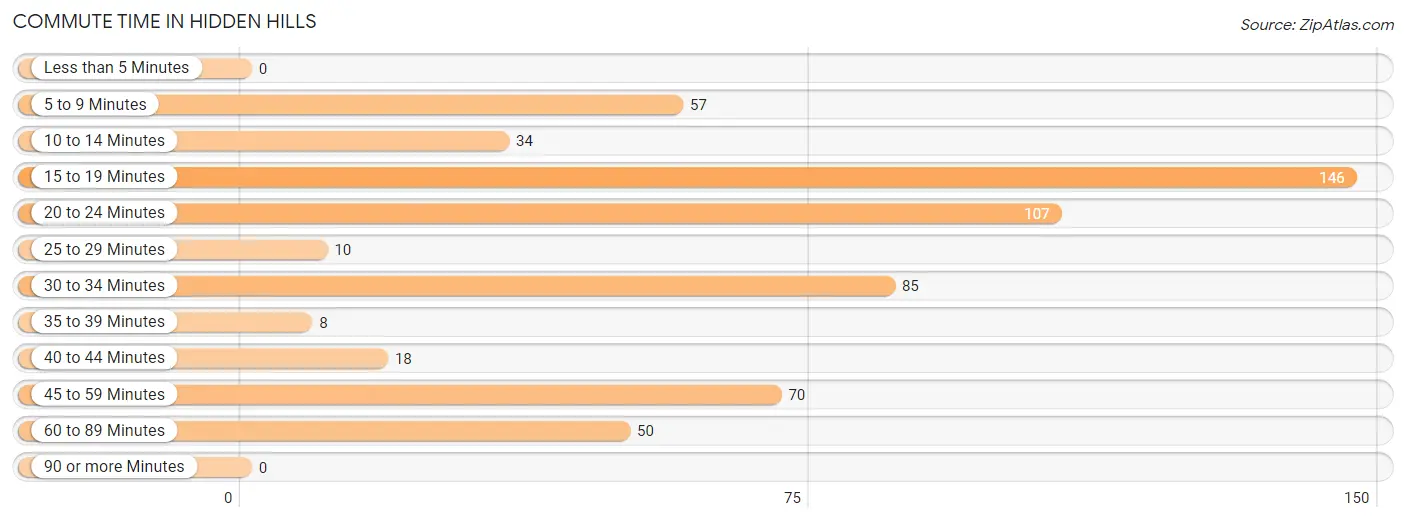
| Commute Time | # Commuters | % Commuters |
| Less than 5 Minutes | 0 | 0.0% |
| 5 to 9 Minutes | 57 | 9.7% |
| 10 to 14 Minutes | 34 | 5.8% |
| 15 to 19 Minutes | 146 | 25.0% |
| 20 to 24 Minutes | 107 | 18.3% |
| 25 to 29 Minutes | 10 | 1.7% |
| 30 to 34 Minutes | 85 | 14.5% |
| 35 to 39 Minutes | 8 | 1.4% |
| 40 to 44 Minutes | 18 | 3.1% |
| 45 to 59 Minutes | 70 | 12.0% |
| 60 to 89 Minutes | 50 | 8.6% |
| 90 or more Minutes | 0 | 0.0% |
Commute Time by Sex in Hidden Hills
The most common commute times in Hidden Hills are 15 to 19 minutes (114 commuters, 32.3%) for males and 20 to 24 minutes (59 commuters, 25.4%) for females.
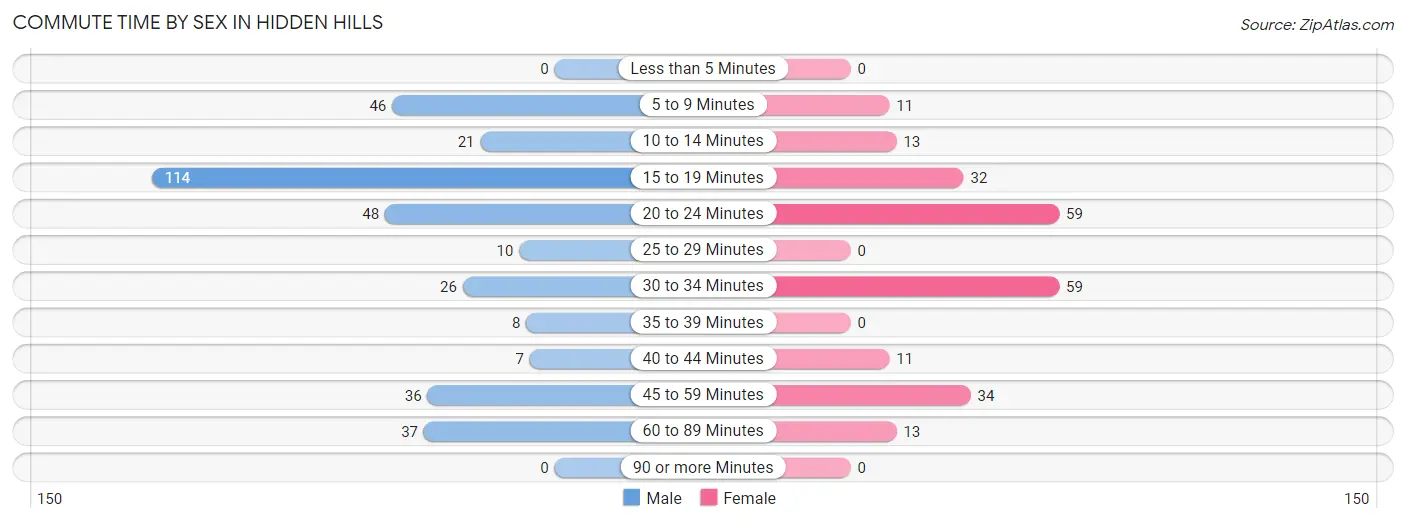
| Commute Time | Male | Female |
| Less than 5 Minutes | 0 (0.0%) | 0 (0.0%) |
| 5 to 9 Minutes | 46 (13.0%) | 11 (4.7%) |
| 10 to 14 Minutes | 21 (5.9%) | 13 (5.6%) |
| 15 to 19 Minutes | 114 (32.3%) | 32 (13.8%) |
| 20 to 24 Minutes | 48 (13.6%) | 59 (25.4%) |
| 25 to 29 Minutes | 10 (2.8%) | 0 (0.0%) |
| 30 to 34 Minutes | 26 (7.4%) | 59 (25.4%) |
| 35 to 39 Minutes | 8 (2.3%) | 0 (0.0%) |
| 40 to 44 Minutes | 7 (2.0%) | 11 (4.7%) |
| 45 to 59 Minutes | 36 (10.2%) | 34 (14.7%) |
| 60 to 89 Minutes | 37 (10.5%) | 13 (5.6%) |
| 90 or more Minutes | 0 (0.0%) | 0 (0.0%) |
Time of Departure to Work by Sex in Hidden Hills
The most frequent times of departure to work in Hidden Hills are 9:00 AM to 9:59 AM (82, 23.2%) for males and 8:00 AM to 8:29 AM (65, 28.0%) for females.
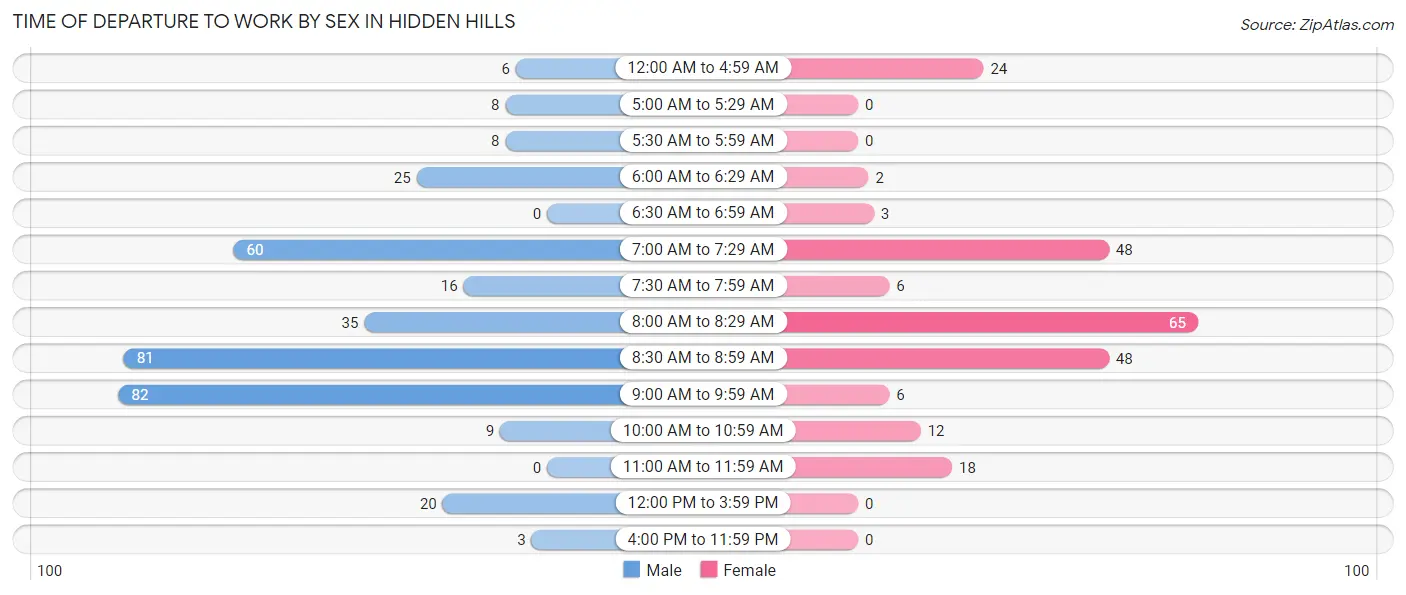
| Time of Departure | Male | Female |
| 12:00 AM to 4:59 AM | 6 (1.7%) | 24 (10.3%) |
| 5:00 AM to 5:29 AM | 8 (2.3%) | 0 (0.0%) |
| 5:30 AM to 5:59 AM | 8 (2.3%) | 0 (0.0%) |
| 6:00 AM to 6:29 AM | 25 (7.1%) | 2 (0.9%) |
| 6:30 AM to 6:59 AM | 0 (0.0%) | 3 (1.3%) |
| 7:00 AM to 7:29 AM | 60 (17.0%) | 48 (20.7%) |
| 7:30 AM to 7:59 AM | 16 (4.5%) | 6 (2.6%) |
| 8:00 AM to 8:29 AM | 35 (9.9%) | 65 (28.0%) |
| 8:30 AM to 8:59 AM | 81 (23.0%) | 48 (20.7%) |
| 9:00 AM to 9:59 AM | 82 (23.2%) | 6 (2.6%) |
| 10:00 AM to 10:59 AM | 9 (2.5%) | 12 (5.2%) |
| 11:00 AM to 11:59 AM | 0 (0.0%) | 18 (7.8%) |
| 12:00 PM to 3:59 PM | 20 (5.7%) | 0 (0.0%) |
| 4:00 PM to 11:59 PM | 3 (0.9%) | 0 (0.0%) |
| Total | 353 (100.0%) | 232 (100.0%) |
Housing Occupancy in Hidden Hills
Occupancy by Ownership in Hidden Hills
Of the total 646 dwellings in Hidden Hills, owner-occupied units account for 587 (90.9%), while renter-occupied units make up 59 (9.1%).
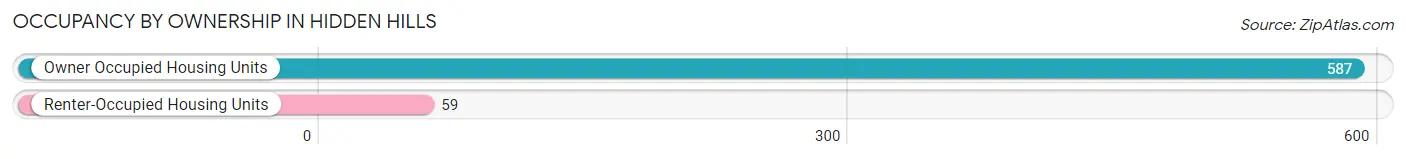
| Occupancy | # Housing Units | % Housing Units |
| Owner Occupied Housing Units | 587 | 90.9% |
| Renter-Occupied Housing Units | 59 | 9.1% |
| Total Occupied Housing Units | 646 | 100.0% |
Occupancy by Household Size in Hidden Hills
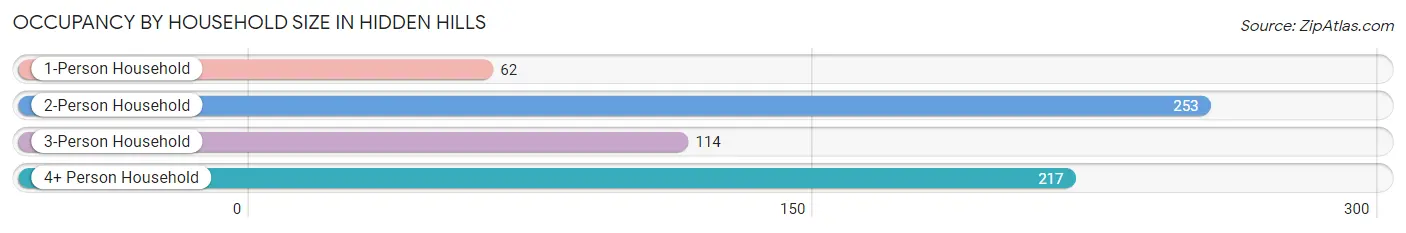
| Household Size | # Housing Units | % Housing Units |
| 1-Person Household | 62 | 9.6% |
| 2-Person Household | 253 | 39.2% |
| 3-Person Household | 114 | 17.6% |
| 4+ Person Household | 217 | 33.6% |
| Total Housing Units | 646 | 100.0% |
Occupancy by Ownership by Household Size in Hidden Hills
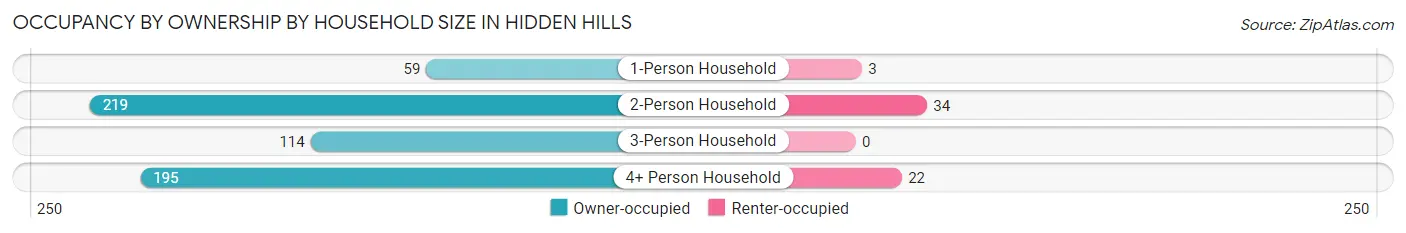
| Household Size | Owner-occupied | Renter-occupied |
| 1-Person Household | 59 (95.2%) | 3 (4.8%) |
| 2-Person Household | 219 (86.6%) | 34 (13.4%) |
| 3-Person Household | 114 (100.0%) | 0 (0.0%) |
| 4+ Person Household | 195 (89.9%) | 22 (10.1%) |
| Total Housing Units | 587 (90.9%) | 59 (9.1%) |
Occupancy by Educational Attainment in Hidden Hills
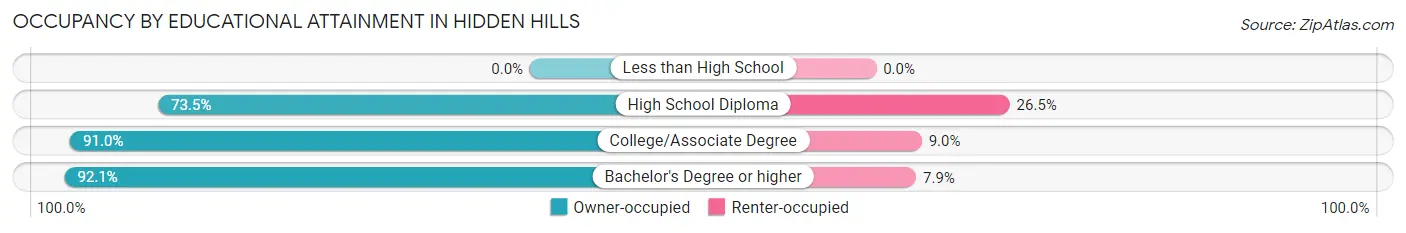
| Household Size | Owner-occupied | Renter-occupied |
| Less than High School | 0 (0.0%) | 0 (0.0%) |
| High School Diploma | 25 (73.5%) | 9 (26.5%) |
| College/Associate Degree | 131 (91.0%) | 13 (9.0%) |
| Bachelor's Degree or higher | 431 (92.1%) | 37 (7.9%) |
Occupancy by Age of Householder in Hidden Hills
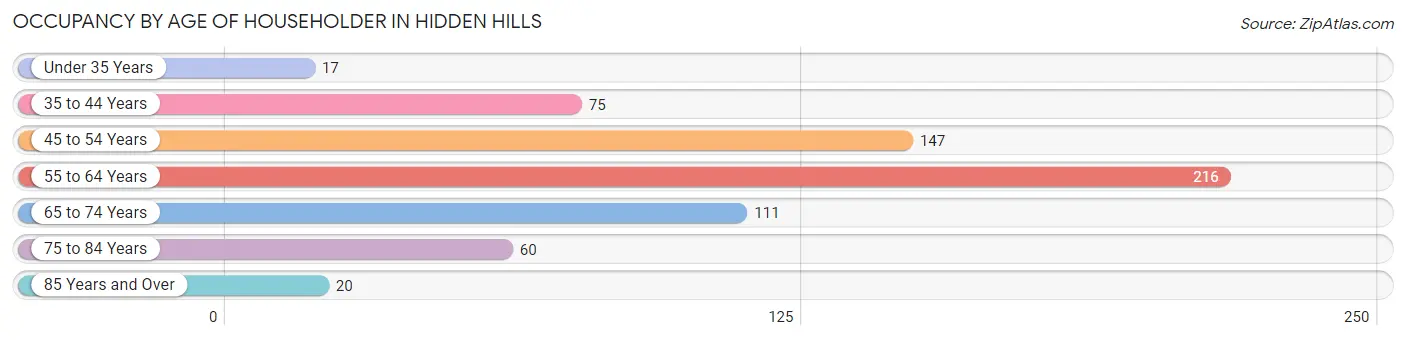
| Age Bracket | # Households | % Households |
| Under 35 Years | 17 | 2.6% |
| 35 to 44 Years | 75 | 11.6% |
| 45 to 54 Years | 147 | 22.8% |
| 55 to 64 Years | 216 | 33.4% |
| 65 to 74 Years | 111 | 17.2% |
| 75 to 84 Years | 60 | 9.3% |
| 85 Years and Over | 20 | 3.1% |
| Total | 646 | 100.0% |
Housing Finances in Hidden Hills
Median Income by Occupancy in Hidden Hills
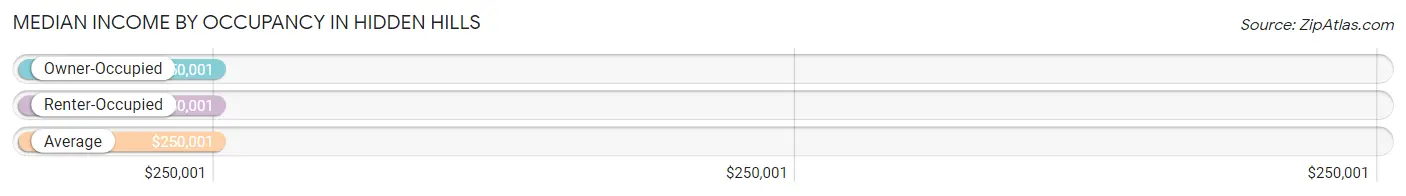
| Occupancy Type | # Households | Median Income |
| Owner-Occupied | 587 (90.9%) | $250,001 |
| Renter-Occupied | 59 (9.1%) | $250,001 |
| Average | 646 (100.0%) | $250,001 |
Occupancy by Householder Income Bracket in Hidden Hills
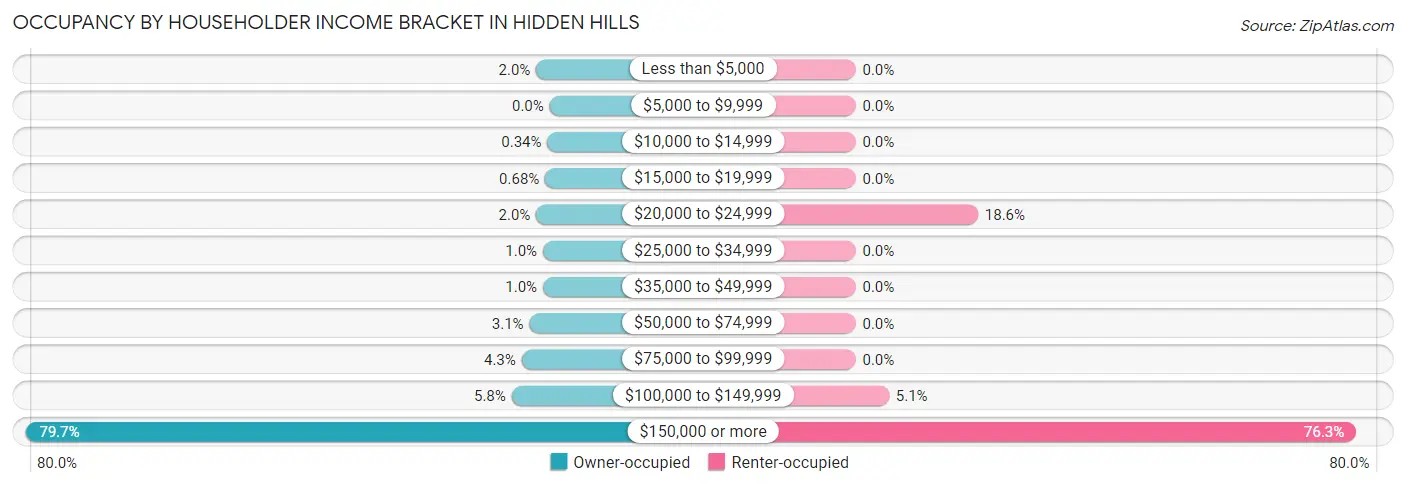
| Income Bracket | Owner-occupied | Renter-occupied |
| Less than $5,000 | 12 (2.0%) | 0 (0.0%) |
| $5,000 to $9,999 | 0 (0.0%) | 0 (0.0%) |
| $10,000 to $14,999 | 2 (0.3%) | 0 (0.0%) |
| $15,000 to $19,999 | 4 (0.7%) | 0 (0.0%) |
| $20,000 to $24,999 | 12 (2.0%) | 11 (18.6%) |
| $25,000 to $34,999 | 6 (1.0%) | 0 (0.0%) |
| $35,000 to $49,999 | 6 (1.0%) | 0 (0.0%) |
| $50,000 to $74,999 | 18 (3.1%) | 0 (0.0%) |
| $75,000 to $99,999 | 25 (4.3%) | 0 (0.0%) |
| $100,000 to $149,999 | 34 (5.8%) | 3 (5.1%) |
| $150,000 or more | 468 (79.7%) | 45 (76.3%) |
| Total | 587 (100.0%) | 59 (100.0%) |
Monthly Housing Cost Tiers in Hidden Hills
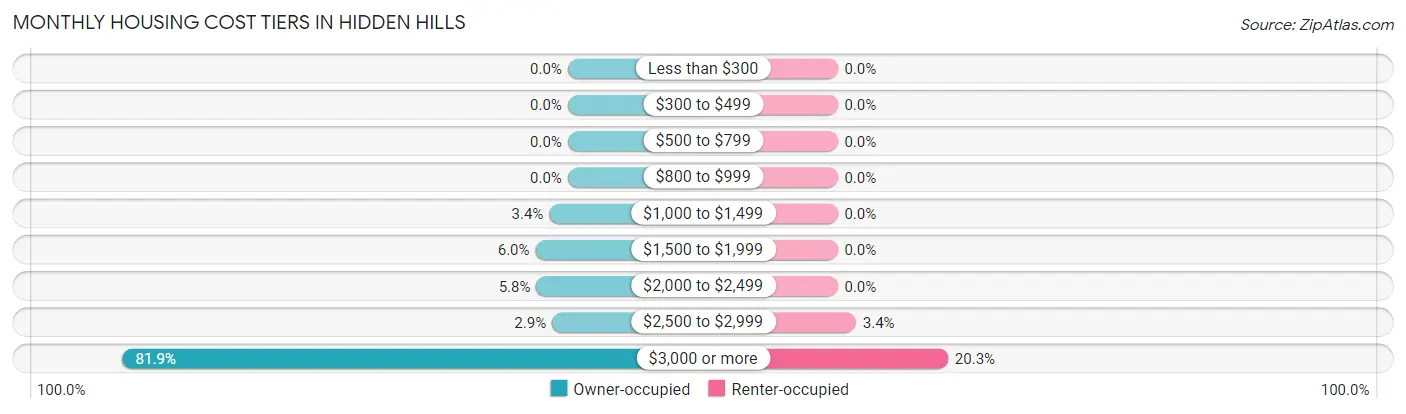
| Monthly Cost | Owner-occupied | Renter-occupied |
| Less than $300 | 0 (0.0%) | 0 (0.0%) |
| $300 to $499 | 0 (0.0%) | 0 (0.0%) |
| $500 to $799 | 0 (0.0%) | 0 (0.0%) |
| $800 to $999 | 0 (0.0%) | 0 (0.0%) |
| $1,000 to $1,499 | 20 (3.4%) | 0 (0.0%) |
| $1,500 to $1,999 | 35 (6.0%) | 0 (0.0%) |
| $2,000 to $2,499 | 34 (5.8%) | 0 (0.0%) |
| $2,500 to $2,999 | 17 (2.9%) | 2 (3.4%) |
| $3,000 or more | 481 (81.9%) | 12 (20.3%) |
| Total | 587 (100.0%) | 59 (100.0%) |
Physical Housing Characteristics in Hidden Hills
Housing Structures in Hidden Hills
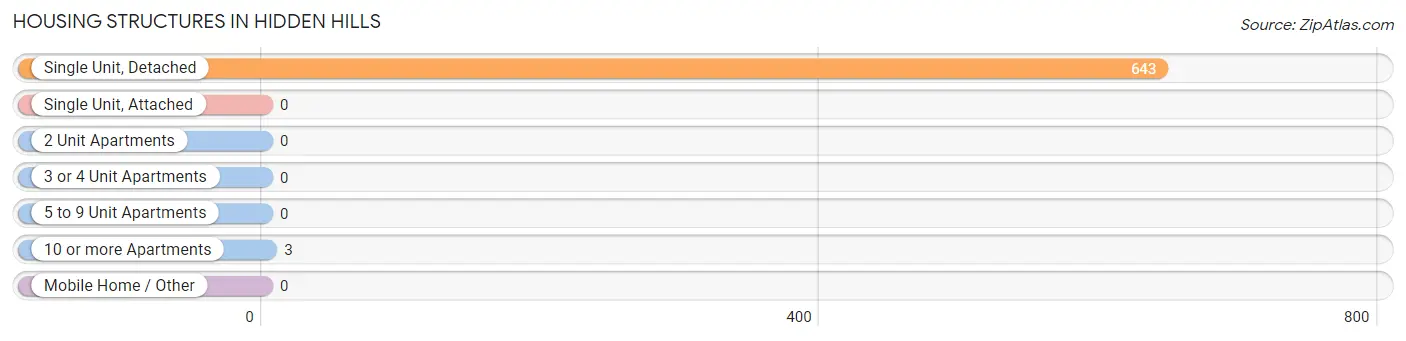
| Structure Type | # Housing Units | % Housing Units |
| Single Unit, Detached | 643 | 99.5% |
| Single Unit, Attached | 0 | 0.0% |
| 2 Unit Apartments | 0 | 0.0% |
| 3 or 4 Unit Apartments | 0 | 0.0% |
| 5 to 9 Unit Apartments | 0 | 0.0% |
| 10 or more Apartments | 3 | 0.5% |
| Mobile Home / Other | 0 | 0.0% |
| Total | 646 | 100.0% |
Housing Structures by Occupancy in Hidden Hills
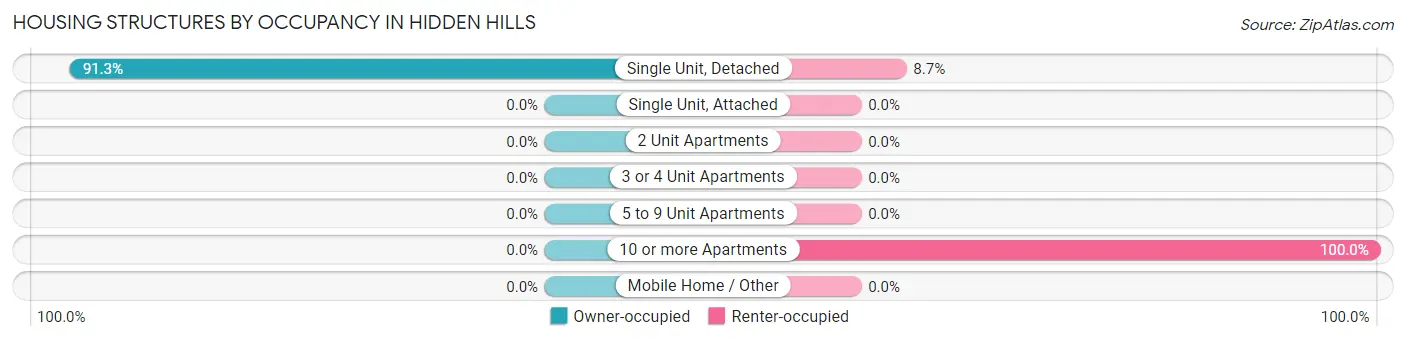
| Structure Type | Owner-occupied | Renter-occupied |
| Single Unit, Detached | 587 (91.3%) | 56 (8.7%) |
| Single Unit, Attached | 0 (0.0%) | 0 (0.0%) |
| 2 Unit Apartments | 0 (0.0%) | 0 (0.0%) |
| 3 or 4 Unit Apartments | 0 (0.0%) | 0 (0.0%) |
| 5 to 9 Unit Apartments | 0 (0.0%) | 0 (0.0%) |
| 10 or more Apartments | 0 (0.0%) | 3 (100.0%) |
| Mobile Home / Other | 0 (0.0%) | 0 (0.0%) |
| Total | 587 (90.9%) | 59 (9.1%) |
Housing Structures by Number of Rooms in Hidden Hills
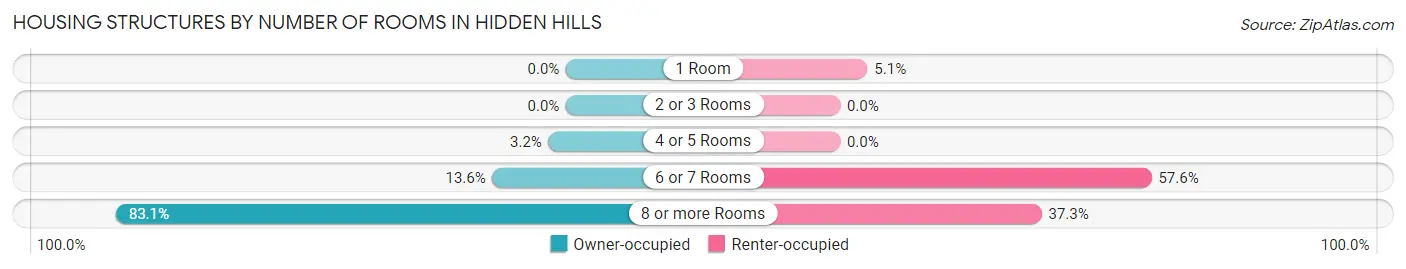
| Number of Rooms | Owner-occupied | Renter-occupied |
| 1 Room | 0 (0.0%) | 3 (5.1%) |
| 2 or 3 Rooms | 0 (0.0%) | 0 (0.0%) |
| 4 or 5 Rooms | 19 (3.2%) | 0 (0.0%) |
| 6 or 7 Rooms | 80 (13.6%) | 34 (57.6%) |
| 8 or more Rooms | 488 (83.1%) | 22 (37.3%) |
| Total | 587 (100.0%) | 59 (100.0%) |
Housing Structure by Heating Type in Hidden Hills
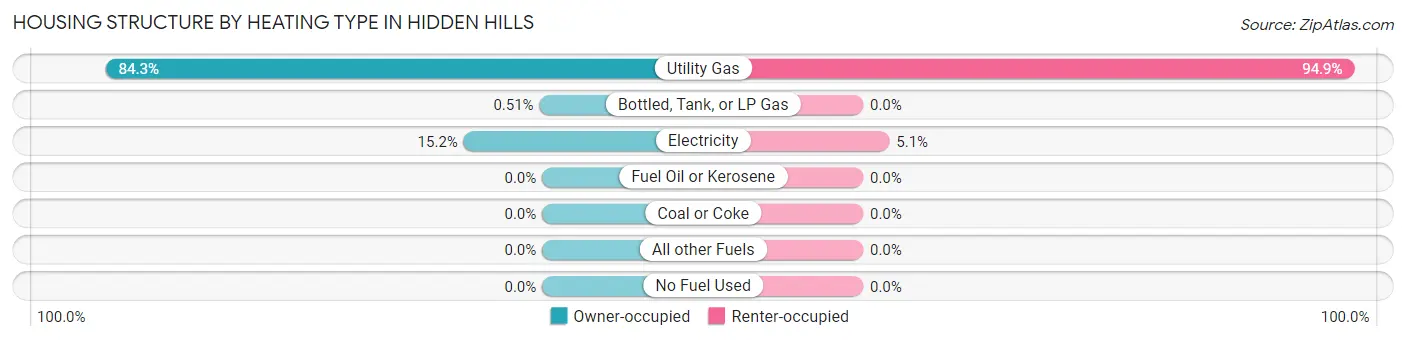
| Heating Type | Owner-occupied | Renter-occupied |
| Utility Gas | 495 (84.3%) | 56 (94.9%) |
| Bottled, Tank, or LP Gas | 3 (0.5%) | 0 (0.0%) |
| Electricity | 89 (15.2%) | 3 (5.1%) |
| Fuel Oil or Kerosene | 0 (0.0%) | 0 (0.0%) |
| Coal or Coke | 0 (0.0%) | 0 (0.0%) |
| All other Fuels | 0 (0.0%) | 0 (0.0%) |
| No Fuel Used | 0 (0.0%) | 0 (0.0%) |
| Total | 587 (100.0%) | 59 (100.0%) |
Household Vehicle Usage in Hidden Hills
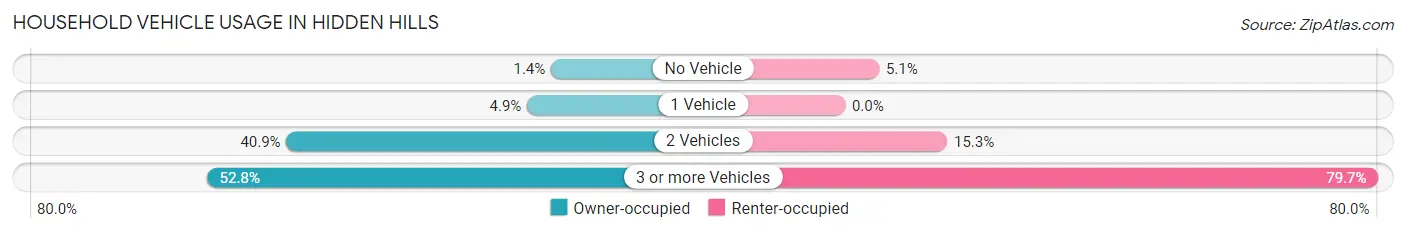
| Vehicles per Household | Owner-occupied | Renter-occupied |
| No Vehicle | 8 (1.4%) | 3 (5.1%) |
| 1 Vehicle | 29 (4.9%) | 0 (0.0%) |
| 2 Vehicles | 240 (40.9%) | 9 (15.2%) |
| 3 or more Vehicles | 310 (52.8%) | 47 (79.7%) |
| Total | 587 (100.0%) | 59 (100.0%) |
Real Estate & Mortgages in Hidden Hills
Real Estate and Mortgage Overview in Hidden Hills
| Characteristic | Without Mortgage | With Mortgage |
| Housing Units | 259 | 328 |
| Median Property Value | $2,000,001 | $2,000,001 |
| Median Household Income | $237,125 | $252 |
| Monthly Housing Costs | $1,501 | $319 |
| Real Estate Taxes | $10,001 | $0 |
Property Value by Mortgage Status in Hidden Hills
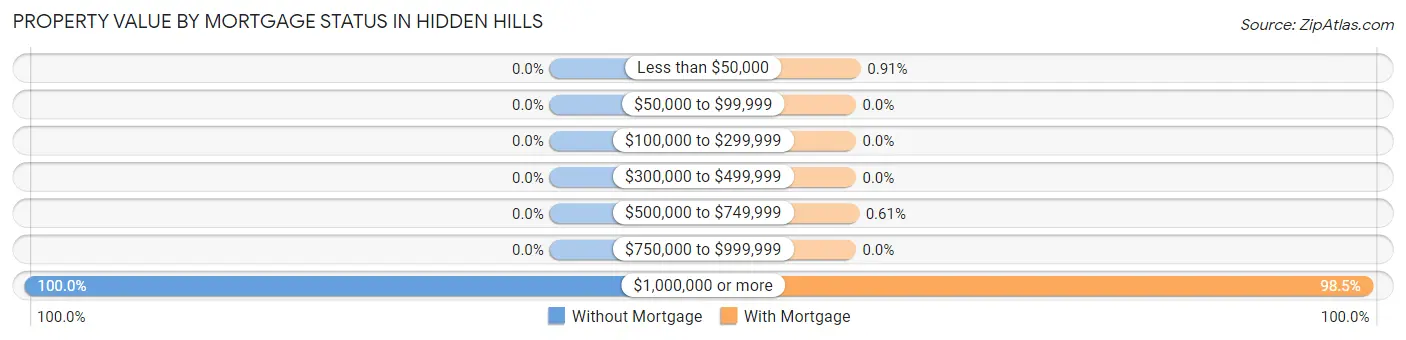
| Property Value | Without Mortgage | With Mortgage |
| Less than $50,000 | 0 (0.0%) | 3 (0.9%) |
| $50,000 to $99,999 | 0 (0.0%) | 0 (0.0%) |
| $100,000 to $299,999 | 0 (0.0%) | 0 (0.0%) |
| $300,000 to $499,999 | 0 (0.0%) | 0 (0.0%) |
| $500,000 to $749,999 | 0 (0.0%) | 2 (0.6%) |
| $750,000 to $999,999 | 0 (0.0%) | 0 (0.0%) |
| $1,000,000 or more | 259 (100.0%) | 323 (98.5%) |
| Total | 259 (100.0%) | 328 (100.0%) |
Household Income by Mortgage Status in Hidden Hills
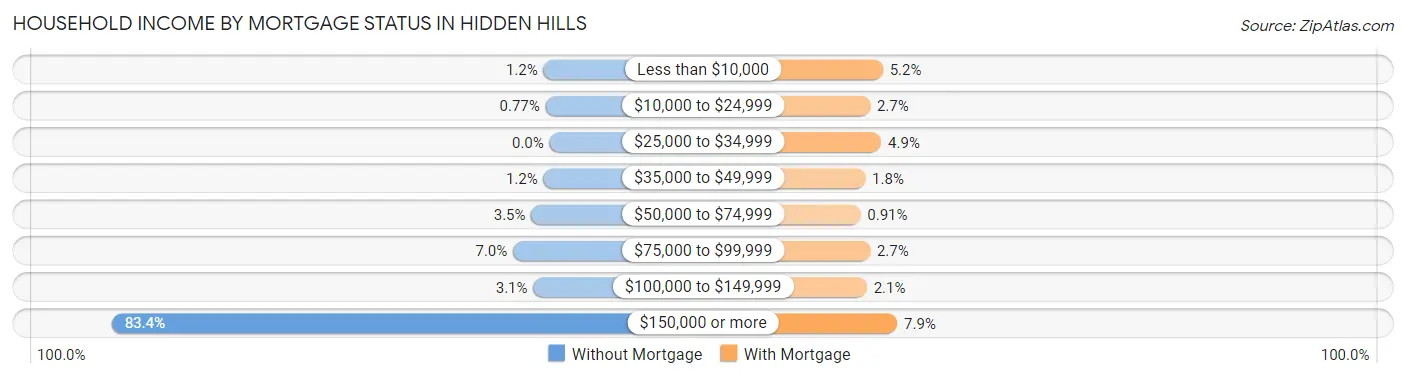
| Household Income | Without Mortgage | With Mortgage |
| Less than $10,000 | 3 (1.2%) | 17 (5.2%) |
| $10,000 to $24,999 | 2 (0.8%) | 9 (2.7%) |
| $25,000 to $34,999 | 0 (0.0%) | 16 (4.9%) |
| $35,000 to $49,999 | 3 (1.2%) | 6 (1.8%) |
| $50,000 to $74,999 | 9 (3.5%) | 3 (0.9%) |
| $75,000 to $99,999 | 18 (7.0%) | 9 (2.7%) |
| $100,000 to $149,999 | 8 (3.1%) | 7 (2.1%) |
| $150,000 or more | 216 (83.4%) | 26 (7.9%) |
| Total | 259 (100.0%) | 328 (100.0%) |
Property Value to Household Income Ratio in Hidden Hills
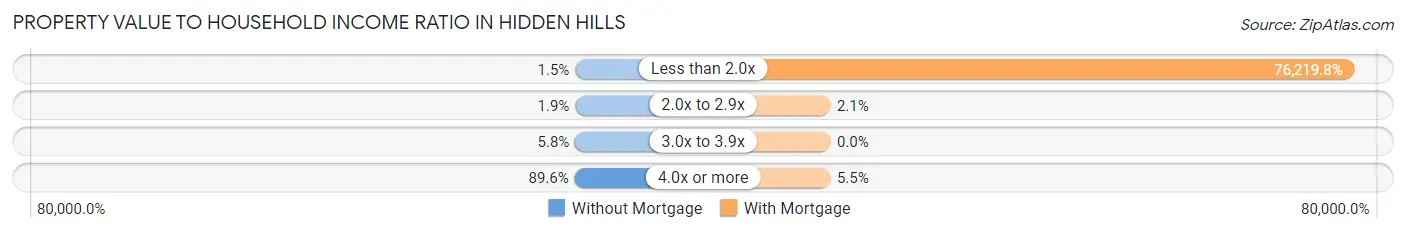
| Value-to-Income Ratio | Without Mortgage | With Mortgage |
| Less than 2.0x | 4 (1.5%) | 250,001 (76,219.8%) |
| 2.0x to 2.9x | 5 (1.9%) | 7 (2.1%) |
| 3.0x to 3.9x | 15 (5.8%) | 0 (0.0%) |
| 4.0x or more | 232 (89.6%) | 18 (5.5%) |
| Total | 259 (100.0%) | 328 (100.0%) |
Real Estate Taxes by Mortgage Status in Hidden Hills
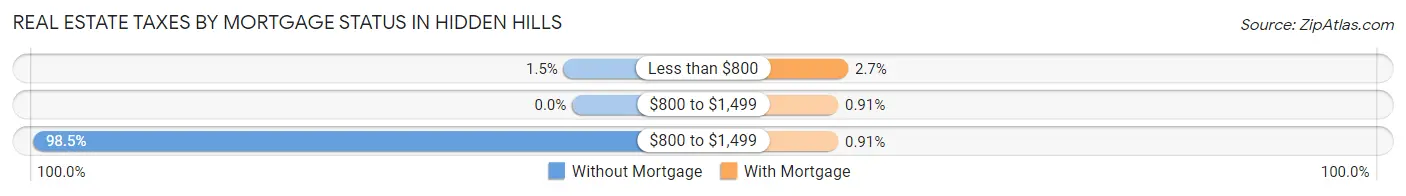
| Property Taxes | Without Mortgage | With Mortgage |
| Less than $800 | 4 (1.5%) | 9 (2.7%) |
| $800 to $1,499 | 0 (0.0%) | 3 (0.9%) |
| $800 to $1,499 | 255 (98.5%) | 3 (0.9%) |
| Total | 259 (100.0%) | 328 (100.0%) |
Health & Disability in Hidden Hills
Health Insurance Coverage by Age in Hidden Hills
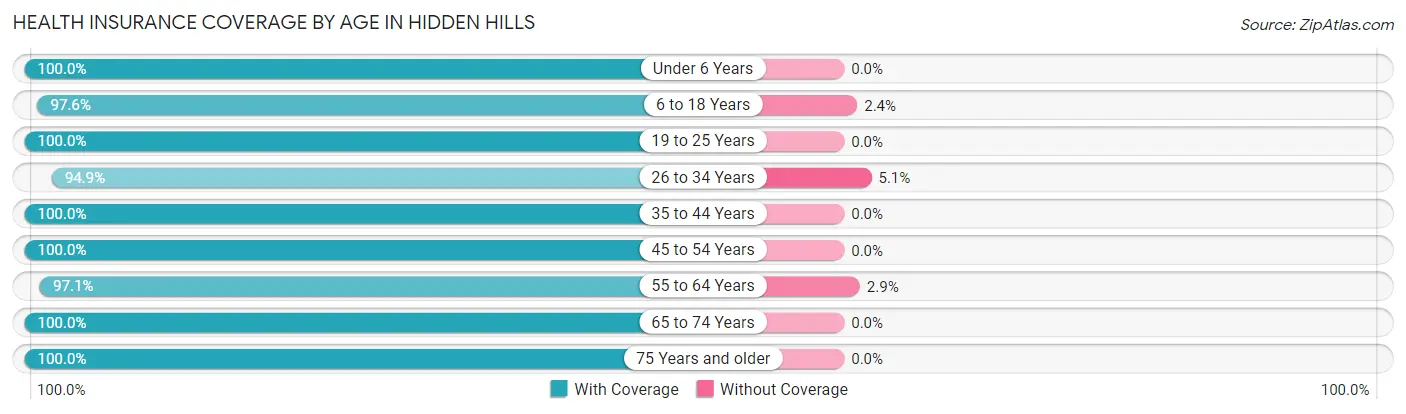
| Age Bracket | With Coverage | Without Coverage |
| Under 6 Years | 103 (100.0%) | 0 (0.0%) |
| 6 to 18 Years | 483 (97.6%) | 12 (2.4%) |
| 19 to 25 Years | 112 (100.0%) | 0 (0.0%) |
| 26 to 34 Years | 56 (94.9%) | 3 (5.1%) |
| 35 to 44 Years | 239 (100.0%) | 0 (0.0%) |
| 45 to 54 Years | 334 (100.0%) | 0 (0.0%) |
| 55 to 64 Years | 400 (97.1%) | 12 (2.9%) |
| 65 to 74 Years | 237 (100.0%) | 0 (0.0%) |
| 75 Years and older | 116 (100.0%) | 0 (0.0%) |
| Total | 2,080 (98.7%) | 27 (1.3%) |
Health Insurance Coverage by Citizenship Status in Hidden Hills
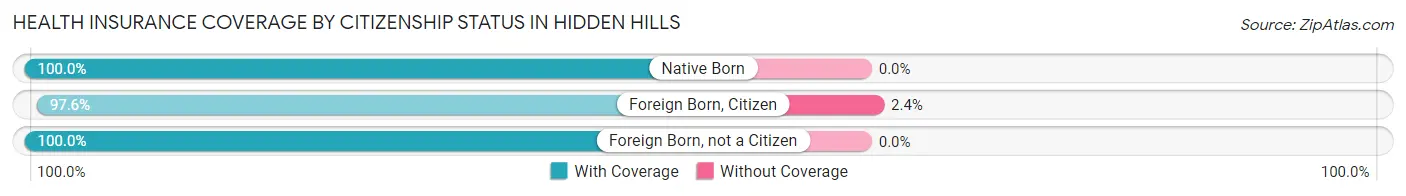
| Citizenship Status | With Coverage | Without Coverage |
| Native Born | 103 (100.0%) | 0 (0.0%) |
| Foreign Born, Citizen | 483 (97.6%) | 12 (2.4%) |
| Foreign Born, not a Citizen | 112 (100.0%) | 0 (0.0%) |
Health Insurance Coverage by Household Income in Hidden Hills
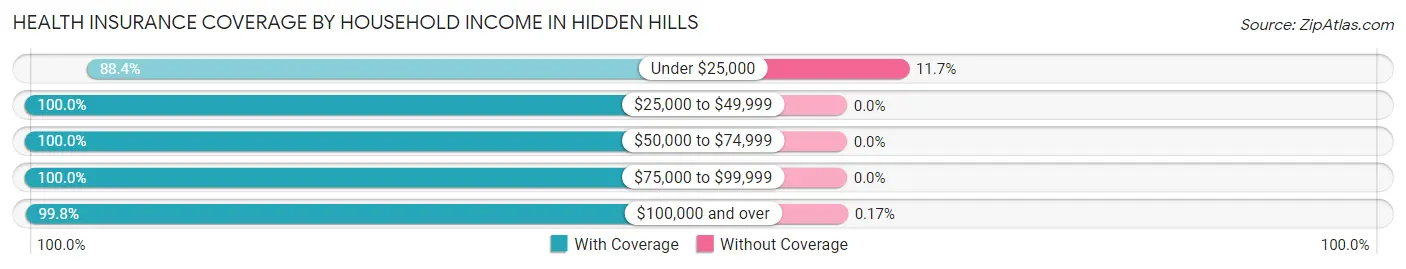
| Household Income | With Coverage | Without Coverage |
| Under $25,000 | 182 (88.3%) | 24 (11.7%) |
| $25,000 to $49,999 | 20 (100.0%) | 0 (0.0%) |
| $50,000 to $74,999 | 36 (100.0%) | 0 (0.0%) |
| $75,000 to $99,999 | 49 (100.0%) | 0 (0.0%) |
| $100,000 and over | 1,793 (99.8%) | 3 (0.2%) |
Public vs Private Health Insurance Coverage by Age in Hidden Hills
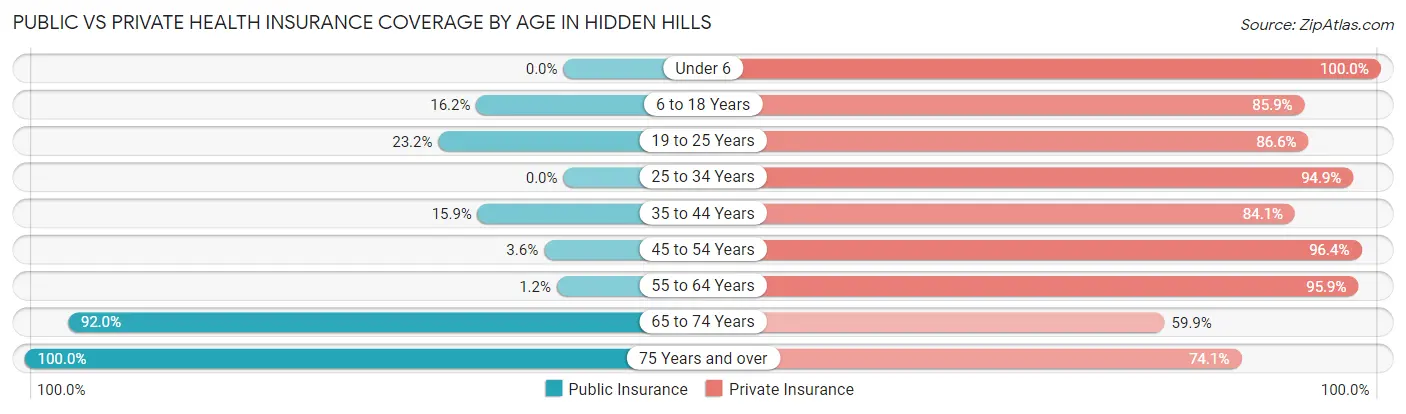
| Age Bracket | Public Insurance | Private Insurance |
| Under 6 | 0 (0.0%) | 103 (100.0%) |
| 6 to 18 Years | 80 (16.2%) | 425 (85.9%) |
| 19 to 25 Years | 26 (23.2%) | 97 (86.6%) |
| 25 to 34 Years | 0 (0.0%) | 56 (94.9%) |
| 35 to 44 Years | 38 (15.9%) | 201 (84.1%) |
| 45 to 54 Years | 12 (3.6%) | 322 (96.4%) |
| 55 to 64 Years | 5 (1.2%) | 395 (95.9%) |
| 65 to 74 Years | 218 (92.0%) | 142 (59.9%) |
| 75 Years and over | 116 (100.0%) | 86 (74.1%) |
| Total | 495 (23.5%) | 1,827 (86.7%) |
Disability Status by Sex by Age in Hidden Hills
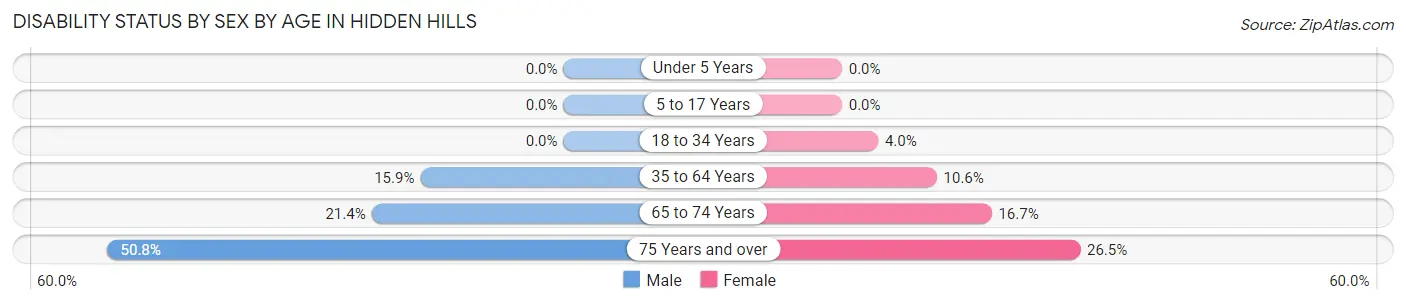
| Age Bracket | Male | Female |
| Under 5 Years | 0 (0.0%) | 0 (0.0%) |
| 5 to 17 Years | 0 (0.0%) | 0 (0.0%) |
| 18 to 34 Years | 0 (0.0%) | 5 (4.0%) |
| 35 to 64 Years | 77 (15.9%) | 53 (10.6%) |
| 65 to 74 Years | 25 (21.4%) | 20 (16.7%) |
| 75 Years and over | 34 (50.7%) | 13 (26.5%) |
Disability Class by Sex by Age in Hidden Hills
Disability Class: Hearing Difficulty
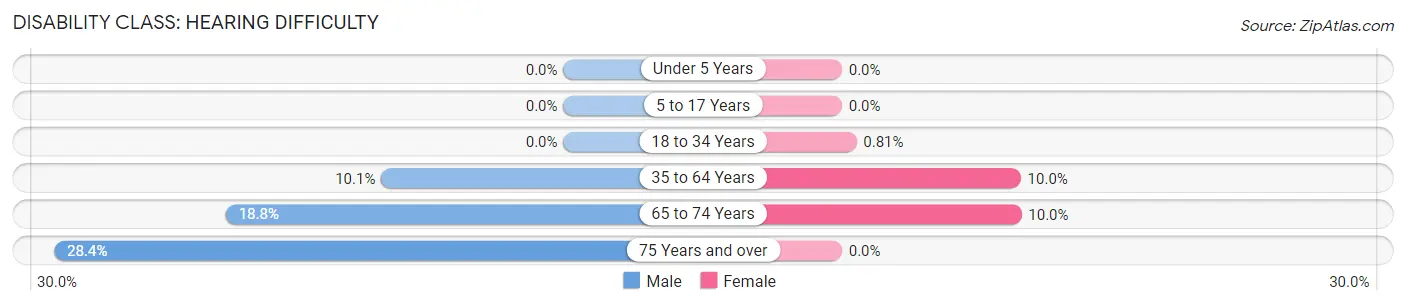
| Age Bracket | Male | Female |
| Under 5 Years | 0 (0.0%) | 0 (0.0%) |
| 5 to 17 Years | 0 (0.0%) | 0 (0.0%) |
| 18 to 34 Years | 0 (0.0%) | 1 (0.8%) |
| 35 to 64 Years | 49 (10.1%) | 50 (10.0%) |
| 65 to 74 Years | 22 (18.8%) | 12 (10.0%) |
| 75 Years and over | 19 (28.4%) | 0 (0.0%) |
Disability Class: Vision Difficulty
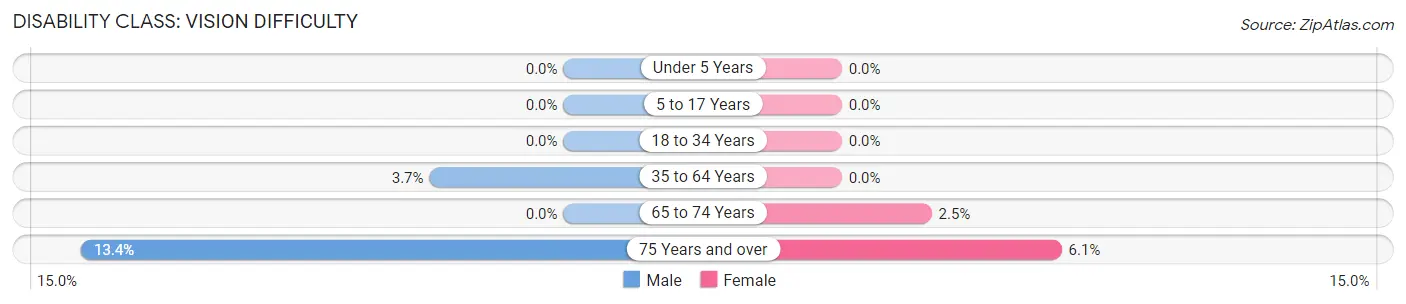
| Age Bracket | Male | Female |
| Under 5 Years | 0 (0.0%) | 0 (0.0%) |
| 5 to 17 Years | 0 (0.0%) | 0 (0.0%) |
| 18 to 34 Years | 0 (0.0%) | 0 (0.0%) |
| 35 to 64 Years | 18 (3.7%) | 0 (0.0%) |
| 65 to 74 Years | 0 (0.0%) | 3 (2.5%) |
| 75 Years and over | 9 (13.4%) | 3 (6.1%) |
Disability Class: Cognitive Difficulty
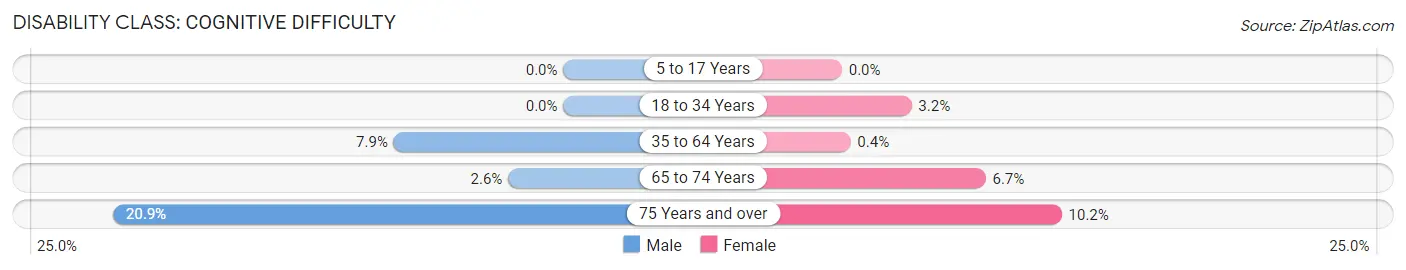
| Age Bracket | Male | Female |
| 5 to 17 Years | 0 (0.0%) | 0 (0.0%) |
| 18 to 34 Years | 0 (0.0%) | 4 (3.2%) |
| 35 to 64 Years | 38 (7.9%) | 2 (0.4%) |
| 65 to 74 Years | 3 (2.6%) | 8 (6.7%) |
| 75 Years and over | 14 (20.9%) | 5 (10.2%) |
Disability Class: Ambulatory Difficulty
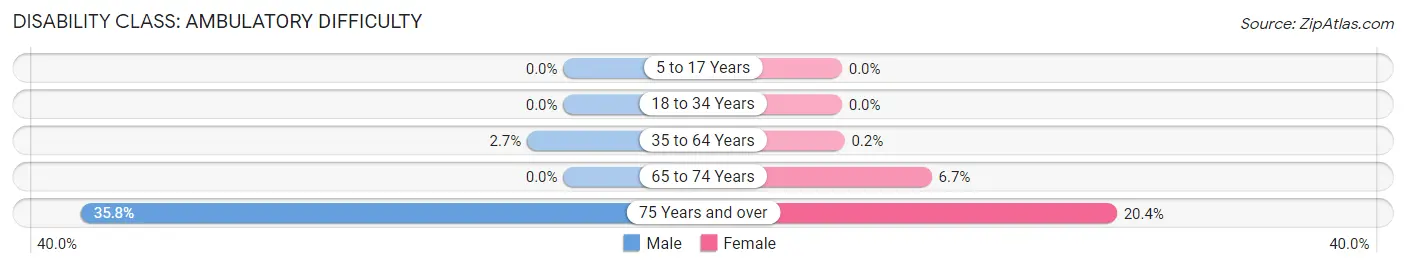
| Age Bracket | Male | Female |
| 5 to 17 Years | 0 (0.0%) | 0 (0.0%) |
| 18 to 34 Years | 0 (0.0%) | 0 (0.0%) |
| 35 to 64 Years | 13 (2.7%) | 1 (0.2%) |
| 65 to 74 Years | 0 (0.0%) | 8 (6.7%) |
| 75 Years and over | 24 (35.8%) | 10 (20.4%) |
Disability Class: Self-Care Difficulty
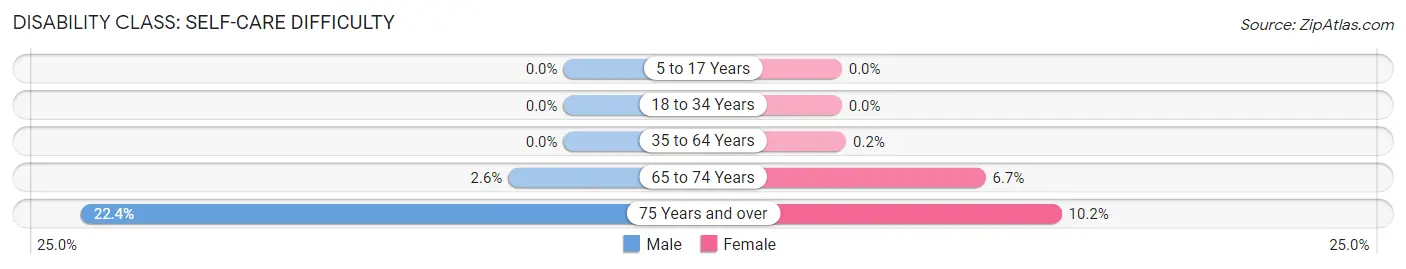
| Age Bracket | Male | Female |
| 5 to 17 Years | 0 (0.0%) | 0 (0.0%) |
| 18 to 34 Years | 0 (0.0%) | 0 (0.0%) |
| 35 to 64 Years | 0 (0.0%) | 1 (0.2%) |
| 65 to 74 Years | 3 (2.6%) | 8 (6.7%) |
| 75 Years and over | 15 (22.4%) | 5 (10.2%) |
Technology Access in Hidden Hills
Computing Device Access in Hidden Hills
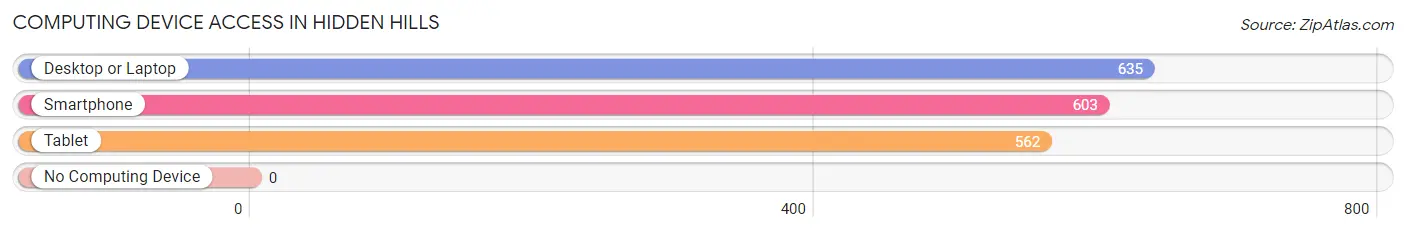
| Device Type | # Households | % Households |
| Desktop or Laptop | 635 | 98.3% |
| Smartphone | 603 | 93.3% |
| Tablet | 562 | 87.0% |
| No Computing Device | 0 | 0.0% |
| Total | 646 | 100.0% |
Internet Access in Hidden Hills
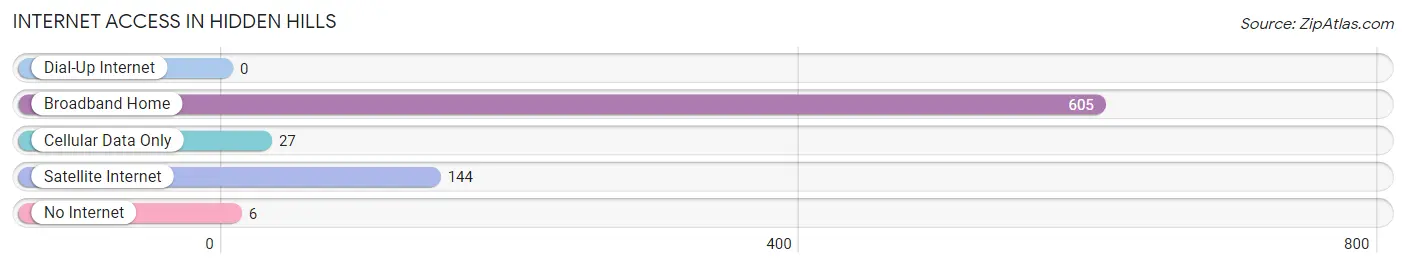
| Internet Type | # Households | % Households |
| Dial-Up Internet | 0 | 0.0% |
| Broadband Home | 605 | 93.6% |
| Cellular Data Only | 27 | 4.2% |
| Satellite Internet | 144 | 22.3% |
| No Internet | 6 | 0.9% |
| Total | 646 | 100.0% |
Hidden Hills Summary
Hidden Hills is a small, affluent city located in Los Angeles County, California. It is situated in the San Fernando Valley, just north of Calabasas and west of the Santa Monica Mountains. The city was incorporated in 1961 and is home to approximately 2,000 residents.
History
Hidden Hills was originally part of the Rancho Las Virgenes, a Spanish land grant given to Francisco Reyes in 1841. The area was later purchased by the wealthy Doheny family in the early 1900s. The Dohenys built a large estate on the property, which they named Hidden Hills Ranch. The ranch was used for cattle grazing and horseback riding.
In the 1950s, the Dohenys began to subdivide the ranch and sell off parcels of land. The city of Hidden Hills was officially incorporated in 1961. The city was designed to be a private, gated community with strict building codes and regulations.
Geography
Hidden Hills is located in the San Fernando Valley, just north of Calabasas and west of the Santa Monica Mountains. The city covers an area of 1.7 square miles and is bordered by the cities of Calabasas, West Hills, and Woodland Hills. The city is situated at an elevation of 830 feet above sea level.
The city is home to several parks and open spaces, including the Hidden Hills Park, the Hidden Hills Nature Preserve, and the Hidden Hills Arboretum. The city is also home to several equestrian trails and riding arenas.
Economy
Hidden Hills is a wealthy, affluent city with a median household income of $200,000. The city is home to several celebrities and business executives. The city’s economy is largely driven by the real estate industry, as well as the entertainment industry.
Demographics
As of the 2010 census, Hidden Hills had a population of 1,856. The racial makeup of the city was 87.2% White, 4.2% Asian, 3.3% African American, 0.3% Native American, 0.1% Pacific Islander, and 4.9% from other races. The median age of the city’s population was 44.7 years.
The city is home to a large number of wealthy residents. The median household income in Hidden Hills is $200,000, and the median home value is $1.7 million. The city is also home to a large number of celebrities and business executives.
Common Questions
What is Per Capita Income in Hidden Hills?
Per Capita income in Hidden Hills is $134,423.
What is the Median Family Income in Hidden Hills?
Median Family Income in Hidden Hills is $250,001.
What is the Median Household income in Hidden Hills?
Median Household Income in Hidden Hills is $250,001.
What is Income or Wage Gap in Hidden Hills?
Income or Wage Gap in Hidden Hills is 62.2%.
Women in Hidden Hills earn 37.8 cents for every dollar earned by a man.
What is Inequality or Gini Index in Hidden Hills?
Inequality or Gini Index in Hidden Hills is 0.46.
What is the Total Population of Hidden Hills?
Total Population of Hidden Hills is 2,107.
What is the Total Male Population of Hidden Hills?
Total Male Population of Hidden Hills is 932.
What is the Total Female Population of Hidden Hills?
Total Female Population of Hidden Hills is 1,175.
What is the Ratio of Males per 100 Females in Hidden Hills?
There are 79.32 Males per 100 Females in Hidden Hills.
What is the Ratio of Females per 100 Males in Hidden Hills?
There are 126.07 Females per 100 Males in Hidden Hills.
What is the Median Population Age in Hidden Hills?
Median Population Age in Hidden Hills is 46.5 Years.
What is the Average Family Size in Hidden Hills
Average Family Size in Hidden Hills is 3.4 People.
What is the Average Household Size in Hidden Hills
Average Household Size in Hidden Hills is 3.3 People.
How Large is the Labor Force in Hidden Hills?
There are 930 People in the Labor Forcein in Hidden Hills.
What is the Percentage of People in the Labor Force in Hidden Hills?
57.6% of People are in the Labor Force in Hidden Hills.
What is the Unemployment Rate in Hidden Hills?
Unemployment Rate in Hidden Hills is 4.7%.