Seeley, CA Map & Demographics
Seeley Map
Seeley Overview
$17,610
PER CAPITA INCOME
$52,941
AVG FAMILY INCOME
$55,035
AVG HOUSEHOLD INCOME
18.6%
WAGE / INCOME GAP [ % ]
81.4¢/ $1
WAGE / INCOME GAP [ $ ]
0.43
INEQUALITY / GINI INDEX
1,756
TOTAL POPULATION
841
MALE POPULATION
915
FEMALE POPULATION
91.91
MALES / 100 FEMALES
108.80
FEMALES / 100 MALES
29.5
MEDIAN AGE
4.7
AVG FAMILY SIZE
4.4
AVG HOUSEHOLD SIZE
731
LABOR FORCE [ PEOPLE ]
58.2%
PERCENT IN LABOR FORCE
23.9%
UNEMPLOYMENT RATE
Seeley Zip Codes
Seeley Area Codes
Income in Seeley
Income Overview in Seeley
Per Capita Income in Seeley is $17,610, while median incomes of families and households are $52,941 and $55,035 respectively.
| Characteristic | Number | Measure |
| Per Capita Income | 1,756 | $17,610 |
| Median Family Income | 360 | $52,941 |
| Mean Family Income | 360 | $69,221 |
| Median Household Income | 399 | $55,035 |
| Mean Household Income | 399 | $68,186 |
| Income Deficit | 360 | $0 |
| Wage / Income Gap (%) | 1,756 | 18.61% |
| Wage / Income Gap ($) | 1,756 | 81.39¢ per $1 |
| Gini / Inequality Index | 1,756 | 0.43 |
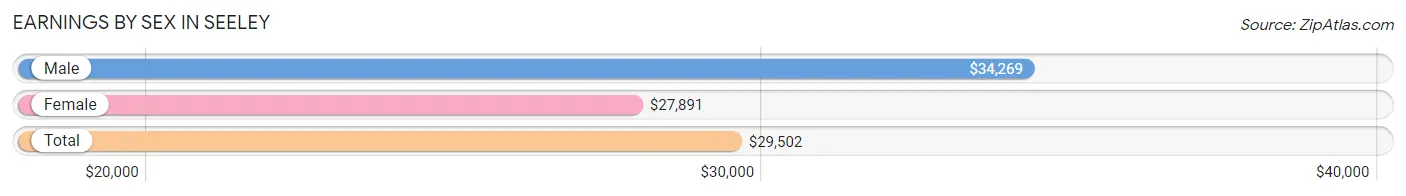
Earnings by Sex in Seeley
Average Earnings in Seeley are $29,502, $34,269 for men and $27,891 for women, a difference of 18.6%.
| Sex | Number | Average Earnings |
| Male | 340 (53.4%) | $34,269 |
| Female | 297 (46.6%) | $27,891 |
| Total | 637 (100.0%) | $29,502 |
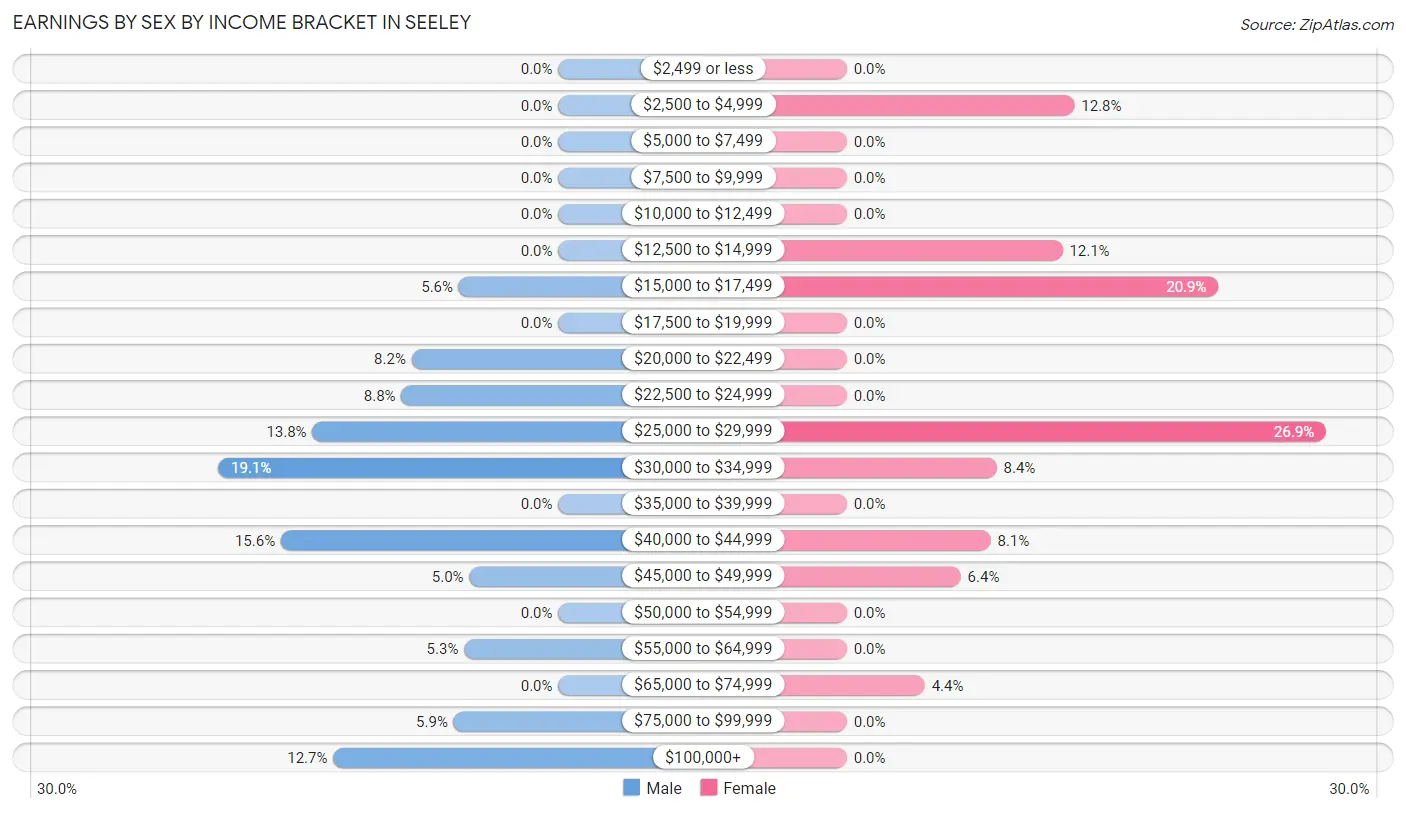
Earnings by Sex by Income Bracket in Seeley
The most common earnings brackets in Seeley are $30,000 to $34,999 for men (65 | 19.1%) and $25,000 to $29,999 for women (80 | 26.9%).
| Income | Male | Female |
| $2,499 or less | 0 (0.0%) | 0 (0.0%) |
| $2,500 to $4,999 | 0 (0.0%) | 38 (12.8%) |
| $5,000 to $7,499 | 0 (0.0%) | 0 (0.0%) |
| $7,500 to $9,999 | 0 (0.0%) | 0 (0.0%) |
| $10,000 to $12,499 | 0 (0.0%) | 0 (0.0%) |
| $12,500 to $14,999 | 0 (0.0%) | 36 (12.1%) |
| $15,000 to $17,499 | 19 (5.6%) | 62 (20.9%) |
| $17,500 to $19,999 | 0 (0.0%) | 0 (0.0%) |
| $20,000 to $22,499 | 28 (8.2%) | 0 (0.0%) |
| $22,500 to $24,999 | 30 (8.8%) | 0 (0.0%) |
| $25,000 to $29,999 | 47 (13.8%) | 80 (26.9%) |
| $30,000 to $34,999 | 65 (19.1%) | 25 (8.4%) |
| $35,000 to $39,999 | 0 (0.0%) | 0 (0.0%) |
| $40,000 to $44,999 | 53 (15.6%) | 24 (8.1%) |
| $45,000 to $49,999 | 17 (5.0%) | 19 (6.4%) |
| $50,000 to $54,999 | 0 (0.0%) | 0 (0.0%) |
| $55,000 to $64,999 | 18 (5.3%) | 0 (0.0%) |
| $65,000 to $74,999 | 0 (0.0%) | 13 (4.4%) |
| $75,000 to $99,999 | 20 (5.9%) | 0 (0.0%) |
| $100,000+ | 43 (12.7%) | 0 (0.0%) |
| Total | 340 (100.0%) | 297 (100.0%) |
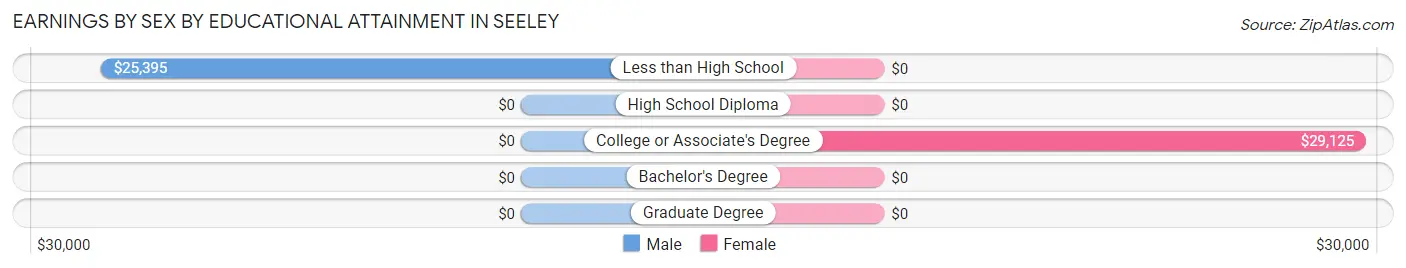
Earnings by Sex by Educational Attainment in Seeley
Average earnings in Seeley are $34,269 for men and $28,703 for women, a difference of 16.2%. Men with an educational attainment of less than high school enjoy the highest average annual earnings of $25,395, while those with less than high school education earn the least with $25,395. Women with an educational attainment of college or associate's degree earn the most with the average annual earnings of $29,125, while those with college or associate's degree education have the smallest earnings of $29,125.
| Educational Attainment | Male Income | Female Income |
| Less than High School | $25,395 | $0 |
| High School Diploma | - | - |
| College or Associate's Degree | - | - |
| Bachelor's Degree | - | - |
| Graduate Degree | - | - |
| Total | $34,269 | $28,703 |
Family Income in Seeley
Family Income Brackets in Seeley
According to the Seeley family income data, there are 72 families falling into the $25,000 to $34,999 income range, which is the most common income bracket and makes up 20.0% of all families.
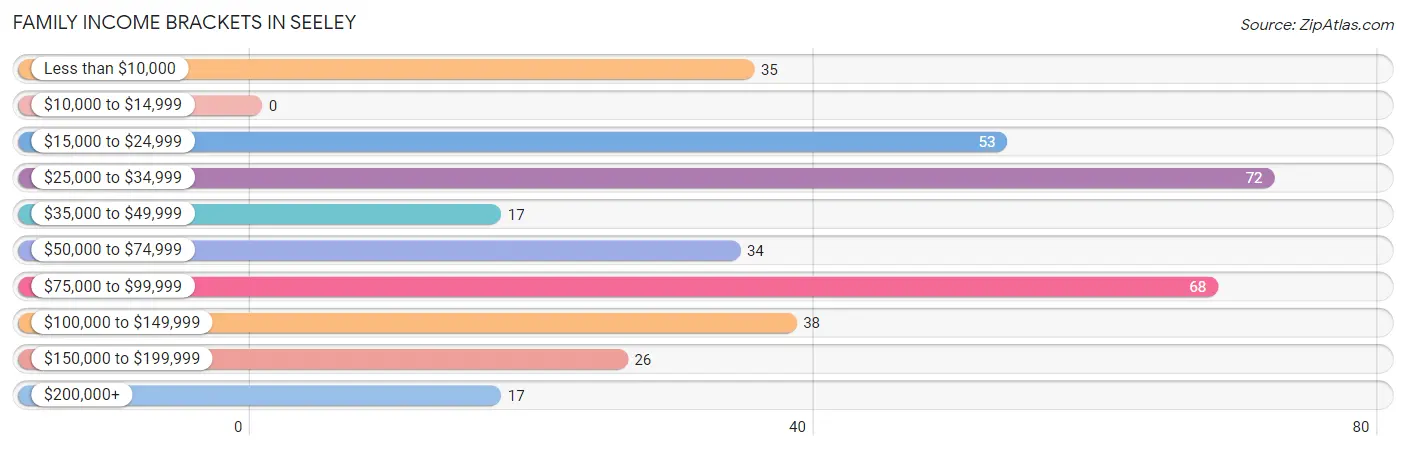
| Income Bracket | # Families | % Families |
| Less than $10,000 | 35 | 9.7% |
| $10,000 to $14,999 | 0 | 0.0% |
| $15,000 to $24,999 | 53 | 14.7% |
| $25,000 to $34,999 | 72 | 20.0% |
| $35,000 to $49,999 | 17 | 4.7% |
| $50,000 to $74,999 | 34 | 9.4% |
| $75,000 to $99,999 | 68 | 18.9% |
| $100,000 to $149,999 | 38 | 10.6% |
| $150,000 to $199,999 | 26 | 7.2% |
| $200,000+ | 17 | 4.7% |
Family Income by Famaliy Size in Seeley
4-person families (118 | 32.8%) account for the highest median family income in Seeley with $76,316 per family, while 4-person families (118 | 32.8%) have the highest median income of $19,079 per family member.
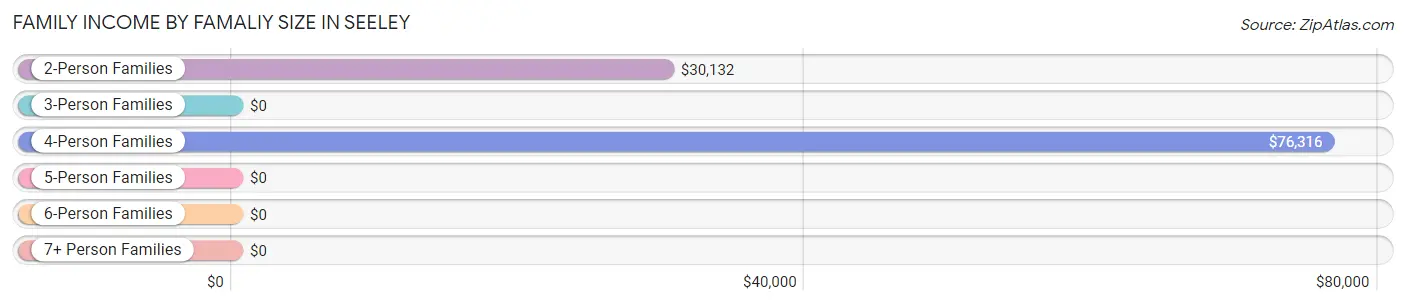
| Income Bracket | # Families | Median Income |
| 2-Person Families | 72 (20.0%) | $30,132 |
| 3-Person Families | 89 (24.7%) | $0 |
| 4-Person Families | 118 (32.8%) | $76,316 |
| 5-Person Families | 45 (12.5%) | $0 |
| 6-Person Families | 36 (10.0%) | $0 |
| 7+ Person Families | 0 (0.0%) | $0 |
| Total | 360 (100.0%) | $52,941 |
Family Income by Number of Earners in Seeley
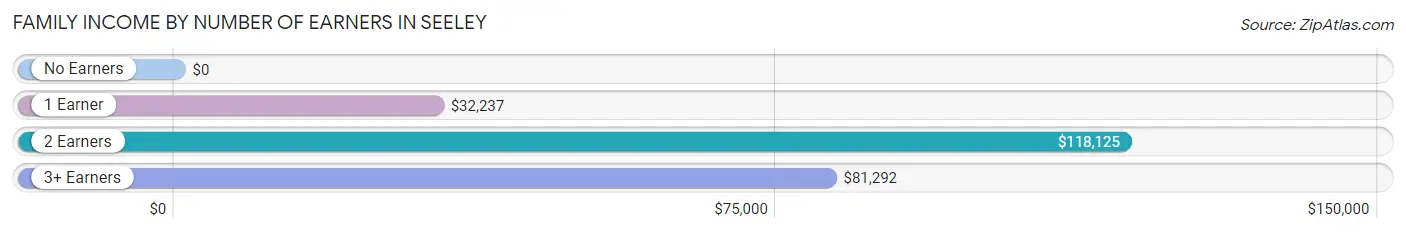
| Number of Earners | # Families | Median Income |
| No Earners | 69 (19.2%) | $0 |
| 1 Earner | 144 (40.0%) | $32,237 |
| 2 Earners | 82 (22.8%) | $118,125 |
| 3+ Earners | 65 (18.1%) | $81,292 |
| Total | 360 (100.0%) | $52,941 |
Household Income in Seeley
Household Income Brackets in Seeley
With 91 households falling in the category, the $25,000 to $34,999 income range is the most frequent in Seeley, accounting for 22.8% of all households.
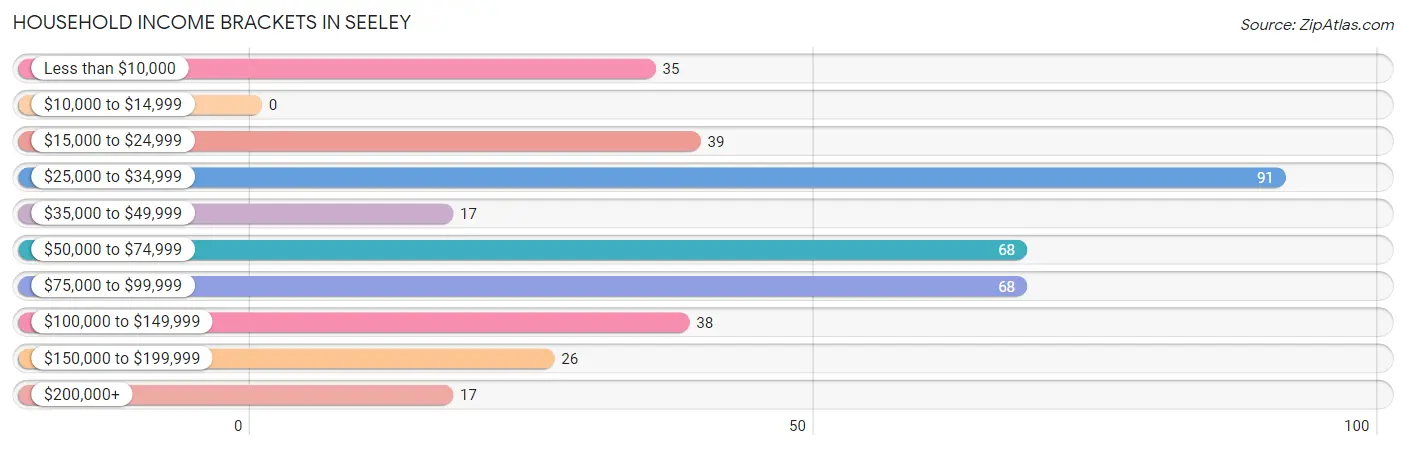
| Income Bracket | # Households | % Households |
| Less than $10,000 | 35 | 8.8% |
| $10,000 to $14,999 | 0 | 0.0% |
| $15,000 to $24,999 | 39 | 9.8% |
| $25,000 to $34,999 | 91 | 22.8% |
| $35,000 to $49,999 | 17 | 4.3% |
| $50,000 to $74,999 | 68 | 17.0% |
| $75,000 to $99,999 | 68 | 17.0% |
| $100,000 to $149,999 | 38 | 9.5% |
| $150,000 to $199,999 | 26 | 6.5% |
| $200,000+ | 17 | 4.3% |
Household Income by Householder Age in Seeley
The median household income in Seeley is $55,035, with the highest median household income of $77,303 found in the 45 to 64 years age bracket for the primary householder. A total of 173 households (43.4%) fall into this category.
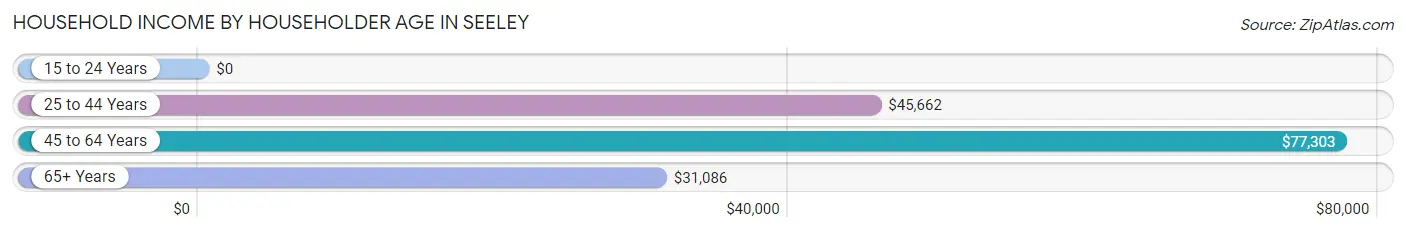
| Income Bracket | # Households | Median Income |
| 15 to 24 Years | 0 (0.0%) | $0 |
| 25 to 44 Years | 153 (38.4%) | $45,662 |
| 45 to 64 Years | 173 (43.4%) | $77,303 |
| 65+ Years | 73 (18.3%) | $31,086 |
| Total | 399 (100.0%) | $55,035 |
Poverty in Seeley
Income Below Poverty by Sex and Age in Seeley
With 28.4% poverty level for males and 16.5% for females among the residents of Seeley, under 5 year old males and 6 to 11 year old females are the most vulnerable to poverty, with 87 males (62.6%) and 54 females (70.1%) in their respective age groups living below the poverty level.
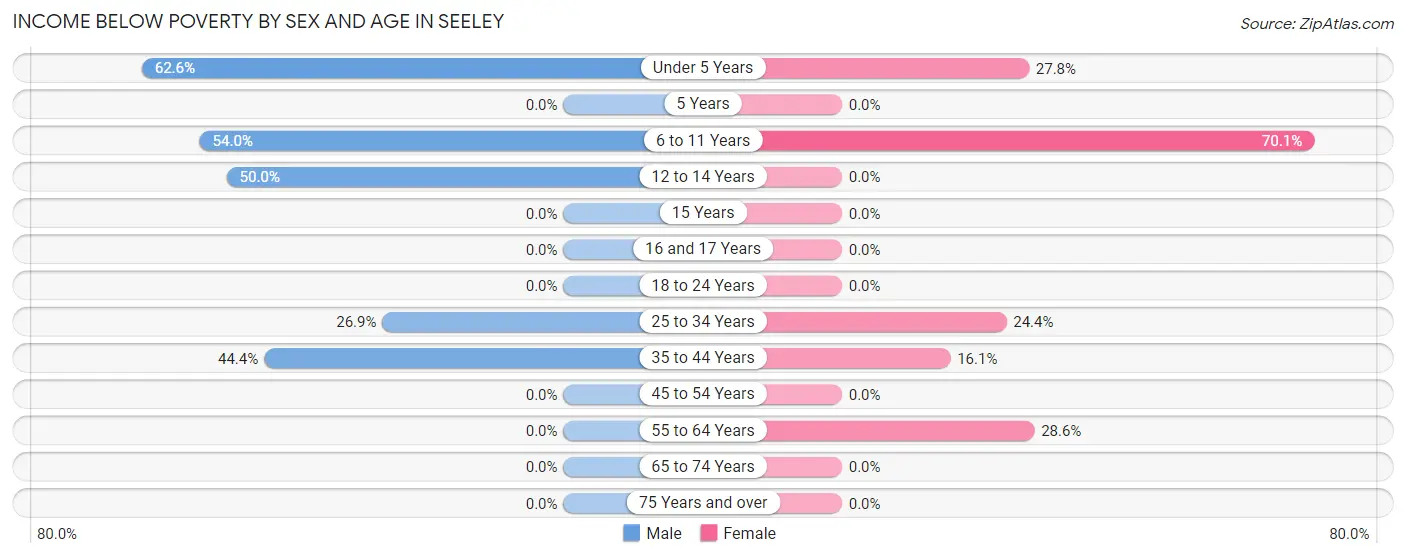
| Age Bracket | Male | Female |
| Under 5 Years | 87 (62.6%) | 30 (27.8%) |
| 5 Years | 0 (0.0%) | 0 (0.0%) |
| 6 to 11 Years | 27 (54.0%) | 54 (70.1%) |
| 12 to 14 Years | 25 (50.0%) | 0 (0.0%) |
| 15 Years | 0 (0.0%) | 0 (0.0%) |
| 16 and 17 Years | 0 (0.0%) | 0 (0.0%) |
| 18 to 24 Years | 0 (0.0%) | 0 (0.0%) |
| 25 to 34 Years | 64 (26.9%) | 32 (24.4%) |
| 35 to 44 Years | 36 (44.4%) | 19 (16.1%) |
| 45 to 54 Years | 0 (0.0%) | 0 (0.0%) |
| 55 to 64 Years | 0 (0.0%) | 16 (28.6%) |
| 65 to 74 Years | 0 (0.0%) | 0 (0.0%) |
| 75 Years and over | 0 (0.0%) | 0 (0.0%) |
| Total | 239 (28.4%) | 151 (16.5%) |
Income Above Poverty by Sex and Age in Seeley
According to the poverty statistics in Seeley, males aged 45 to 54 years and females aged 12 to 14 years are the age groups that are most secure financially, with 100.0% of males and 100.0% of females in these age groups living above the poverty line.
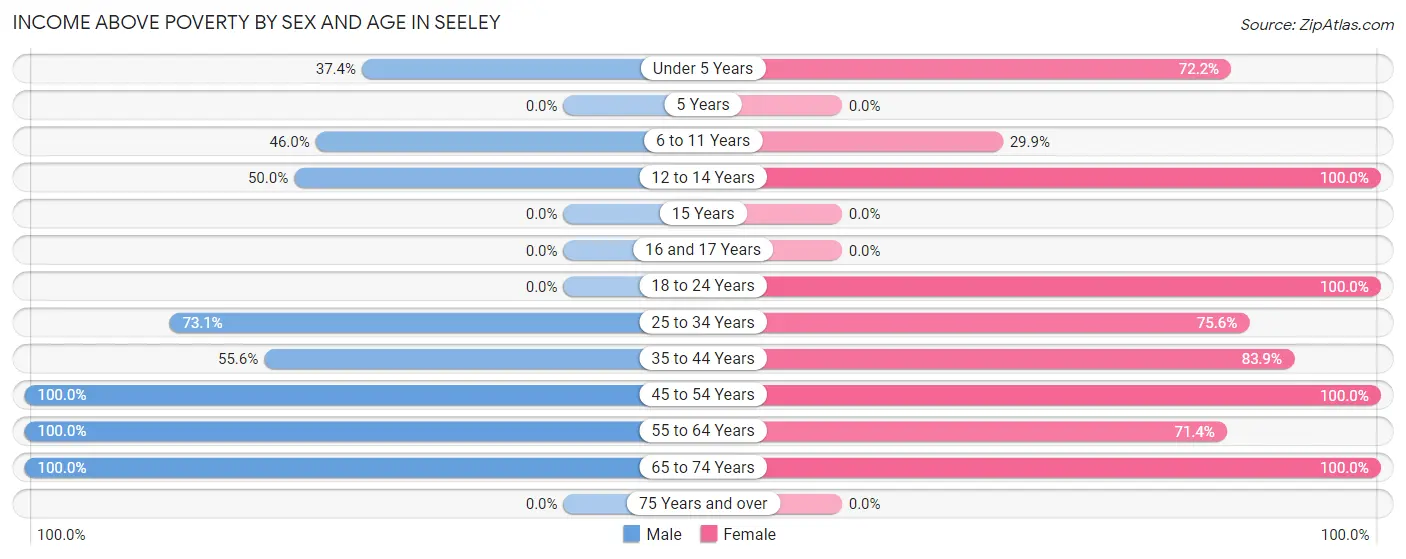
| Age Bracket | Male | Female |
| Under 5 Years | 52 (37.4%) | 78 (72.2%) |
| 5 Years | 0 (0.0%) | 0 (0.0%) |
| 6 to 11 Years | 23 (46.0%) | 23 (29.9%) |
| 12 to 14 Years | 25 (50.0%) | 76 (100.0%) |
| 15 Years | 0 (0.0%) | 0 (0.0%) |
| 16 and 17 Years | 0 (0.0%) | 0 (0.0%) |
| 18 to 24 Years | 0 (0.0%) | 213 (100.0%) |
| 25 to 34 Years | 174 (73.1%) | 99 (75.6%) |
| 35 to 44 Years | 45 (55.6%) | 99 (83.9%) |
| 45 to 54 Years | 150 (100.0%) | 73 (100.0%) |
| 55 to 64 Years | 84 (100.0%) | 40 (71.4%) |
| 65 to 74 Years | 49 (100.0%) | 63 (100.0%) |
| 75 Years and over | 0 (0.0%) | 0 (0.0%) |
| Total | 602 (71.6%) | 764 (83.5%) |
Income Below Poverty Among Married-Couple Families in Seeley
The poverty statistics for married-couple families in Seeley show that 10.6% or 19 of the total 180 families live below the poverty line. Families with 3 or 4 children have the highest poverty rate of 50.0%, comprising of 19 families. On the other hand, families with no children have the lowest poverty rate of 0.0%, which includes 0 families.
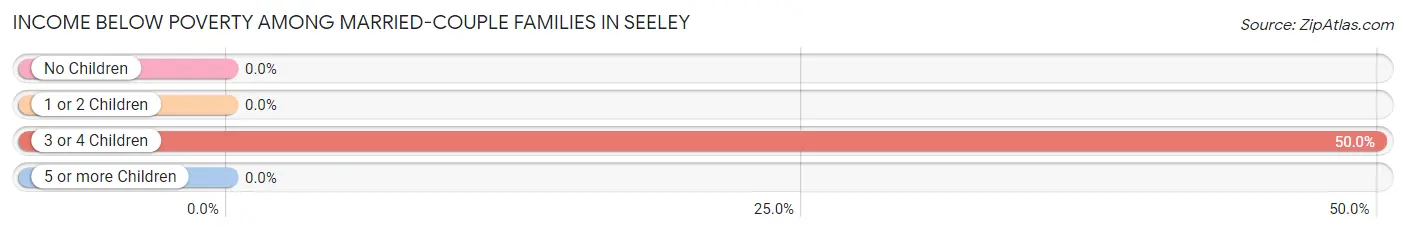
| Children | Above Poverty | Below Poverty |
| No Children | 37 (100.0%) | 0 (0.0%) |
| 1 or 2 Children | 105 (100.0%) | 0 (0.0%) |
| 3 or 4 Children | 19 (50.0%) | 19 (50.0%) |
| 5 or more Children | 0 (0.0%) | 0 (0.0%) |
| Total | 161 (89.4%) | 19 (10.6%) |
Income Below Poverty Among Single-Parent Households in Seeley
According to the poverty data in Seeley, 25.3% or 19 single-father households and 33.3% or 35 single-mother households are living below the poverty line. Among single-father households, those with 1 or 2 children have the highest poverty rate, with 19 households (100.0%) experiencing poverty. Likewise, among single-mother households, those with 1 or 2 children have the highest poverty rate, with 19 households (100.0%) falling below the poverty line.
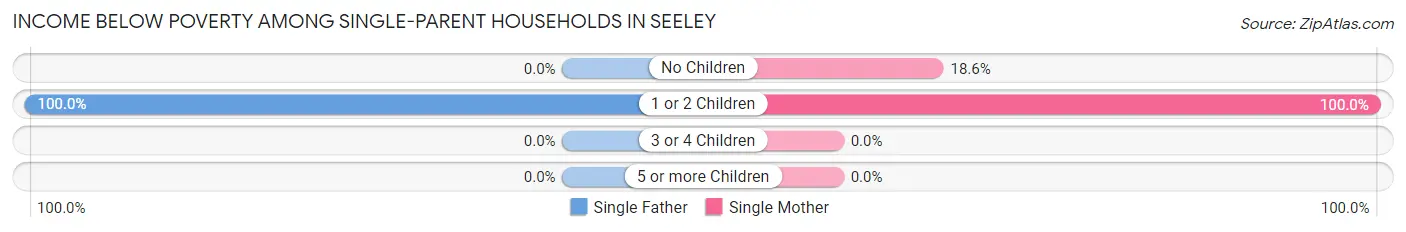
| Children | Single Father | Single Mother |
| No Children | 0 (0.0%) | 16 (18.6%) |
| 1 or 2 Children | 19 (100.0%) | 19 (100.0%) |
| 3 or 4 Children | 0 (0.0%) | 0 (0.0%) |
| 5 or more Children | 0 (0.0%) | 0 (0.0%) |
| Total | 19 (25.3%) | 35 (33.3%) |
Income Below Poverty Among Married-Couple vs Single-Parent Households in Seeley
The poverty data for Seeley shows that 19 of the married-couple family households (10.6%) and 54 of the single-parent households (30.0%) are living below the poverty level. Within the married-couple family households, those with 3 or 4 children have the highest poverty rate, with 19 households (50.0%) falling below the poverty line. Among the single-parent households, those with 1 or 2 children have the highest poverty rate, with 38 household (100.0%) living below poverty.
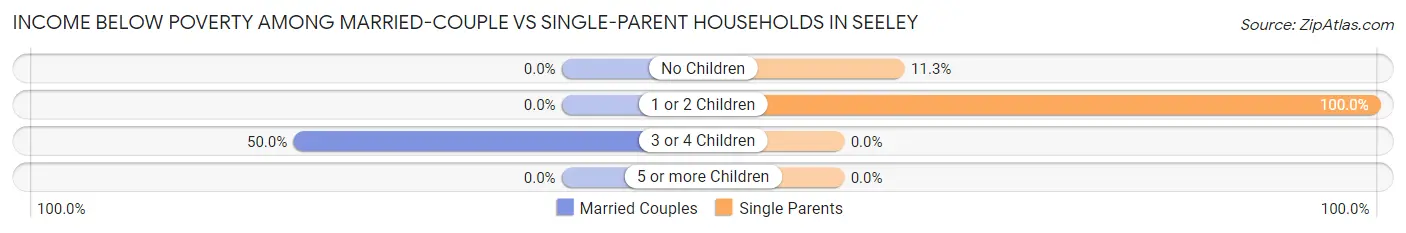
| Children | Married-Couple Families | Single-Parent Households |
| No Children | 0 (0.0%) | 16 (11.3%) |
| 1 or 2 Children | 0 (0.0%) | 38 (100.0%) |
| 3 or 4 Children | 19 (50.0%) | 0 (0.0%) |
| 5 or more Children | 0 (0.0%) | 0 (0.0%) |
| Total | 19 (10.6%) | 54 (30.0%) |
Race in Seeley
The most populous races in Seeley are Hispanic or Latino (1,617 | 92.1%), White / Caucasian (835 | 47.5%), and Some other Race (495 | 28.2%).
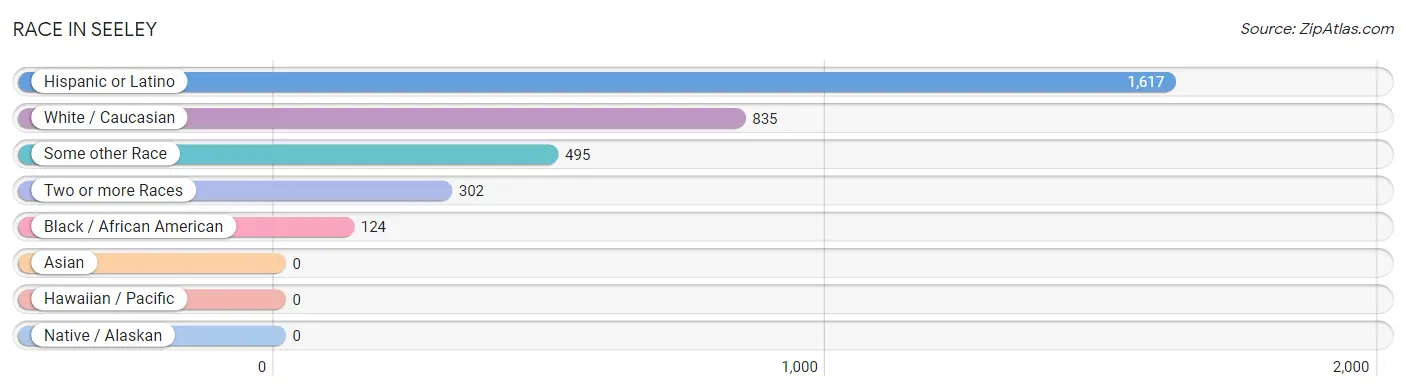
| Race | # Population | % Population |
| Asian | 0 | 0.0% |
| Black / African American | 124 | 7.1% |
| Hawaiian / Pacific | 0 | 0.0% |
| Hispanic or Latino | 1,617 | 92.1% |
| Native / Alaskan | 0 | 0.0% |
| White / Caucasian | 835 | 47.5% |
| Two or more Races | 302 | 17.2% |
| Some other Race | 495 | 28.2% |
| Total | 1,756 | 100.0% |
Ancestry in Seeley
The most populous ancestries reported in Seeley are Mexican (1,492 | 85.0%), American (125 | 7.1%), African (66 | 3.8%), and Subsaharan African (66 | 3.8%), together accounting for 99.6% of all Seeley residents.
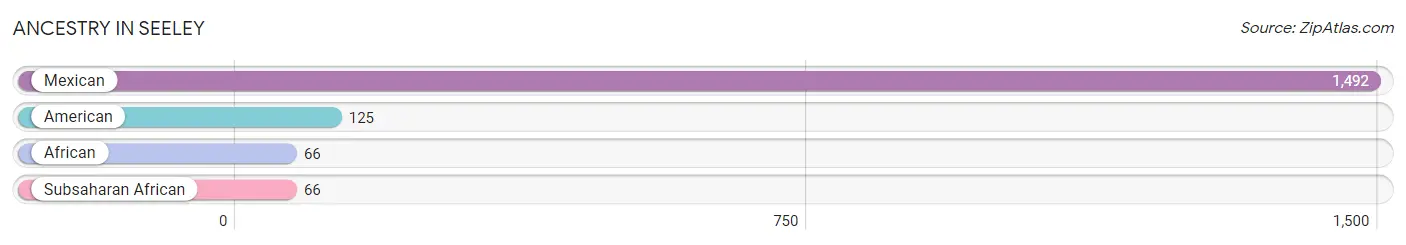
| Ancestry | # Population | % Population |
| African | 66 | 3.8% |
| American | 125 | 7.1% |
| Mexican | 1,492 | 85.0% |
| Subsaharan African | 66 | 3.8% | View All 4 Rows |
Immigrants in Seeley
The most numerous immigrant groups reported in Seeley came from Central America (466 | 26.5%), Latin America (466 | 26.5%), and Mexico (466 | 26.5%), together accounting for 79.6% of all Seeley residents.
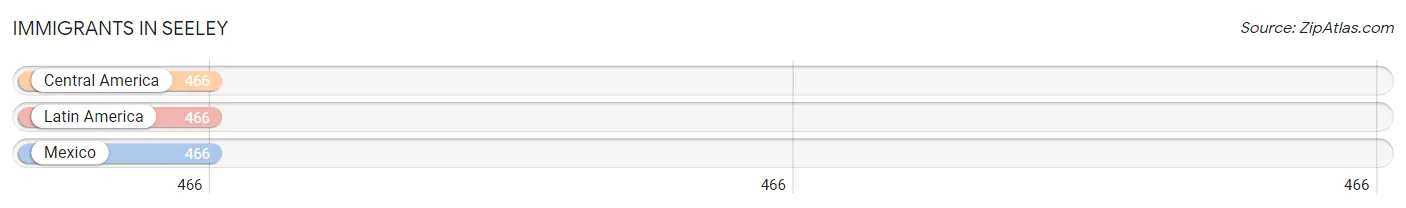
| Immigration Origin | # Population | % Population |
| Central America | 466 | 26.5% |
| Latin America | 466 | 26.5% |
| Mexico | 466 | 26.5% | View All 3 Rows |
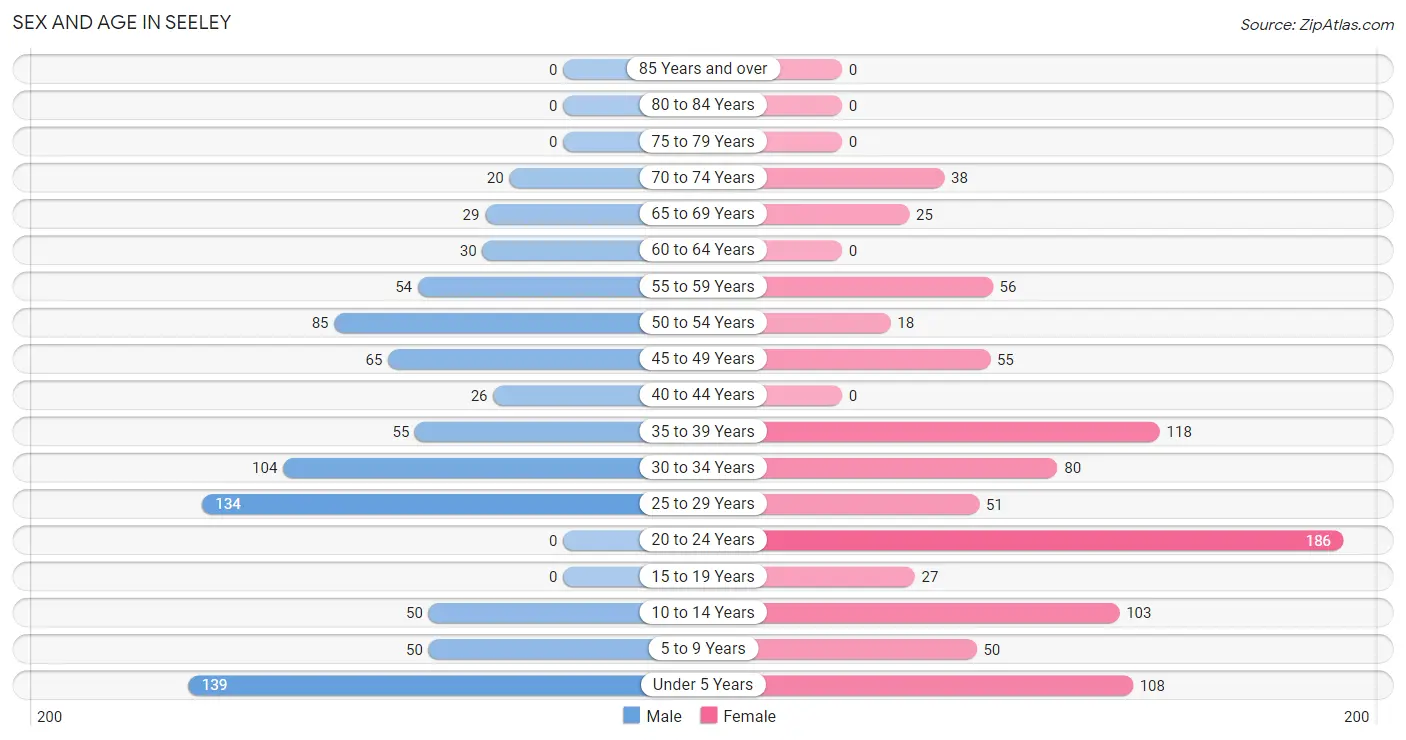
Sex and Age in Seeley
Sex and Age in Seeley
The most populous age groups in Seeley are Under 5 Years (139 | 16.5%) for men and 20 to 24 Years (186 | 20.3%) for women.
| Age Bracket | Male | Female |
| Under 5 Years | 139 (16.5%) | 108 (11.8%) |
| 5 to 9 Years | 50 (5.9%) | 50 (5.5%) |
| 10 to 14 Years | 50 (5.9%) | 103 (11.3%) |
| 15 to 19 Years | 0 (0.0%) | 27 (2.9%) |
| 20 to 24 Years | 0 (0.0%) | 186 (20.3%) |
| 25 to 29 Years | 134 (15.9%) | 51 (5.6%) |
| 30 to 34 Years | 104 (12.4%) | 80 (8.7%) |
| 35 to 39 Years | 55 (6.5%) | 118 (12.9%) |
| 40 to 44 Years | 26 (3.1%) | 0 (0.0%) |
| 45 to 49 Years | 65 (7.7%) | 55 (6.0%) |
| 50 to 54 Years | 85 (10.1%) | 18 (2.0%) |
| 55 to 59 Years | 54 (6.4%) | 56 (6.1%) |
| 60 to 64 Years | 30 (3.6%) | 0 (0.0%) |
| 65 to 69 Years | 29 (3.5%) | 25 (2.7%) |
| 70 to 74 Years | 20 (2.4%) | 38 (4.2%) |
| 75 to 79 Years | 0 (0.0%) | 0 (0.0%) |
| 80 to 84 Years | 0 (0.0%) | 0 (0.0%) |
| 85 Years and over | 0 (0.0%) | 0 (0.0%) |
| Total | 841 (100.0%) | 915 (100.0%) |
Families and Households in Seeley
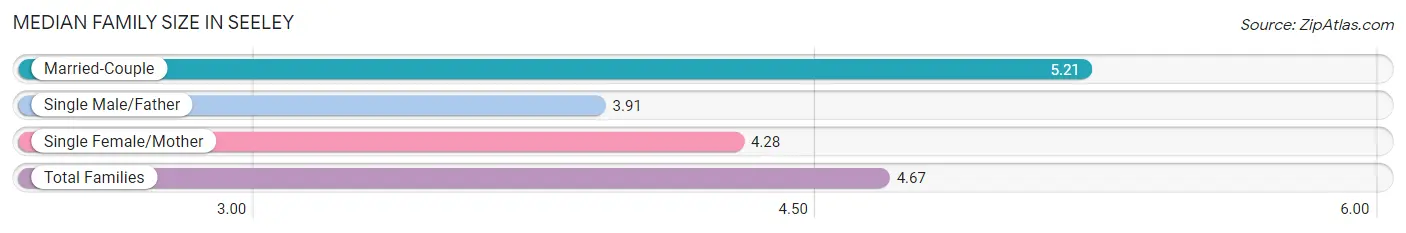
Median Family Size in Seeley
The median family size in Seeley is 4.67 persons per family, with married-couple families (180 | 50.0%) accounting for the largest median family size of 5.21 persons per family. On the other hand, single male/father families (75 | 20.8%) represent the smallest median family size with 3.91 persons per family.
| Family Type | # Families | Family Size |
| Married-Couple | 180 (50.0%) | 5.21 |
| Single Male/Father | 75 (20.8%) | 3.91 |
| Single Female/Mother | 105 (29.2%) | 4.28 |
| Total Families | 360 (100.0%) | 4.67 |
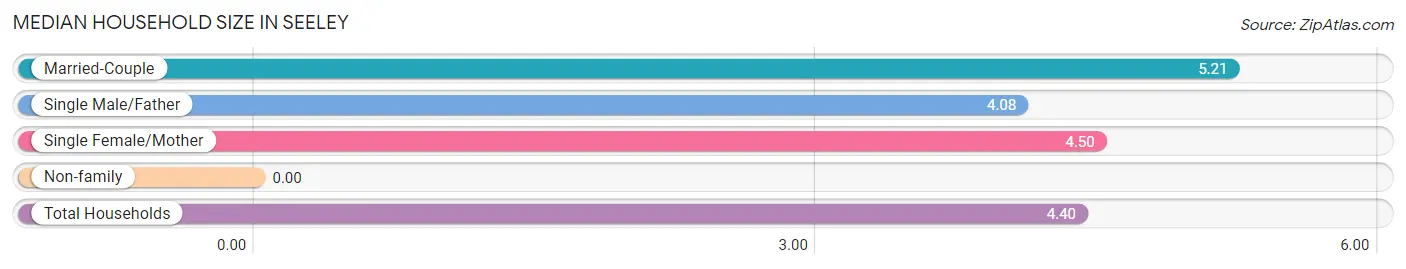
Median Household Size in Seeley
| Household Type | # Households | Household Size |
| Married-Couple | 180 (45.1%) | 5.21 |
| Single Male/Father | 75 (18.8%) | 4.08 |
| Single Female/Mother | 105 (26.3%) | 4.50 |
| Non-family | 39 (9.8%) | - |
| Total Households | 399 (100.0%) | 4.40 |
Household Size by Marriage Status in Seeley
Out of a total of 399 households in Seeley, 360 (90.2%) are family households, while 39 (9.8%) are nonfamily households. The most numerous type of family households are 4-person households, comprising 137, and the most common type of nonfamily households are 1-person households, comprising 39.
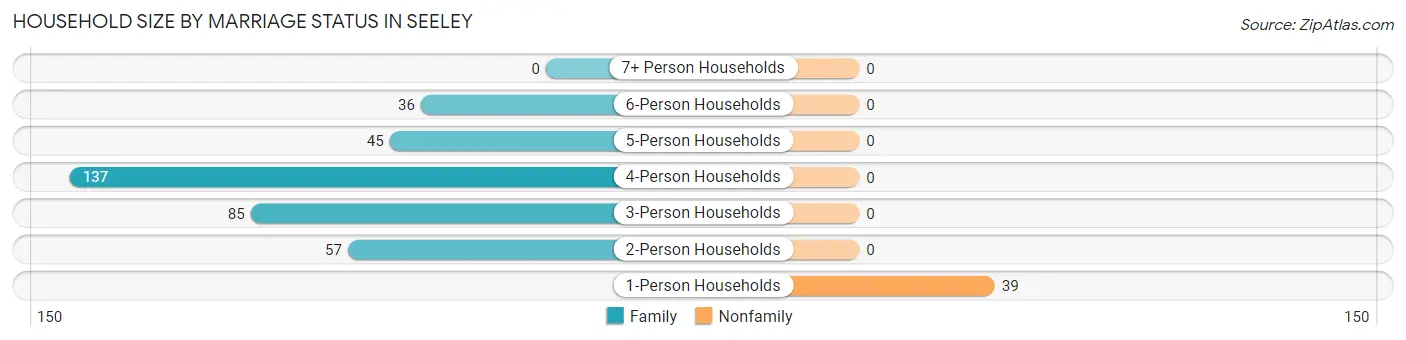
| Household Size | Family Households | Nonfamily Households |
| 1-Person Households | - | 39 (9.8%) |
| 2-Person Households | 57 (14.3%) | 0 (0.0%) |
| 3-Person Households | 85 (21.3%) | 0 (0.0%) |
| 4-Person Households | 137 (34.3%) | 0 (0.0%) |
| 5-Person Households | 45 (11.3%) | 0 (0.0%) |
| 6-Person Households | 36 (9.0%) | 0 (0.0%) |
| 7+ Person Households | 0 (0.0%) | 0 (0.0%) |
| Total | 360 (90.2%) | 39 (9.8%) |
Female Fertility in Seeley
Fertility by Age in Seeley
Average fertility rate in Seeley is 37.0 births per 1,000 women. Women in the age bracket of 20 to 34 years have the highest fertility rate with 60.0 births per 1,000 women. Women in the age bracket of 20 to 34 years acount for 100.0% of all women with births.
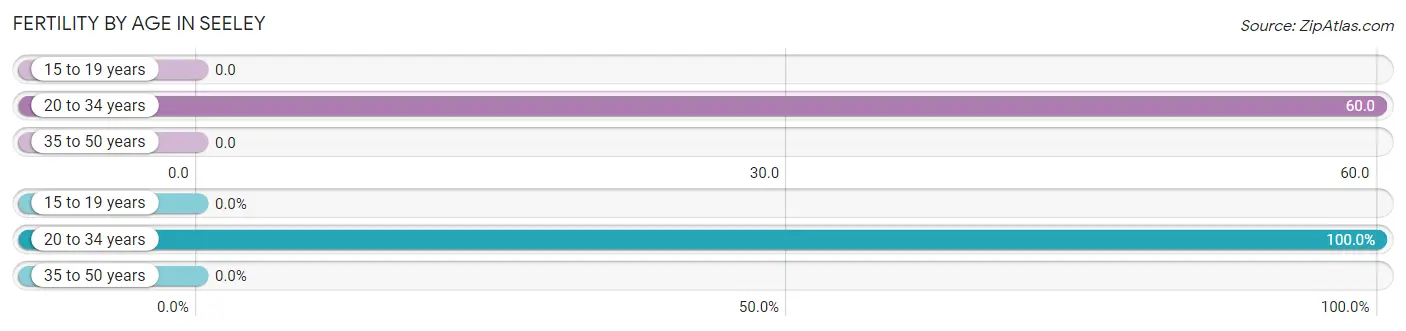
| Age Bracket | Women with Births | Births / 1,000 Women |
| 15 to 19 years | 0 (0.0%) | 0.0 |
| 20 to 34 years | 19 (100.0%) | 60.0 |
| 35 to 50 years | 0 (0.0%) | 0.0 |
| Total | 19 (100.0%) | 37.0 |
Fertility by Age by Marriage Status in Seeley
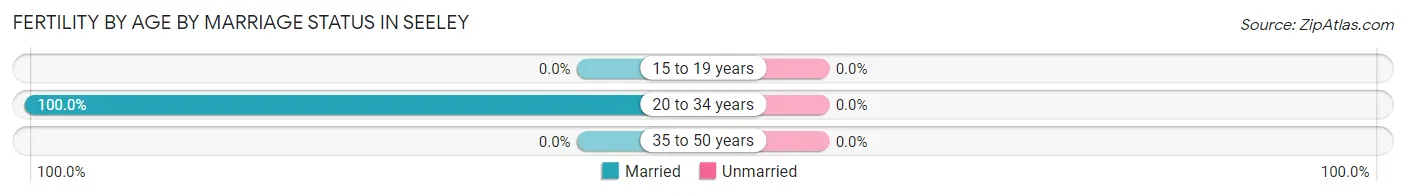
| Age Bracket | Married | Unmarried |
| 15 to 19 years | 0 (0.0%) | 0 (0.0%) |
| 20 to 34 years | 19 (100.0%) | 0 (0.0%) |
| 35 to 50 years | 0 (0.0%) | 0 (0.0%) |
| Total | 19 (100.0%) | 0 (0.0%) |
Fertility by Education in Seeley
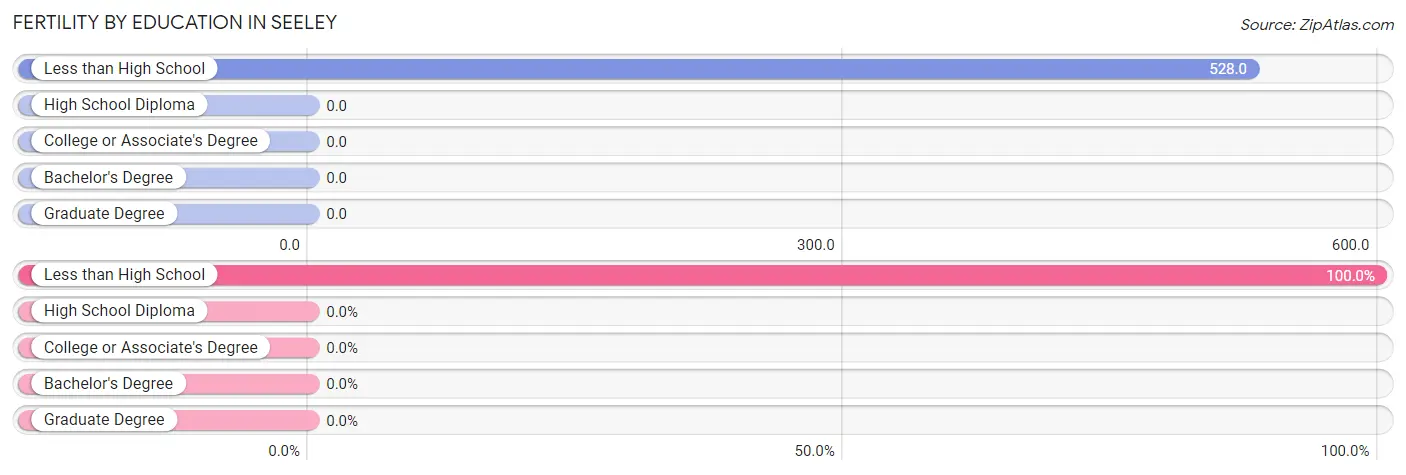
| Educational Attainment | Women with Births | Births / 1,000 Women |
| Less than High School | 19 (100.0%) | 528.0 |
| High School Diploma | 0 (0.0%) | 0.0 |
| College or Associate's Degree | 0 (0.0%) | 0.0 |
| Bachelor's Degree | 0 (0.0%) | 0.0 |
| Graduate Degree | 0 (0.0%) | 0.0 |
| Total | 19 (100.0%) | 37.0 |
Fertility by Education by Marriage Status in Seeley
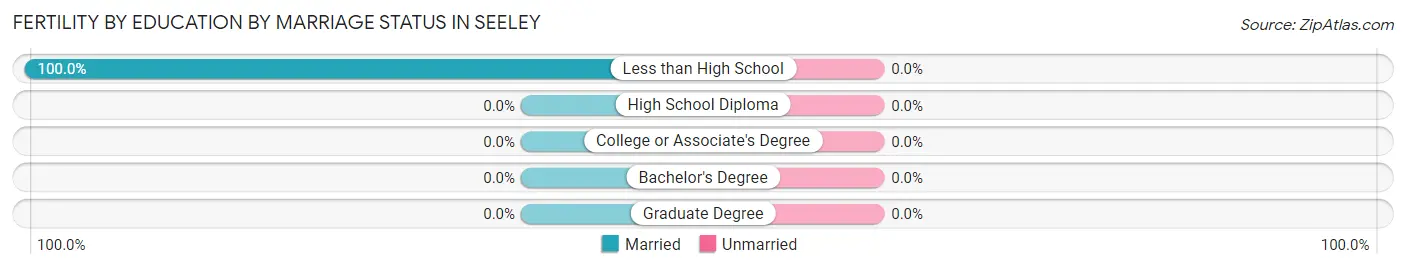
| Educational Attainment | Married | Unmarried |
| Less than High School | 19 (100.0%) | 0 (0.0%) |
| High School Diploma | 0 (0.0%) | 0 (0.0%) |
| College or Associate's Degree | 0 (0.0%) | 0 (0.0%) |
| Bachelor's Degree | 0 (0.0%) | 0 (0.0%) |
| Graduate Degree | 0 (0.0%) | 0 (0.0%) |
| Total | 19 (100.0%) | 0 (0.0%) |
Employment Characteristics in Seeley
Employment by Class of Employer in Seeley
Among the 556 employed individuals in Seeley, private company employees (363 | 65.3%), local government employees (91 | 16.4%), and not-for-profit organizations (70 | 12.6%) make up the most common classes of employment.
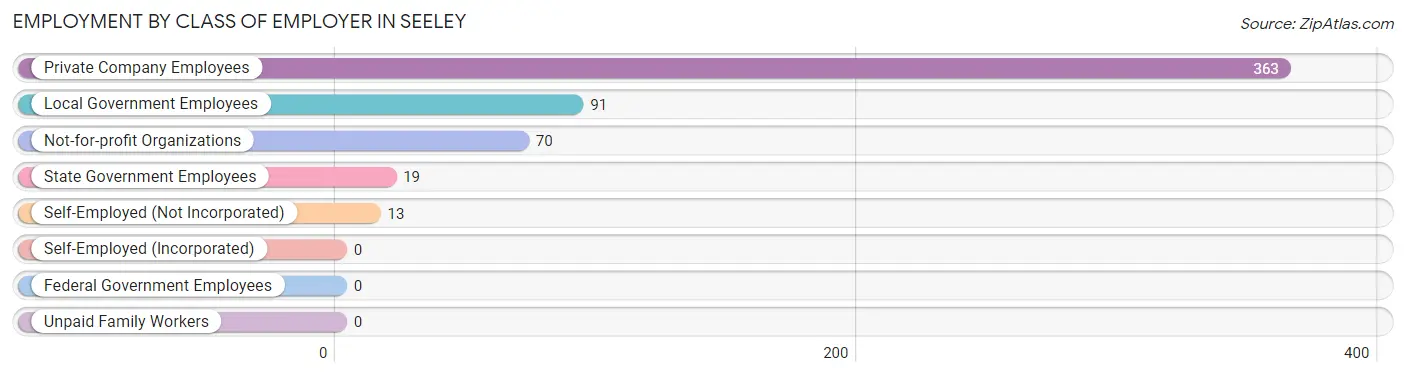
| Employer Class | # Employees | % Employees |
| Private Company Employees | 363 | 65.3% |
| Self-Employed (Incorporated) | 0 | 0.0% |
| Self-Employed (Not Incorporated) | 13 | 2.3% |
| Not-for-profit Organizations | 70 | 12.6% |
| Local Government Employees | 91 | 16.4% |
| State Government Employees | 19 | 3.4% |
| Federal Government Employees | 0 | 0.0% |
| Unpaid Family Workers | 0 | 0.0% |
| Total | 556 | 100.0% |
Employment Status by Age in Seeley
According to the labor force statistics for Seeley, out of the total population over 16 years of age (1,256), 58.2% or 731 individuals are in the labor force, with 23.9% or 175 of them unemployed. The age group with the highest labor force participation rate is 60 to 64 years, with 100.0% or 30 individuals in the labor force. Within the labor force, the 60 to 64 years age range has the highest percentage of unemployed individuals, with 100.0% or 30 of them being unemployed.
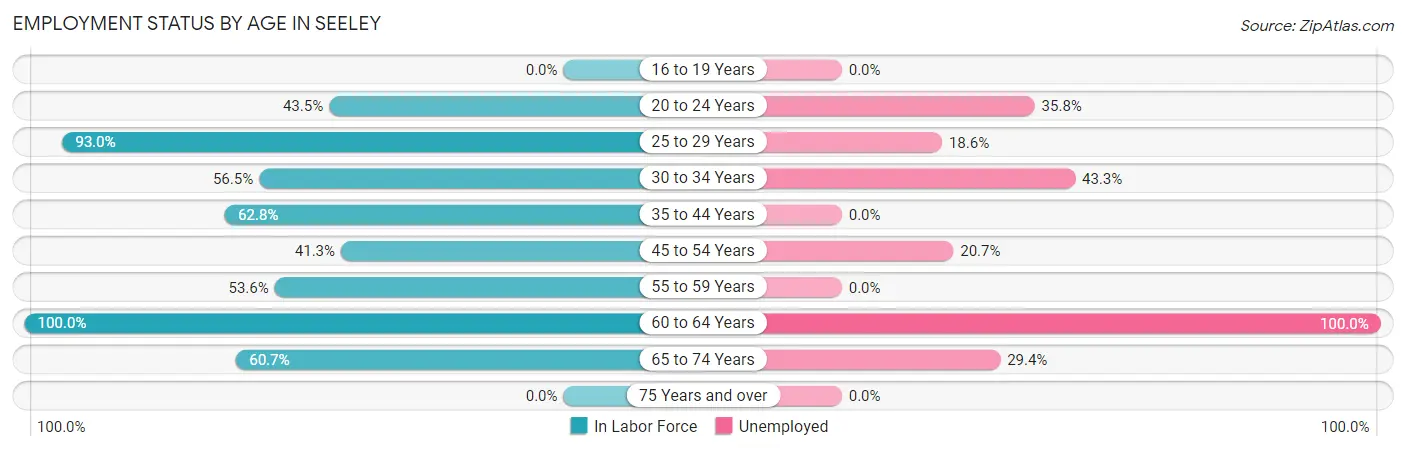
| Age Bracket | In Labor Force | Unemployed |
| 16 to 19 Years | 0 (0.0%) | 0 (0.0%) |
| 20 to 24 Years | 81 (43.5%) | 29 (35.8%) |
| 25 to 29 Years | 172 (93.0%) | 32 (18.6%) |
| 30 to 34 Years | 104 (56.5%) | 45 (43.3%) |
| 35 to 44 Years | 125 (62.8%) | 0 (0.0%) |
| 45 to 54 Years | 92 (41.3%) | 19 (20.7%) |
| 55 to 59 Years | 59 (53.6%) | 0 (0.0%) |
| 60 to 64 Years | 30 (100.0%) | 30 (100.0%) |
| 65 to 74 Years | 68 (60.7%) | 20 (29.4%) |
| 75 Years and over | 0 (0.0%) | 0 (0.0%) |
| Total | 731 (58.2%) | 175 (23.9%) |
Employment Status by Educational Attainment in Seeley
According to labor force statistics for Seeley, 62.5% of individuals (582) out of the total population between 25 and 64 years of age (931) are in the labor force, with 21.6% or 126 of them being unemployed. The group with the highest labor force participation rate are those with the educational attainment of college / associate degree, with 72.1% or 377 individuals in the labor force. Within the labor force, individuals with less than high school education have the highest percentage of unemployment, with 74.2% or 49 of them being unemployed.
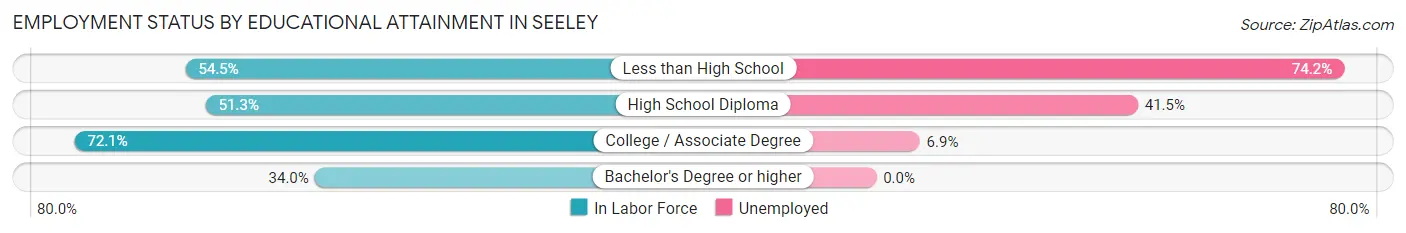
| Educational Attainment | In Labor Force | Unemployed |
| Less than High School | 66 (54.5%) | 90 (74.2%) |
| High School Diploma | 123 (51.3%) | 100 (41.5%) |
| College / Associate Degree | 377 (72.1%) | 36 (6.9%) |
| Bachelor's Degree or higher | 16 (34.0%) | 0 (0.0%) |
| Total | 582 (62.5%) | 201 (21.6%) |
Employment Occupations by Sex in Seeley
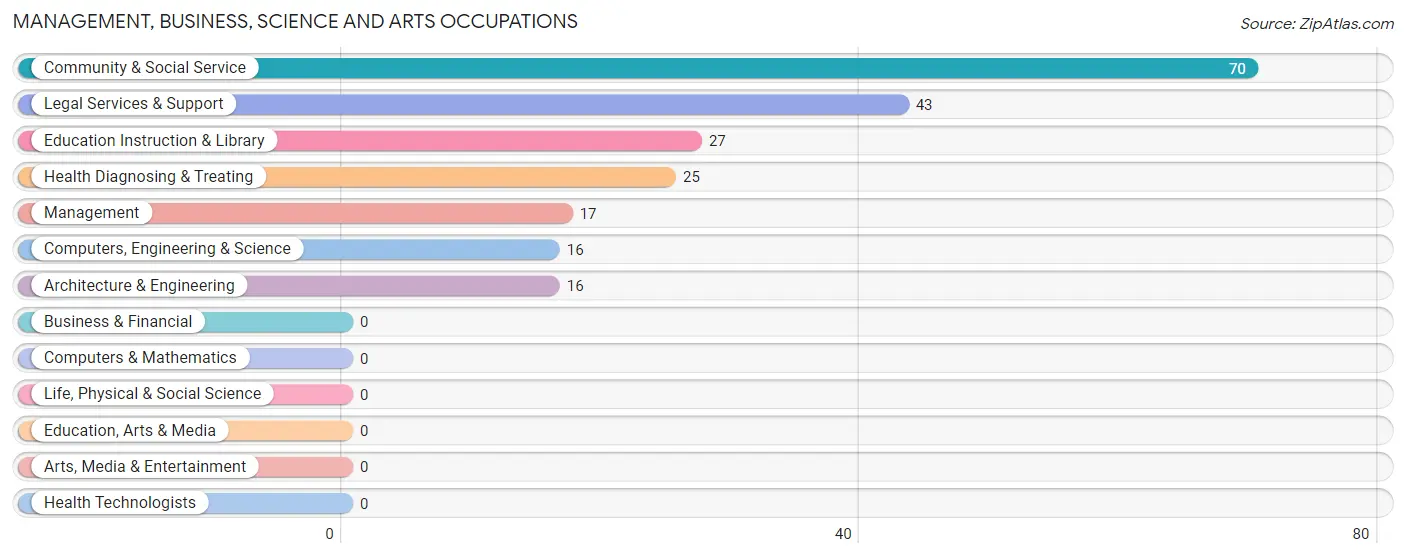
Management, Business, Science and Arts Occupations
The most common Management, Business, Science and Arts occupations in Seeley are Community & Social Service (70 | 12.6%), Legal Services & Support (43 | 7.7%), Education Instruction & Library (27 | 4.9%), Health Diagnosing & Treating (25 | 4.5%), and Management (17 | 3.1%).
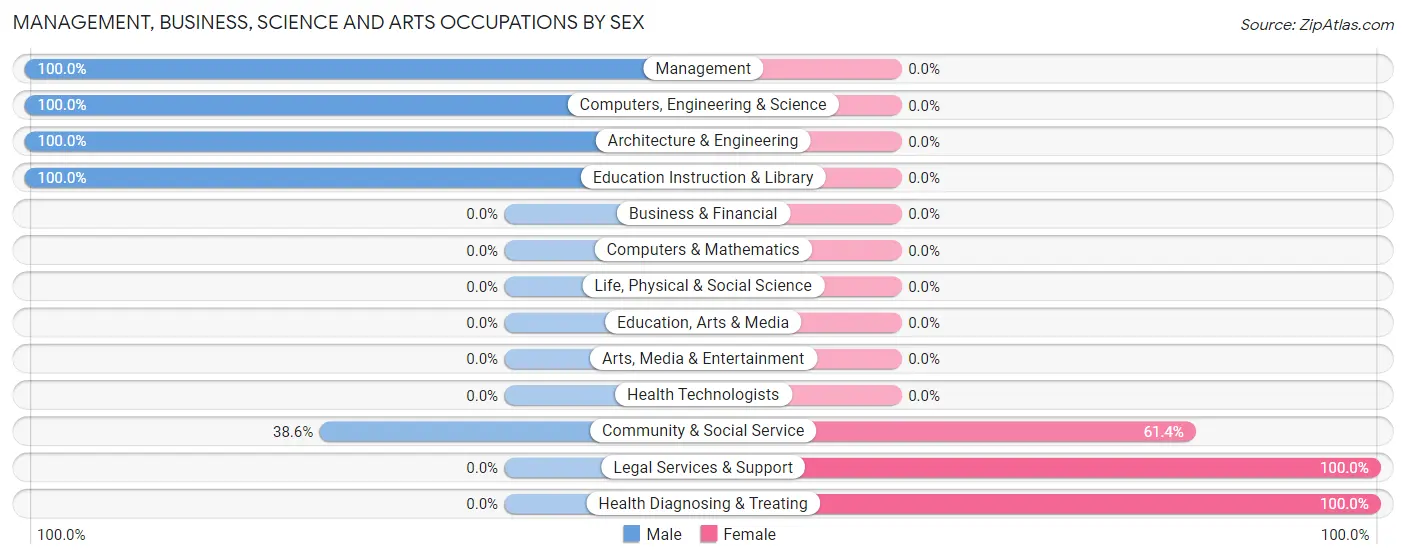
Management, Business, Science and Arts Occupations by Sex
Within the Management, Business, Science and Arts occupations in Seeley, the most male-oriented occupations are Management (100.0%), Computers, Engineering & Science (100.0%), and Architecture & Engineering (100.0%), while the most female-oriented occupations are Legal Services & Support (100.0%), Health Diagnosing & Treating (100.0%), and Community & Social Service (61.4%).
| Occupation | Male | Female |
| Management | 17 (100.0%) | 0 (0.0%) |
| Business & Financial | 0 (0.0%) | 0 (0.0%) |
| Computers, Engineering & Science | 16 (100.0%) | 0 (0.0%) |
| Computers & Mathematics | 0 (0.0%) | 0 (0.0%) |
| Architecture & Engineering | 16 (100.0%) | 0 (0.0%) |
| Life, Physical & Social Science | 0 (0.0%) | 0 (0.0%) |
| Community & Social Service | 27 (38.6%) | 43 (61.4%) |
| Education, Arts & Media | 0 (0.0%) | 0 (0.0%) |
| Legal Services & Support | 0 (0.0%) | 43 (100.0%) |
| Education Instruction & Library | 27 (100.0%) | 0 (0.0%) |
| Arts, Media & Entertainment | 0 (0.0%) | 0 (0.0%) |
| Health Diagnosing & Treating | 0 (0.0%) | 25 (100.0%) |
| Health Technologists | 0 (0.0%) | 0 (0.0%) |
| Total (Category) | 60 (46.9%) | 68 (53.1%) |
| Total (Overall) | 259 (46.6%) | 297 (53.4%) |
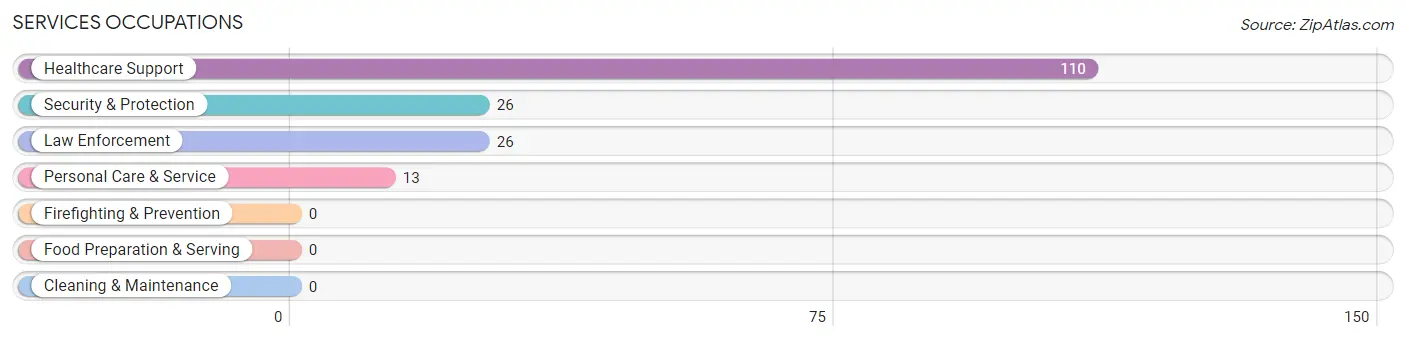
Services Occupations
The most common Services occupations in Seeley are Healthcare Support (110 | 19.8%), Security & Protection (26 | 4.7%), Law Enforcement (26 | 4.7%), and Personal Care & Service (13 | 2.3%).
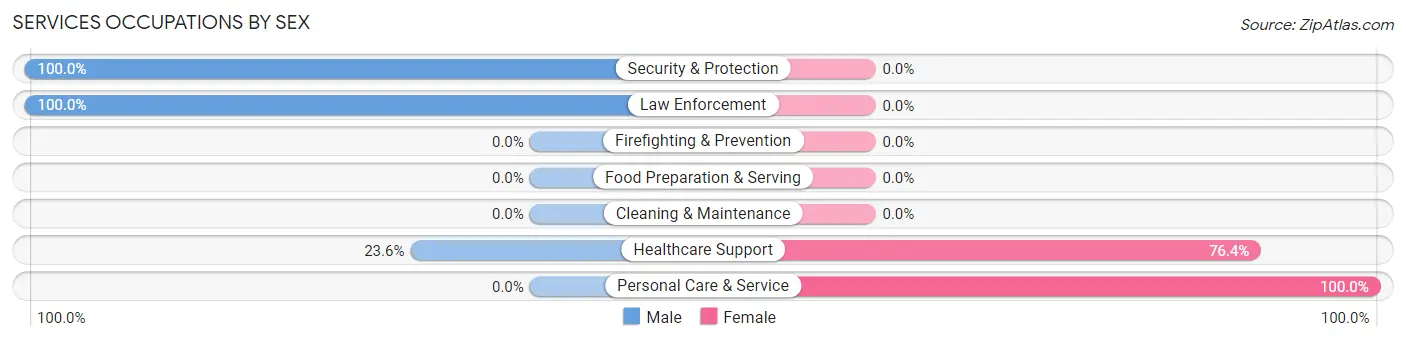
Services Occupations by Sex
Within the Services occupations in Seeley, the most male-oriented occupations are Security & Protection (100.0%), Law Enforcement (100.0%), and Healthcare Support (23.6%), while the most female-oriented occupations are Personal Care & Service (100.0%), and Healthcare Support (76.4%).
| Occupation | Male | Female |
| Healthcare Support | 26 (23.6%) | 84 (76.4%) |
| Security & Protection | 26 (100.0%) | 0 (0.0%) |
| Firefighting & Prevention | 0 (0.0%) | 0 (0.0%) |
| Law Enforcement | 26 (100.0%) | 0 (0.0%) |
| Food Preparation & Serving | 0 (0.0%) | 0 (0.0%) |
| Cleaning & Maintenance | 0 (0.0%) | 0 (0.0%) |
| Personal Care & Service | 0 (0.0%) | 13 (100.0%) |
| Total (Category) | 52 (34.9%) | 97 (65.1%) |
| Total (Overall) | 259 (46.6%) | 297 (53.4%) |
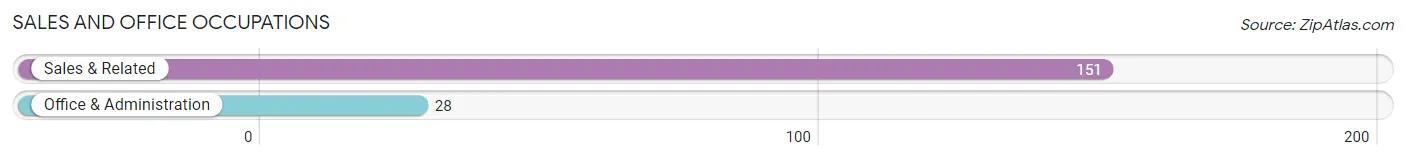
Sales and Office Occupations
The most common Sales and Office occupations in Seeley are Sales & Related (151 | 27.2%), and Office & Administration (28 | 5.0%).
Sales and Office Occupations by Sex
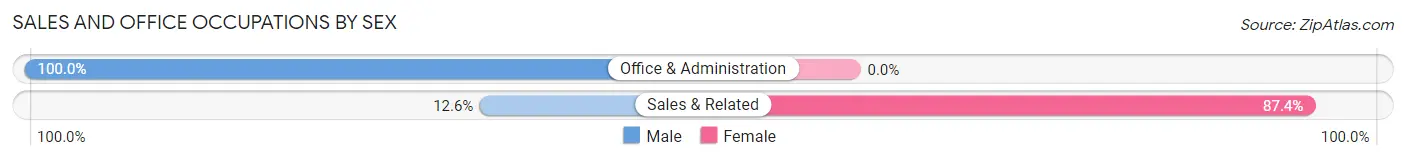
| Occupation | Male | Female |
| Sales & Related | 19 (12.6%) | 132 (87.4%) |
| Office & Administration | 28 (100.0%) | 0 (0.0%) |
| Total (Category) | 47 (26.3%) | 132 (73.7%) |
| Total (Overall) | 259 (46.6%) | 297 (53.4%) |
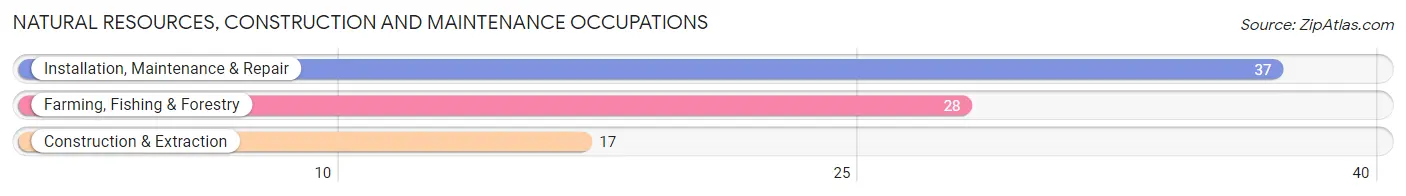
Natural Resources, Construction and Maintenance Occupations
The most common Natural Resources, Construction and Maintenance occupations in Seeley are Installation, Maintenance & Repair (37 | 6.7%), Farming, Fishing & Forestry (28 | 5.0%), and Construction & Extraction (17 | 3.1%).
Natural Resources, Construction and Maintenance Occupations by Sex
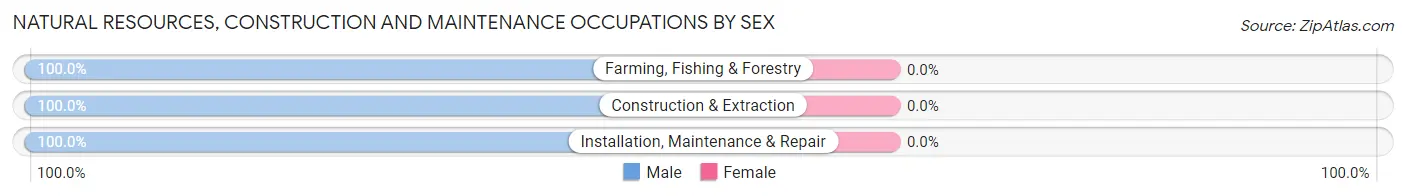
| Occupation | Male | Female |
| Farming, Fishing & Forestry | 28 (100.0%) | 0 (0.0%) |
| Construction & Extraction | 17 (100.0%) | 0 (0.0%) |
| Installation, Maintenance & Repair | 37 (100.0%) | 0 (0.0%) |
| Total (Category) | 82 (100.0%) | 0 (0.0%) |
| Total (Overall) | 259 (46.6%) | 297 (53.4%) |
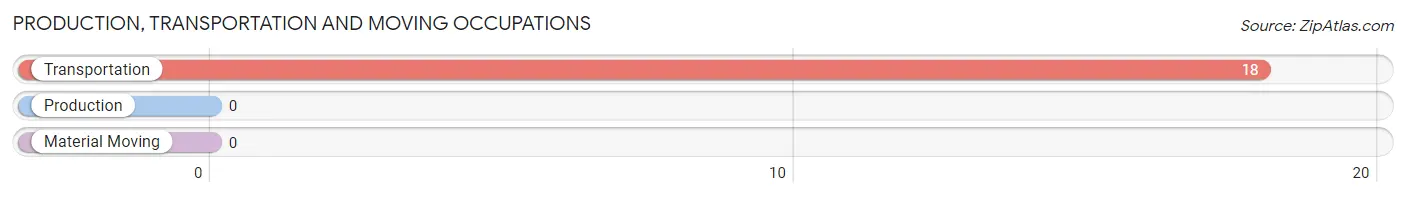
Production, Transportation and Moving Occupations
The most common Production, Transportation and Moving occupations in Seeley are , and Transportation (18 | 3.2%).
Production, Transportation and Moving Occupations by Sex
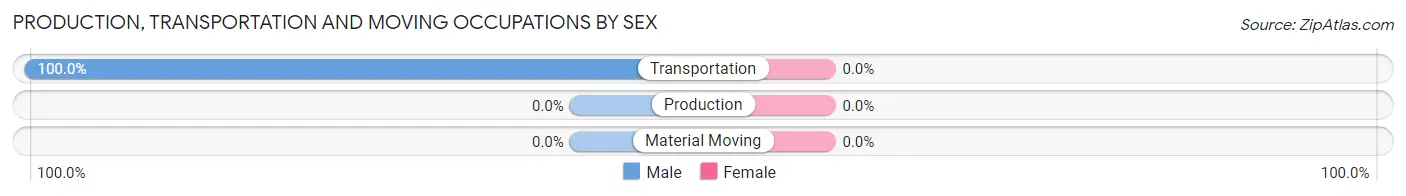
| Occupation | Male | Female |
| Production | 0 (0.0%) | 0 (0.0%) |
| Transportation | 18 (100.0%) | 0 (0.0%) |
| Material Moving | 0 (0.0%) | 0 (0.0%) |
| Total (Category) | 18 (100.0%) | 0 (0.0%) |
| Total (Overall) | 259 (46.6%) | 297 (53.4%) |
Employment Industries by Sex in Seeley
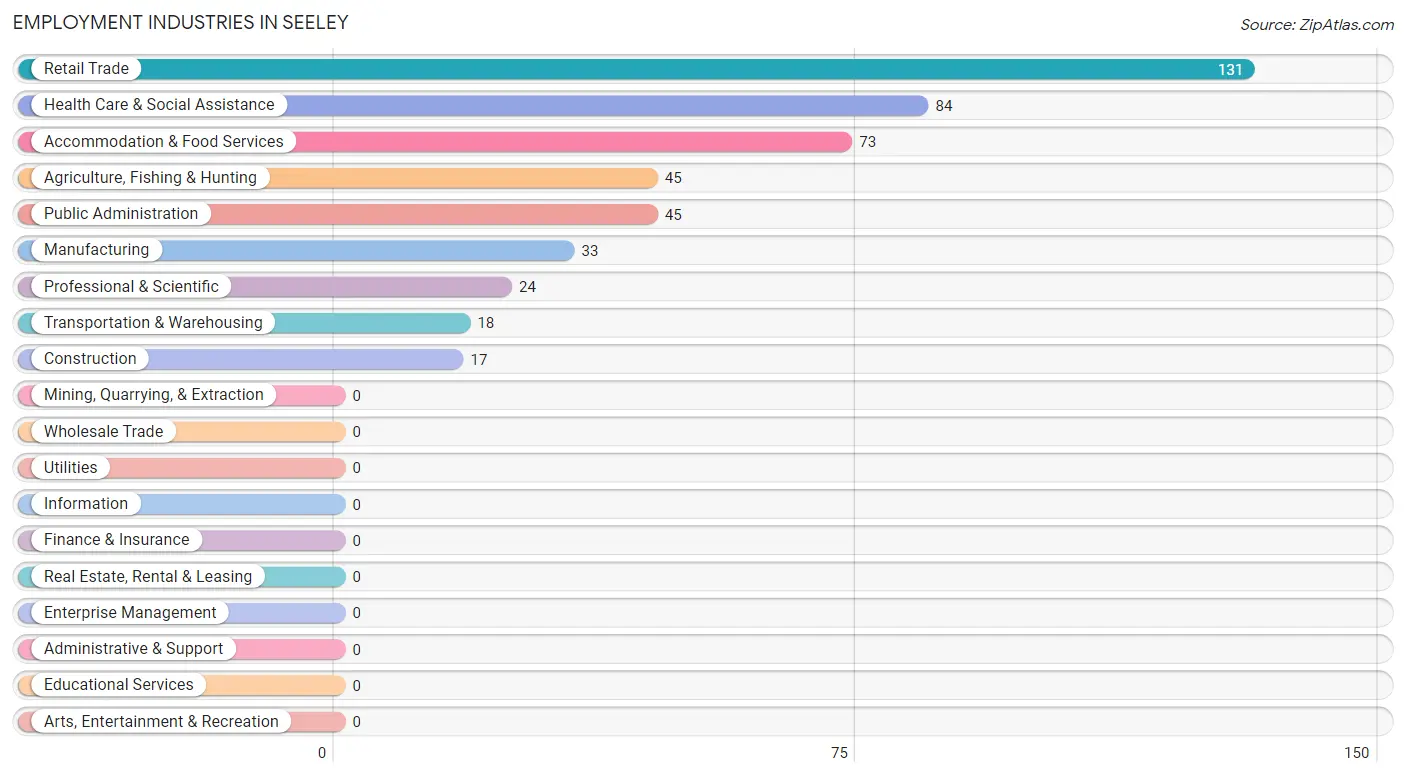
Employment Industries in Seeley
The major employment industries in Seeley include Retail Trade (131 | 23.6%), Health Care & Social Assistance (84 | 15.1%), Accommodation & Food Services (73 | 13.1%), Agriculture, Fishing & Hunting (45 | 8.1%), and Public Administration (45 | 8.1%).
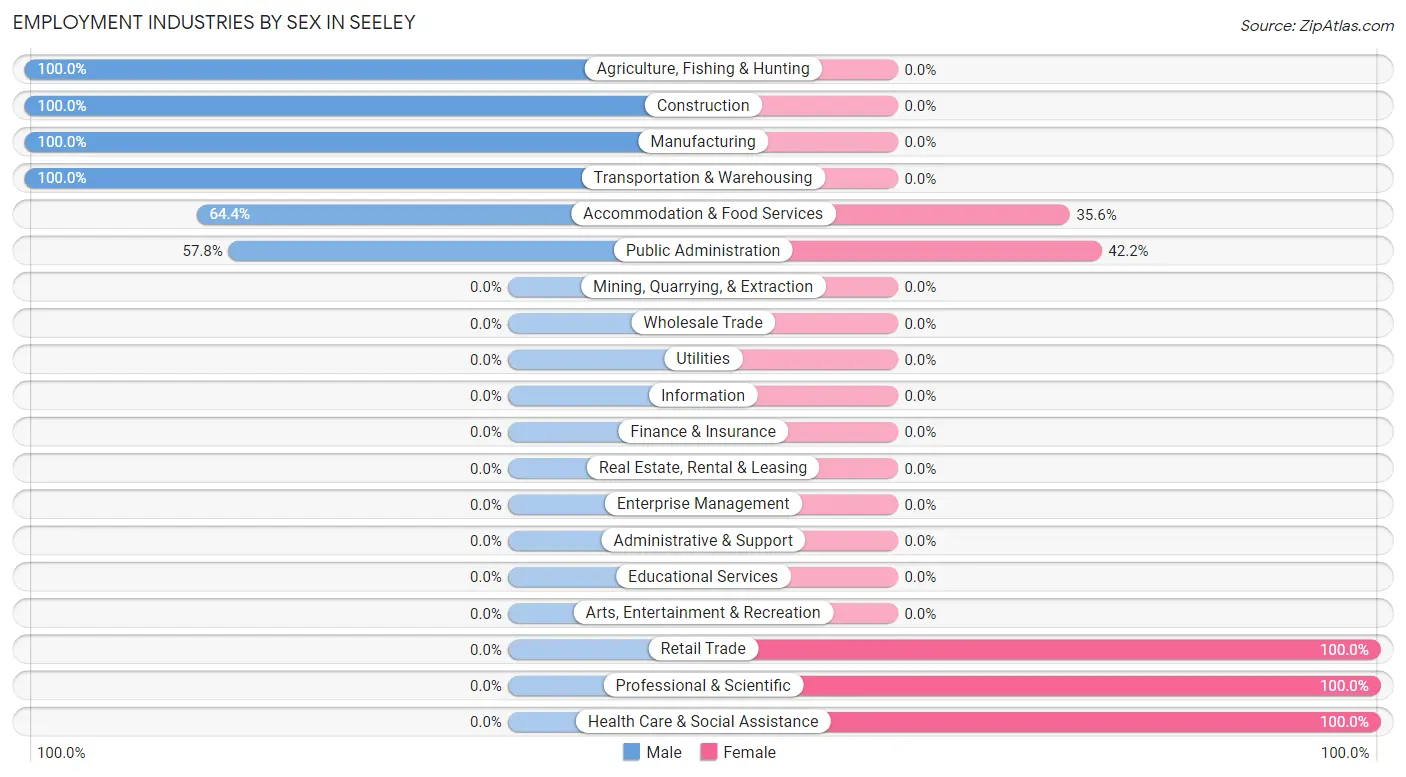
Employment Industries by Sex in Seeley
The Seeley industries that see more men than women are Agriculture, Fishing & Hunting (100.0%), Construction (100.0%), and Manufacturing (100.0%), whereas the industries that tend to have a higher number of women are Retail Trade (100.0%), Professional & Scientific (100.0%), and Health Care & Social Assistance (100.0%).
| Industry | Male | Female |
| Agriculture, Fishing & Hunting | 45 (100.0%) | 0 (0.0%) |
| Mining, Quarrying, & Extraction | 0 (0.0%) | 0 (0.0%) |
| Construction | 17 (100.0%) | 0 (0.0%) |
| Manufacturing | 33 (100.0%) | 0 (0.0%) |
| Wholesale Trade | 0 (0.0%) | 0 (0.0%) |
| Retail Trade | 0 (0.0%) | 131 (100.0%) |
| Transportation & Warehousing | 18 (100.0%) | 0 (0.0%) |
| Utilities | 0 (0.0%) | 0 (0.0%) |
| Information | 0 (0.0%) | 0 (0.0%) |
| Finance & Insurance | 0 (0.0%) | 0 (0.0%) |
| Real Estate, Rental & Leasing | 0 (0.0%) | 0 (0.0%) |
| Professional & Scientific | 0 (0.0%) | 24 (100.0%) |
| Enterprise Management | 0 (0.0%) | 0 (0.0%) |
| Administrative & Support | 0 (0.0%) | 0 (0.0%) |
| Educational Services | 0 (0.0%) | 0 (0.0%) |
| Health Care & Social Assistance | 0 (0.0%) | 84 (100.0%) |
| Arts, Entertainment & Recreation | 0 (0.0%) | 0 (0.0%) |
| Accommodation & Food Services | 47 (64.4%) | 26 (35.6%) |
| Public Administration | 26 (57.8%) | 19 (42.2%) |
| Total | 259 (46.6%) | 297 (53.4%) |
Education in Seeley
School Enrollment in Seeley
The most common levels of schooling among the 555 students in Seeley are college / undergraduate (193 | 34.8%), nursery / preschool (109 | 19.6%), and middle school (101 | 18.2%).
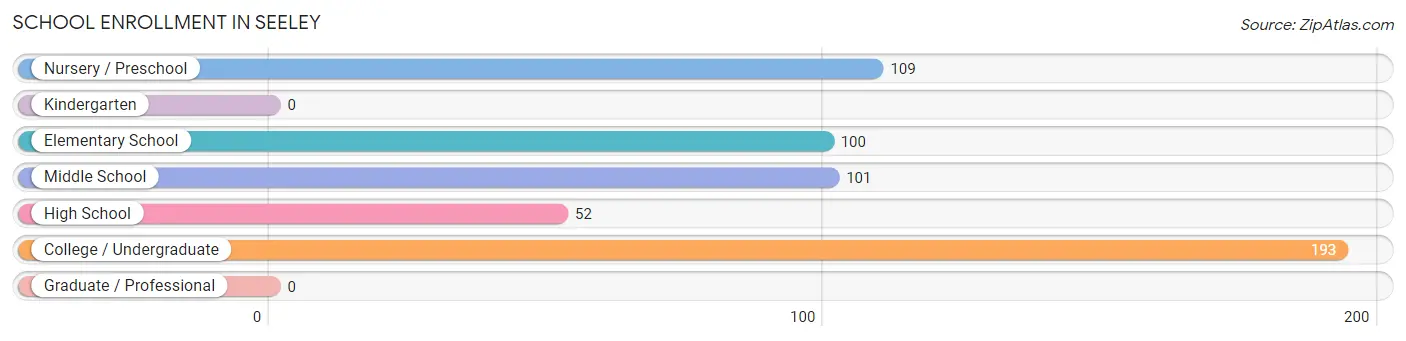
| School Level | # Students | % Students |
| Nursery / Preschool | 109 | 19.6% |
| Kindergarten | 0 | 0.0% |
| Elementary School | 100 | 18.0% |
| Middle School | 101 | 18.2% |
| High School | 52 | 9.4% |
| College / Undergraduate | 193 | 34.8% |
| Graduate / Professional | 0 | 0.0% |
| Total | 555 | 100.0% |
School Enrollment by Age by Funding Source in Seeley
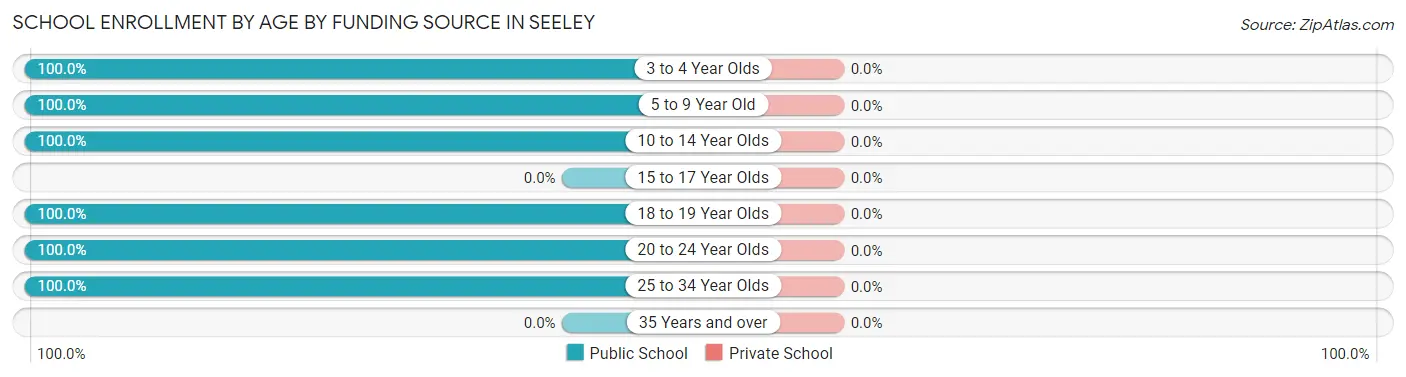
| Age Bracket | Public School | Private School |
| 3 to 4 Year Olds | 109 (100.0%) | 0 (0.0%) |
| 5 to 9 Year Old | 100 (100.0%) | 0 (0.0%) |
| 10 to 14 Year Olds | 153 (100.0%) | 0 (0.0%) |
| 15 to 17 Year Olds | 0 (0.0%) | 0 (0.0%) |
| 18 to 19 Year Olds | 27 (100.0%) | 0 (0.0%) |
| 20 to 24 Year Olds | 105 (100.0%) | 0 (0.0%) |
| 25 to 34 Year Olds | 61 (100.0%) | 0 (0.0%) |
| 35 Years and over | 0 (0.0%) | 0 (0.0%) |
| Total | 555 (100.0%) | 0 (0.0%) |
Educational Attainment by Field of Study in Seeley
Engineering (16 | 34.0%), business (16 | 34.0%), and psychology (15 | 31.9%) are the most common fields of study among 47 individuals in Seeley who have obtained a bachelor's degree or higher.
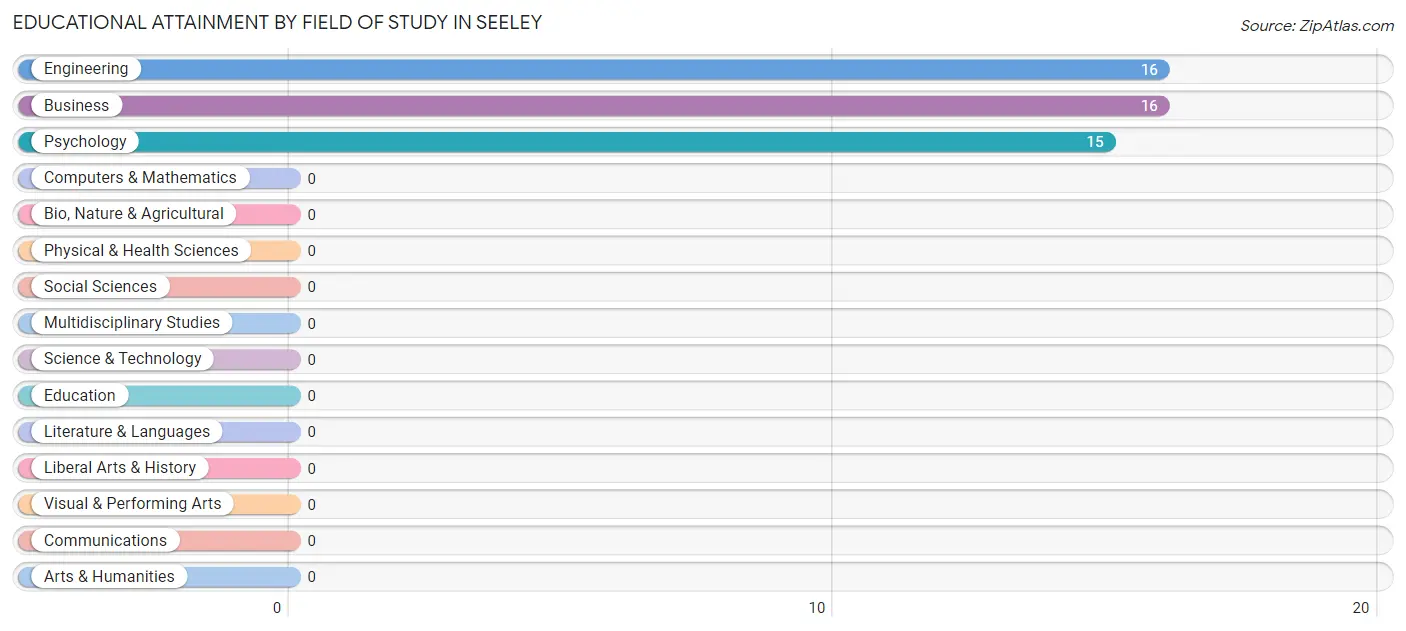
| Field of Study | # Graduates | % Graduates |
| Computers & Mathematics | 0 | 0.0% |
| Bio, Nature & Agricultural | 0 | 0.0% |
| Physical & Health Sciences | 0 | 0.0% |
| Psychology | 15 | 31.9% |
| Social Sciences | 0 | 0.0% |
| Engineering | 16 | 34.0% |
| Multidisciplinary Studies | 0 | 0.0% |
| Science & Technology | 0 | 0.0% |
| Business | 16 | 34.0% |
| Education | 0 | 0.0% |
| Literature & Languages | 0 | 0.0% |
| Liberal Arts & History | 0 | 0.0% |
| Visual & Performing Arts | 0 | 0.0% |
| Communications | 0 | 0.0% |
| Arts & Humanities | 0 | 0.0% |
| Total | 47 | 100.0% |
Transportation & Commute in Seeley
Vehicle Availability by Sex in Seeley
The most prevalent vehicle ownership categories in Seeley are males with 4 vehicles (125, accounting for 48.3%) and females with 4 vehicles (44, making up 42.1%).
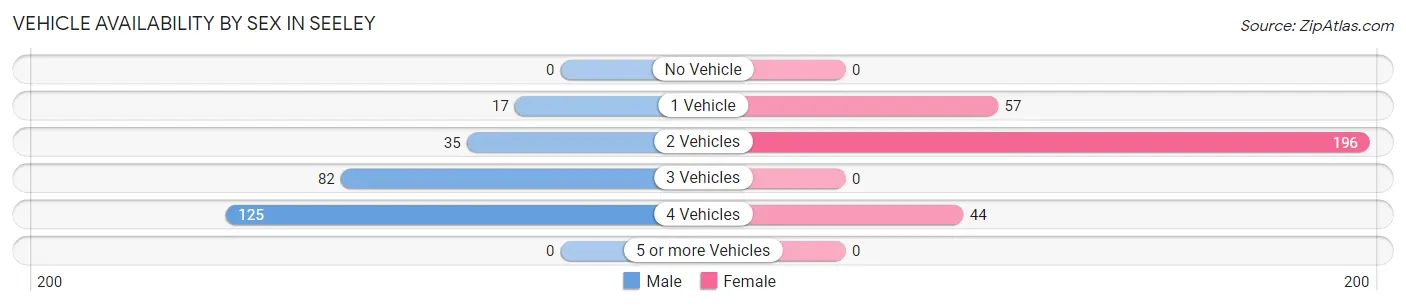
| Vehicles Available | Male | Female |
| No Vehicle | 0 (0.0%) | 0 (0.0%) |
| 1 Vehicle | 17 (6.6%) | 57 (19.2%) |
| 2 Vehicles | 35 (13.5%) | 196 (66.0%) |
| 3 Vehicles | 82 (31.7%) | 0 (0.0%) |
| 4 Vehicles | 125 (48.3%) | 44 (14.8%) |
| 5 or more Vehicles | 0 (0.0%) | 0 (0.0%) |
| Total | 259 (100.0%) | 297 (100.0%) |
Commute Time in Seeley
The most frequently occuring commute durations in Seeley are 20 to 24 minutes (193 commuters, 38.5%), 15 to 19 minutes (180 commuters, 35.9%), and 10 to 14 minutes (45 commuters, 9.0%).
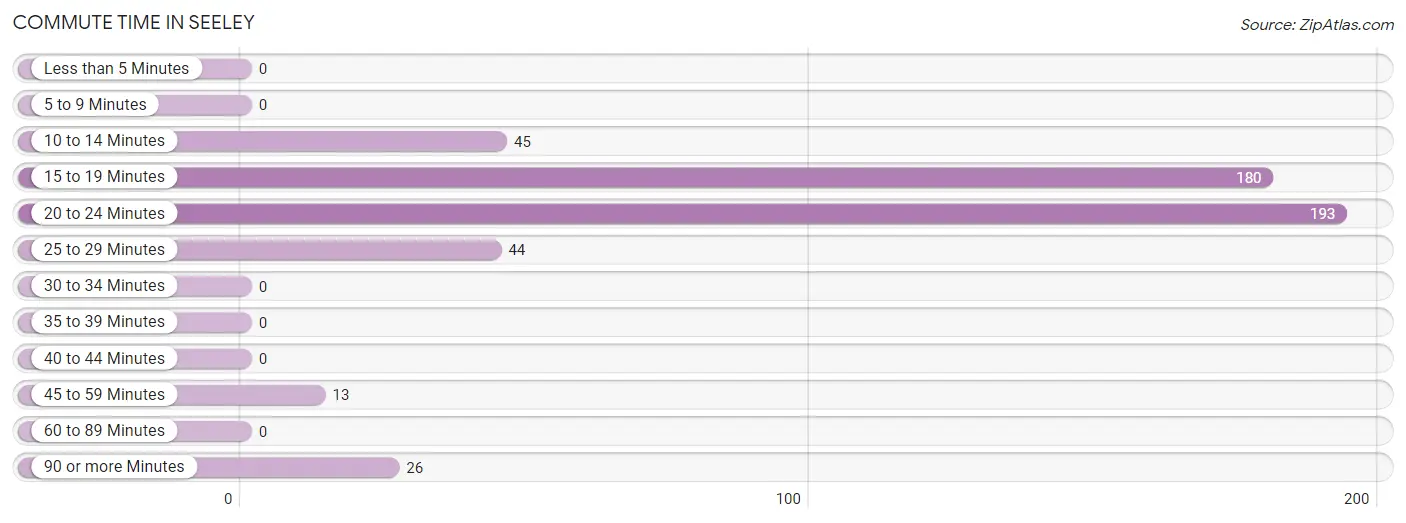
| Commute Time | # Commuters | % Commuters |
| Less than 5 Minutes | 0 | 0.0% |
| 5 to 9 Minutes | 0 | 0.0% |
| 10 to 14 Minutes | 45 | 9.0% |
| 15 to 19 Minutes | 180 | 35.9% |
| 20 to 24 Minutes | 193 | 38.5% |
| 25 to 29 Minutes | 44 | 8.8% |
| 30 to 34 Minutes | 0 | 0.0% |
| 35 to 39 Minutes | 0 | 0.0% |
| 40 to 44 Minutes | 0 | 0.0% |
| 45 to 59 Minutes | 13 | 2.6% |
| 60 to 89 Minutes | 0 | 0.0% |
| 90 or more Minutes | 26 | 5.2% |
Commute Time by Sex in Seeley
The most common commute times in Seeley are 15 to 19 minutes (154 commuters, 59.5%) for males and 20 to 24 minutes (159 commuters, 65.7%) for females.
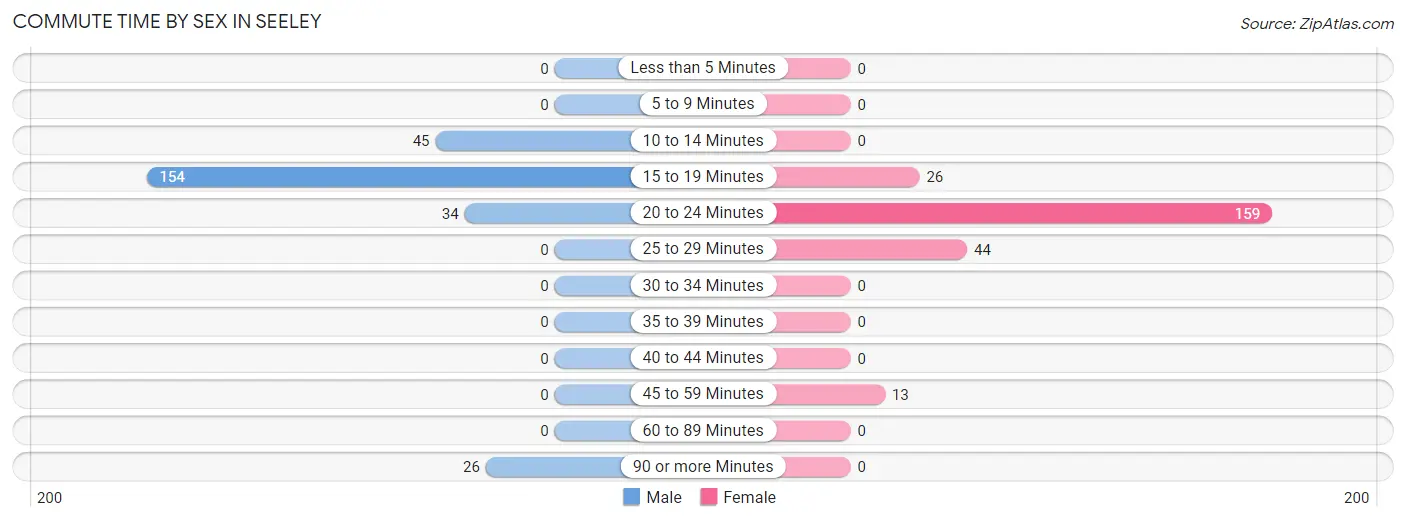
| Commute Time | Male | Female |
| Less than 5 Minutes | 0 (0.0%) | 0 (0.0%) |
| 5 to 9 Minutes | 0 (0.0%) | 0 (0.0%) |
| 10 to 14 Minutes | 45 (17.4%) | 0 (0.0%) |
| 15 to 19 Minutes | 154 (59.5%) | 26 (10.7%) |
| 20 to 24 Minutes | 34 (13.1%) | 159 (65.7%) |
| 25 to 29 Minutes | 0 (0.0%) | 44 (18.2%) |
| 30 to 34 Minutes | 0 (0.0%) | 0 (0.0%) |
| 35 to 39 Minutes | 0 (0.0%) | 0 (0.0%) |
| 40 to 44 Minutes | 0 (0.0%) | 0 (0.0%) |
| 45 to 59 Minutes | 0 (0.0%) | 13 (5.4%) |
| 60 to 89 Minutes | 0 (0.0%) | 0 (0.0%) |
| 90 or more Minutes | 26 (10.0%) | 0 (0.0%) |
Time of Departure to Work by Sex in Seeley
The most frequent times of departure to work in Seeley are 12:00 AM to 4:59 AM (69, 26.6%) for males and 8:00 AM to 8:29 AM (80, 33.1%) for females.
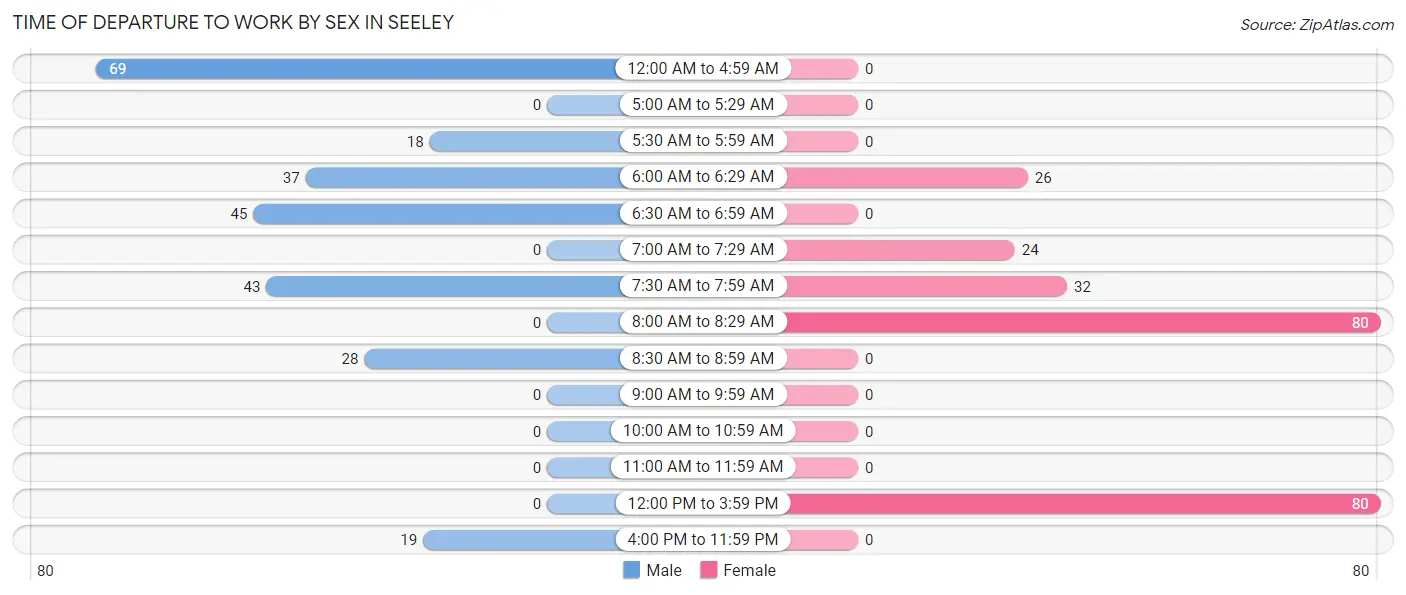
| Time of Departure | Male | Female |
| 12:00 AM to 4:59 AM | 69 (26.6%) | 0 (0.0%) |
| 5:00 AM to 5:29 AM | 0 (0.0%) | 0 (0.0%) |
| 5:30 AM to 5:59 AM | 18 (7.0%) | 0 (0.0%) |
| 6:00 AM to 6:29 AM | 37 (14.3%) | 26 (10.7%) |
| 6:30 AM to 6:59 AM | 45 (17.4%) | 0 (0.0%) |
| 7:00 AM to 7:29 AM | 0 (0.0%) | 24 (9.9%) |
| 7:30 AM to 7:59 AM | 43 (16.6%) | 32 (13.2%) |
| 8:00 AM to 8:29 AM | 0 (0.0%) | 80 (33.1%) |
| 8:30 AM to 8:59 AM | 28 (10.8%) | 0 (0.0%) |
| 9:00 AM to 9:59 AM | 0 (0.0%) | 0 (0.0%) |
| 10:00 AM to 10:59 AM | 0 (0.0%) | 0 (0.0%) |
| 11:00 AM to 11:59 AM | 0 (0.0%) | 0 (0.0%) |
| 12:00 PM to 3:59 PM | 0 (0.0%) | 80 (33.1%) |
| 4:00 PM to 11:59 PM | 19 (7.3%) | 0 (0.0%) |
| Total | 259 (100.0%) | 242 (100.0%) |
Housing Occupancy in Seeley
Occupancy by Ownership in Seeley
Of the total 399 dwellings in Seeley, owner-occupied units account for 248 (62.2%), while renter-occupied units make up 151 (37.8%).
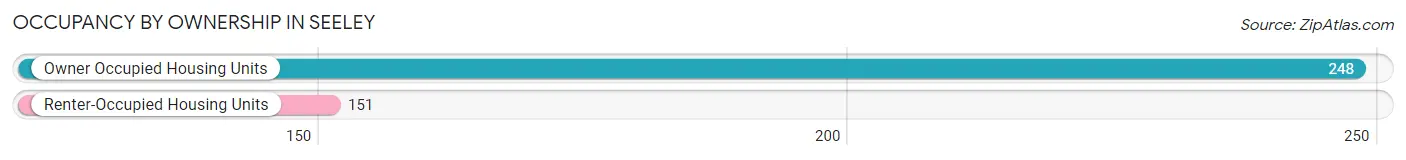
| Occupancy | # Housing Units | % Housing Units |
| Owner Occupied Housing Units | 248 | 62.2% |
| Renter-Occupied Housing Units | 151 | 37.8% |
| Total Occupied Housing Units | 399 | 100.0% |
Occupancy by Household Size in Seeley
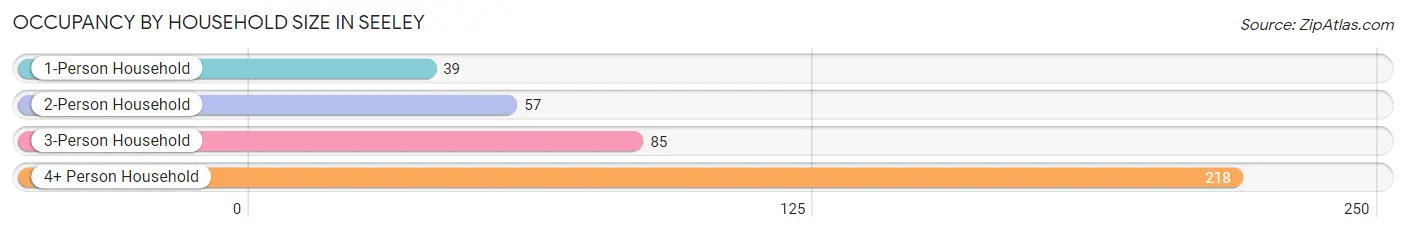
| Household Size | # Housing Units | % Housing Units |
| 1-Person Household | 39 | 9.8% |
| 2-Person Household | 57 | 14.3% |
| 3-Person Household | 85 | 21.3% |
| 4+ Person Household | 218 | 54.6% |
| Total Housing Units | 399 | 100.0% |
Occupancy by Ownership by Household Size in Seeley
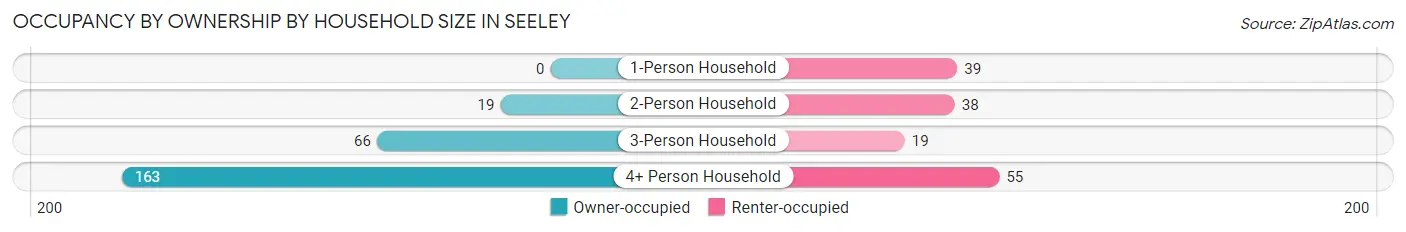
| Household Size | Owner-occupied | Renter-occupied |
| 1-Person Household | 0 (0.0%) | 39 (100.0%) |
| 2-Person Household | 19 (33.3%) | 38 (66.7%) |
| 3-Person Household | 66 (77.6%) | 19 (22.4%) |
| 4+ Person Household | 163 (74.8%) | 55 (25.2%) |
| Total Housing Units | 248 (62.2%) | 151 (37.8%) |
Occupancy by Educational Attainment in Seeley
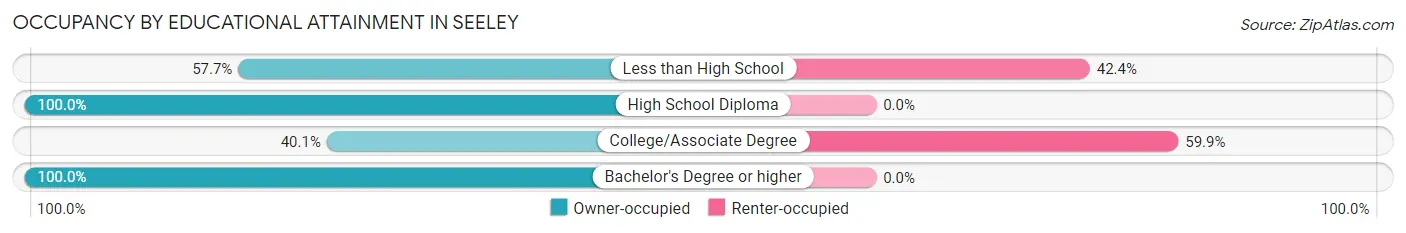
| Household Size | Owner-occupied | Renter-occupied |
| Less than High School | 49 (57.7%) | 36 (42.3%) |
| High School Diploma | 107 (100.0%) | 0 (0.0%) |
| College/Associate Degree | 77 (40.1%) | 115 (59.9%) |
| Bachelor's Degree or higher | 15 (100.0%) | 0 (0.0%) |
Occupancy by Age of Householder in Seeley
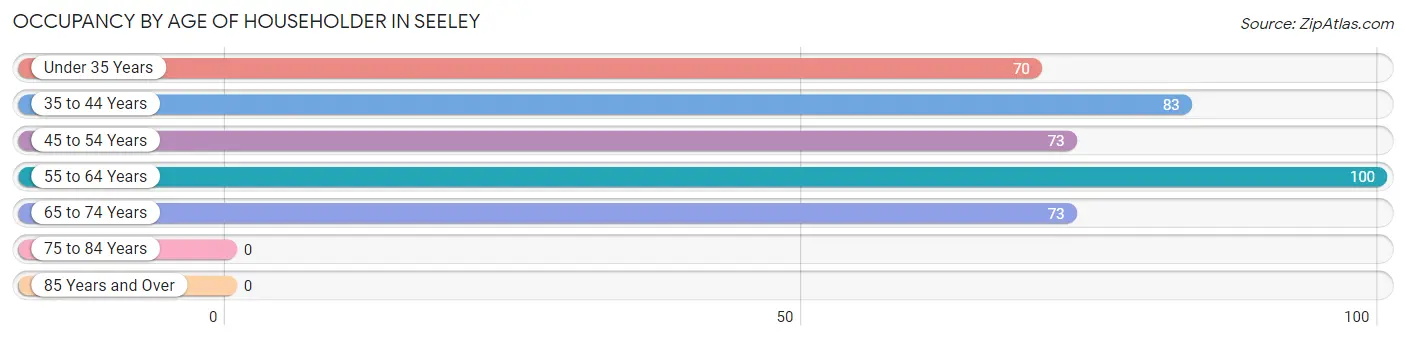
| Age Bracket | # Households | % Households |
| Under 35 Years | 70 | 17.5% |
| 35 to 44 Years | 83 | 20.8% |
| 45 to 54 Years | 73 | 18.3% |
| 55 to 64 Years | 100 | 25.1% |
| 65 to 74 Years | 73 | 18.3% |
| 75 to 84 Years | 0 | 0.0% |
| 85 Years and Over | 0 | 0.0% |
| Total | 399 | 100.0% |
Housing Finances in Seeley
Median Income by Occupancy in Seeley
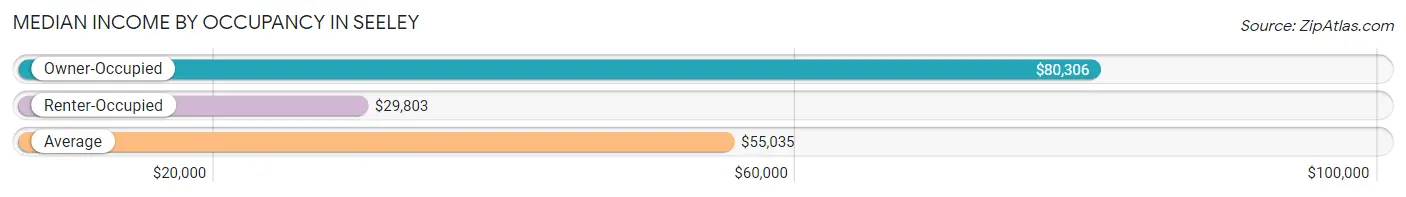
| Occupancy Type | # Households | Median Income |
| Owner-Occupied | 248 (62.2%) | $80,306 |
| Renter-Occupied | 151 (37.8%) | $29,803 |
| Average | 399 (100.0%) | $55,035 |
Occupancy by Householder Income Bracket in Seeley
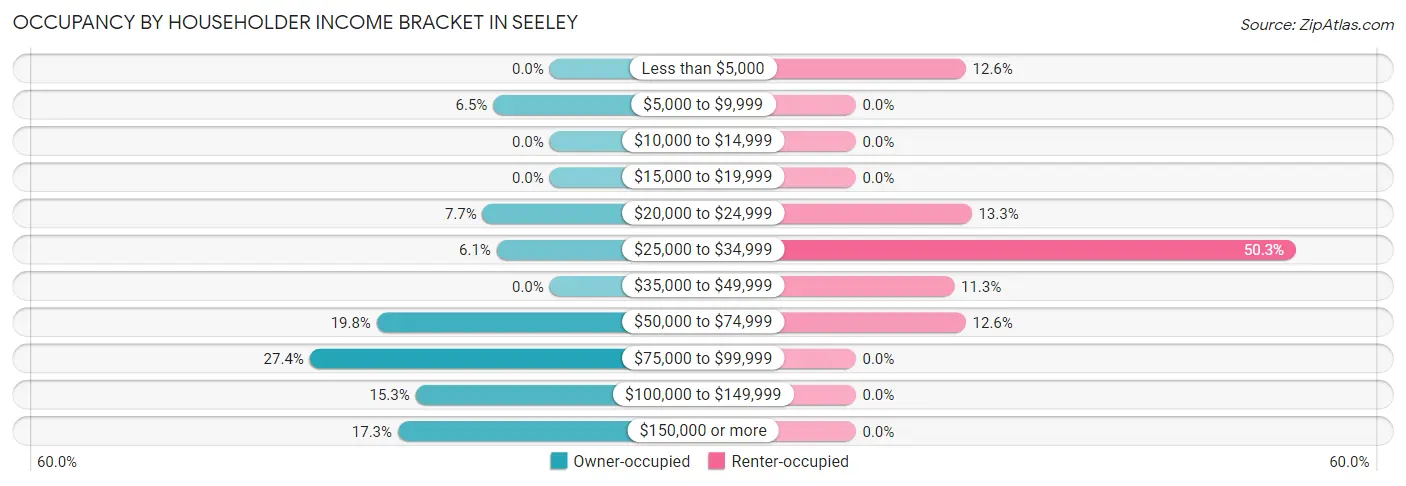
| Income Bracket | Owner-occupied | Renter-occupied |
| Less than $5,000 | 0 (0.0%) | 19 (12.6%) |
| $5,000 to $9,999 | 16 (6.5%) | 0 (0.0%) |
| $10,000 to $14,999 | 0 (0.0%) | 0 (0.0%) |
| $15,000 to $19,999 | 0 (0.0%) | 0 (0.0%) |
| $20,000 to $24,999 | 19 (7.7%) | 20 (13.3%) |
| $25,000 to $34,999 | 15 (6.0%) | 76 (50.3%) |
| $35,000 to $49,999 | 0 (0.0%) | 17 (11.3%) |
| $50,000 to $74,999 | 49 (19.8%) | 19 (12.6%) |
| $75,000 to $99,999 | 68 (27.4%) | 0 (0.0%) |
| $100,000 to $149,999 | 38 (15.3%) | 0 (0.0%) |
| $150,000 or more | 43 (17.3%) | 0 (0.0%) |
| Total | 248 (100.0%) | 151 (100.0%) |
Monthly Housing Cost Tiers in Seeley
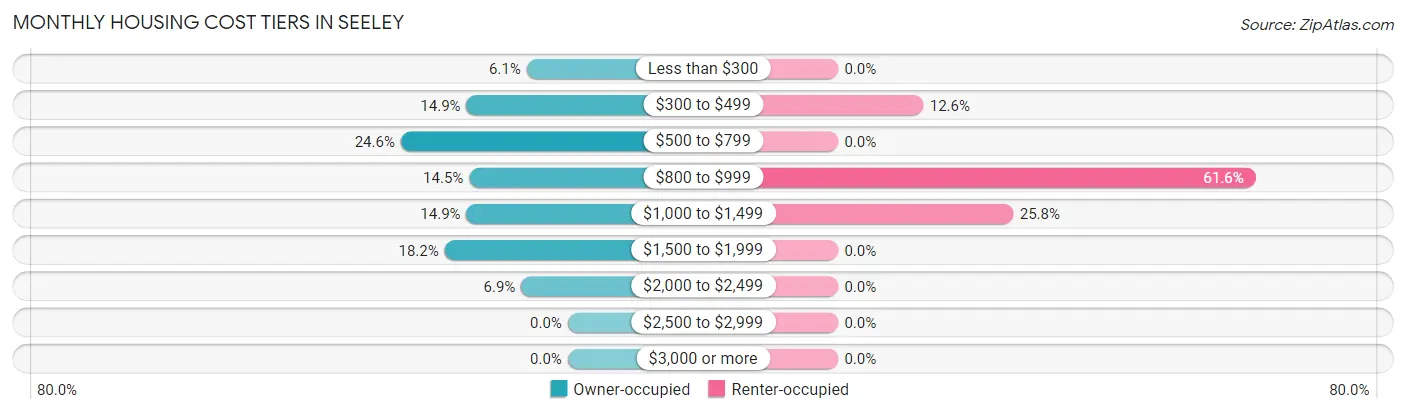
| Monthly Cost | Owner-occupied | Renter-occupied |
| Less than $300 | 15 (6.0%) | 0 (0.0%) |
| $300 to $499 | 37 (14.9%) | 19 (12.6%) |
| $500 to $799 | 61 (24.6%) | 0 (0.0%) |
| $800 to $999 | 36 (14.5%) | 93 (61.6%) |
| $1,000 to $1,499 | 37 (14.9%) | 39 (25.8%) |
| $1,500 to $1,999 | 45 (18.1%) | 0 (0.0%) |
| $2,000 to $2,499 | 17 (6.9%) | 0 (0.0%) |
| $2,500 to $2,999 | 0 (0.0%) | 0 (0.0%) |
| $3,000 or more | 0 (0.0%) | 0 (0.0%) |
| Total | 248 (100.0%) | 151 (100.0%) |
Physical Housing Characteristics in Seeley
Housing Structures in Seeley
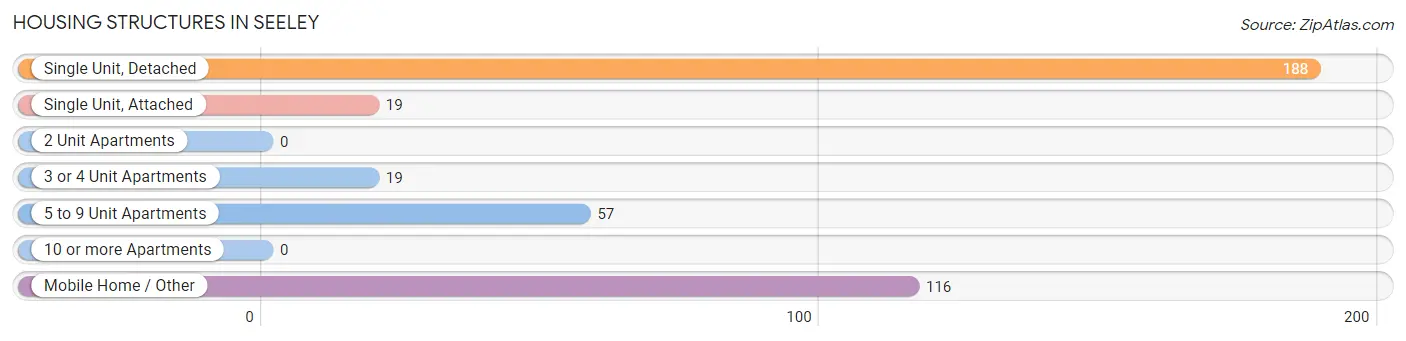
| Structure Type | # Housing Units | % Housing Units |
| Single Unit, Detached | 188 | 47.1% |
| Single Unit, Attached | 19 | 4.8% |
| 2 Unit Apartments | 0 | 0.0% |
| 3 or 4 Unit Apartments | 19 | 4.8% |
| 5 to 9 Unit Apartments | 57 | 14.3% |
| 10 or more Apartments | 0 | 0.0% |
| Mobile Home / Other | 116 | 29.1% |
| Total | 399 | 100.0% |
Housing Structures by Occupancy in Seeley
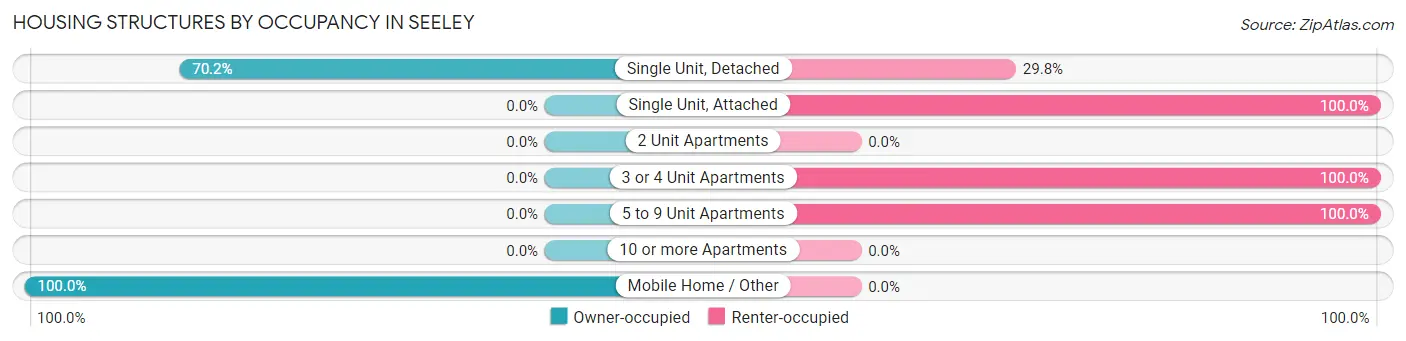
| Structure Type | Owner-occupied | Renter-occupied |
| Single Unit, Detached | 132 (70.2%) | 56 (29.8%) |
| Single Unit, Attached | 0 (0.0%) | 19 (100.0%) |
| 2 Unit Apartments | 0 (0.0%) | 0 (0.0%) |
| 3 or 4 Unit Apartments | 0 (0.0%) | 19 (100.0%) |
| 5 to 9 Unit Apartments | 0 (0.0%) | 57 (100.0%) |
| 10 or more Apartments | 0 (0.0%) | 0 (0.0%) |
| Mobile Home / Other | 116 (100.0%) | 0 (0.0%) |
| Total | 248 (62.2%) | 151 (37.8%) |
Housing Structures by Number of Rooms in Seeley
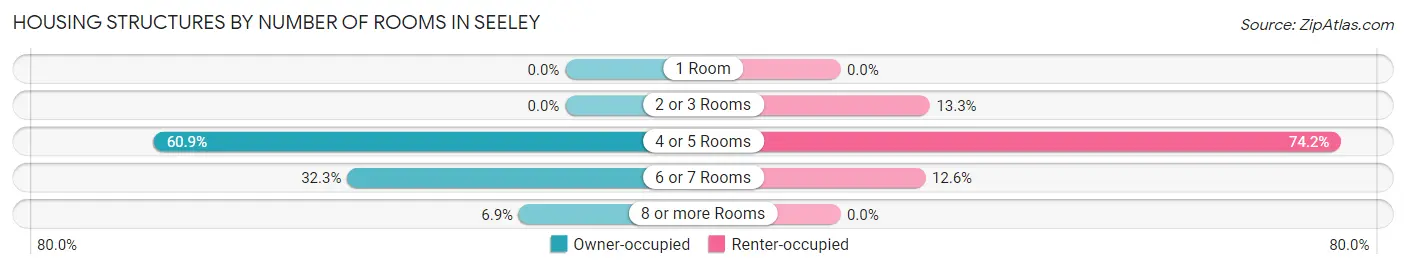
| Number of Rooms | Owner-occupied | Renter-occupied |
| 1 Room | 0 (0.0%) | 0 (0.0%) |
| 2 or 3 Rooms | 0 (0.0%) | 20 (13.3%) |
| 4 or 5 Rooms | 151 (60.9%) | 112 (74.2%) |
| 6 or 7 Rooms | 80 (32.3%) | 19 (12.6%) |
| 8 or more Rooms | 17 (6.9%) | 0 (0.0%) |
| Total | 248 (100.0%) | 151 (100.0%) |
Housing Structure by Heating Type in Seeley
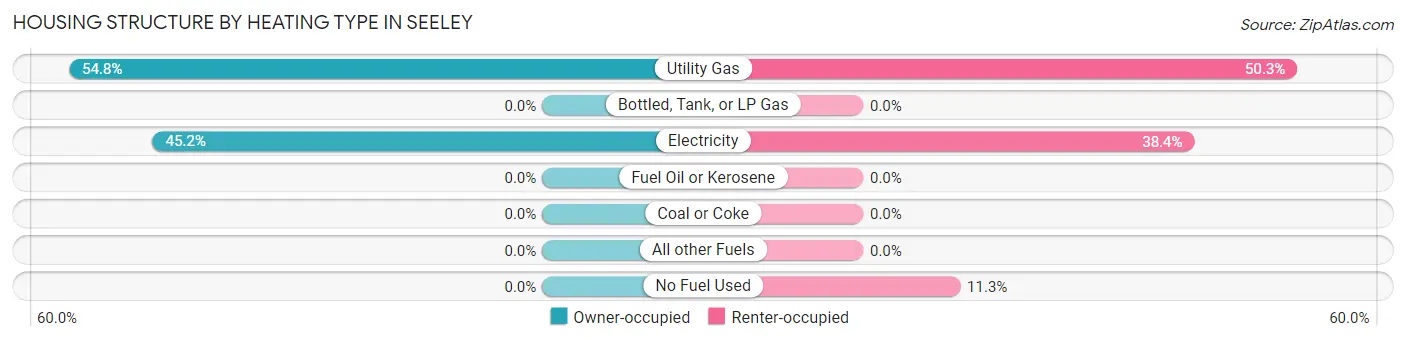
| Heating Type | Owner-occupied | Renter-occupied |
| Utility Gas | 136 (54.8%) | 76 (50.3%) |
| Bottled, Tank, or LP Gas | 0 (0.0%) | 0 (0.0%) |
| Electricity | 112 (45.2%) | 58 (38.4%) |
| Fuel Oil or Kerosene | 0 (0.0%) | 0 (0.0%) |
| Coal or Coke | 0 (0.0%) | 0 (0.0%) |
| All other Fuels | 0 (0.0%) | 0 (0.0%) |
| No Fuel Used | 0 (0.0%) | 17 (11.3%) |
| Total | 248 (100.0%) | 151 (100.0%) |
Household Vehicle Usage in Seeley
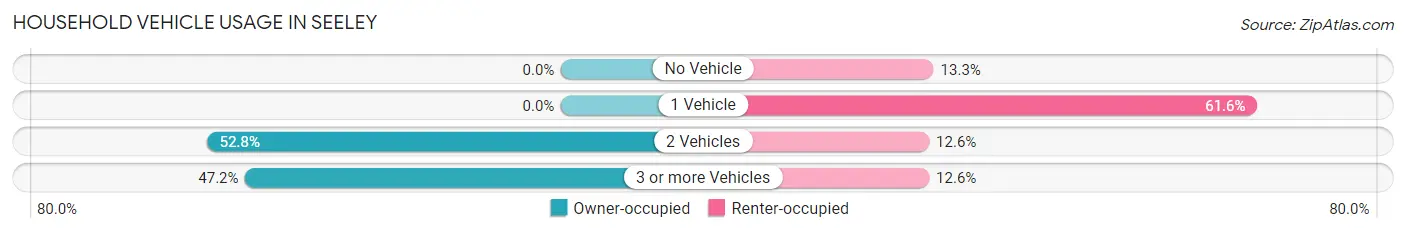
| Vehicles per Household | Owner-occupied | Renter-occupied |
| No Vehicle | 0 (0.0%) | 20 (13.3%) |
| 1 Vehicle | 0 (0.0%) | 93 (61.6%) |
| 2 Vehicles | 131 (52.8%) | 19 (12.6%) |
| 3 or more Vehicles | 117 (47.2%) | 19 (12.6%) |
| Total | 248 (100.0%) | 151 (100.0%) |
Real Estate & Mortgages in Seeley
Real Estate and Mortgage Overview in Seeley
| Characteristic | Without Mortgage | With Mortgage |
| Housing Units | 111 | 137 |
| Median Property Value | - | - |
| Median Household Income | $80,987 | $17 |
| Monthly Housing Costs | $550 | $0 |
| Real Estate Taxes | - | - |
Property Value by Mortgage Status in Seeley
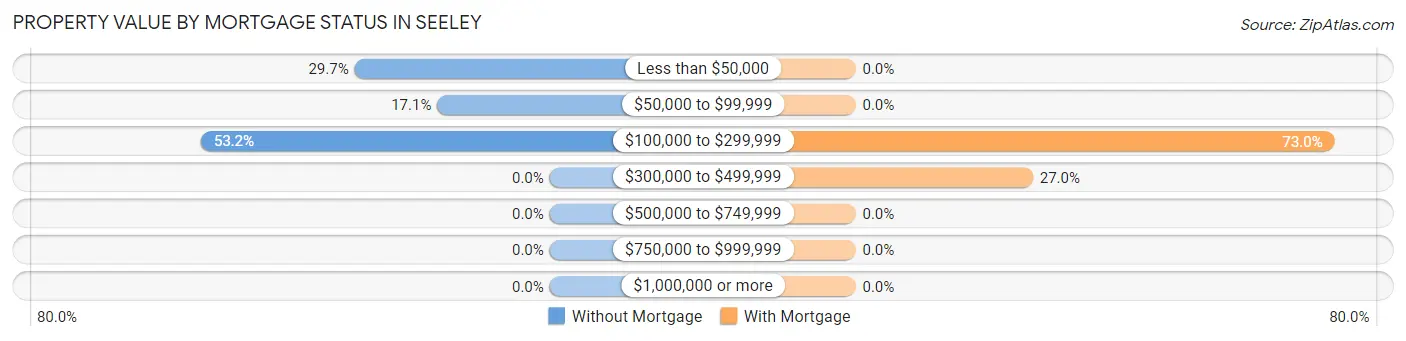
| Property Value | Without Mortgage | With Mortgage |
| Less than $50,000 | 33 (29.7%) | 0 (0.0%) |
| $50,000 to $99,999 | 19 (17.1%) | 0 (0.0%) |
| $100,000 to $299,999 | 59 (53.1%) | 100 (73.0%) |
| $300,000 to $499,999 | 0 (0.0%) | 37 (27.0%) |
| $500,000 to $749,999 | 0 (0.0%) | 0 (0.0%) |
| $750,000 to $999,999 | 0 (0.0%) | 0 (0.0%) |
| $1,000,000 or more | 0 (0.0%) | 0 (0.0%) |
| Total | 111 (100.0%) | 137 (100.0%) |
Household Income by Mortgage Status in Seeley
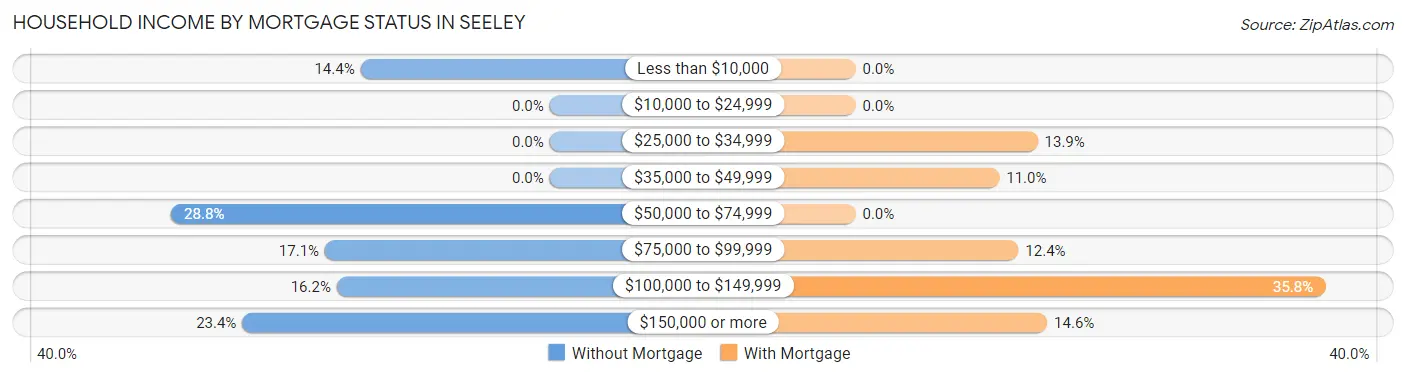
| Household Income | Without Mortgage | With Mortgage |
| Less than $10,000 | 16 (14.4%) | 0 (0.0%) |
| $10,000 to $24,999 | 0 (0.0%) | 0 (0.0%) |
| $25,000 to $34,999 | 0 (0.0%) | 19 (13.9%) |
| $35,000 to $49,999 | 0 (0.0%) | 15 (11.0%) |
| $50,000 to $74,999 | 32 (28.8%) | 0 (0.0%) |
| $75,000 to $99,999 | 19 (17.1%) | 17 (12.4%) |
| $100,000 to $149,999 | 18 (16.2%) | 49 (35.8%) |
| $150,000 or more | 26 (23.4%) | 20 (14.6%) |
| Total | 111 (100.0%) | 137 (100.0%) |
Property Value to Household Income Ratio in Seeley
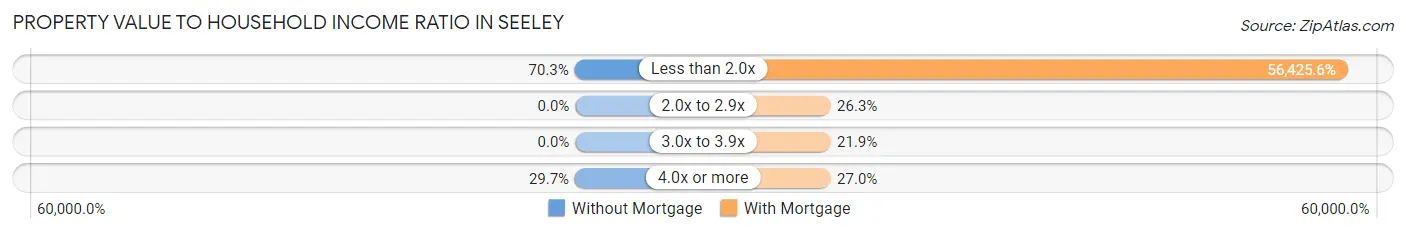
| Value-to-Income Ratio | Without Mortgage | With Mortgage |
| Less than 2.0x | 78 (70.3%) | 77,303 (56,425.5%) |
| 2.0x to 2.9x | 0 (0.0%) | 36 (26.3%) |
| 3.0x to 3.9x | 0 (0.0%) | 30 (21.9%) |
| 4.0x or more | 33 (29.7%) | 37 (27.0%) |
| Total | 111 (100.0%) | 137 (100.0%) |
Real Estate Taxes by Mortgage Status in Seeley
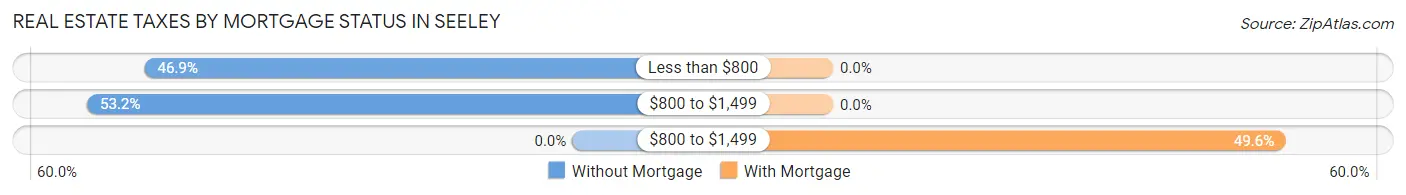
| Property Taxes | Without Mortgage | With Mortgage |
| Less than $800 | 52 (46.9%) | 0 (0.0%) |
| $800 to $1,499 | 59 (53.1%) | 0 (0.0%) |
| $800 to $1,499 | 0 (0.0%) | 68 (49.6%) |
| Total | 111 (100.0%) | 137 (100.0%) |
Health & Disability in Seeley
Health Insurance Coverage by Age in Seeley
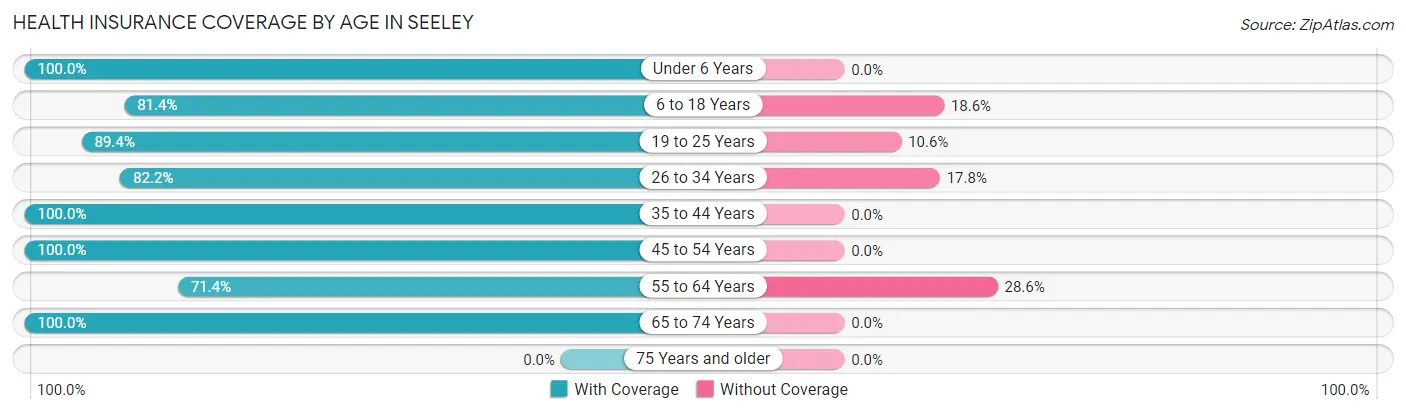
| Age Bracket | With Coverage | Without Coverage |
| Under 6 Years | 247 (100.0%) | 0 (0.0%) |
| 6 to 18 Years | 206 (81.4%) | 47 (18.6%) |
| 19 to 25 Years | 219 (89.4%) | 26 (10.6%) |
| 26 to 34 Years | 277 (82.2%) | 60 (17.8%) |
| 35 to 44 Years | 199 (100.0%) | 0 (0.0%) |
| 45 to 54 Years | 223 (100.0%) | 0 (0.0%) |
| 55 to 64 Years | 100 (71.4%) | 40 (28.6%) |
| 65 to 74 Years | 112 (100.0%) | 0 (0.0%) |
| 75 Years and older | 0 (0.0%) | 0 (0.0%) |
| Total | 1,583 (90.1%) | 173 (9.9%) |
Health Insurance Coverage by Citizenship Status in Seeley
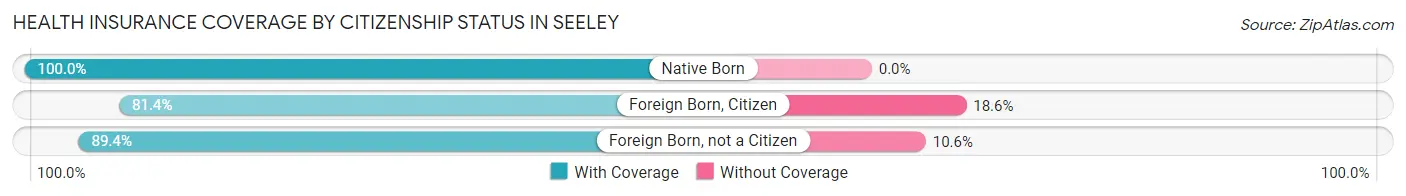
| Citizenship Status | With Coverage | Without Coverage |
| Native Born | 247 (100.0%) | 0 (0.0%) |
| Foreign Born, Citizen | 206 (81.4%) | 47 (18.6%) |
| Foreign Born, not a Citizen | 219 (89.4%) | 26 (10.6%) |
Health Insurance Coverage by Household Income in Seeley
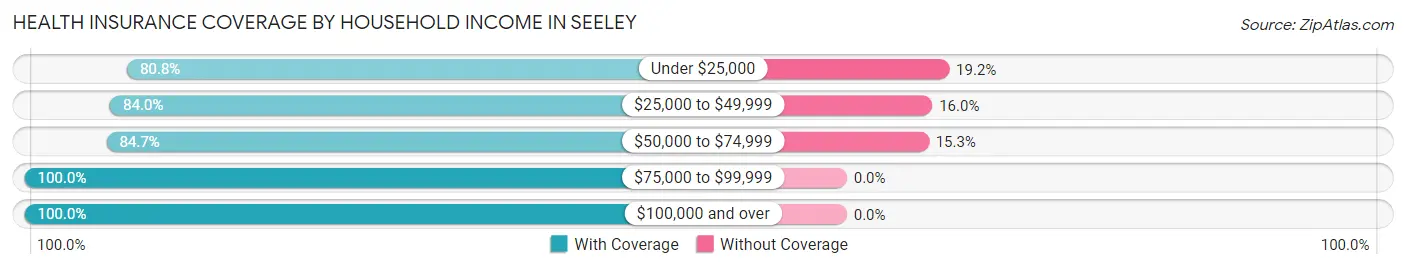
| Household Income | With Coverage | Without Coverage |
| Under $25,000 | 177 (80.8%) | 42 (19.2%) |
| $25,000 to $49,999 | 425 (84.0%) | 81 (16.0%) |
| $50,000 to $74,999 | 276 (84.7%) | 50 (15.3%) |
| $75,000 to $99,999 | 352 (100.0%) | 0 (0.0%) |
| $100,000 and over | 353 (100.0%) | 0 (0.0%) |
Public vs Private Health Insurance Coverage by Age in Seeley
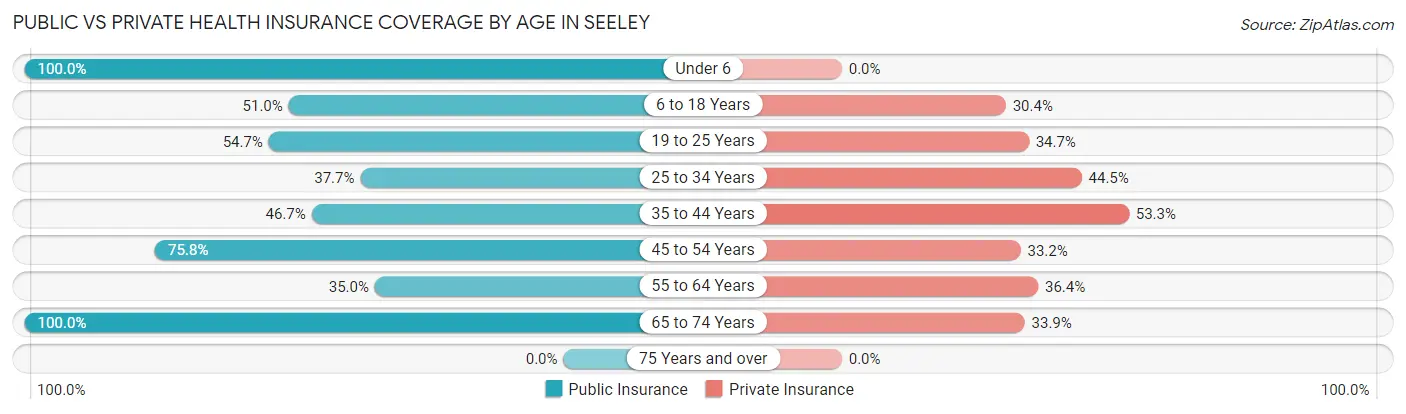
| Age Bracket | Public Insurance | Private Insurance |
| Under 6 | 247 (100.0%) | 0 (0.0%) |
| 6 to 18 Years | 129 (51.0%) | 77 (30.4%) |
| 19 to 25 Years | 134 (54.7%) | 85 (34.7%) |
| 25 to 34 Years | 127 (37.7%) | 150 (44.5%) |
| 35 to 44 Years | 93 (46.7%) | 106 (53.3%) |
| 45 to 54 Years | 169 (75.8%) | 74 (33.2%) |
| 55 to 64 Years | 49 (35.0%) | 51 (36.4%) |
| 65 to 74 Years | 112 (100.0%) | 38 (33.9%) |
| 75 Years and over | 0 (0.0%) | 0 (0.0%) |
| Total | 1,060 (60.4%) | 581 (33.1%) |
Disability Status by Sex by Age in Seeley
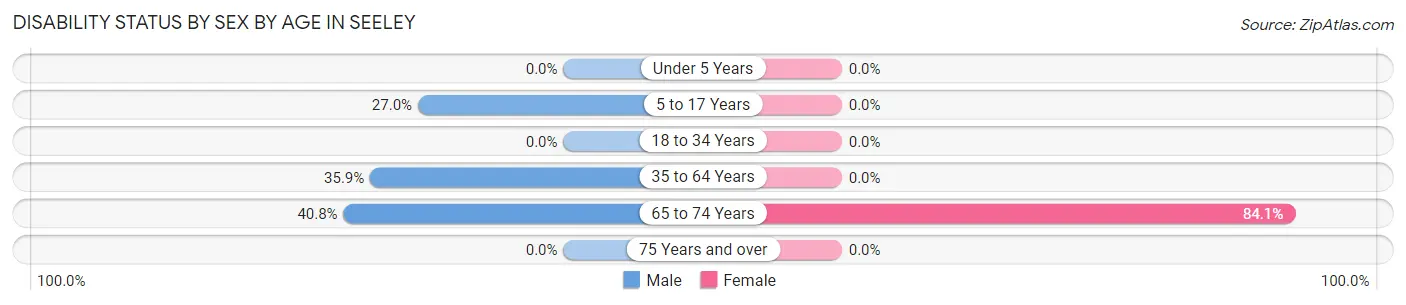
| Age Bracket | Male | Female |
| Under 5 Years | 0 (0.0%) | 0 (0.0%) |
| 5 to 17 Years | 27 (27.0%) | 0 (0.0%) |
| 18 to 34 Years | 0 (0.0%) | 0 (0.0%) |
| 35 to 64 Years | 113 (35.9%) | 0 (0.0%) |
| 65 to 74 Years | 20 (40.8%) | 53 (84.1%) |
| 75 Years and over | 0 (0.0%) | 0 (0.0%) |
Disability Class by Sex by Age in Seeley
Disability Class: Hearing Difficulty
| Age Bracket | Male | Female |
| Under 5 Years | 0 (0.0%) | 0 (0.0%) |
| 5 to 17 Years | 0 (0.0%) | 0 (0.0%) |
| 18 to 34 Years | 0 (0.0%) | 0 (0.0%) |
| 35 to 64 Years | 0 (0.0%) | 0 (0.0%) |
| 65 to 74 Years | 0 (0.0%) | 0 (0.0%) |
| 75 Years and over | 0 (0.0%) | 0 (0.0%) |
Disability Class: Vision Difficulty
| Age Bracket | Male | Female |
| Under 5 Years | 0 (0.0%) | 0 (0.0%) |
| 5 to 17 Years | 0 (0.0%) | 0 (0.0%) |
| 18 to 34 Years | 0 (0.0%) | 0 (0.0%) |
| 35 to 64 Years | 0 (0.0%) | 0 (0.0%) |
| 65 to 74 Years | 0 (0.0%) | 0 (0.0%) |
| 75 Years and over | 0 (0.0%) | 0 (0.0%) |
Disability Class: Cognitive Difficulty
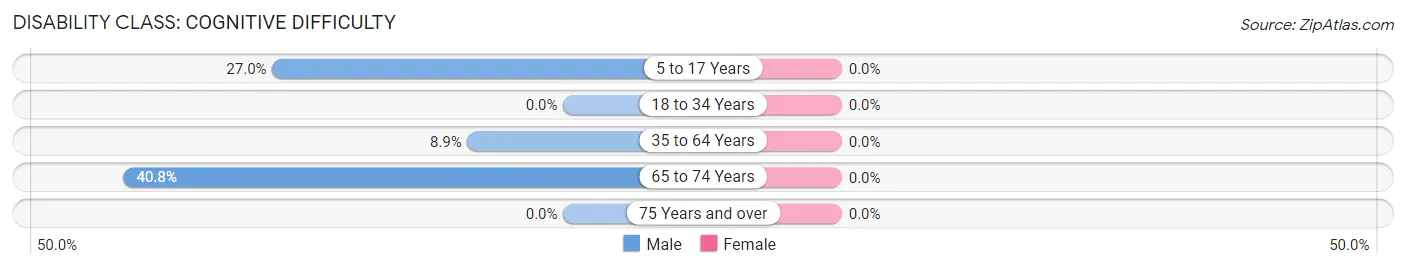
| Age Bracket | Male | Female |
| 5 to 17 Years | 27 (27.0%) | 0 (0.0%) |
| 18 to 34 Years | 0 (0.0%) | 0 (0.0%) |
| 35 to 64 Years | 28 (8.9%) | 0 (0.0%) |
| 65 to 74 Years | 20 (40.8%) | 0 (0.0%) |
| 75 Years and over | 0 (0.0%) | 0 (0.0%) |
Disability Class: Ambulatory Difficulty
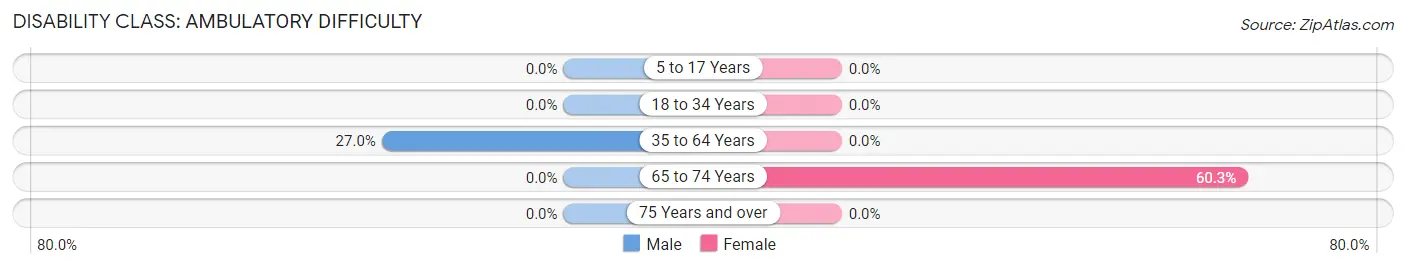
| Age Bracket | Male | Female |
| 5 to 17 Years | 0 (0.0%) | 0 (0.0%) |
| 18 to 34 Years | 0 (0.0%) | 0 (0.0%) |
| 35 to 64 Years | 85 (27.0%) | 0 (0.0%) |
| 65 to 74 Years | 0 (0.0%) | 38 (60.3%) |
| 75 Years and over | 0 (0.0%) | 0 (0.0%) |
Disability Class: Self-Care Difficulty
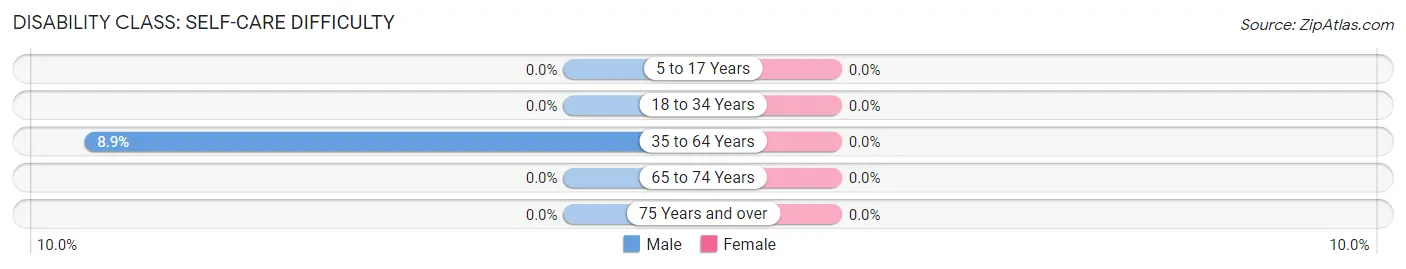
| Age Bracket | Male | Female |
| 5 to 17 Years | 0 (0.0%) | 0 (0.0%) |
| 18 to 34 Years | 0 (0.0%) | 0 (0.0%) |
| 35 to 64 Years | 28 (8.9%) | 0 (0.0%) |
| 65 to 74 Years | 0 (0.0%) | 0 (0.0%) |
| 75 Years and over | 0 (0.0%) | 0 (0.0%) |
Technology Access in Seeley
Computing Device Access in Seeley
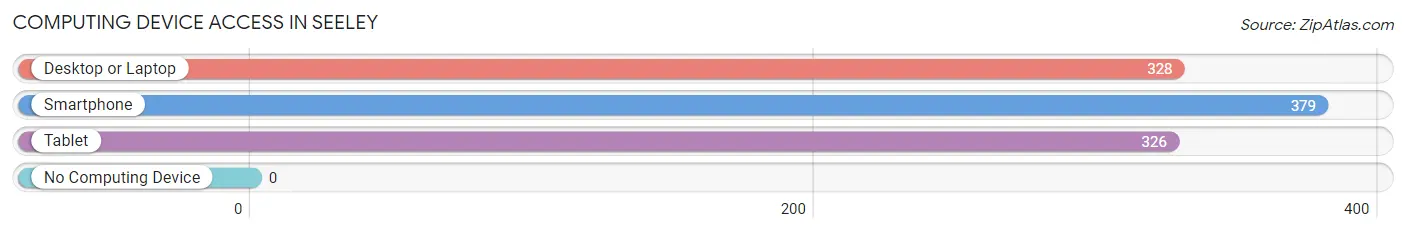
| Device Type | # Households | % Households |
| Desktop or Laptop | 328 | 82.2% |
| Smartphone | 379 | 95.0% |
| Tablet | 326 | 81.7% |
| No Computing Device | 0 | 0.0% |
| Total | 399 | 100.0% |
Internet Access in Seeley
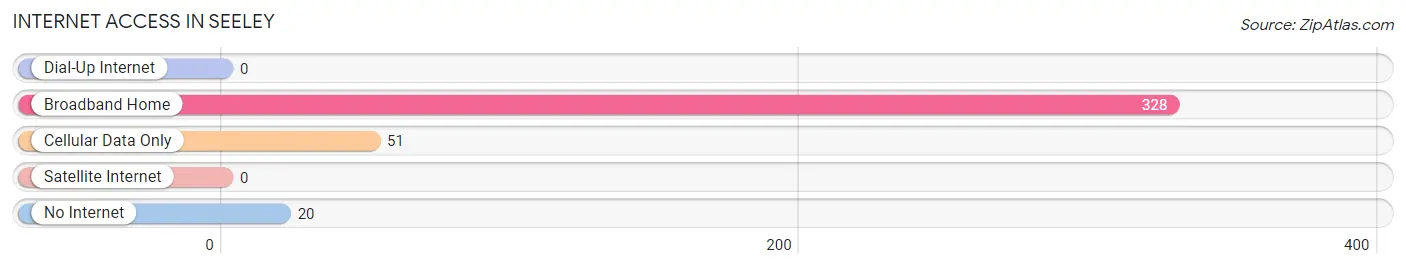
| Internet Type | # Households | % Households |
| Dial-Up Internet | 0 | 0.0% |
| Broadband Home | 328 | 82.2% |
| Cellular Data Only | 51 | 12.8% |
| Satellite Internet | 0 | 0.0% |
| No Internet | 20 | 5.0% |
| Total | 399 | 100.0% |
Seeley Summary
Seeley is a small unincorporated community located in Imperial County, California. It is situated in the southeastern corner of the state, approximately 10 miles east of El Centro and just south of the Mexican border. The population of Seeley was estimated to be 1,845 in 2019.
History
Seeley was founded in the late 19th century by a group of settlers from the Midwest. The town was named after the Seeley family, who were among the first settlers. The Seeleys were farmers and ranchers, and the town was initially a farming and ranching community.
In the early 20th century, Seeley began to grow as a result of the construction of the Southern Pacific Railroad. The railroad provided a convenient way for people to travel to and from Seeley, and it also allowed for the transport of goods and services.
In the 1950s, Seeley experienced a population boom due to the influx of Mexican immigrants. Many of these immigrants were drawn to Seeley due to its proximity to the Mexican border and its relatively low cost of living.
Geography
Seeley is located in the southeastern corner of Imperial County, California. It is situated in the Sonoran Desert, and the terrain is mostly flat and arid. The town is surrounded by agricultural fields, and the nearby Alamo River provides a source of irrigation for the area.
The climate in Seeley is hot and dry, with temperatures ranging from the mid-90s in the summer to the mid-60s in the winter. The area receives very little rainfall, with an average of only 4 inches per year.
Economy
Seeley’s economy is largely based on agriculture. The town is surrounded by agricultural fields, and many of the residents are employed in the farming and ranching industries.
In addition to agriculture, Seeley also has a small manufacturing sector. The town is home to several small factories that produce a variety of goods, including furniture, clothing, and electronics.
Demographics
As of 2019, the population of Seeley was estimated to be 1,845. The town is predominantly Hispanic, with approximately 90% of the population identifying as such. The median household income in Seeley is $30,000, and the median age is 28.
Seeley is a small, close-knit community. The town is home to several churches, and there are a variety of local businesses and restaurants. The town also has a public library and a community center.
Common Questions
What is Per Capita Income in Seeley?
Per Capita income in Seeley is $17,610.
What is the Median Family Income in Seeley?
Median Family Income in Seeley is $52,941.
What is the Median Household income in Seeley?
Median Household Income in Seeley is $55,035.
What is Income or Wage Gap in Seeley?
Income or Wage Gap in Seeley is 18.6%.
Women in Seeley earn 81.4 cents for every dollar earned by a man.
What is Inequality or Gini Index in Seeley?
Inequality or Gini Index in Seeley is 0.43.
What is the Total Population of Seeley?
Total Population of Seeley is 1,756.
What is the Total Male Population of Seeley?
Total Male Population of Seeley is 841.
What is the Total Female Population of Seeley?
Total Female Population of Seeley is 915.
What is the Ratio of Males per 100 Females in Seeley?
There are 91.91 Males per 100 Females in Seeley.
What is the Ratio of Females per 100 Males in Seeley?
There are 108.80 Females per 100 Males in Seeley.
What is the Median Population Age in Seeley?
Median Population Age in Seeley is 29.5 Years.
What is the Average Family Size in Seeley
Average Family Size in Seeley is 4.7 People.
What is the Average Household Size in Seeley
Average Household Size in Seeley is 4.4 People.
How Large is the Labor Force in Seeley?
There are 731 People in the Labor Forcein in Seeley.
What is the Percentage of People in the Labor Force in Seeley?
58.2% of People are in the Labor Force in Seeley.
What is the Unemployment Rate in Seeley?
Unemployment Rate in Seeley is 23.9%.