Tiburon, CA Map & Demographics
Tiburon Map
Tiburon Overview
$124,089
PER CAPITA INCOME
$250,001
AVG FAMILY INCOME
$200,886
AVG HOUSEHOLD INCOME
21.8%
WAGE / INCOME GAP [ % ]
78.2¢/ $1
WAGE / INCOME GAP [ $ ]
0.48
INEQUALITY / GINI INDEX
9,115
TOTAL POPULATION
4,696
MALE POPULATION
4,419
FEMALE POPULATION
106.27
MALES / 100 FEMALES
94.10
FEMALES / 100 MALES
49.3
MEDIAN AGE
3.0
AVG FAMILY SIZE
2.5
AVG HOUSEHOLD SIZE
4,580
LABOR FORCE [ PEOPLE ]
60.4%
PERCENT IN LABOR FORCE
9.5%
UNEMPLOYMENT RATE
Tiburon Area Codes
Income in Tiburon
Income Overview in Tiburon
Per Capita Income in Tiburon is $124,089, while median incomes of families and households are $250,001 and $200,886 respectively.
| Characteristic | Number | Measure |
| Per Capita Income | 9,115 | $124,089 |
| Median Family Income | 2,635 | $250,001 |
| Mean Family Income | 2,635 | $353,381 |
| Median Household Income | 3,558 | $200,886 |
| Mean Household Income | 3,558 | $312,322 |
| Income Deficit | 2,635 | $0 |
| Wage / Income Gap (%) | 9,115 | 21.78% |
| Wage / Income Gap ($) | 9,115 | 78.22¢ per $1 |
| Gini / Inequality Index | 9,115 | 0.48 |
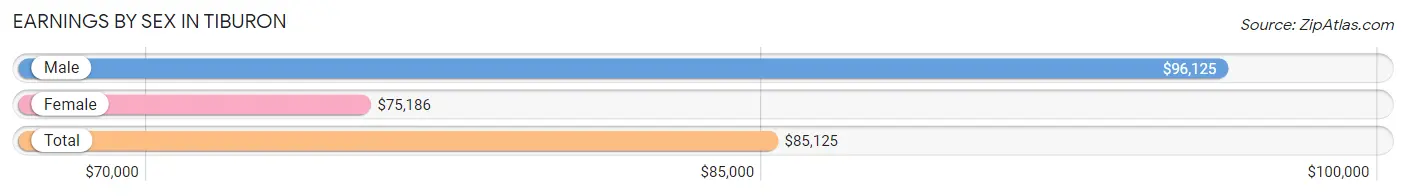
Earnings by Sex in Tiburon
Average Earnings in Tiburon are $85,125, $96,125 for men and $75,186 for women, a difference of 21.8%.
| Sex | Number | Average Earnings |
| Male | 2,781 (57.9%) | $96,125 |
| Female | 2,023 (42.1%) | $75,186 |
| Total | 4,804 (100.0%) | $85,125 |
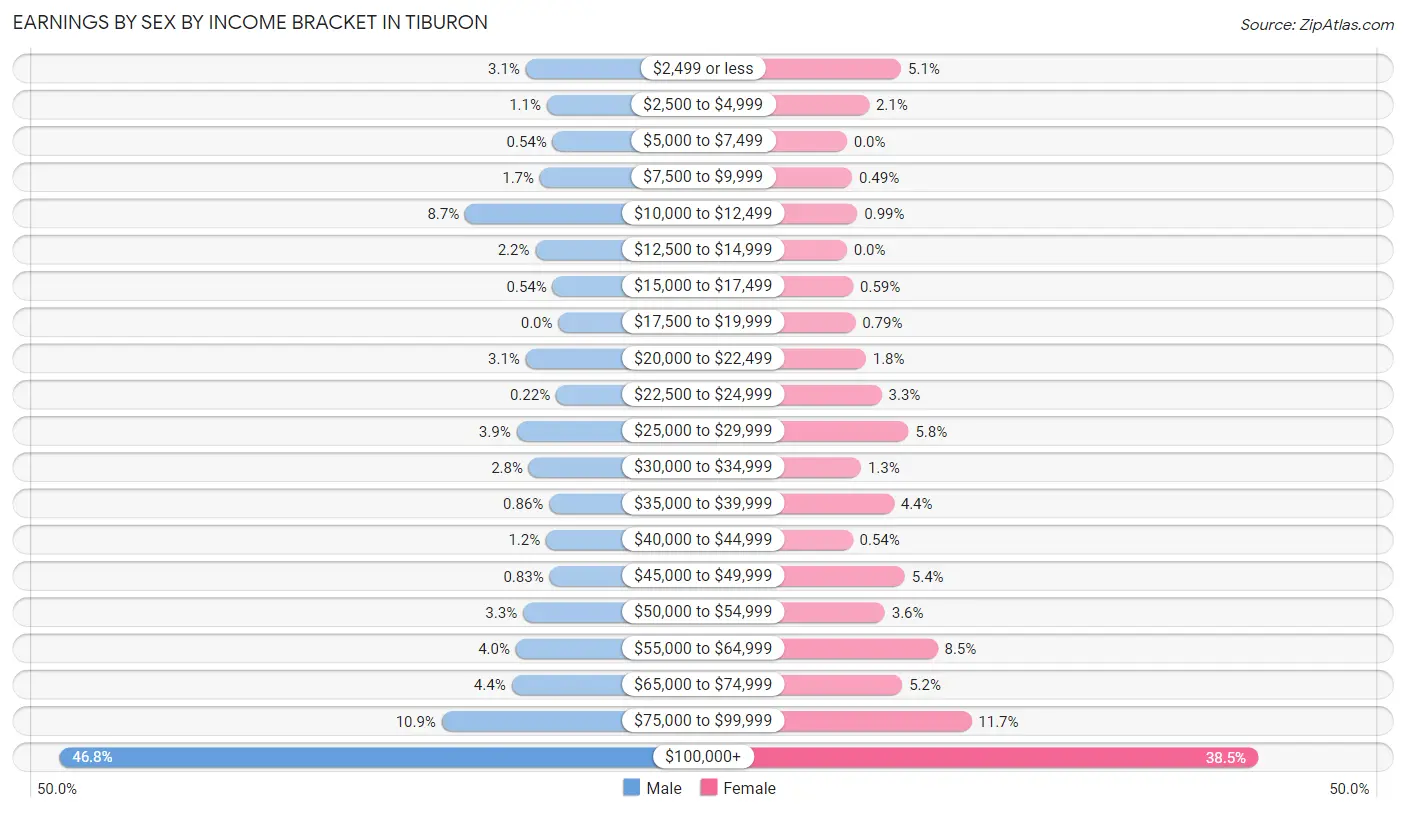
Earnings by Sex by Income Bracket in Tiburon
The most common earnings brackets in Tiburon are $100,000+ for men (1,300 | 46.8%) and $100,000+ for women (779 | 38.5%).
| Income | Male | Female |
| $2,499 or less | 85 (3.1%) | 103 (5.1%) |
| $2,500 to $4,999 | 30 (1.1%) | 42 (2.1%) |
| $5,000 to $7,499 | 15 (0.5%) | 0 (0.0%) |
| $7,500 to $9,999 | 48 (1.7%) | 10 (0.5%) |
| $10,000 to $12,499 | 243 (8.7%) | 20 (1.0%) |
| $12,500 to $14,999 | 60 (2.2%) | 0 (0.0%) |
| $15,000 to $17,499 | 15 (0.5%) | 12 (0.6%) |
| $17,500 to $19,999 | 0 (0.0%) | 16 (0.8%) |
| $20,000 to $22,499 | 85 (3.1%) | 36 (1.8%) |
| $22,500 to $24,999 | 6 (0.2%) | 66 (3.3%) |
| $25,000 to $29,999 | 109 (3.9%) | 117 (5.8%) |
| $30,000 to $34,999 | 77 (2.8%) | 27 (1.3%) |
| $35,000 to $39,999 | 24 (0.9%) | 89 (4.4%) |
| $40,000 to $44,999 | 32 (1.1%) | 11 (0.5%) |
| $45,000 to $49,999 | 23 (0.8%) | 110 (5.4%) |
| $50,000 to $54,999 | 92 (3.3%) | 72 (3.6%) |
| $55,000 to $64,999 | 111 (4.0%) | 172 (8.5%) |
| $65,000 to $74,999 | 122 (4.4%) | 105 (5.2%) |
| $75,000 to $99,999 | 304 (10.9%) | 236 (11.7%) |
| $100,000+ | 1,300 (46.8%) | 779 (38.5%) |
| Total | 2,781 (100.0%) | 2,023 (100.0%) |
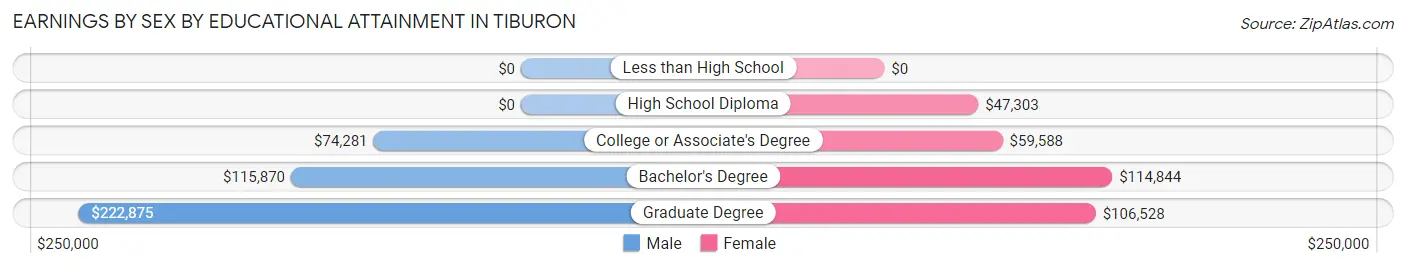
Earnings by Sex by Educational Attainment in Tiburon
Average earnings in Tiburon are $113,125 for men and $85,188 for women, a difference of 24.7%. Men with an educational attainment of graduate degree enjoy the highest average annual earnings of $222,875, while those with college or associate's degree education earn the least with $74,281. Women with an educational attainment of bachelor's degree earn the most with the average annual earnings of $114,844, while those with high school diploma education have the smallest earnings of $47,303.
| Educational Attainment | Male Income | Female Income |
| Less than High School | - | - |
| High School Diploma | - | - |
| College or Associate's Degree | $74,281 | $59,588 |
| Bachelor's Degree | $115,870 | $114,844 |
| Graduate Degree | $222,875 | $106,528 |
| Total | $113,125 | $85,188 |
Family Income in Tiburon
Family Income Brackets in Tiburon
According to the Tiburon family income data, there are 1,547 families falling into the $200,000+ income range, which is the most common income bracket and makes up 58.7% of all families.
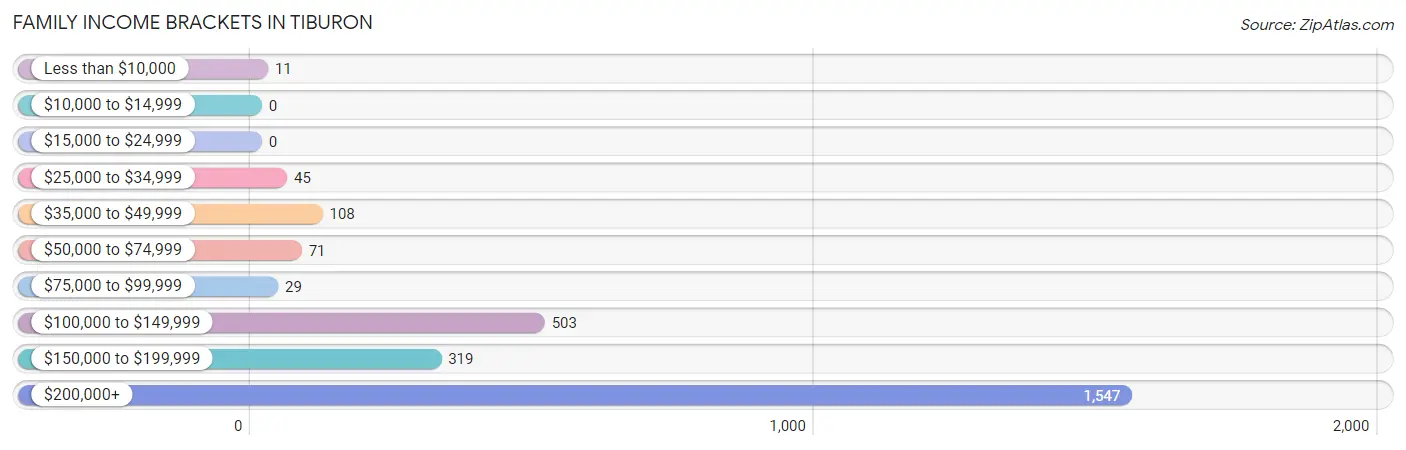
| Income Bracket | # Families | % Families |
| Less than $10,000 | 11 | 0.4% |
| $10,000 to $14,999 | 0 | 0.0% |
| $15,000 to $24,999 | 0 | 0.0% |
| $25,000 to $34,999 | 45 | 1.7% |
| $35,000 to $49,999 | 108 | 4.1% |
| $50,000 to $74,999 | 71 | 2.7% |
| $75,000 to $99,999 | 29 | 1.1% |
| $100,000 to $149,999 | 503 | 19.1% |
| $150,000 to $199,999 | 319 | 12.1% |
| $200,000+ | 1,547 | 58.7% |
Family Income by Famaliy Size in Tiburon
4-person families (509 | 19.3%) account for the highest median family income in Tiburon with $250,001 per family, while 2-person families (1,270 | 48.2%) have the highest median income of $87,768 per family member.
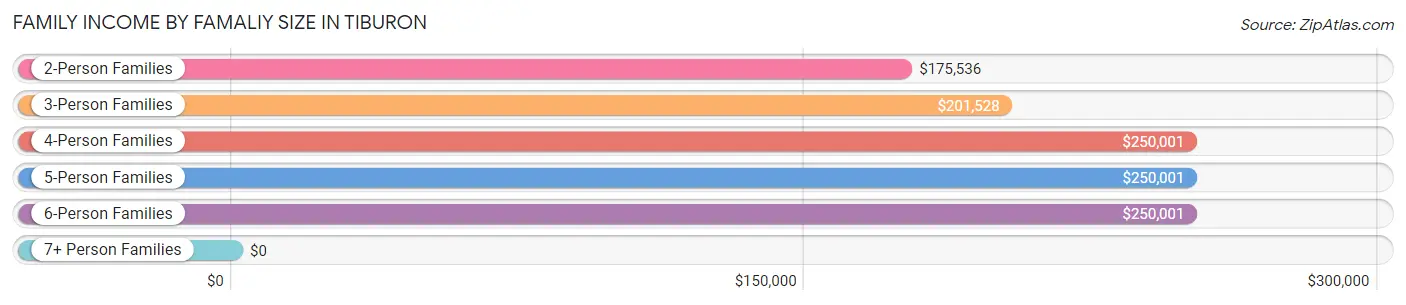
| Income Bracket | # Families | Median Income |
| 2-Person Families | 1,270 (48.2%) | $175,536 |
| 3-Person Families | 580 (22.0%) | $201,528 |
| 4-Person Families | 509 (19.3%) | $250,001 |
| 5-Person Families | 229 (8.7%) | $250,001 |
| 6-Person Families | 47 (1.8%) | $250,001 |
| 7+ Person Families | 0 (0.0%) | $0 |
| Total | 2,635 (100.0%) | $250,001 |
Family Income by Number of Earners in Tiburon
The median family income in Tiburon is $250,001, with families comprising 2 earners (1,051) having the highest median family income of $250,001, while families with no earners (418) have the lowest median family income of $170,053, accounting for 39.9% and 15.9% of families, respectively.
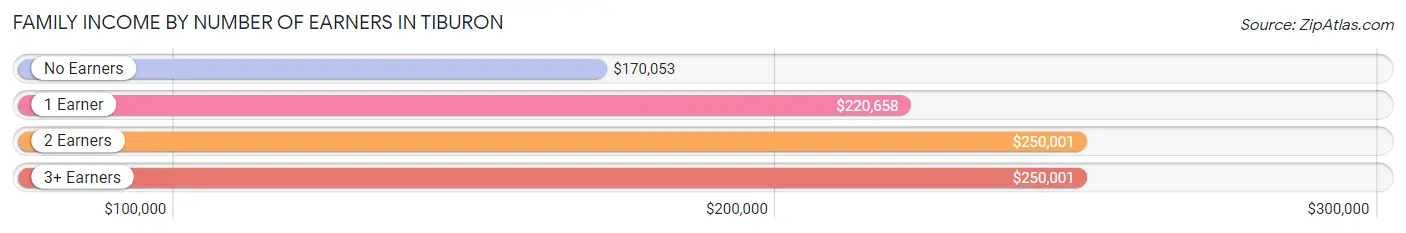
| Number of Earners | # Families | Median Income |
| No Earners | 418 (15.9%) | $170,053 |
| 1 Earner | 924 (35.1%) | $220,658 |
| 2 Earners | 1,051 (39.9%) | $250,001 |
| 3+ Earners | 242 (9.2%) | $250,001 |
| Total | 2,635 (100.0%) | $250,001 |
Household Income in Tiburon
Household Income Brackets in Tiburon
With 1,807 households falling in the category, the $200,000+ income range is the most frequent in Tiburon, accounting for 50.8% of all households. In contrast, only 21 households (0.6%) fall into the $10,000 to $14,999 income bracket, making it the least populous group.
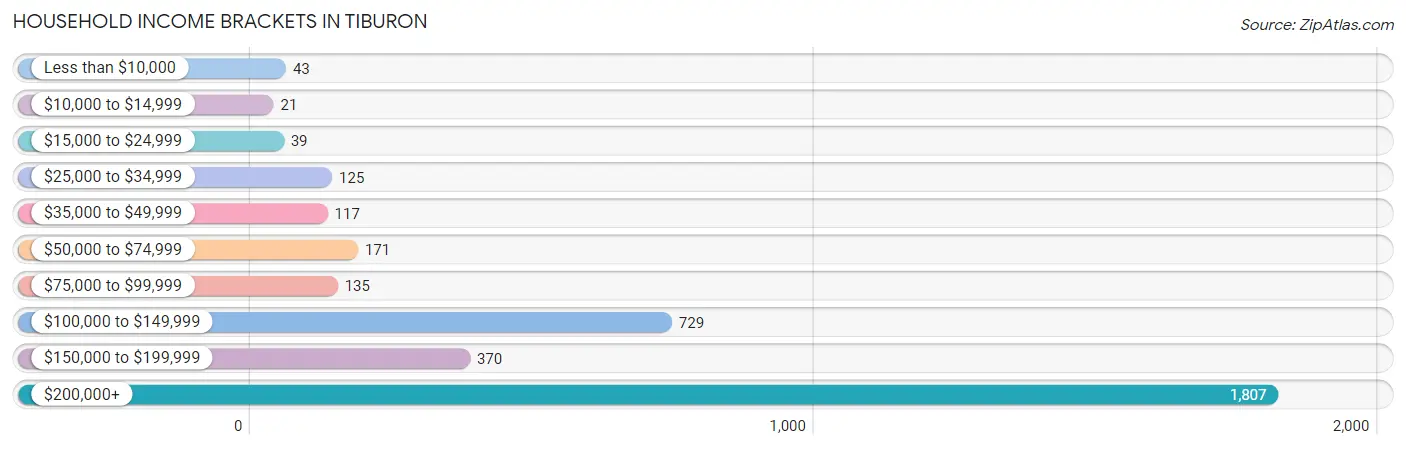
| Income Bracket | # Households | % Households |
| Less than $10,000 | 43 | 1.2% |
| $10,000 to $14,999 | 21 | 0.6% |
| $15,000 to $24,999 | 39 | 1.1% |
| $25,000 to $34,999 | 125 | 3.5% |
| $35,000 to $49,999 | 117 | 3.3% |
| $50,000 to $74,999 | 171 | 4.8% |
| $75,000 to $99,999 | 135 | 3.8% |
| $100,000 to $149,999 | 729 | 20.5% |
| $150,000 to $199,999 | 370 | 10.4% |
| $200,000+ | 1,807 | 50.8% |
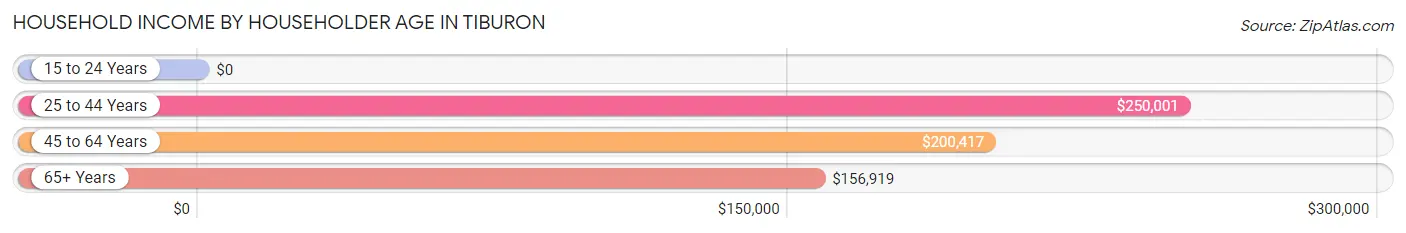
Household Income by Householder Age in Tiburon
The median household income in Tiburon is $200,886, with the highest median household income of $250,001 found in the 25 to 44 years age bracket for the primary householder. A total of 718 households (20.2%) fall into this category.
| Income Bracket | # Households | Median Income |
| 15 to 24 Years | 0 (0.0%) | $0 |
| 25 to 44 Years | 718 (20.2%) | $250,001 |
| 45 to 64 Years | 1,618 (45.5%) | $200,417 |
| 65+ Years | 1,222 (34.4%) | $156,919 |
| Total | 3,558 (100.0%) | $200,886 |
Poverty in Tiburon
Income Below Poverty by Sex and Age in Tiburon
With 1.1% poverty level for males and 1.7% for females among the residents of Tiburon, 16 and 17 year old males and 18 to 24 year old females are the most vulnerable to poverty, with 10 males (9.9%) and 13 females (10.8%) in their respective age groups living below the poverty level.
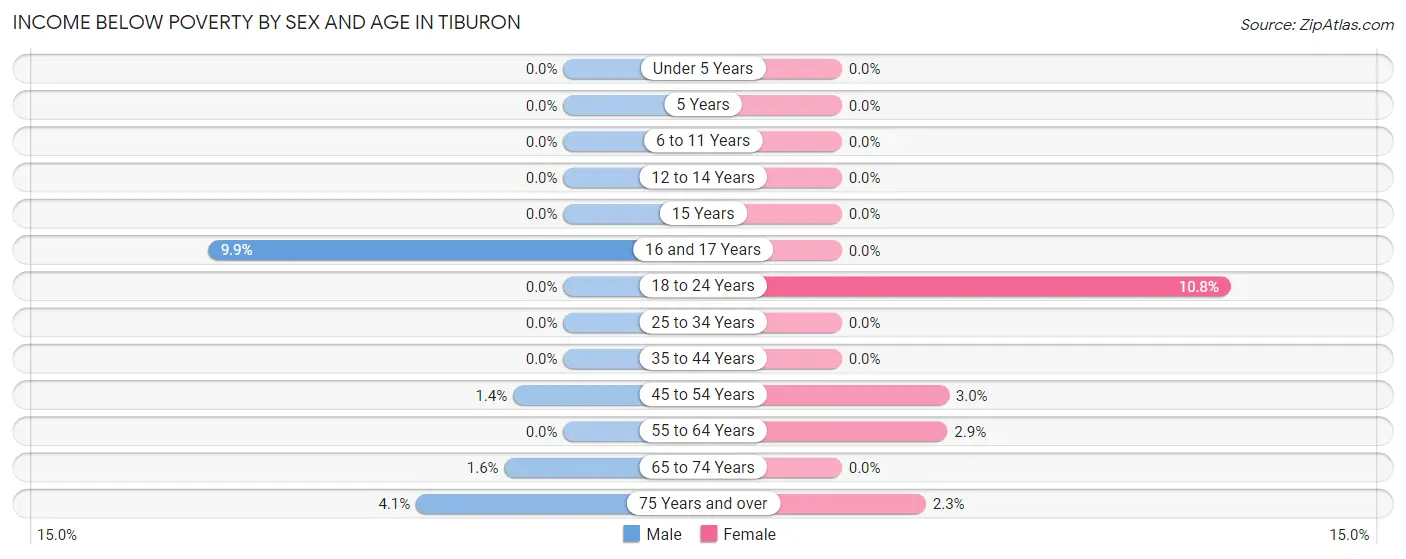
| Age Bracket | Male | Female |
| Under 5 Years | 0 (0.0%) | 0 (0.0%) |
| 5 Years | 0 (0.0%) | 0 (0.0%) |
| 6 to 11 Years | 0 (0.0%) | 0 (0.0%) |
| 12 to 14 Years | 0 (0.0%) | 0 (0.0%) |
| 15 Years | 0 (0.0%) | 0 (0.0%) |
| 16 and 17 Years | 10 (9.9%) | 0 (0.0%) |
| 18 to 24 Years | 0 (0.0%) | 13 (10.8%) |
| 25 to 34 Years | 0 (0.0%) | 0 (0.0%) |
| 35 to 44 Years | 0 (0.0%) | 0 (0.0%) |
| 45 to 54 Years | 11 (1.4%) | 29 (3.0%) |
| 55 to 64 Years | 0 (0.0%) | 20 (2.9%) |
| 65 to 74 Years | 11 (1.6%) | 0 (0.0%) |
| 75 Years and over | 18 (4.1%) | 13 (2.3%) |
| Total | 50 (1.1%) | 75 (1.7%) |
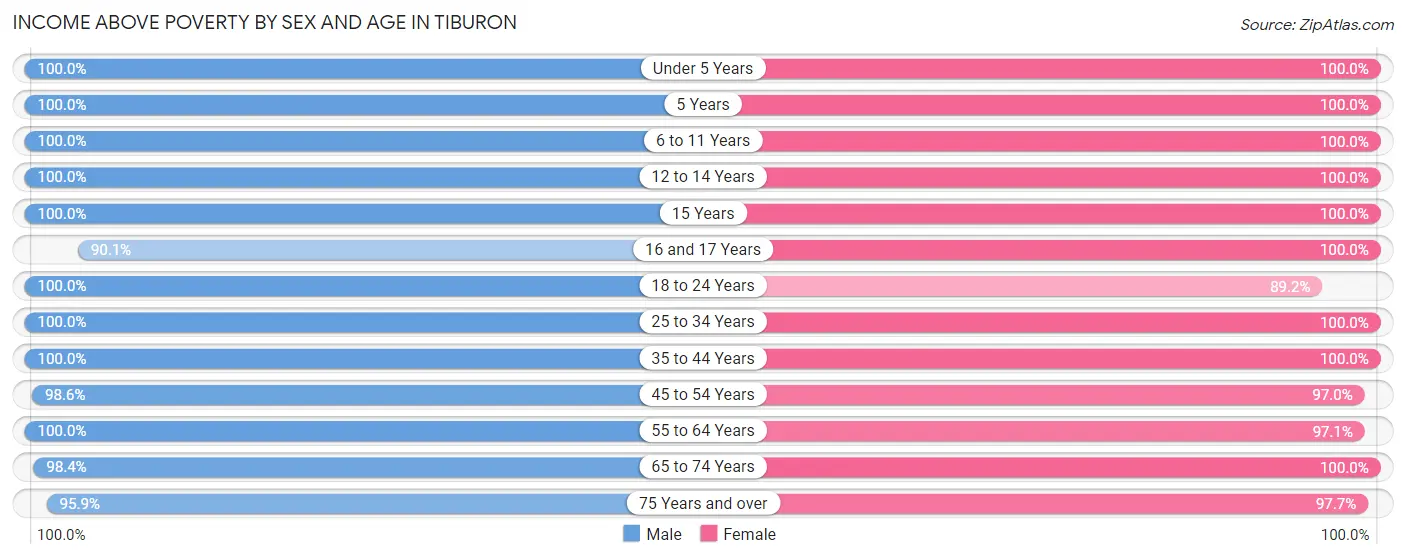
Income Above Poverty by Sex and Age in Tiburon
According to the poverty statistics in Tiburon, males aged under 5 years and females aged under 5 years are the age groups that are most secure financially, with 100.0% of males and 100.0% of females in these age groups living above the poverty line.
| Age Bracket | Male | Female |
| Under 5 Years | 126 (100.0%) | 151 (100.0%) |
| 5 Years | 8 (100.0%) | 56 (100.0%) |
| 6 to 11 Years | 474 (100.0%) | 250 (100.0%) |
| 12 to 14 Years | 132 (100.0%) | 145 (100.0%) |
| 15 Years | 58 (100.0%) | 103 (100.0%) |
| 16 and 17 Years | 91 (90.1%) | 163 (100.0%) |
| 18 to 24 Years | 433 (100.0%) | 107 (89.2%) |
| 25 to 34 Years | 242 (100.0%) | 157 (100.0%) |
| 35 to 44 Years | 520 (100.0%) | 573 (100.0%) |
| 45 to 54 Years | 773 (98.6%) | 944 (97.0%) |
| 55 to 64 Years | 684 (100.0%) | 661 (97.1%) |
| 65 to 74 Years | 659 (98.4%) | 456 (100.0%) |
| 75 Years and over | 421 (95.9%) | 542 (97.7%) |
| Total | 4,621 (98.9%) | 4,308 (98.3%) |
Income Below Poverty Among Married-Couple Families in Tiburon
The poverty statistics for married-couple families in Tiburon show that 0.5% or 11 of the total 2,320 families live below the poverty line. Families with 1 or 2 children have the highest poverty rate of 1.3%, comprising of 11 families. On the other hand, families with no children have the lowest poverty rate of 0.0%, which includes 0 families.
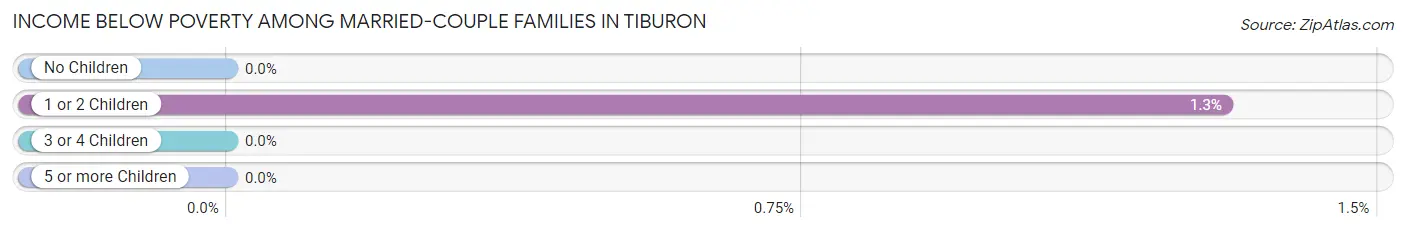
| Children | Above Poverty | Below Poverty |
| No Children | 1,339 (100.0%) | 0 (0.0%) |
| 1 or 2 Children | 834 (98.7%) | 11 (1.3%) |
| 3 or 4 Children | 136 (100.0%) | 0 (0.0%) |
| 5 or more Children | 0 (0.0%) | 0 (0.0%) |
| Total | 2,309 (99.5%) | 11 (0.5%) |
Income Below Poverty Among Single-Parent Households in Tiburon
| Children | Single Father | Single Mother |
| No Children | 0 (0.0%) | 0 (0.0%) |
| 1 or 2 Children | 0 (0.0%) | 0 (0.0%) |
| 3 or 4 Children | 0 (0.0%) | 0 (0.0%) |
| 5 or more Children | 0 (0.0%) | 0 (0.0%) |
| Total | 0 (0.0%) | 0 (0.0%) |
Income Below Poverty Among Married-Couple vs Single-Parent Households in Tiburon
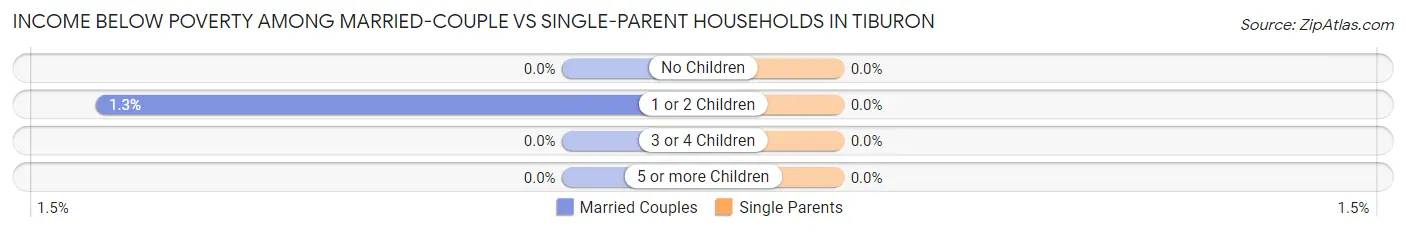
| Children | Married-Couple Families | Single-Parent Households |
| No Children | 0 (0.0%) | 0 (0.0%) |
| 1 or 2 Children | 11 (1.3%) | 0 (0.0%) |
| 3 or 4 Children | 0 (0.0%) | 0 (0.0%) |
| 5 or more Children | 0 (0.0%) | 0 (0.0%) |
| Total | 11 (0.5%) | 0 (0.0%) |
Race in Tiburon
The most populous races in Tiburon are White / Caucasian (7,326 | 80.4%), Asian (883 | 9.7%), and Two or more Races (712 | 7.8%).
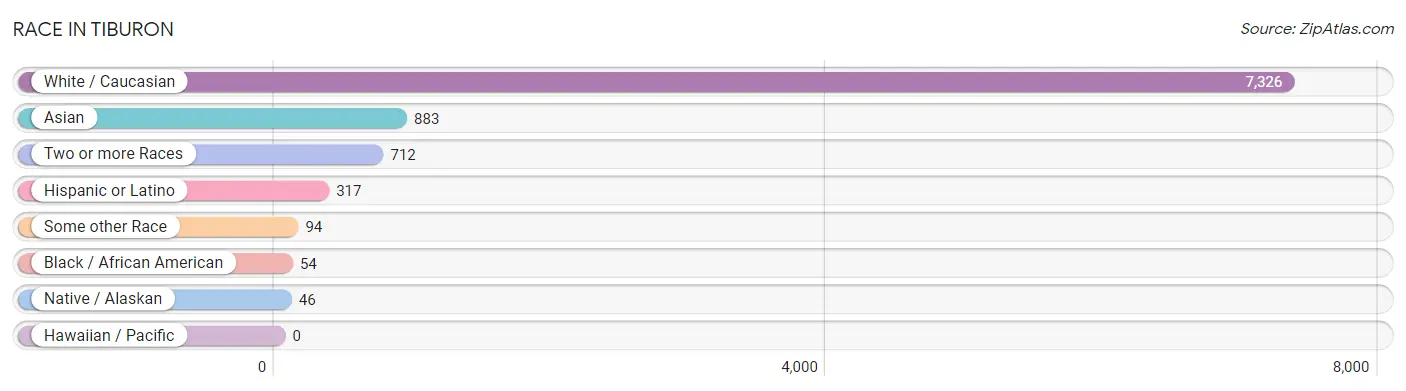
| Race | # Population | % Population |
| Asian | 883 | 9.7% |
| Black / African American | 54 | 0.6% |
| Hawaiian / Pacific | 0 | 0.0% |
| Hispanic or Latino | 317 | 3.5% |
| Native / Alaskan | 46 | 0.5% |
| White / Caucasian | 7,326 | 80.4% |
| Two or more Races | 712 | 7.8% |
| Some other Race | 94 | 1.0% |
| Total | 9,115 | 100.0% |
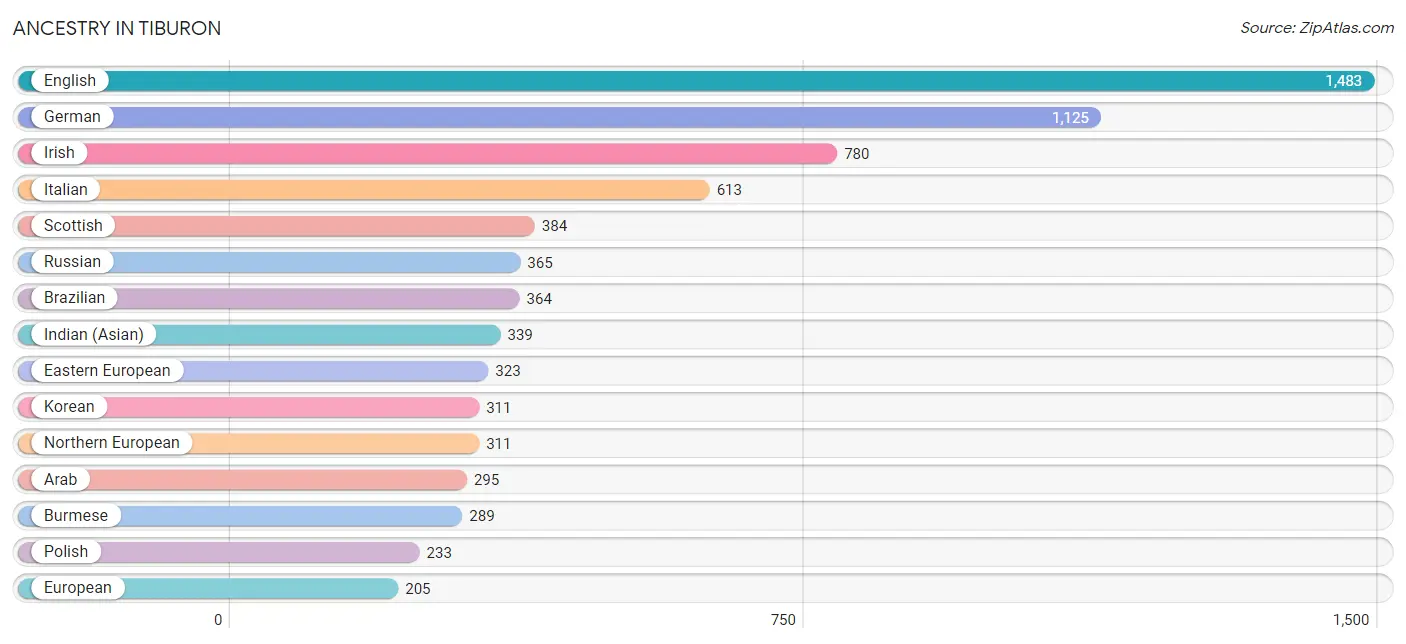
Ancestry in Tiburon
The most populous ancestries reported in Tiburon are English (1,483 | 16.3%), German (1,125 | 12.3%), Irish (780 | 8.6%), Italian (613 | 6.7%), and Scottish (384 | 4.2%), together accounting for 48.1% of all Tiburon residents.
| Ancestry | # Population | % Population |
| American | 179 | 2.0% |
| Arab | 295 | 3.2% |
| Argentinean | 35 | 0.4% |
| Armenian | 31 | 0.3% |
| Austrian | 51 | 0.6% |
| Bhutanese | 190 | 2.1% |
| Brazilian | 364 | 4.0% |
| British | 154 | 1.7% |
| Bulgarian | 138 | 1.5% |
| Burmese | 289 | 3.2% |
| Canadian | 22 | 0.2% |
| Celtic | 14 | 0.2% |
| Central American | 148 | 1.6% |
| Central American Indian | 3 | 0.0% |
| Choctaw | 11 | 0.1% |
| Croatian | 16 | 0.2% |
| Czech | 15 | 0.2% |
| Danish | 101 | 1.1% |
| Delaware | 36 | 0.4% |
| Dutch | 106 | 1.2% |
| Eastern European | 323 | 3.5% |
| Ecuadorian | 15 | 0.2% |
| English | 1,483 | 16.3% |
| European | 205 | 2.2% |
| Finnish | 55 | 0.6% |
| French | 182 | 2.0% |
| French Canadian | 8 | 0.1% |
| German | 1,125 | 12.3% |
| Greek | 55 | 0.6% |
| Guatemalan | 90 | 1.0% |
| Hungarian | 48 | 0.5% |
| Indian (Asian) | 339 | 3.7% |
| Iranian | 142 | 1.6% |
| Irish | 780 | 8.6% |
| Italian | 613 | 6.7% |
| Japanese | 9 | 0.1% |
| Korean | 311 | 3.4% |
| Lebanese | 10 | 0.1% |
| Lithuanian | 25 | 0.3% |
| Mexican | 32 | 0.4% |
| Mexican American Indian | 7 | 0.1% |
| Native Hawaiian | 27 | 0.3% |
| New Zealander | 14 | 0.2% |
| Nicaraguan | 13 | 0.1% |
| Northern European | 311 | 3.4% |
| Norwegian | 193 | 2.1% |
| Palestinian | 105 | 1.1% |
| Peruvian | 18 | 0.2% |
| Polish | 233 | 2.6% |
| Portuguese | 61 | 0.7% |
| Romanian | 43 | 0.5% |
| Russian | 365 | 4.0% |
| Salvadoran | 45 | 0.5% |
| Scandinavian | 66 | 0.7% |
| Scotch-Irish | 44 | 0.5% |
| Scottish | 384 | 4.2% |
| Serbian | 14 | 0.2% |
| Slovak | 14 | 0.2% |
| South African | 86 | 0.9% |
| South American | 68 | 0.7% |
| Spaniard | 69 | 0.8% |
| Subsaharan African | 86 | 0.9% |
| Swedish | 152 | 1.7% |
| Swiss | 77 | 0.8% |
| Syrian | 23 | 0.3% |
| Thai | 49 | 0.5% |
| Turkish | 119 | 1.3% |
| Ukrainian | 46 | 0.5% |
| Welsh | 113 | 1.2% | View All 69 Rows |
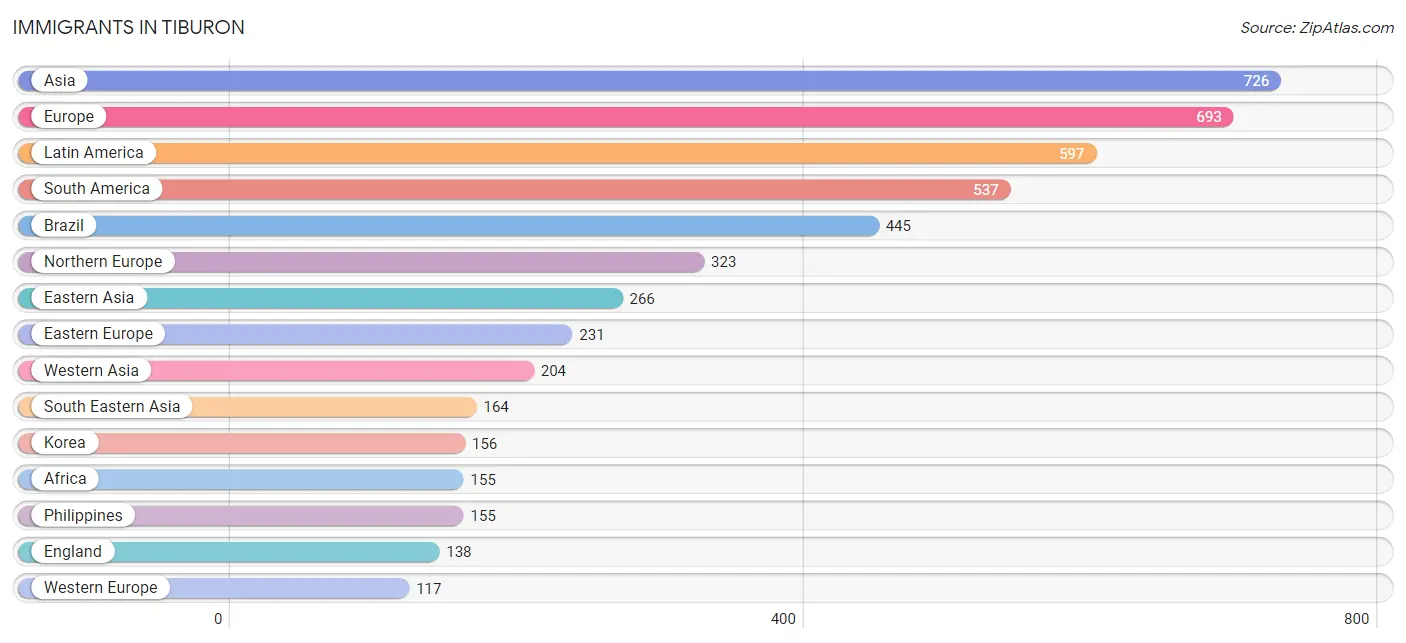
Immigrants in Tiburon
The most numerous immigrant groups reported in Tiburon came from Asia (726 | 8.0%), Europe (693 | 7.6%), Latin America (597 | 6.6%), South America (537 | 5.9%), and Brazil (445 | 4.9%), together accounting for 32.9% of all Tiburon residents.
| Immigration Origin | # Population | % Population |
| Africa | 155 | 1.7% |
| Argentina | 35 | 0.4% |
| Asia | 726 | 8.0% |
| Australia | 20 | 0.2% |
| Austria | 13 | 0.1% |
| Brazil | 445 | 4.9% |
| Bulgaria | 86 | 0.9% |
| Cambodia | 9 | 0.1% |
| Canada | 97 | 1.1% |
| Central America | 60 | 0.7% |
| China | 110 | 1.2% |
| Czechoslovakia | 15 | 0.2% |
| Eastern Africa | 49 | 0.5% |
| Eastern Asia | 266 | 2.9% |
| Eastern Europe | 231 | 2.5% |
| Ecuador | 15 | 0.2% |
| El Salvador | 3 | 0.0% |
| England | 138 | 1.5% |
| Europe | 693 | 7.6% |
| Fiji | 29 | 0.3% |
| Germany | 75 | 0.8% |
| Guatemala | 17 | 0.2% |
| Hong Kong | 44 | 0.5% |
| Iran | 74 | 0.8% |
| Israel | 35 | 0.4% |
| Jordan | 53 | 0.6% |
| Kenya | 49 | 0.5% |
| Korea | 156 | 1.7% |
| Latin America | 597 | 6.6% |
| Mexico | 7 | 0.1% |
| Nicaragua | 13 | 0.1% |
| Northern Europe | 323 | 3.5% |
| Norway | 6 | 0.1% |
| Oceania | 76 | 0.8% |
| Panama | 20 | 0.2% |
| Peru | 18 | 0.2% |
| Philippines | 155 | 1.7% |
| Romania | 18 | 0.2% |
| Russia | 57 | 0.6% |
| Scotland | 20 | 0.2% |
| South Africa | 106 | 1.2% |
| South America | 537 | 5.9% |
| South Central Asia | 92 | 1.0% |
| South Eastern Asia | 164 | 1.8% |
| Southern Europe | 22 | 0.2% |
| Spain | 22 | 0.2% |
| Sri Lanka | 18 | 0.2% |
| Switzerland | 29 | 0.3% |
| Syria | 23 | 0.3% |
| Turkey | 93 | 1.0% |
| Ukraine | 40 | 0.4% |
| Venezuela | 24 | 0.3% |
| Western Asia | 204 | 2.2% |
| Western Europe | 117 | 1.3% | View All 54 Rows |
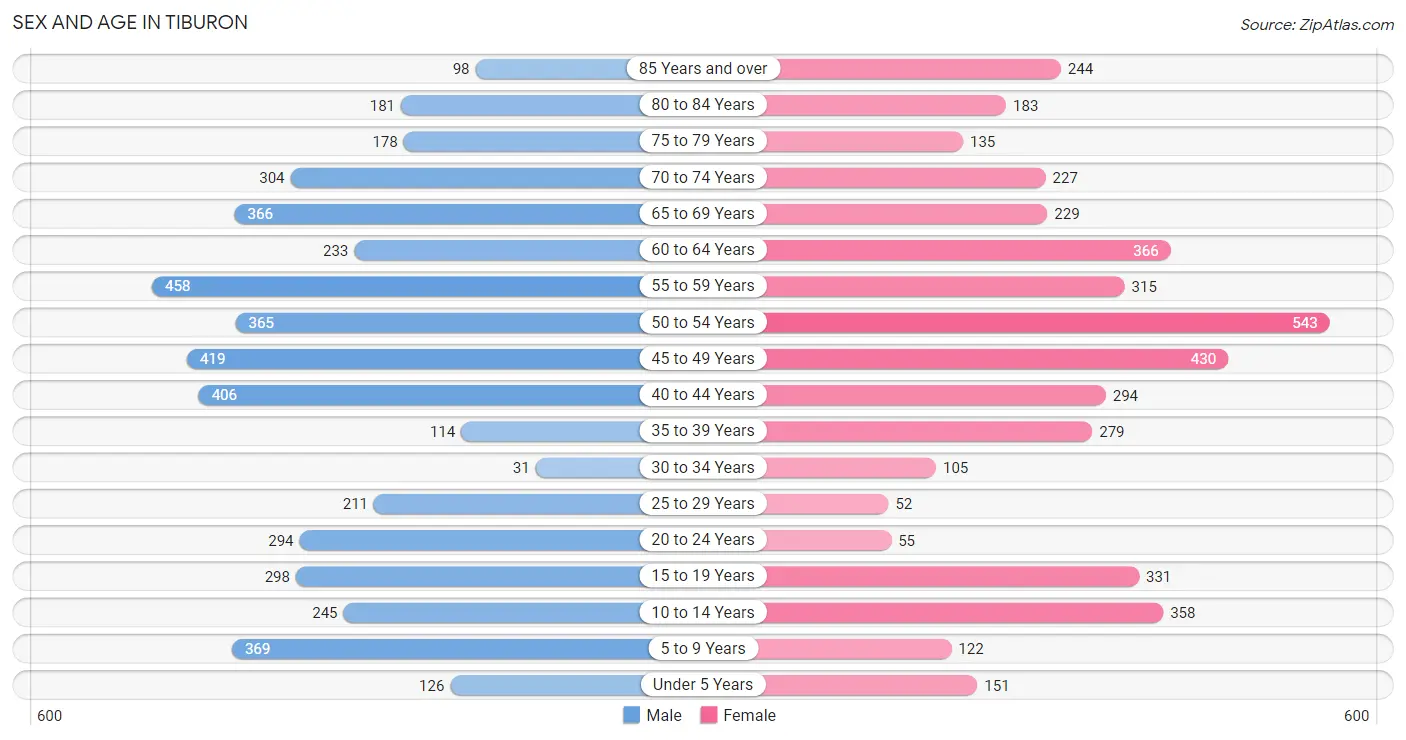
Sex and Age in Tiburon
Sex and Age in Tiburon
The most populous age groups in Tiburon are 55 to 59 Years (458 | 9.8%) for men and 50 to 54 Years (543 | 12.3%) for women.
| Age Bracket | Male | Female |
| Under 5 Years | 126 (2.7%) | 151 (3.4%) |
| 5 to 9 Years | 369 (7.9%) | 122 (2.8%) |
| 10 to 14 Years | 245 (5.2%) | 358 (8.1%) |
| 15 to 19 Years | 298 (6.4%) | 331 (7.5%) |
| 20 to 24 Years | 294 (6.3%) | 55 (1.2%) |
| 25 to 29 Years | 211 (4.5%) | 52 (1.2%) |
| 30 to 34 Years | 31 (0.7%) | 105 (2.4%) |
| 35 to 39 Years | 114 (2.4%) | 279 (6.3%) |
| 40 to 44 Years | 406 (8.6%) | 294 (6.7%) |
| 45 to 49 Years | 419 (8.9%) | 430 (9.7%) |
| 50 to 54 Years | 365 (7.8%) | 543 (12.3%) |
| 55 to 59 Years | 458 (9.8%) | 315 (7.1%) |
| 60 to 64 Years | 233 (5.0%) | 366 (8.3%) |
| 65 to 69 Years | 366 (7.8%) | 229 (5.2%) |
| 70 to 74 Years | 304 (6.5%) | 227 (5.1%) |
| 75 to 79 Years | 178 (3.8%) | 135 (3.0%) |
| 80 to 84 Years | 181 (3.8%) | 183 (4.1%) |
| 85 Years and over | 98 (2.1%) | 244 (5.5%) |
| Total | 4,696 (100.0%) | 4,419 (100.0%) |
Families and Households in Tiburon
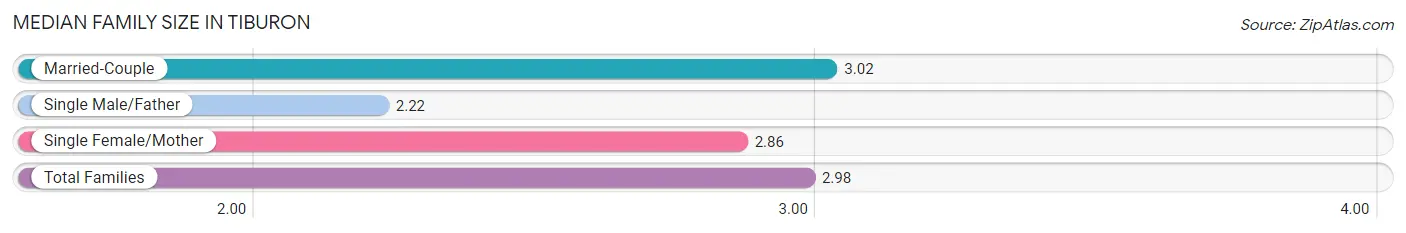
Median Family Size in Tiburon
The median family size in Tiburon is 2.98 persons per family, with married-couple families (2,320 | 88.0%) accounting for the largest median family size of 3.02 persons per family. On the other hand, single male/father families (95 | 3.6%) represent the smallest median family size with 2.22 persons per family.
| Family Type | # Families | Family Size |
| Married-Couple | 2,320 (88.0%) | 3.02 |
| Single Male/Father | 95 (3.6%) | 2.22 |
| Single Female/Mother | 220 (8.4%) | 2.86 |
| Total Families | 2,635 (100.0%) | 2.98 |
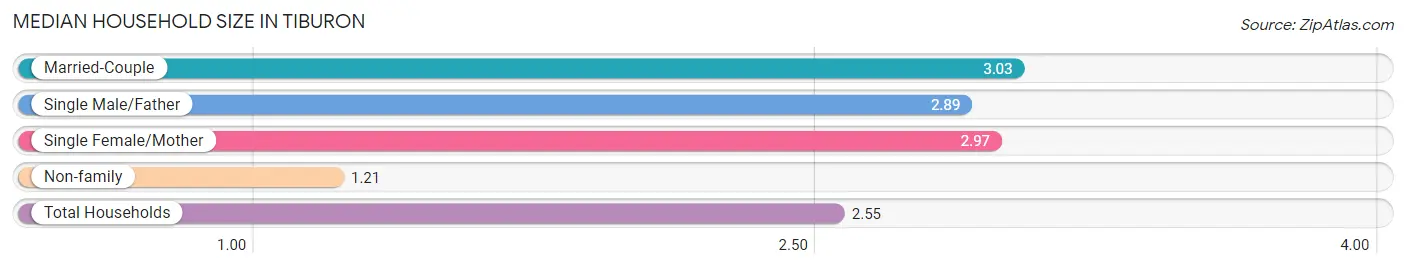
Median Household Size in Tiburon
The median household size in Tiburon is 2.55 persons per household, with married-couple households (2,320 | 65.2%) accounting for the largest median household size of 3.03 persons per household. non-family households (923 | 25.9%) represent the smallest median household size with 1.21 persons per household.
| Household Type | # Households | Household Size |
| Married-Couple | 2,320 (65.2%) | 3.03 |
| Single Male/Father | 95 (2.7%) | 2.89 |
| Single Female/Mother | 220 (6.2%) | 2.97 |
| Non-family | 923 (25.9%) | 1.21 |
| Total Households | 3,558 (100.0%) | 2.55 |
Household Size by Marriage Status in Tiburon
Out of a total of 3,558 households in Tiburon, 2,635 (74.1%) are family households, while 923 (25.9%) are nonfamily households. The most numerous type of family households are 2-person households, comprising 1,200, and the most common type of nonfamily households are 1-person households, comprising 808.
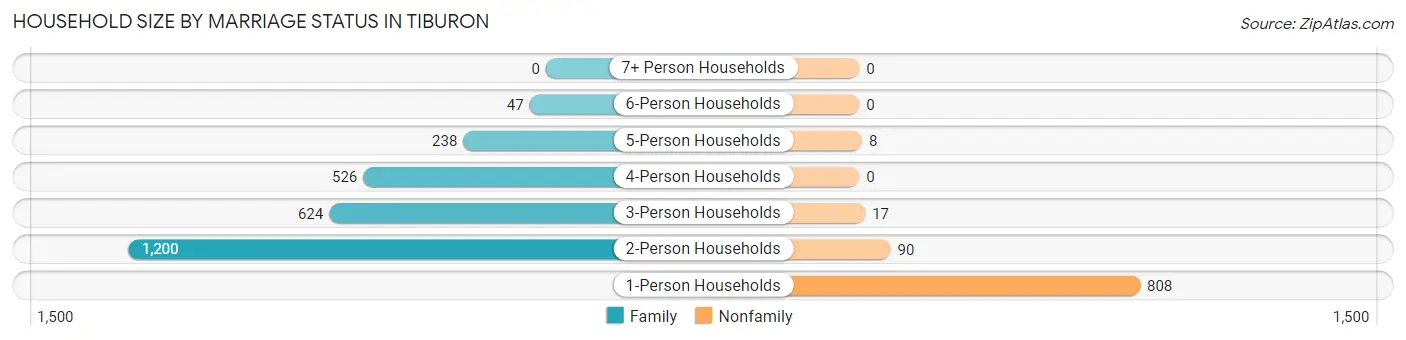
| Household Size | Family Households | Nonfamily Households |
| 1-Person Households | - | 808 (22.7%) |
| 2-Person Households | 1,200 (33.7%) | 90 (2.5%) |
| 3-Person Households | 624 (17.5%) | 17 (0.5%) |
| 4-Person Households | 526 (14.8%) | 0 (0.0%) |
| 5-Person Households | 238 (6.7%) | 8 (0.2%) |
| 6-Person Households | 47 (1.3%) | 0 (0.0%) |
| 7+ Person Households | 0 (0.0%) | 0 (0.0%) |
| Total | 2,635 (74.1%) | 923 (25.9%) |
Female Fertility in Tiburon
Fertility by Age in Tiburon
Average fertility rate in Tiburon is 44.0 births per 1,000 women. Women in the age bracket of 35 to 50 years have the highest fertility rate with 57.0 births per 1,000 women. Women in the age bracket of 35 to 50 years acount for 85.9% of all women with births.
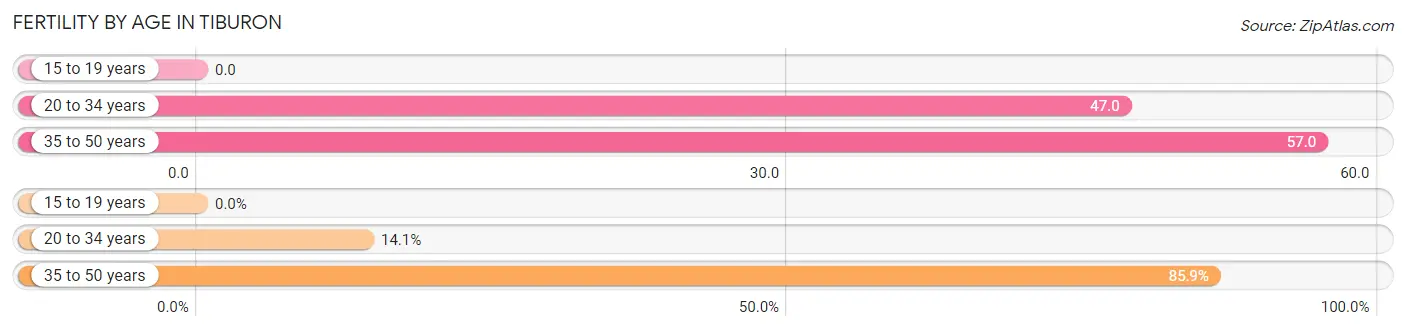
| Age Bracket | Women with Births | Births / 1,000 Women |
| 15 to 19 years | 0 (0.0%) | 0.0 |
| 20 to 34 years | 10 (14.1%) | 47.0 |
| 35 to 50 years | 61 (85.9%) | 57.0 |
| Total | 71 (100.0%) | 44.0 |
Fertility by Age by Marriage Status in Tiburon
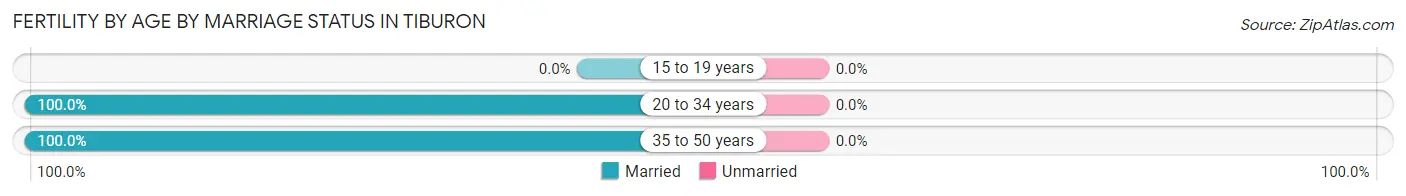
| Age Bracket | Married | Unmarried |
| 15 to 19 years | 0 (0.0%) | 0 (0.0%) |
| 20 to 34 years | 10 (100.0%) | 0 (0.0%) |
| 35 to 50 years | 61 (100.0%) | 0 (0.0%) |
| Total | 71 (100.0%) | 0 (0.0%) |
Fertility by Education in Tiburon
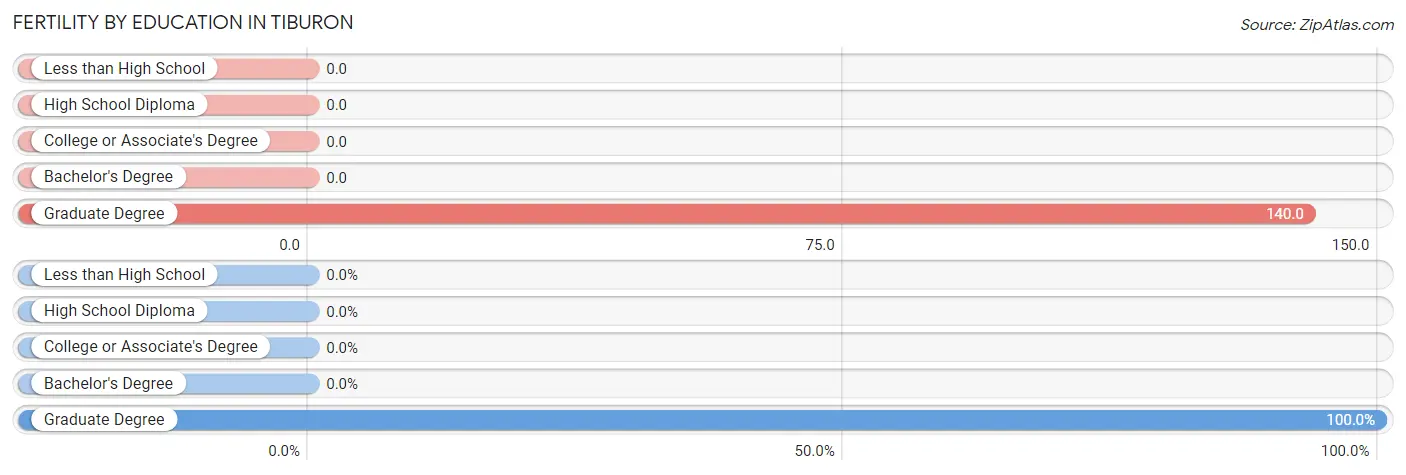
| Educational Attainment | Women with Births | Births / 1,000 Women |
| Less than High School | 0 (0.0%) | 0.0 |
| High School Diploma | 0 (0.0%) | 0.0 |
| College or Associate's Degree | 0 (0.0%) | 0.0 |
| Bachelor's Degree | 0 (0.0%) | 0.0 |
| Graduate Degree | 71 (100.0%) | 140.0 |
| Total | 71 (100.0%) | 44.0 |
Fertility by Education by Marriage Status in Tiburon
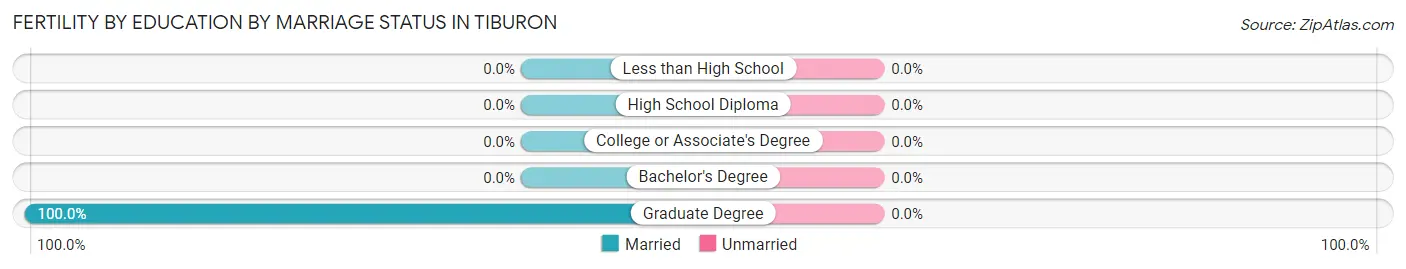
| Educational Attainment | Married | Unmarried |
| Less than High School | 0 (0.0%) | 0 (0.0%) |
| High School Diploma | 0 (0.0%) | 0 (0.0%) |
| College or Associate's Degree | 0 (0.0%) | 0 (0.0%) |
| Bachelor's Degree | 0 (0.0%) | 0 (0.0%) |
| Graduate Degree | 71 (100.0%) | 0 (0.0%) |
| Total | 71 (100.0%) | 0 (0.0%) |
Employment Characteristics in Tiburon
Employment by Class of Employer in Tiburon
Among the 4,129 employed individuals in Tiburon, private company employees (2,399 | 58.1%), self-employed (not incorporated) (820 | 19.9%), and self-employed (incorporated) (402 | 9.7%) make up the most common classes of employment.
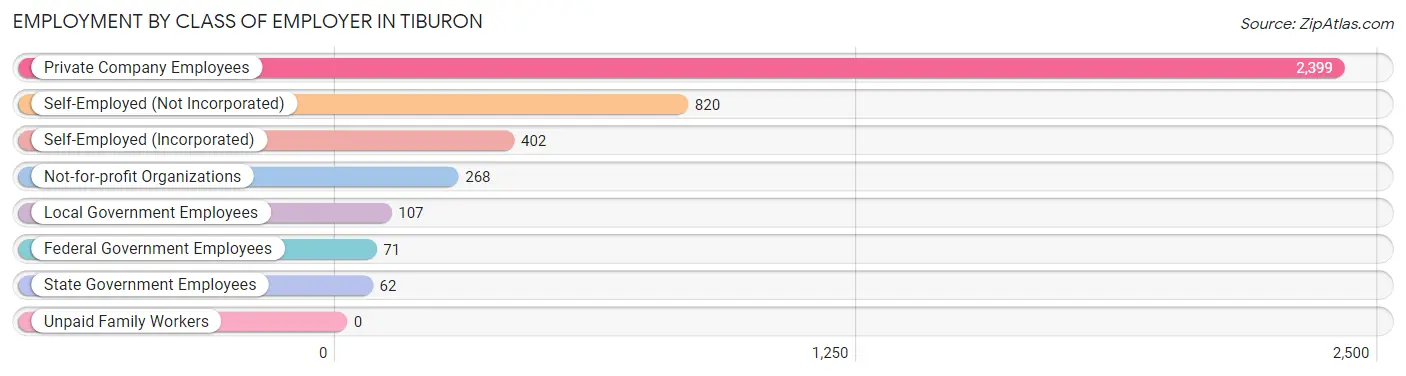
| Employer Class | # Employees | % Employees |
| Private Company Employees | 2,399 | 58.1% |
| Self-Employed (Incorporated) | 402 | 9.7% |
| Self-Employed (Not Incorporated) | 820 | 19.9% |
| Not-for-profit Organizations | 268 | 6.5% |
| Local Government Employees | 107 | 2.6% |
| State Government Employees | 62 | 1.5% |
| Federal Government Employees | 71 | 1.7% |
| Unpaid Family Workers | 0 | 0.0% |
| Total | 4,129 | 100.0% |
Employment Status by Age in Tiburon
According to the labor force statistics for Tiburon, out of the total population over 16 years of age (7,583), 60.4% or 4,580 individuals are in the labor force, with 9.5% or 435 of them unemployed. The age group with the highest labor force participation rate is 30 to 34 years, with 100.0% or 136 individuals in the labor force. Within the labor force, the 20 to 24 years age range has the highest percentage of unemployed individuals, with 75.3% or 168 of them being unemployed.
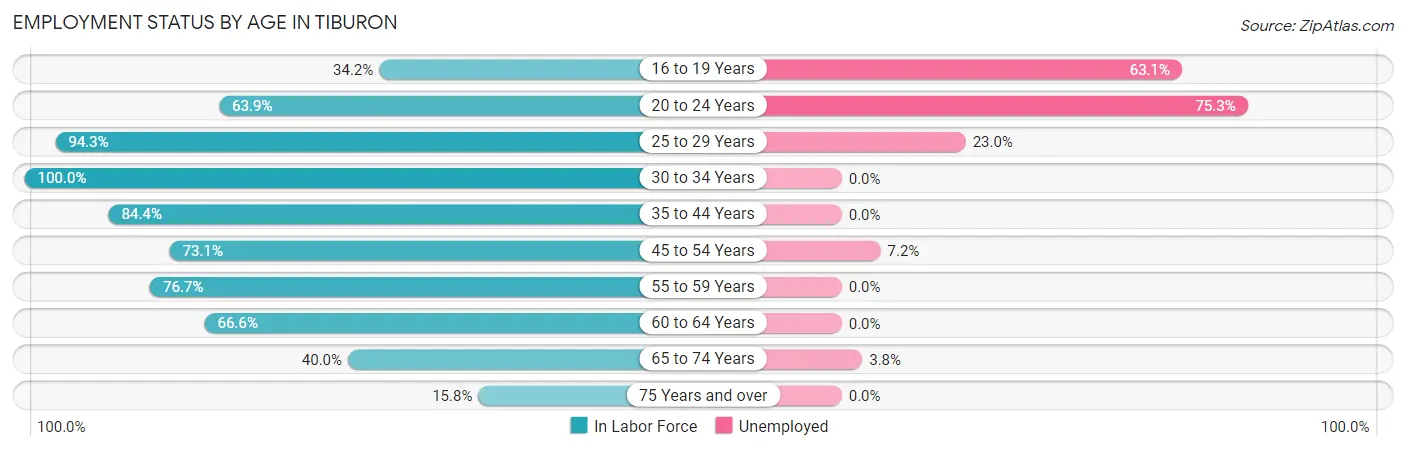
| Age Bracket | In Labor Force | Unemployed |
| 16 to 19 Years | 160 (34.2%) | 101 (63.1%) |
| 20 to 24 Years | 223 (63.9%) | 168 (75.3%) |
| 25 to 29 Years | 248 (94.3%) | 57 (23.0%) |
| 30 to 34 Years | 136 (100.0%) | 0 (0.0%) |
| 35 to 44 Years | 922 (84.4%) | 0 (0.0%) |
| 45 to 54 Years | 1,284 (73.1%) | 92 (7.2%) |
| 55 to 59 Years | 593 (76.7%) | 0 (0.0%) |
| 60 to 64 Years | 399 (66.6%) | 0 (0.0%) |
| 65 to 74 Years | 450 (40.0%) | 17 (3.8%) |
| 75 Years and over | 161 (15.8%) | 0 (0.0%) |
| Total | 4,580 (60.4%) | 435 (9.5%) |
Employment Status by Educational Attainment in Tiburon
According to labor force statistics for Tiburon, 77.6% of individuals (3,586) out of the total population between 25 and 64 years of age (4,621) are in the labor force, with 4.2% or 151 of them being unemployed. The group with the highest labor force participation rate are those with the educational attainment of college / associate degree, with 89.2% or 717 individuals in the labor force. Within the labor force, individuals with high school diploma education have the highest percentage of unemployment, with 4.8% or 3 of them being unemployed.
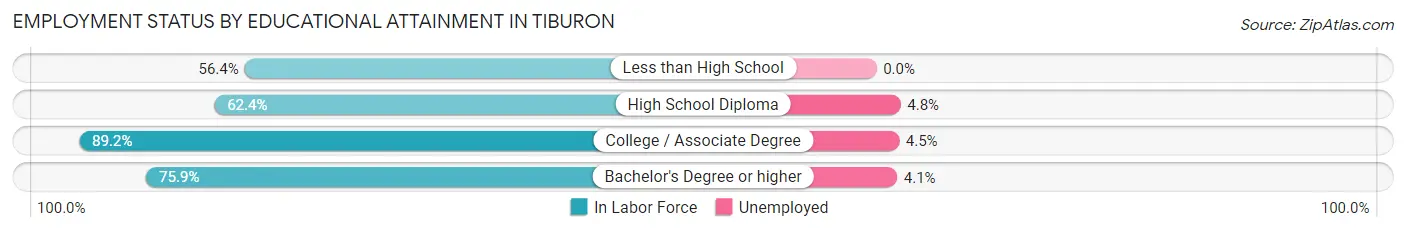
| Educational Attainment | In Labor Force | Unemployed |
| Less than High School | 44 (56.4%) | 0 (0.0%) |
| High School Diploma | 63 (62.4%) | 5 (4.8%) |
| College / Associate Degree | 717 (89.2%) | 36 (4.5%) |
| Bachelor's Degree or higher | 2,761 (75.9%) | 149 (4.1%) |
| Total | 3,586 (77.6%) | 194 (4.2%) |
Employment Occupations by Sex in Tiburon
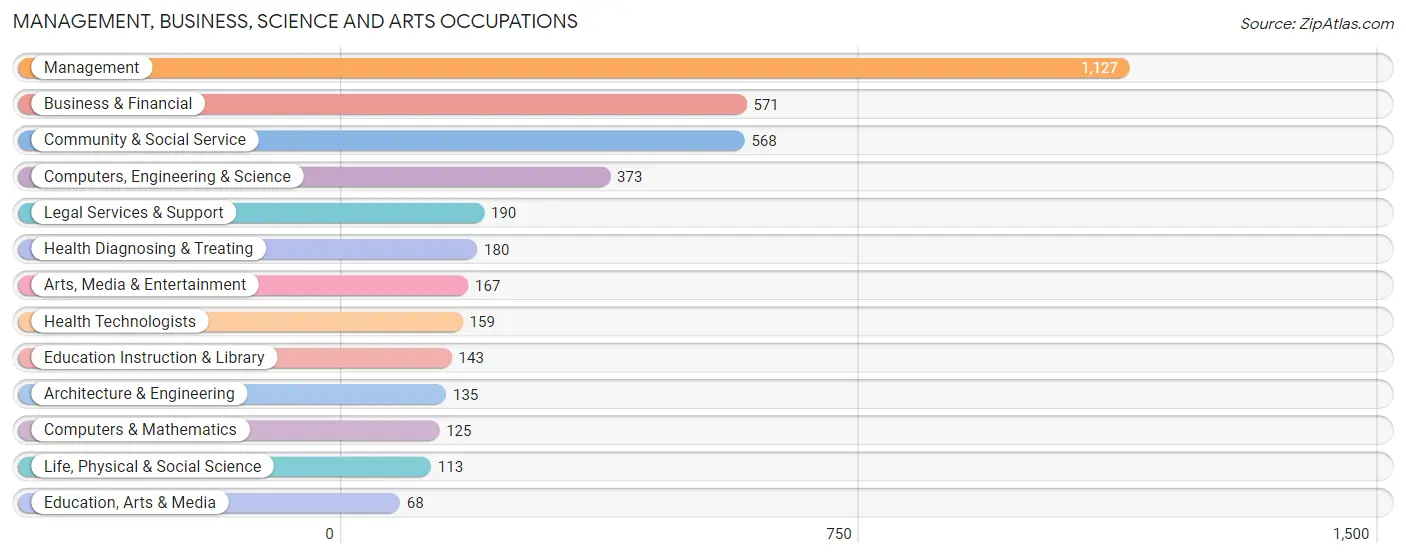
Management, Business, Science and Arts Occupations
The most common Management, Business, Science and Arts occupations in Tiburon are Management (1,127 | 27.2%), Business & Financial (571 | 13.8%), Community & Social Service (568 | 13.7%), Computers, Engineering & Science (373 | 9.0%), and Legal Services & Support (190 | 4.6%).
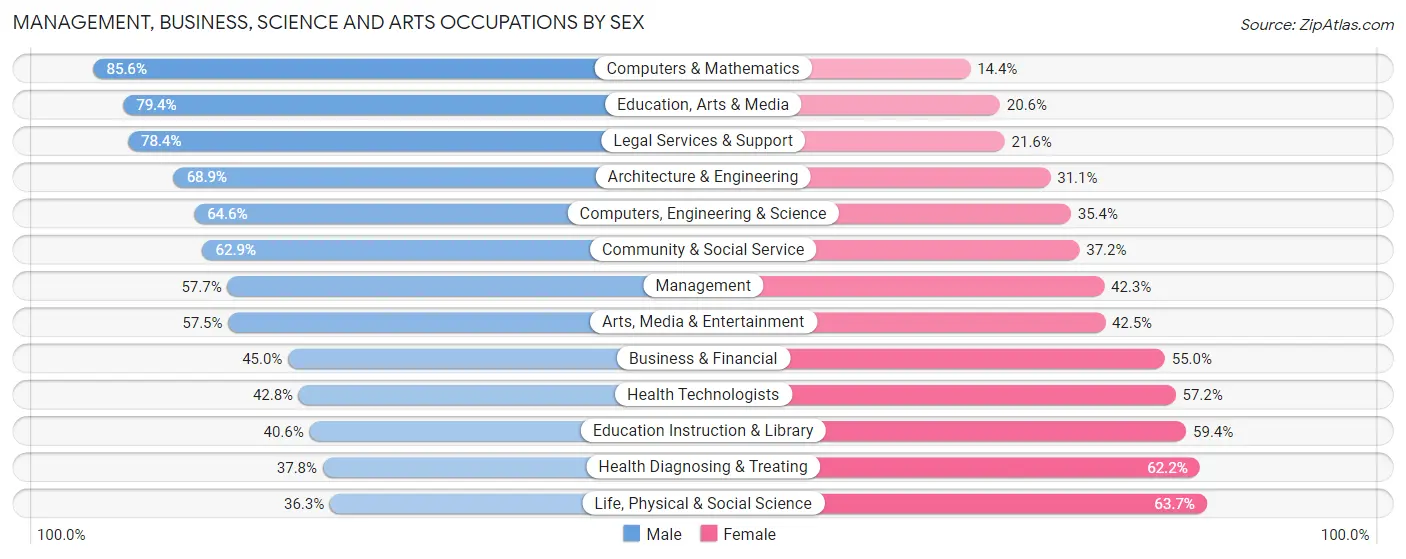
Management, Business, Science and Arts Occupations by Sex
Within the Management, Business, Science and Arts occupations in Tiburon, the most male-oriented occupations are Computers & Mathematics (85.6%), Education, Arts & Media (79.4%), and Legal Services & Support (78.4%), while the most female-oriented occupations are Life, Physical & Social Science (63.7%), Health Diagnosing & Treating (62.2%), and Education Instruction & Library (59.4%).
| Occupation | Male | Female |
| Management | 650 (57.7%) | 477 (42.3%) |
| Business & Financial | 257 (45.0%) | 314 (55.0%) |
| Computers, Engineering & Science | 241 (64.6%) | 132 (35.4%) |
| Computers & Mathematics | 107 (85.6%) | 18 (14.4%) |
| Architecture & Engineering | 93 (68.9%) | 42 (31.1%) |
| Life, Physical & Social Science | 41 (36.3%) | 72 (63.7%) |
| Community & Social Service | 357 (62.8%) | 211 (37.1%) |
| Education, Arts & Media | 54 (79.4%) | 14 (20.6%) |
| Legal Services & Support | 149 (78.4%) | 41 (21.6%) |
| Education Instruction & Library | 58 (40.6%) | 85 (59.4%) |
| Arts, Media & Entertainment | 96 (57.5%) | 71 (42.5%) |
| Health Diagnosing & Treating | 68 (37.8%) | 112 (62.2%) |
| Health Technologists | 68 (42.8%) | 91 (57.2%) |
| Total (Category) | 1,573 (55.8%) | 1,246 (44.2%) |
| Total (Overall) | 2,303 (55.6%) | 1,840 (44.4%) |
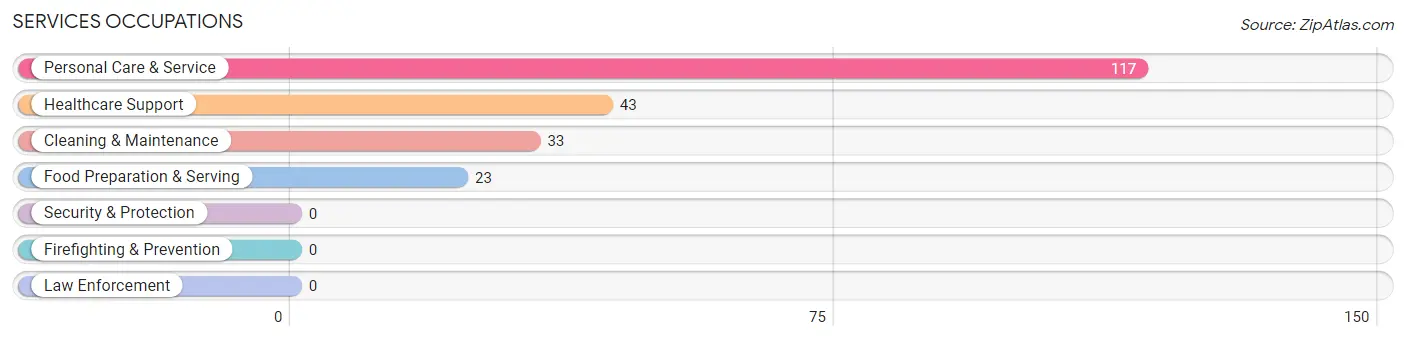
Services Occupations
The most common Services occupations in Tiburon are Personal Care & Service (117 | 2.8%), Healthcare Support (43 | 1.0%), Cleaning & Maintenance (33 | 0.8%), and Food Preparation & Serving (23 | 0.6%).
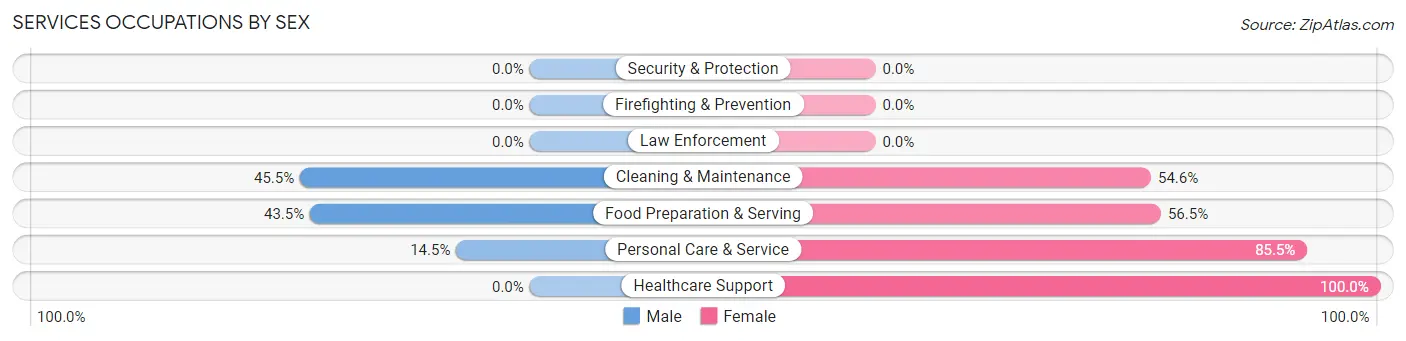
Services Occupations by Sex
Within the Services occupations in Tiburon, the most male-oriented occupations are Cleaning & Maintenance (45.5%), Food Preparation & Serving (43.5%), and Personal Care & Service (14.5%), while the most female-oriented occupations are Healthcare Support (100.0%), Personal Care & Service (85.5%), and Food Preparation & Serving (56.5%).
| Occupation | Male | Female |
| Healthcare Support | 0 (0.0%) | 43 (100.0%) |
| Security & Protection | 0 (0.0%) | 0 (0.0%) |
| Firefighting & Prevention | 0 (0.0%) | 0 (0.0%) |
| Law Enforcement | 0 (0.0%) | 0 (0.0%) |
| Food Preparation & Serving | 10 (43.5%) | 13 (56.5%) |
| Cleaning & Maintenance | 15 (45.5%) | 18 (54.5%) |
| Personal Care & Service | 17 (14.5%) | 100 (85.5%) |
| Total (Category) | 42 (19.4%) | 174 (80.6%) |
| Total (Overall) | 2,303 (55.6%) | 1,840 (44.4%) |
Sales and Office Occupations
The most common Sales and Office occupations in Tiburon are Sales & Related (502 | 12.1%), and Office & Administration (348 | 8.4%).
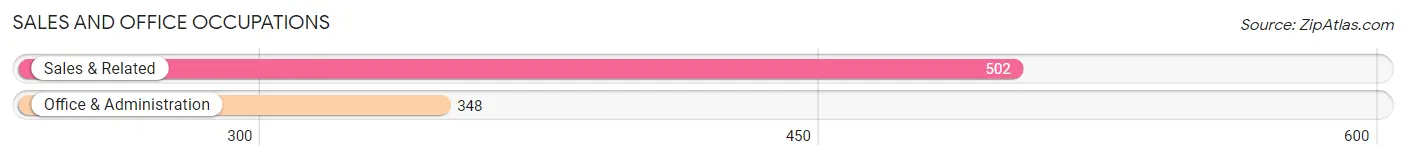
Sales and Office Occupations by Sex
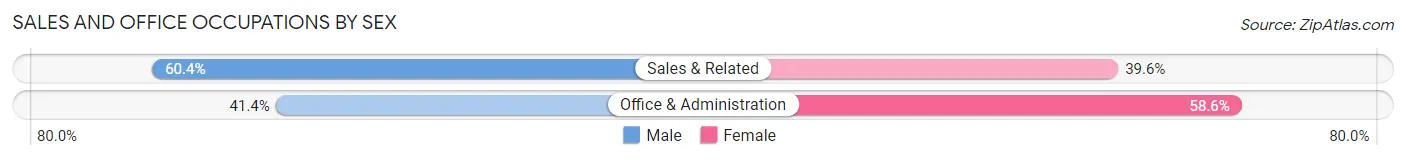
| Occupation | Male | Female |
| Sales & Related | 303 (60.4%) | 199 (39.6%) |
| Office & Administration | 144 (41.4%) | 204 (58.6%) |
| Total (Category) | 447 (52.6%) | 403 (47.4%) |
| Total (Overall) | 2,303 (55.6%) | 1,840 (44.4%) |
Natural Resources, Construction and Maintenance Occupations
The most common Natural Resources, Construction and Maintenance occupations in Tiburon are , and Construction & Extraction (143 | 3.5%).
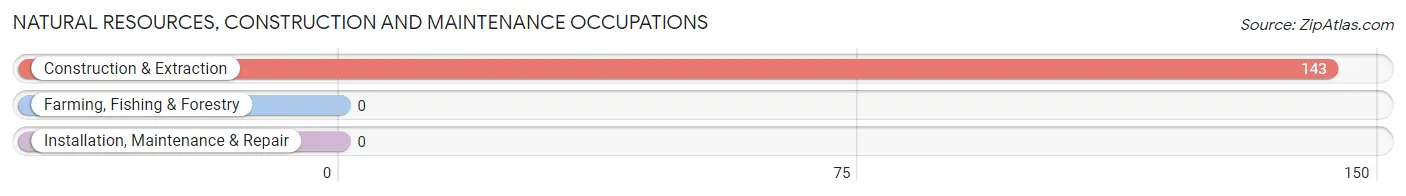
Natural Resources, Construction and Maintenance Occupations by Sex
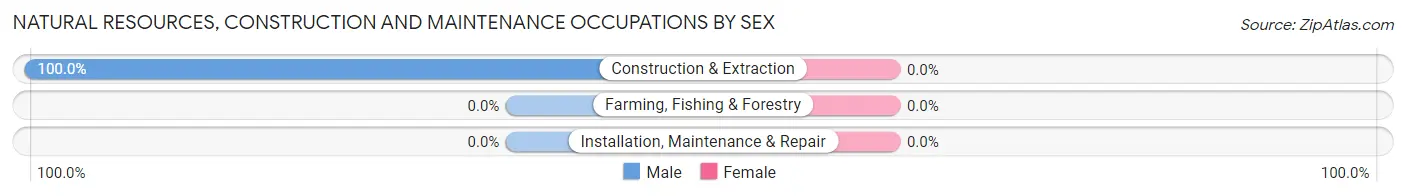
| Occupation | Male | Female |
| Farming, Fishing & Forestry | 0 (0.0%) | 0 (0.0%) |
| Construction & Extraction | 143 (100.0%) | 0 (0.0%) |
| Installation, Maintenance & Repair | 0 (0.0%) | 0 (0.0%) |
| Total (Category) | 143 (100.0%) | 0 (0.0%) |
| Total (Overall) | 2,303 (55.6%) | 1,840 (44.4%) |
Production, Transportation and Moving Occupations
The most common Production, Transportation and Moving occupations in Tiburon are , and Transportation (115 | 2.8%).
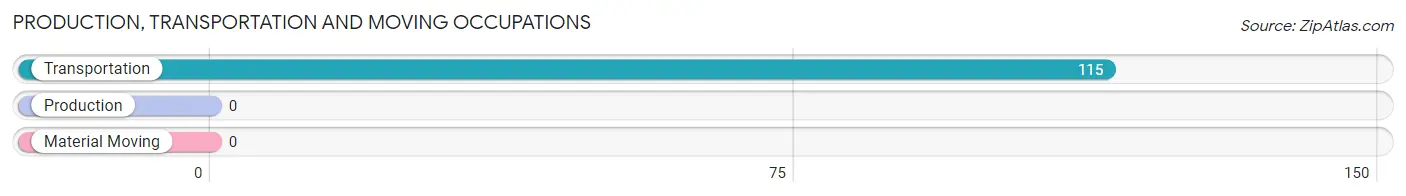
Production, Transportation and Moving Occupations by Sex
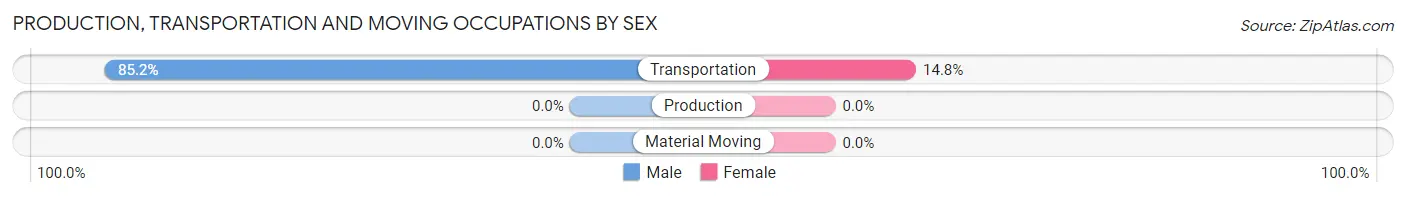
| Occupation | Male | Female |
| Production | 0 (0.0%) | 0 (0.0%) |
| Transportation | 98 (85.2%) | 17 (14.8%) |
| Material Moving | 0 (0.0%) | 0 (0.0%) |
| Total (Category) | 98 (85.2%) | 17 (14.8%) |
| Total (Overall) | 2,303 (55.6%) | 1,840 (44.4%) |
Employment Industries by Sex in Tiburon
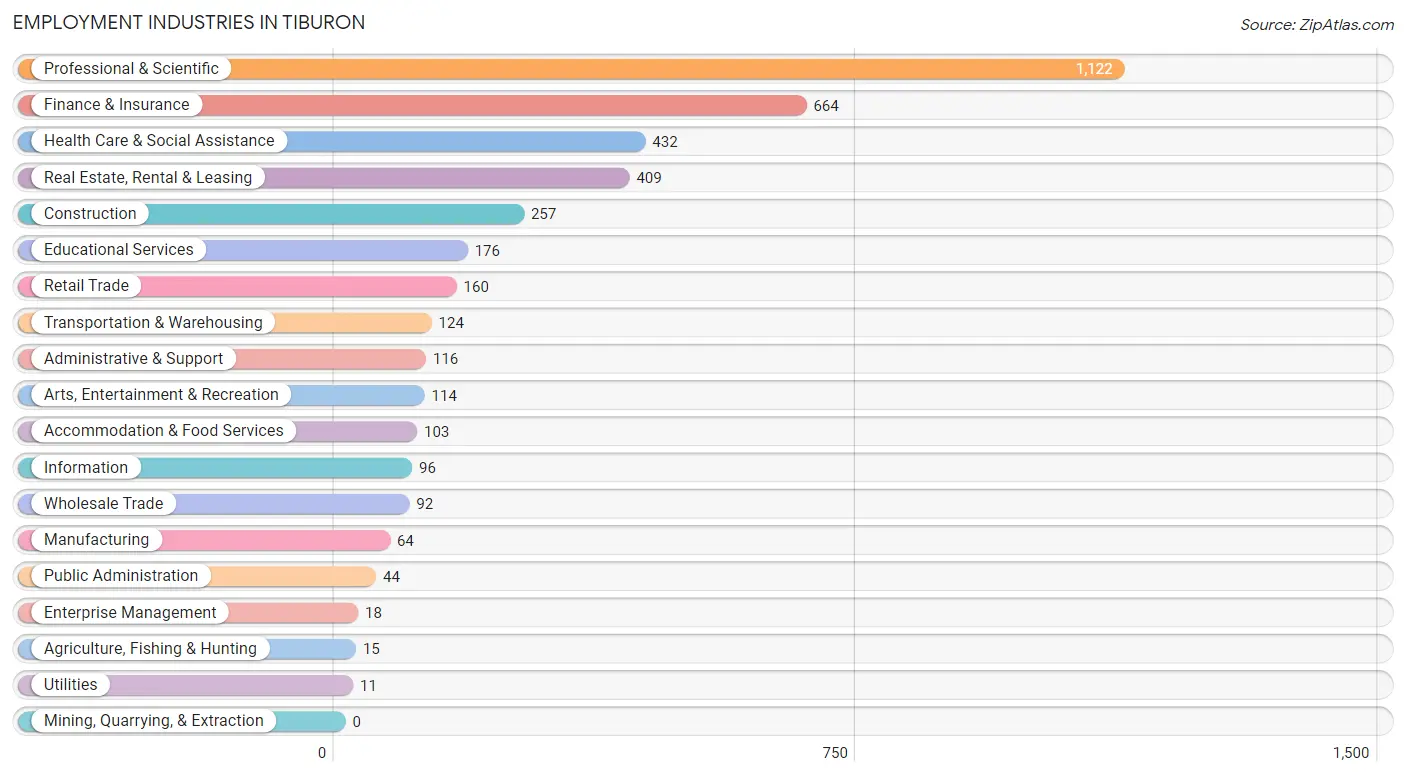
Employment Industries in Tiburon
The major employment industries in Tiburon include Professional & Scientific (1,122 | 27.1%), Finance & Insurance (664 | 16.0%), Health Care & Social Assistance (432 | 10.4%), Real Estate, Rental & Leasing (409 | 9.9%), and Construction (257 | 6.2%).
Employment Industries by Sex in Tiburon
The Tiburon industries that see more men than women are Agriculture, Fishing & Hunting (100.0%), Manufacturing (100.0%), and Transportation & Warehousing (100.0%), whereas the industries that tend to have a higher number of women are Enterprise Management (100.0%), Public Administration (75.0%), and Retail Trade (72.5%).
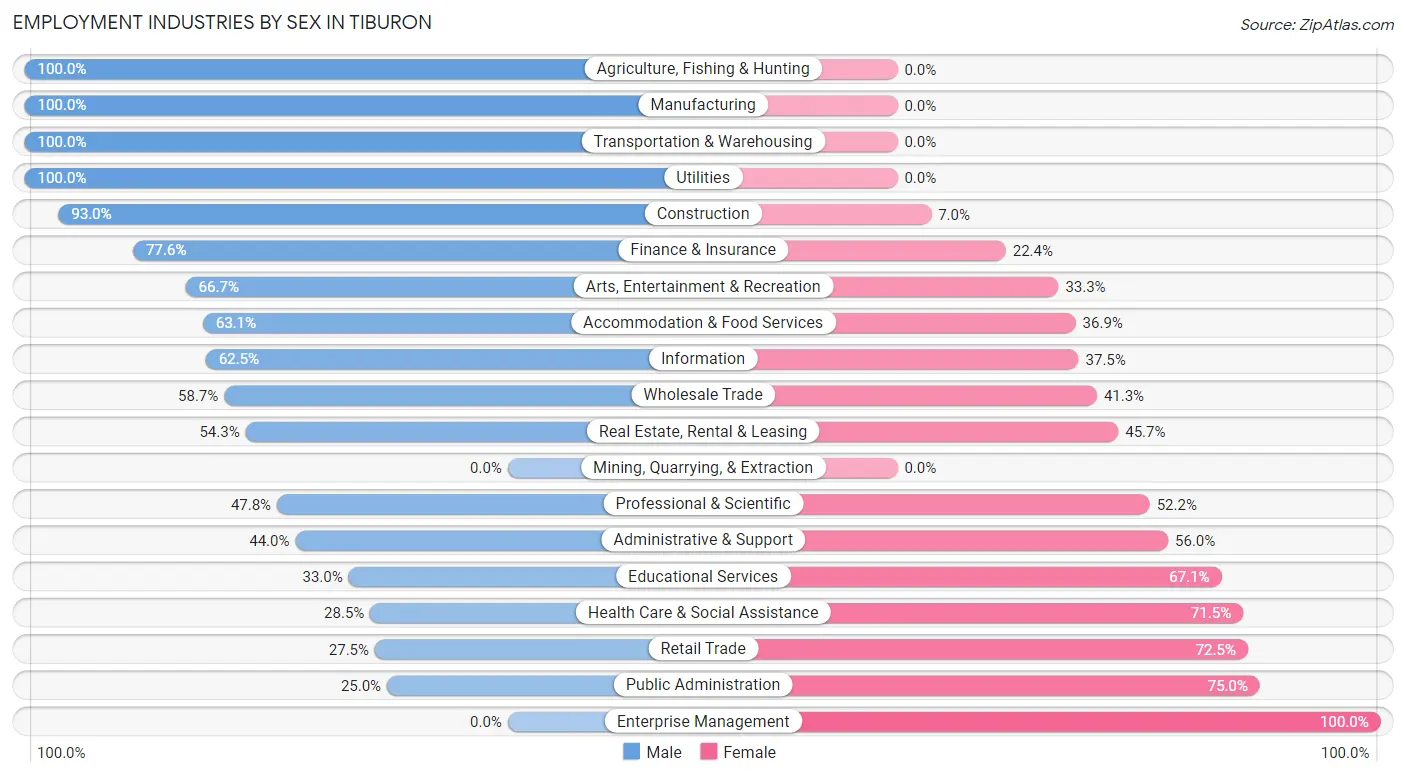
| Industry | Male | Female |
| Agriculture, Fishing & Hunting | 15 (100.0%) | 0 (0.0%) |
| Mining, Quarrying, & Extraction | 0 (0.0%) | 0 (0.0%) |
| Construction | 239 (93.0%) | 18 (7.0%) |
| Manufacturing | 64 (100.0%) | 0 (0.0%) |
| Wholesale Trade | 54 (58.7%) | 38 (41.3%) |
| Retail Trade | 44 (27.5%) | 116 (72.5%) |
| Transportation & Warehousing | 124 (100.0%) | 0 (0.0%) |
| Utilities | 11 (100.0%) | 0 (0.0%) |
| Information | 60 (62.5%) | 36 (37.5%) |
| Finance & Insurance | 515 (77.6%) | 149 (22.4%) |
| Real Estate, Rental & Leasing | 222 (54.3%) | 187 (45.7%) |
| Professional & Scientific | 536 (47.8%) | 586 (52.2%) |
| Enterprise Management | 0 (0.0%) | 18 (100.0%) |
| Administrative & Support | 51 (44.0%) | 65 (56.0%) |
| Educational Services | 58 (33.0%) | 118 (67.0%) |
| Health Care & Social Assistance | 123 (28.5%) | 309 (71.5%) |
| Arts, Entertainment & Recreation | 76 (66.7%) | 38 (33.3%) |
| Accommodation & Food Services | 65 (63.1%) | 38 (36.9%) |
| Public Administration | 11 (25.0%) | 33 (75.0%) |
| Total | 2,303 (55.6%) | 1,840 (44.4%) |
Education in Tiburon
School Enrollment in Tiburon
The most common levels of schooling among the 2,086 students in Tiburon are high school (524 | 25.1%), elementary school (436 | 20.9%), and college / undergraduate (428 | 20.5%).
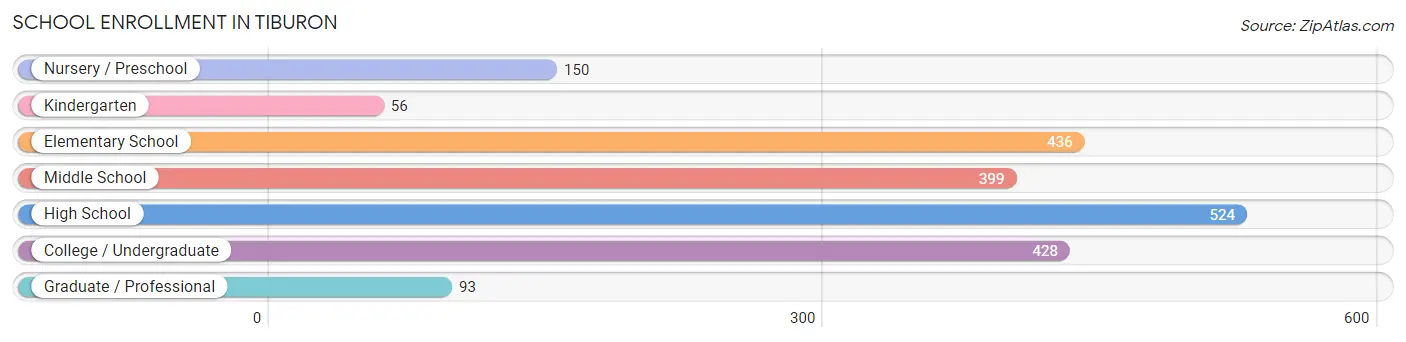
| School Level | # Students | % Students |
| Nursery / Preschool | 150 | 7.2% |
| Kindergarten | 56 | 2.7% |
| Elementary School | 436 | 20.9% |
| Middle School | 399 | 19.1% |
| High School | 524 | 25.1% |
| College / Undergraduate | 428 | 20.5% |
| Graduate / Professional | 93 | 4.5% |
| Total | 2,086 | 100.0% |
School Enrollment by Age by Funding Source in Tiburon
Out of a total of 2,086 students who are enrolled in schools in Tiburon, 684 (32.8%) attend a private institution, while the remaining 1,402 (67.2%) are enrolled in public schools. The age group of 3 to 4 year olds has the highest likelihood of being enrolled in private schools, with 113 (79.6% in the age bracket) enrolled. Conversely, the age group of 25 to 34 year olds has the lowest likelihood of being enrolled in a private school, with 15 (100.0% in the age bracket) attending a public institution.
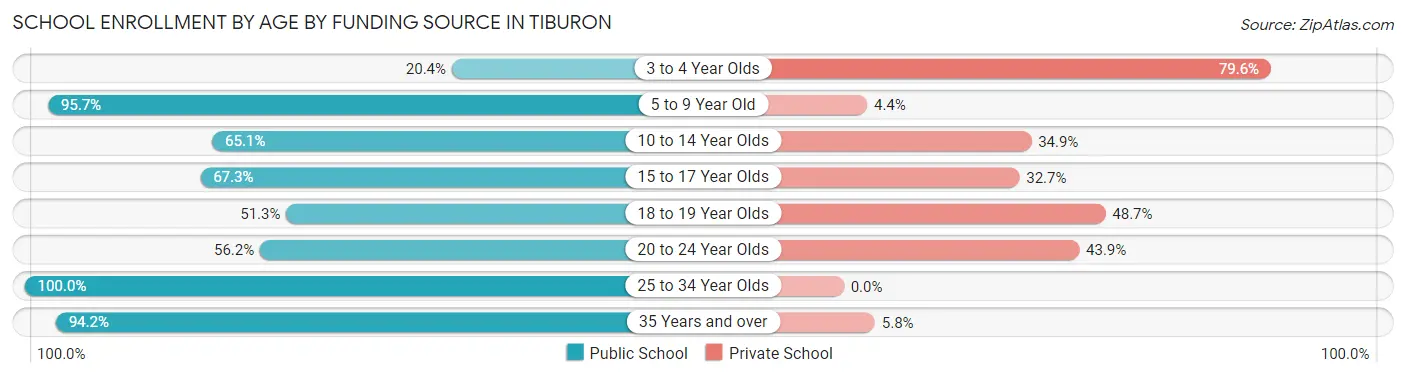
| Age Bracket | Public School | Private School |
| 3 to 4 Year Olds | 29 (20.4%) | 113 (79.6%) |
| 5 to 9 Year Old | 396 (95.7%) | 18 (4.3%) |
| 10 to 14 Year Olds | 339 (65.1%) | 182 (34.9%) |
| 15 to 17 Year Olds | 286 (67.3%) | 139 (32.7%) |
| 18 to 19 Year Olds | 102 (51.3%) | 97 (48.7%) |
| 20 to 24 Year Olds | 169 (56.1%) | 132 (43.9%) |
| 25 to 34 Year Olds | 15 (100.0%) | 0 (0.0%) |
| 35 Years and over | 65 (94.2%) | 4 (5.8%) |
| Total | 1,402 (67.2%) | 684 (32.8%) |
Educational Attainment by Field of Study in Tiburon
Social sciences (1,123 | 18.9%), business (942 | 15.9%), liberal arts & history (556 | 9.4%), bio, nature & agricultural (403 | 6.8%), and science & technology (383 | 6.5%) are the most common fields of study among 5,937 individuals in Tiburon who have obtained a bachelor's degree or higher.
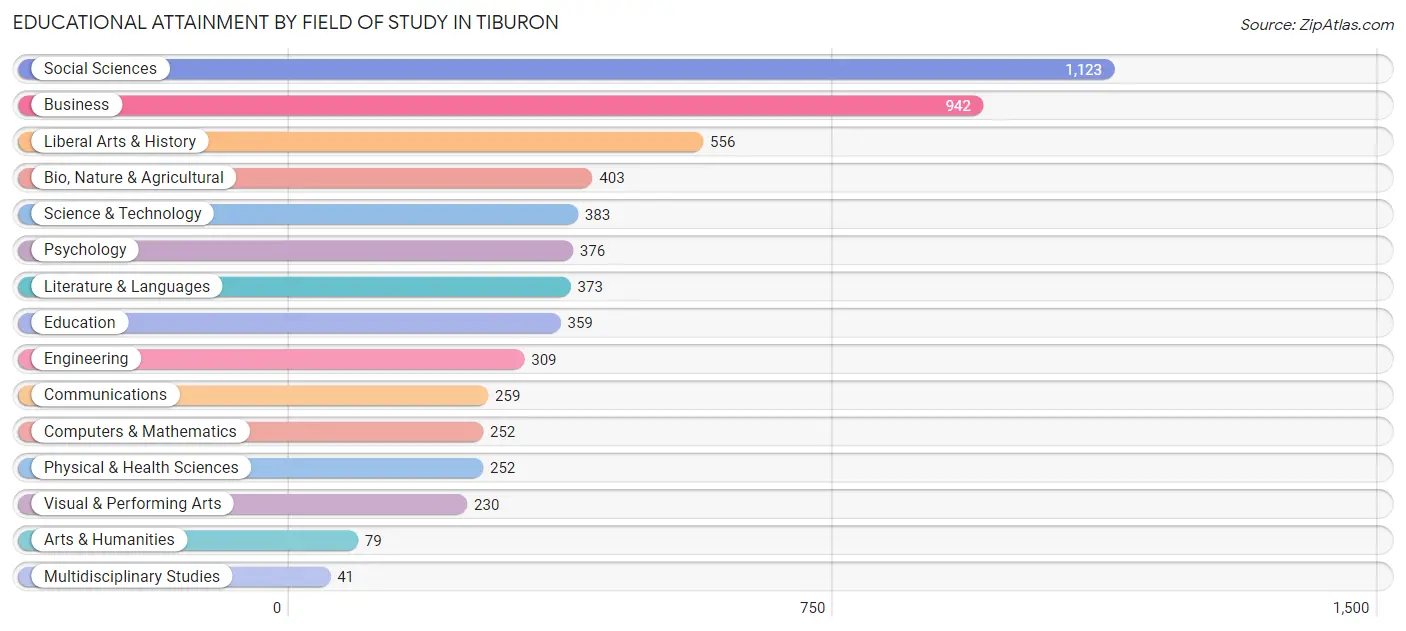
| Field of Study | # Graduates | % Graduates |
| Computers & Mathematics | 252 | 4.2% |
| Bio, Nature & Agricultural | 403 | 6.8% |
| Physical & Health Sciences | 252 | 4.2% |
| Psychology | 376 | 6.3% |
| Social Sciences | 1,123 | 18.9% |
| Engineering | 309 | 5.2% |
| Multidisciplinary Studies | 41 | 0.7% |
| Science & Technology | 383 | 6.5% |
| Business | 942 | 15.9% |
| Education | 359 | 6.0% |
| Literature & Languages | 373 | 6.3% |
| Liberal Arts & History | 556 | 9.4% |
| Visual & Performing Arts | 230 | 3.9% |
| Communications | 259 | 4.4% |
| Arts & Humanities | 79 | 1.3% |
| Total | 5,937 | 100.0% |
Transportation & Commute in Tiburon
Vehicle Availability by Sex in Tiburon
The most prevalent vehicle ownership categories in Tiburon are males with 2 vehicles (1,174, accounting for 51.0%) and females with 2 vehicles (677, making up 64.3%).
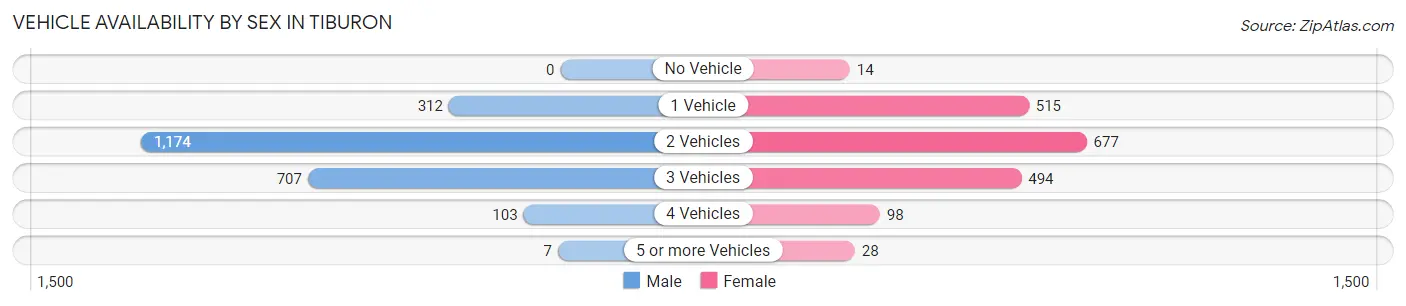
| Vehicles Available | Male | Female |
| No Vehicle | 0 (0.0%) | 14 (0.8%) |
| 1 Vehicle | 312 (13.6%) | 515 (28.2%) |
| 2 Vehicles | 1,174 (51.0%) | 677 (37.1%) |
| 3 Vehicles | 707 (30.7%) | 494 (27.1%) |
| 4 Vehicles | 103 (4.5%) | 98 (5.4%) |
| 5 or more Vehicles | 7 (0.3%) | 28 (1.5%) |
| Total | 2,303 (100.0%) | 1,826 (100.0%) |
Commute Time in Tiburon
The most frequently occuring commute durations in Tiburon are 15 to 19 minutes (483 commuters, 17.8%), 20 to 24 minutes (348 commuters, 12.8%), and 30 to 34 minutes (313 commuters, 11.6%).
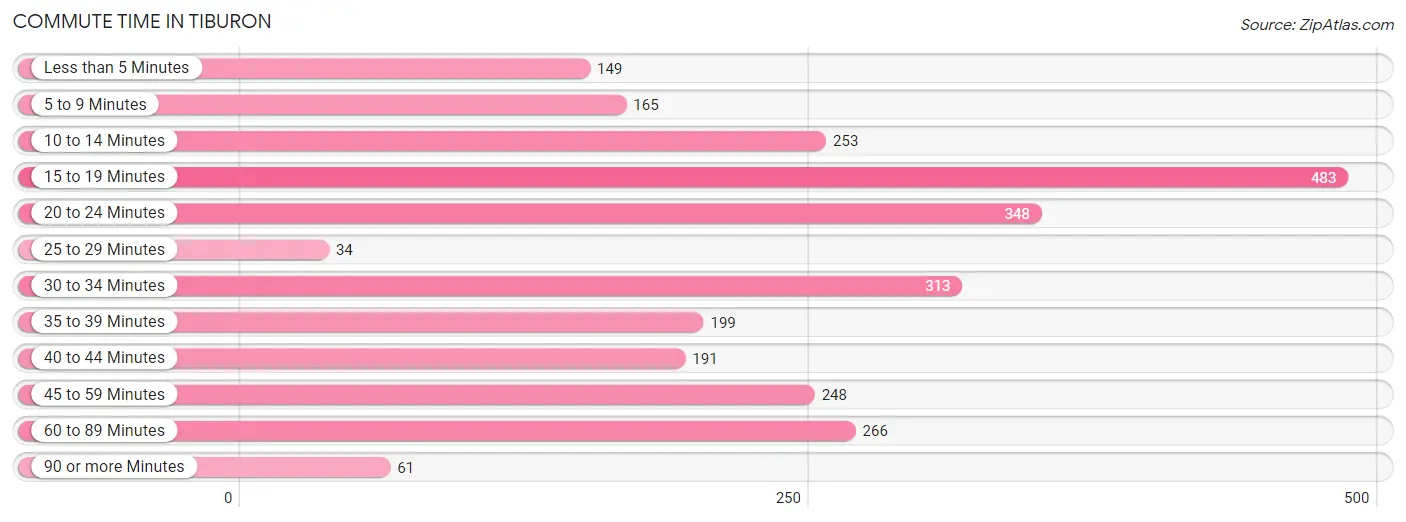
| Commute Time | # Commuters | % Commuters |
| Less than 5 Minutes | 149 | 5.5% |
| 5 to 9 Minutes | 165 | 6.1% |
| 10 to 14 Minutes | 253 | 9.3% |
| 15 to 19 Minutes | 483 | 17.8% |
| 20 to 24 Minutes | 348 | 12.8% |
| 25 to 29 Minutes | 34 | 1.3% |
| 30 to 34 Minutes | 313 | 11.6% |
| 35 to 39 Minutes | 199 | 7.3% |
| 40 to 44 Minutes | 191 | 7.0% |
| 45 to 59 Minutes | 248 | 9.1% |
| 60 to 89 Minutes | 266 | 9.8% |
| 90 or more Minutes | 61 | 2.2% |
Commute Time by Sex in Tiburon
The most common commute times in Tiburon are 15 to 19 minutes (254 commuters, 17.1%) for males and 15 to 19 minutes (229 commuters, 18.7%) for females.
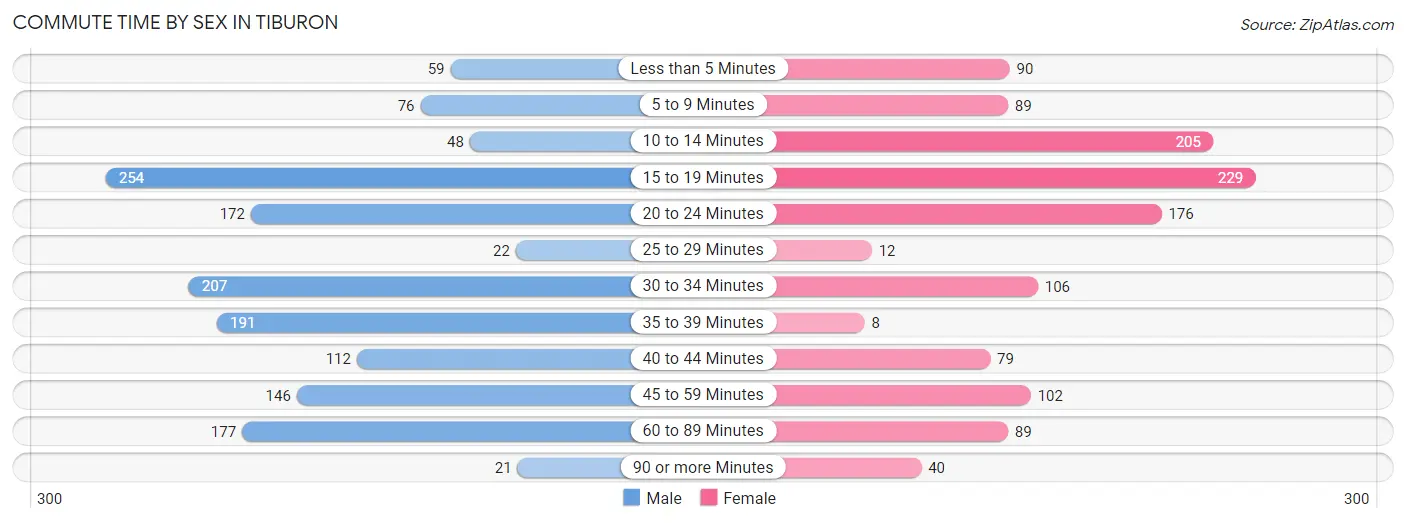
| Commute Time | Male | Female |
| Less than 5 Minutes | 59 (4.0%) | 90 (7.3%) |
| 5 to 9 Minutes | 76 (5.1%) | 89 (7.3%) |
| 10 to 14 Minutes | 48 (3.2%) | 205 (16.7%) |
| 15 to 19 Minutes | 254 (17.1%) | 229 (18.7%) |
| 20 to 24 Minutes | 172 (11.6%) | 176 (14.4%) |
| 25 to 29 Minutes | 22 (1.5%) | 12 (1.0%) |
| 30 to 34 Minutes | 207 (13.9%) | 106 (8.6%) |
| 35 to 39 Minutes | 191 (12.9%) | 8 (0.6%) |
| 40 to 44 Minutes | 112 (7.5%) | 79 (6.5%) |
| 45 to 59 Minutes | 146 (9.8%) | 102 (8.3%) |
| 60 to 89 Minutes | 177 (11.9%) | 89 (7.3%) |
| 90 or more Minutes | 21 (1.4%) | 40 (3.3%) |
Time of Departure to Work by Sex in Tiburon
The most frequent times of departure to work in Tiburon are 7:00 AM to 7:29 AM (299, 20.1%) for males and 7:30 AM to 7:59 AM (336, 27.4%) for females.
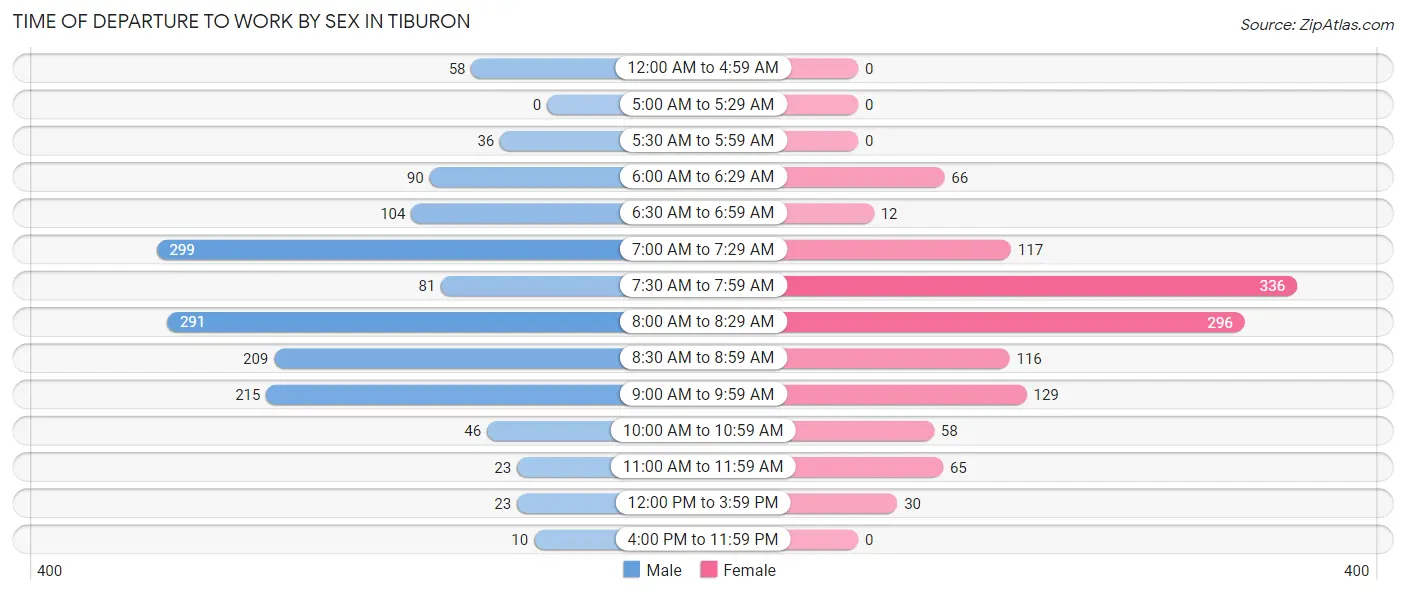
| Time of Departure | Male | Female |
| 12:00 AM to 4:59 AM | 58 (3.9%) | 0 (0.0%) |
| 5:00 AM to 5:29 AM | 0 (0.0%) | 0 (0.0%) |
| 5:30 AM to 5:59 AM | 36 (2.4%) | 0 (0.0%) |
| 6:00 AM to 6:29 AM | 90 (6.1%) | 66 (5.4%) |
| 6:30 AM to 6:59 AM | 104 (7.0%) | 12 (1.0%) |
| 7:00 AM to 7:29 AM | 299 (20.1%) | 117 (9.6%) |
| 7:30 AM to 7:59 AM | 81 (5.4%) | 336 (27.4%) |
| 8:00 AM to 8:29 AM | 291 (19.6%) | 296 (24.2%) |
| 8:30 AM to 8:59 AM | 209 (14.1%) | 116 (9.5%) |
| 9:00 AM to 9:59 AM | 215 (14.5%) | 129 (10.5%) |
| 10:00 AM to 10:59 AM | 46 (3.1%) | 58 (4.7%) |
| 11:00 AM to 11:59 AM | 23 (1.5%) | 65 (5.3%) |
| 12:00 PM to 3:59 PM | 23 (1.5%) | 30 (2.5%) |
| 4:00 PM to 11:59 PM | 10 (0.7%) | 0 (0.0%) |
| Total | 1,485 (100.0%) | 1,225 (100.0%) |
Housing Occupancy in Tiburon
Occupancy by Ownership in Tiburon
Of the total 3,558 dwellings in Tiburon, owner-occupied units account for 2,453 (68.9%), while renter-occupied units make up 1,105 (31.1%).
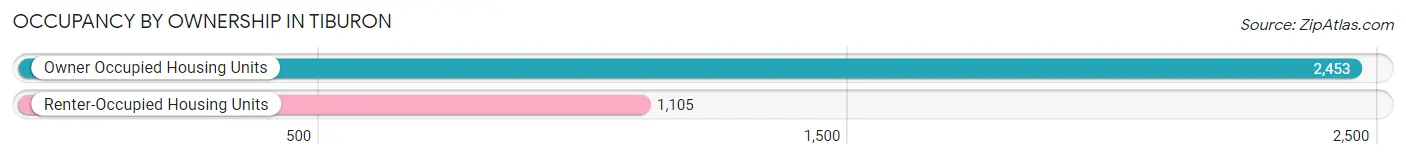
| Occupancy | # Housing Units | % Housing Units |
| Owner Occupied Housing Units | 2,453 | 68.9% |
| Renter-Occupied Housing Units | 1,105 | 31.1% |
| Total Occupied Housing Units | 3,558 | 100.0% |
Occupancy by Household Size in Tiburon
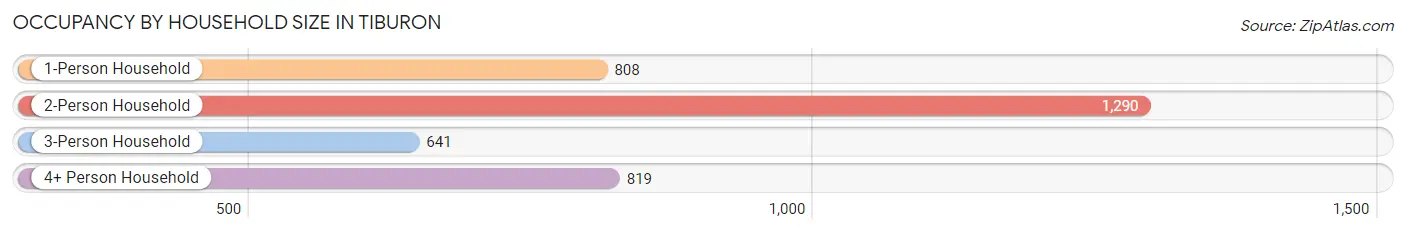
| Household Size | # Housing Units | % Housing Units |
| 1-Person Household | 808 | 22.7% |
| 2-Person Household | 1,290 | 36.3% |
| 3-Person Household | 641 | 18.0% |
| 4+ Person Household | 819 | 23.0% |
| Total Housing Units | 3,558 | 100.0% |
Occupancy by Ownership by Household Size in Tiburon
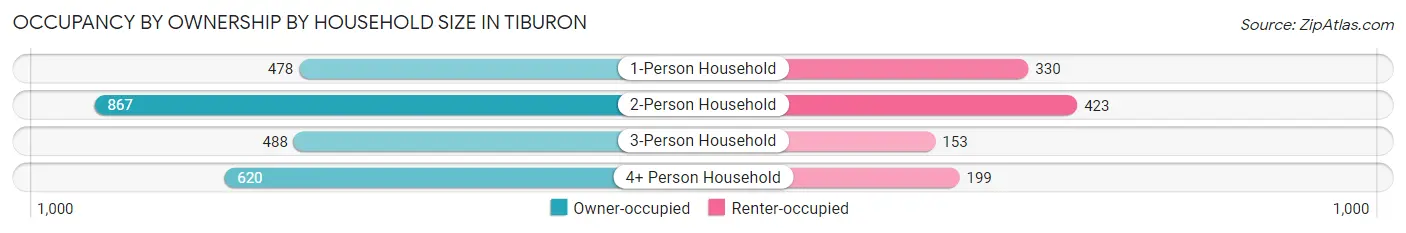
| Household Size | Owner-occupied | Renter-occupied |
| 1-Person Household | 478 (59.2%) | 330 (40.8%) |
| 2-Person Household | 867 (67.2%) | 423 (32.8%) |
| 3-Person Household | 488 (76.1%) | 153 (23.9%) |
| 4+ Person Household | 620 (75.7%) | 199 (24.3%) |
| Total Housing Units | 2,453 (68.9%) | 1,105 (31.1%) |
Occupancy by Educational Attainment in Tiburon
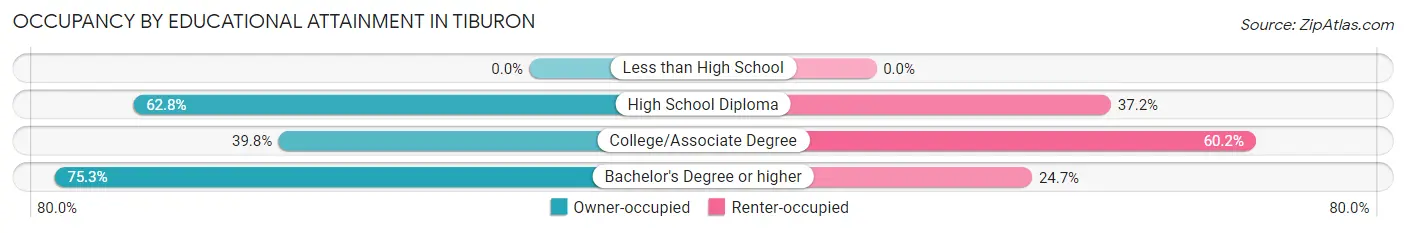
| Household Size | Owner-occupied | Renter-occupied |
| Less than High School | 0 (0.0%) | 0 (0.0%) |
| High School Diploma | 86 (62.8%) | 51 (37.2%) |
| College/Associate Degree | 234 (39.8%) | 354 (60.2%) |
| Bachelor's Degree or higher | 2,133 (75.3%) | 700 (24.7%) |
Occupancy by Age of Householder in Tiburon
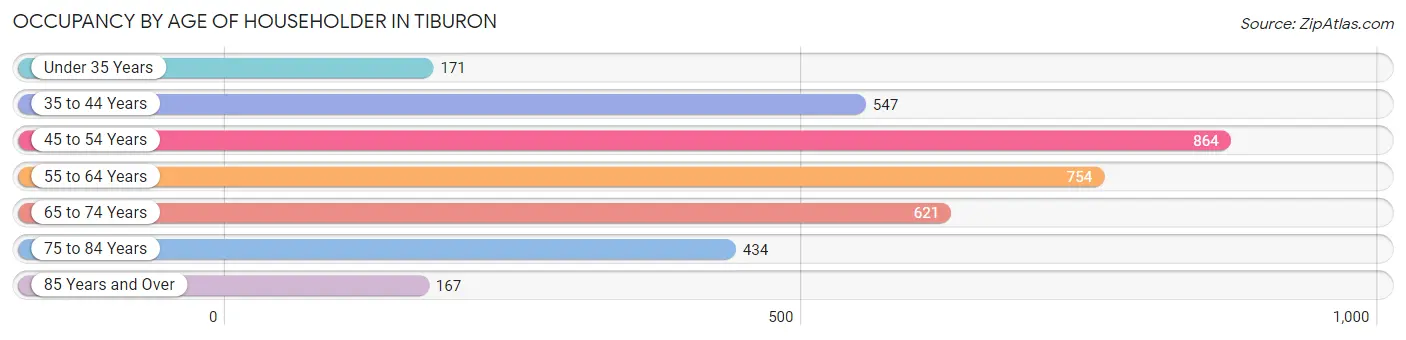
| Age Bracket | # Households | % Households |
| Under 35 Years | 171 | 4.8% |
| 35 to 44 Years | 547 | 15.4% |
| 45 to 54 Years | 864 | 24.3% |
| 55 to 64 Years | 754 | 21.2% |
| 65 to 74 Years | 621 | 17.4% |
| 75 to 84 Years | 434 | 12.2% |
| 85 Years and Over | 167 | 4.7% |
| Total | 3,558 | 100.0% |
Housing Finances in Tiburon
Median Income by Occupancy in Tiburon
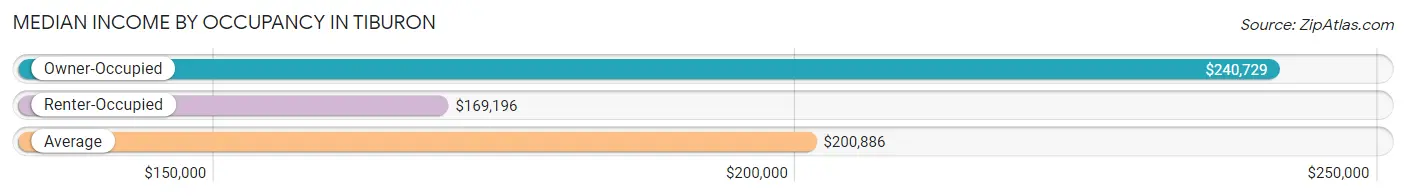
| Occupancy Type | # Households | Median Income |
| Owner-Occupied | 2,453 (68.9%) | $240,729 |
| Renter-Occupied | 1,105 (31.1%) | $169,196 |
| Average | 3,558 (100.0%) | $200,886 |
Occupancy by Householder Income Bracket in Tiburon
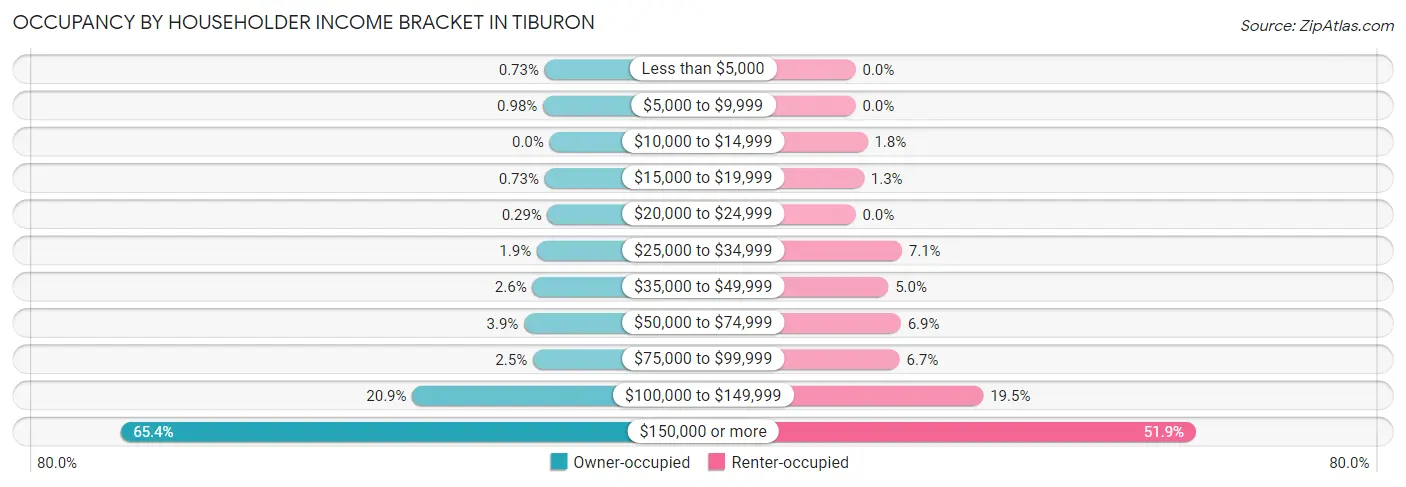
| Income Bracket | Owner-occupied | Renter-occupied |
| Less than $5,000 | 18 (0.7%) | 0 (0.0%) |
| $5,000 to $9,999 | 24 (1.0%) | 0 (0.0%) |
| $10,000 to $14,999 | 0 (0.0%) | 20 (1.8%) |
| $15,000 to $19,999 | 18 (0.7%) | 14 (1.3%) |
| $20,000 to $24,999 | 7 (0.3%) | 0 (0.0%) |
| $25,000 to $34,999 | 47 (1.9%) | 78 (7.1%) |
| $35,000 to $49,999 | 64 (2.6%) | 55 (5.0%) |
| $50,000 to $74,999 | 95 (3.9%) | 76 (6.9%) |
| $75,000 to $99,999 | 62 (2.5%) | 74 (6.7%) |
| $100,000 to $149,999 | 513 (20.9%) | 215 (19.5%) |
| $150,000 or more | 1,605 (65.4%) | 573 (51.9%) |
| Total | 2,453 (100.0%) | 1,105 (100.0%) |
Monthly Housing Cost Tiers in Tiburon
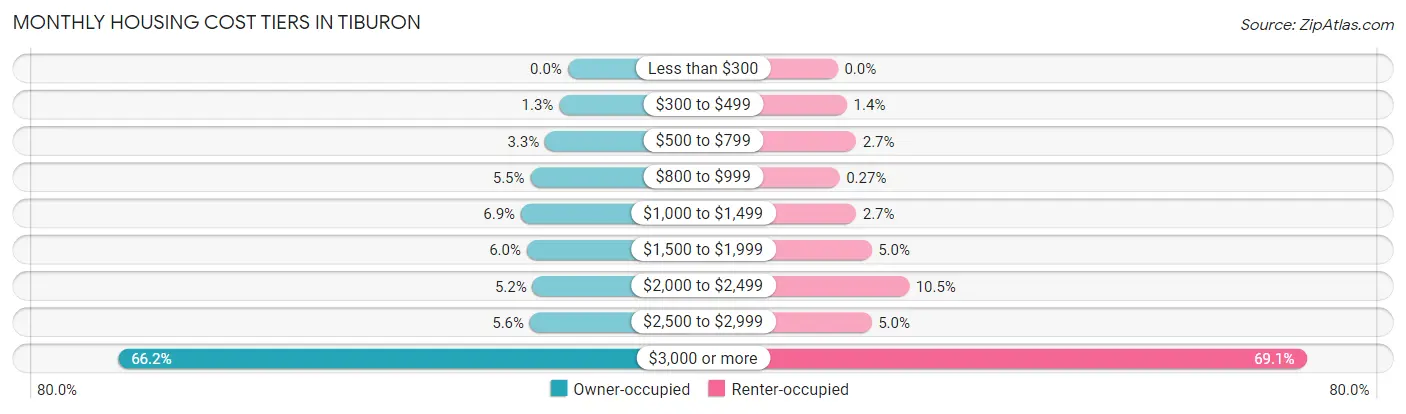
| Monthly Cost | Owner-occupied | Renter-occupied |
| Less than $300 | 0 (0.0%) | 0 (0.0%) |
| $300 to $499 | 31 (1.3%) | 15 (1.4%) |
| $500 to $799 | 82 (3.3%) | 30 (2.7%) |
| $800 to $999 | 135 (5.5%) | 3 (0.3%) |
| $1,000 to $1,499 | 169 (6.9%) | 30 (2.7%) |
| $1,500 to $1,999 | 148 (6.0%) | 55 (5.0%) |
| $2,000 to $2,499 | 127 (5.2%) | 116 (10.5%) |
| $2,500 to $2,999 | 137 (5.6%) | 55 (5.0%) |
| $3,000 or more | 1,624 (66.2%) | 763 (69.1%) |
| Total | 2,453 (100.0%) | 1,105 (100.0%) |
Physical Housing Characteristics in Tiburon
Housing Structures in Tiburon
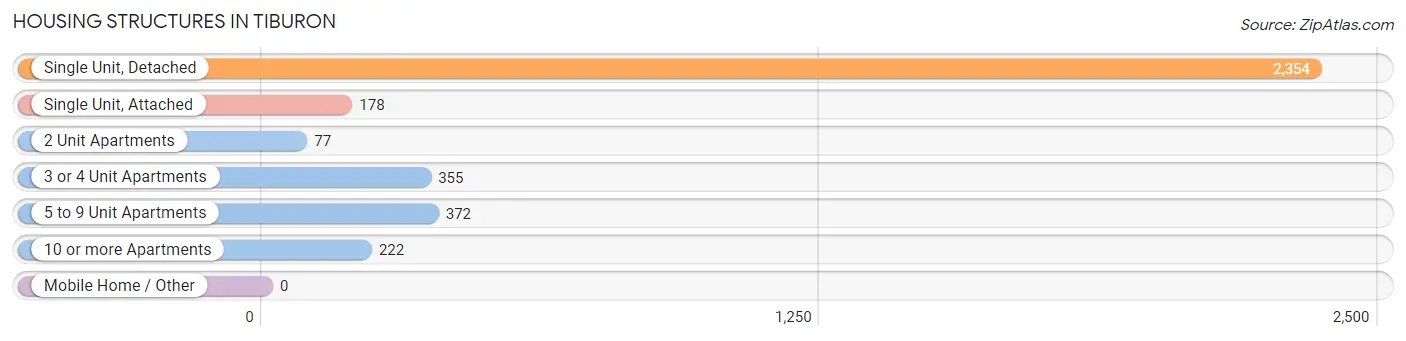
| Structure Type | # Housing Units | % Housing Units |
| Single Unit, Detached | 2,354 | 66.2% |
| Single Unit, Attached | 178 | 5.0% |
| 2 Unit Apartments | 77 | 2.2% |
| 3 or 4 Unit Apartments | 355 | 10.0% |
| 5 to 9 Unit Apartments | 372 | 10.5% |
| 10 or more Apartments | 222 | 6.2% |
| Mobile Home / Other | 0 | 0.0% |
| Total | 3,558 | 100.0% |
Housing Structures by Occupancy in Tiburon
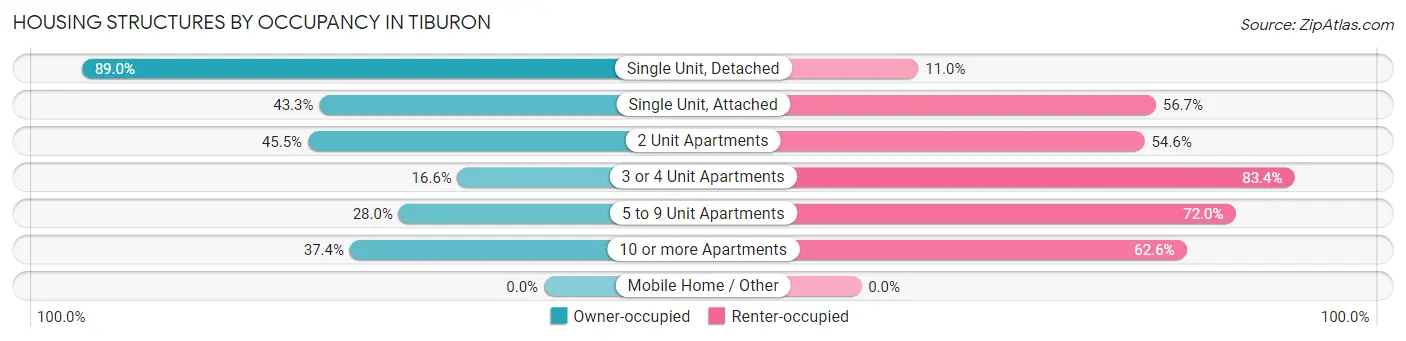
| Structure Type | Owner-occupied | Renter-occupied |
| Single Unit, Detached | 2,095 (89.0%) | 259 (11.0%) |
| Single Unit, Attached | 77 (43.3%) | 101 (56.7%) |
| 2 Unit Apartments | 35 (45.5%) | 42 (54.5%) |
| 3 or 4 Unit Apartments | 59 (16.6%) | 296 (83.4%) |
| 5 to 9 Unit Apartments | 104 (28.0%) | 268 (72.0%) |
| 10 or more Apartments | 83 (37.4%) | 139 (62.6%) |
| Mobile Home / Other | 0 (0.0%) | 0 (0.0%) |
| Total | 2,453 (68.9%) | 1,105 (31.1%) |
Housing Structures by Number of Rooms in Tiburon
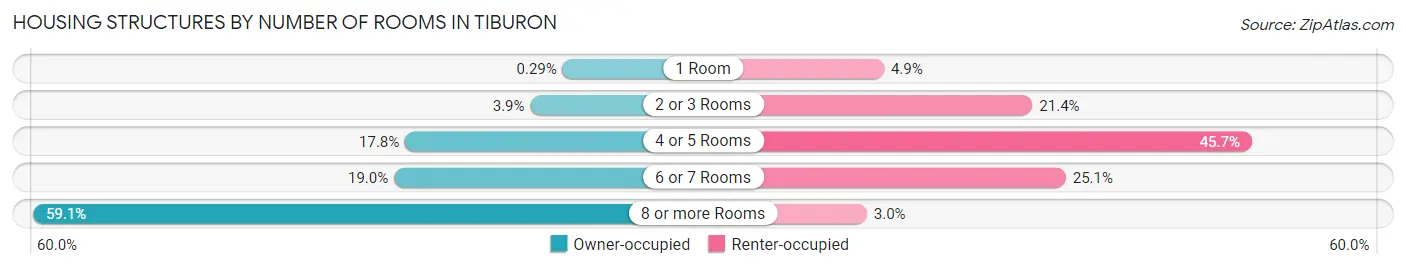
| Number of Rooms | Owner-occupied | Renter-occupied |
| 1 Room | 7 (0.3%) | 54 (4.9%) |
| 2 or 3 Rooms | 95 (3.9%) | 236 (21.4%) |
| 4 or 5 Rooms | 436 (17.8%) | 505 (45.7%) |
| 6 or 7 Rooms | 466 (19.0%) | 277 (25.1%) |
| 8 or more Rooms | 1,449 (59.1%) | 33 (3.0%) |
| Total | 2,453 (100.0%) | 1,105 (100.0%) |
Housing Structure by Heating Type in Tiburon
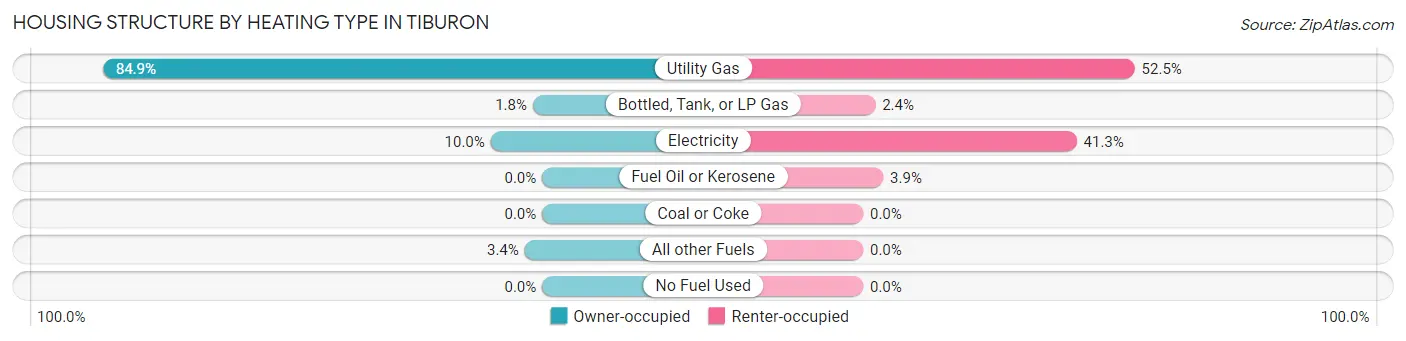
| Heating Type | Owner-occupied | Renter-occupied |
| Utility Gas | 2,082 (84.9%) | 580 (52.5%) |
| Bottled, Tank, or LP Gas | 44 (1.8%) | 26 (2.4%) |
| Electricity | 244 (10.0%) | 456 (41.3%) |
| Fuel Oil or Kerosene | 0 (0.0%) | 43 (3.9%) |
| Coal or Coke | 0 (0.0%) | 0 (0.0%) |
| All other Fuels | 83 (3.4%) | 0 (0.0%) |
| No Fuel Used | 0 (0.0%) | 0 (0.0%) |
| Total | 2,453 (100.0%) | 1,105 (100.0%) |
Household Vehicle Usage in Tiburon
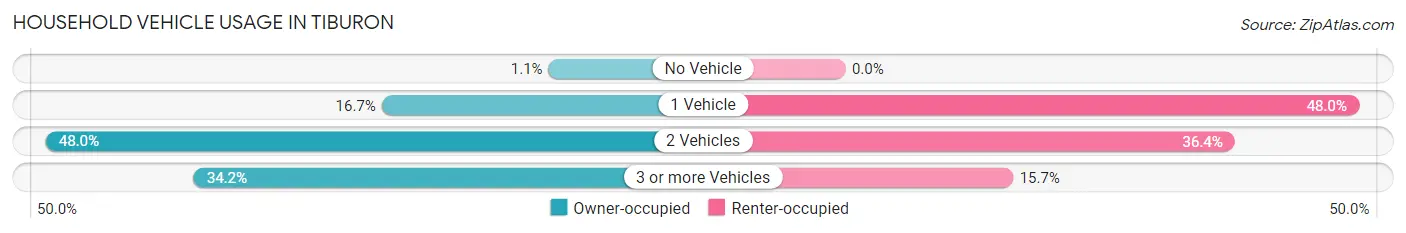
| Vehicles per Household | Owner-occupied | Renter-occupied |
| No Vehicle | 27 (1.1%) | 0 (0.0%) |
| 1 Vehicle | 409 (16.7%) | 530 (48.0%) |
| 2 Vehicles | 1,178 (48.0%) | 402 (36.4%) |
| 3 or more Vehicles | 839 (34.2%) | 173 (15.7%) |
| Total | 2,453 (100.0%) | 1,105 (100.0%) |
Real Estate & Mortgages in Tiburon
Real Estate and Mortgage Overview in Tiburon
| Characteristic | Without Mortgage | With Mortgage |
| Housing Units | 993 | 1,460 |
| Median Property Value | $2,000,001 | $2,000,001 |
| Median Household Income | $154,228 | $1,071 |
| Monthly Housing Costs | $1,501 | $1,340 |
| Real Estate Taxes | $10,001 | $50 |
Property Value by Mortgage Status in Tiburon
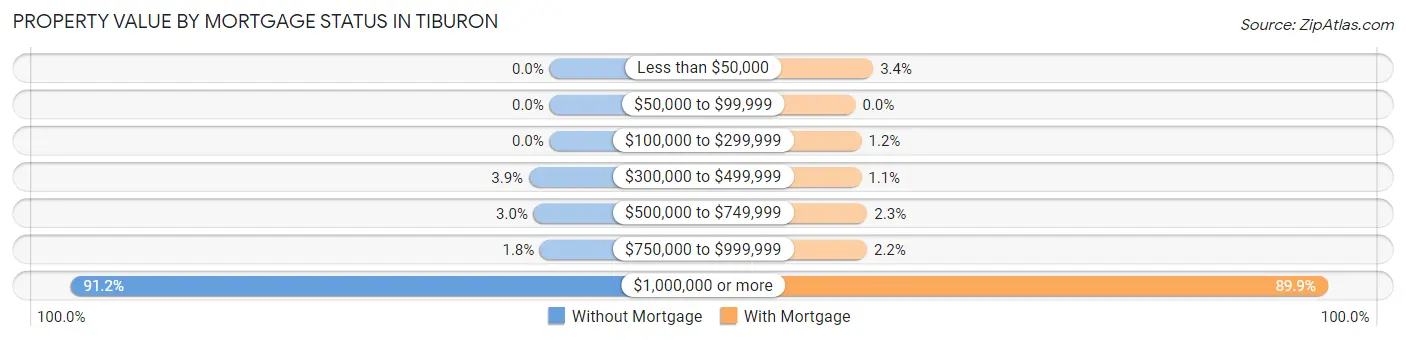
| Property Value | Without Mortgage | With Mortgage |
| Less than $50,000 | 0 (0.0%) | 49 (3.4%) |
| $50,000 to $99,999 | 0 (0.0%) | 0 (0.0%) |
| $100,000 to $299,999 | 0 (0.0%) | 17 (1.2%) |
| $300,000 to $499,999 | 39 (3.9%) | 16 (1.1%) |
| $500,000 to $749,999 | 30 (3.0%) | 33 (2.3%) |
| $750,000 to $999,999 | 18 (1.8%) | 32 (2.2%) |
| $1,000,000 or more | 906 (91.2%) | 1,313 (89.9%) |
| Total | 993 (100.0%) | 1,460 (100.0%) |
Household Income by Mortgage Status in Tiburon
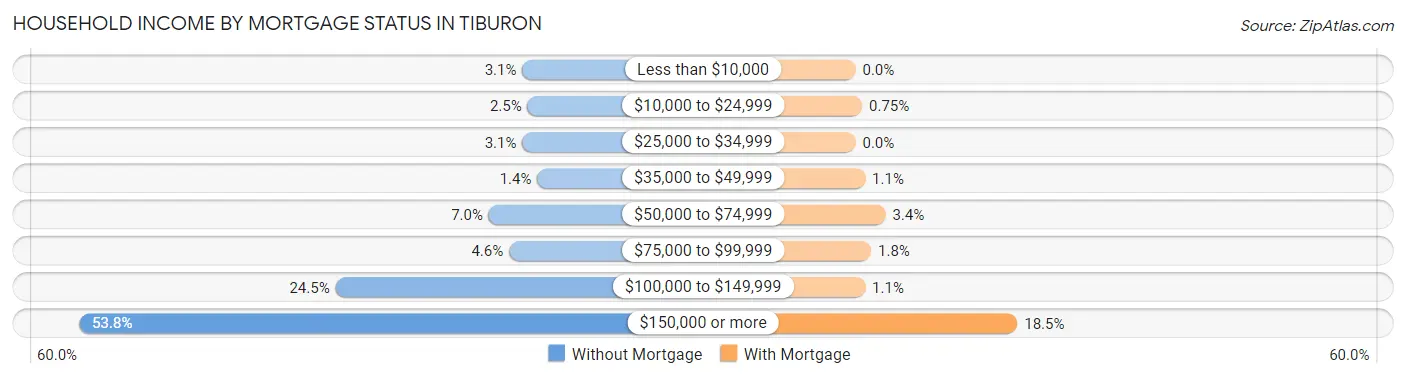
| Household Income | Without Mortgage | With Mortgage |
| Less than $10,000 | 31 (3.1%) | 0 (0.0%) |
| $10,000 to $24,999 | 25 (2.5%) | 11 (0.7%) |
| $25,000 to $34,999 | 31 (3.1%) | 0 (0.0%) |
| $35,000 to $49,999 | 14 (1.4%) | 16 (1.1%) |
| $50,000 to $74,999 | 69 (7.0%) | 50 (3.4%) |
| $75,000 to $99,999 | 46 (4.6%) | 26 (1.8%) |
| $100,000 to $149,999 | 243 (24.5%) | 16 (1.1%) |
| $150,000 or more | 534 (53.8%) | 270 (18.5%) |
| Total | 993 (100.0%) | 1,460 (100.0%) |
Property Value to Household Income Ratio in Tiburon
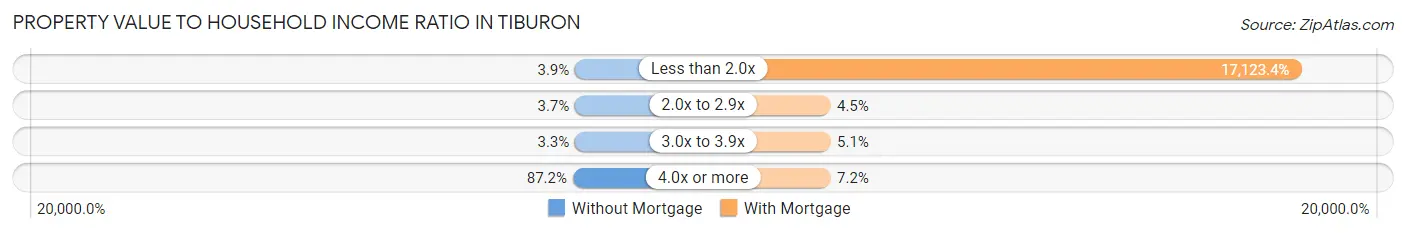
| Value-to-Income Ratio | Without Mortgage | With Mortgage |
| Less than 2.0x | 39 (3.9%) | 250,001 (17,123.4%) |
| 2.0x to 2.9x | 37 (3.7%) | 66 (4.5%) |
| 3.0x to 3.9x | 33 (3.3%) | 75 (5.1%) |
| 4.0x or more | 866 (87.2%) | 105 (7.2%) |
| Total | 993 (100.0%) | 1,460 (100.0%) |
Real Estate Taxes by Mortgage Status in Tiburon
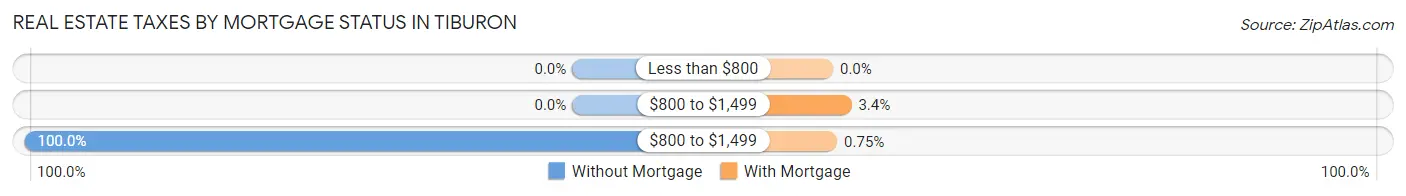
| Property Taxes | Without Mortgage | With Mortgage |
| Less than $800 | 0 (0.0%) | 0 (0.0%) |
| $800 to $1,499 | 0 (0.0%) | 49 (3.4%) |
| $800 to $1,499 | 993 (100.0%) | 11 (0.7%) |
| Total | 993 (100.0%) | 1,460 (100.0%) |
Health & Disability in Tiburon
Health Insurance Coverage by Age in Tiburon
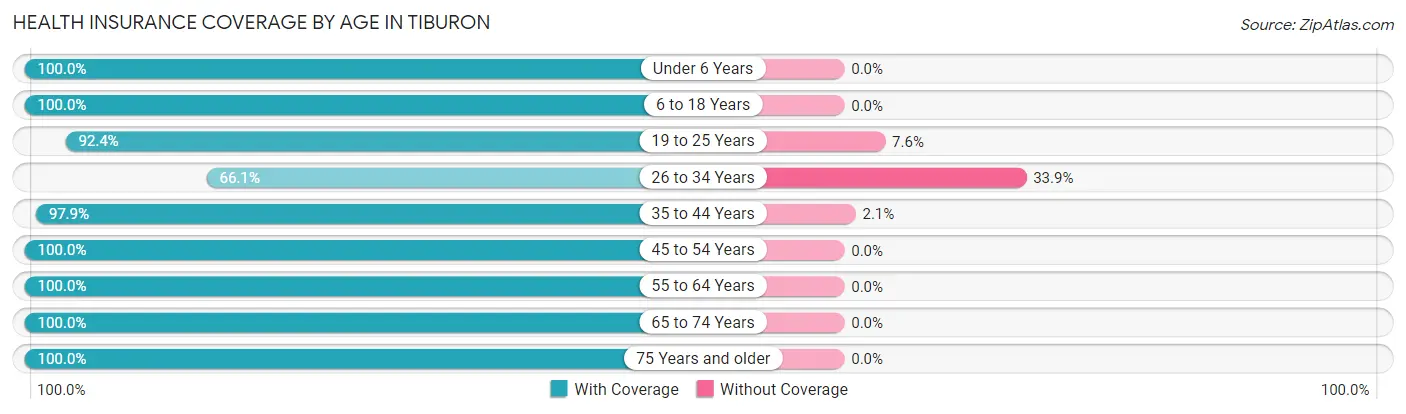
| Age Bracket | With Coverage | Without Coverage |
| Under 6 Years | 341 (100.0%) | 0 (0.0%) |
| 6 to 18 Years | 1,523 (100.0%) | 0 (0.0%) |
| 19 to 25 Years | 509 (92.4%) | 42 (7.6%) |
| 26 to 34 Years | 220 (66.1%) | 113 (33.9%) |
| 35 to 44 Years | 1,070 (97.9%) | 23 (2.1%) |
| 45 to 54 Years | 1,757 (100.0%) | 0 (0.0%) |
| 55 to 64 Years | 1,365 (100.0%) | 0 (0.0%) |
| 65 to 74 Years | 1,126 (100.0%) | 0 (0.0%) |
| 75 Years and older | 994 (100.0%) | 0 (0.0%) |
| Total | 8,905 (98.0%) | 178 (2.0%) |
Health Insurance Coverage by Citizenship Status in Tiburon
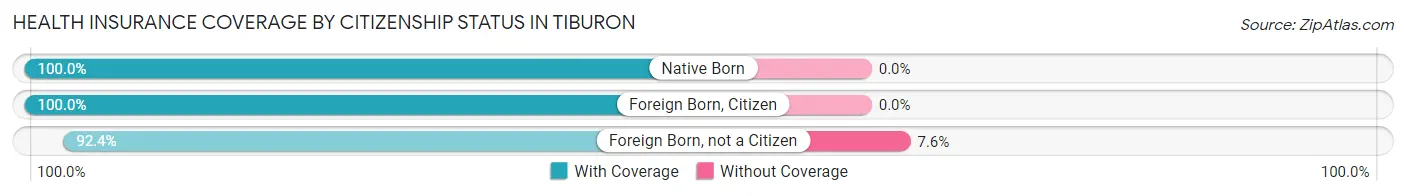
| Citizenship Status | With Coverage | Without Coverage |
| Native Born | 341 (100.0%) | 0 (0.0%) |
| Foreign Born, Citizen | 1,523 (100.0%) | 0 (0.0%) |
| Foreign Born, not a Citizen | 509 (92.4%) | 42 (7.6%) |
Health Insurance Coverage by Household Income in Tiburon
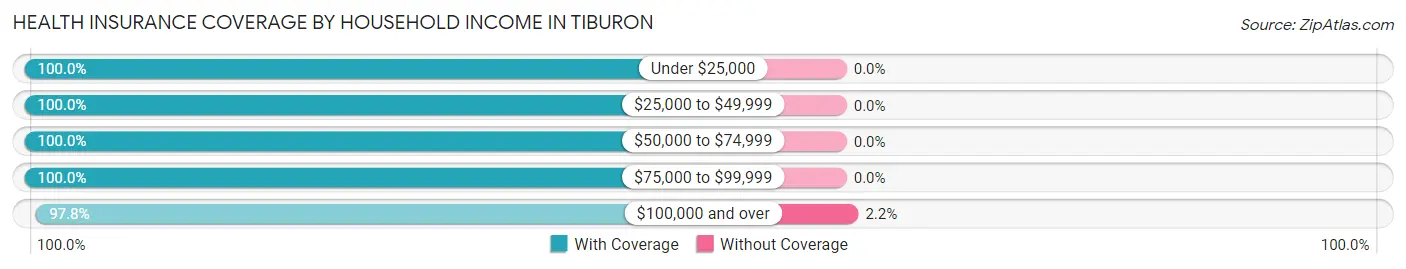
| Household Income | With Coverage | Without Coverage |
| Under $25,000 | 122 (100.0%) | 0 (0.0%) |
| $25,000 to $49,999 | 390 (100.0%) | 0 (0.0%) |
| $50,000 to $74,999 | 292 (100.0%) | 0 (0.0%) |
| $75,000 to $99,999 | 166 (100.0%) | 0 (0.0%) |
| $100,000 and over | 7,935 (97.8%) | 178 (2.2%) |
Public vs Private Health Insurance Coverage by Age in Tiburon
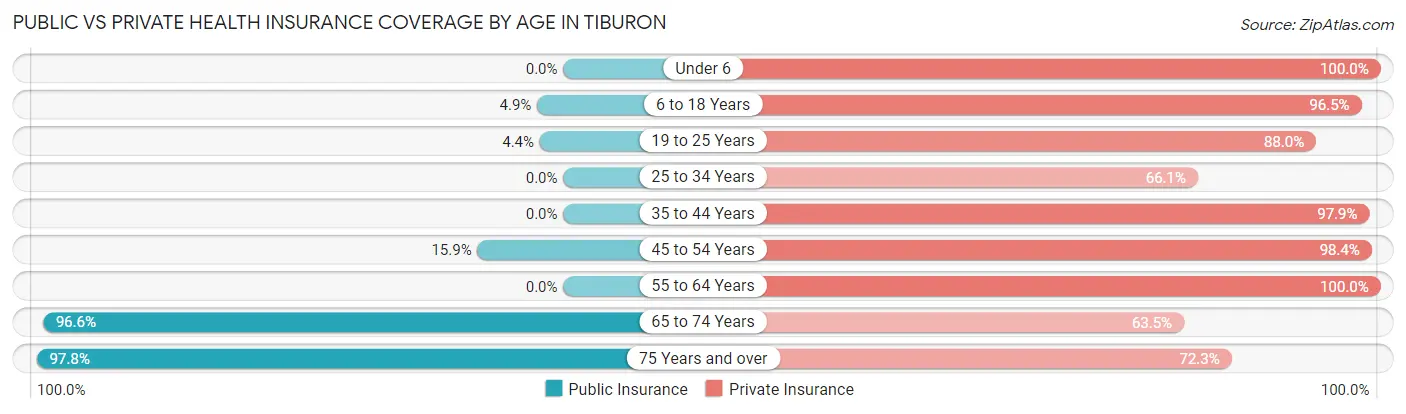
| Age Bracket | Public Insurance | Private Insurance |
| Under 6 | 0 (0.0%) | 341 (100.0%) |
| 6 to 18 Years | 74 (4.9%) | 1,469 (96.5%) |
| 19 to 25 Years | 24 (4.4%) | 485 (88.0%) |
| 25 to 34 Years | 0 (0.0%) | 220 (66.1%) |
| 35 to 44 Years | 0 (0.0%) | 1,070 (97.9%) |
| 45 to 54 Years | 280 (15.9%) | 1,728 (98.4%) |
| 55 to 64 Years | 0 (0.0%) | 1,365 (100.0%) |
| 65 to 74 Years | 1,088 (96.6%) | 715 (63.5%) |
| 75 Years and over | 972 (97.8%) | 719 (72.3%) |
| Total | 2,438 (26.8%) | 8,112 (89.3%) |
Disability Status by Sex by Age in Tiburon
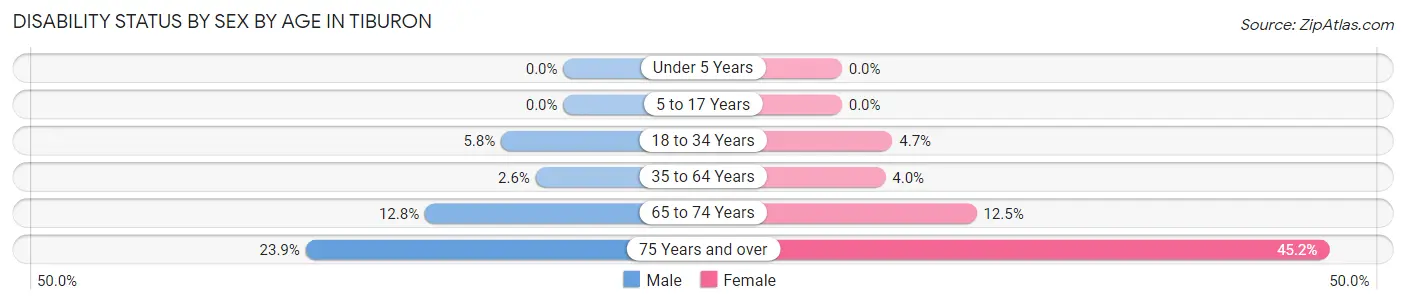
| Age Bracket | Male | Female |
| Under 5 Years | 0 (0.0%) | 0 (0.0%) |
| 5 to 17 Years | 0 (0.0%) | 0 (0.0%) |
| 18 to 34 Years | 39 (5.8%) | 13 (4.7%) |
| 35 to 64 Years | 51 (2.6%) | 90 (4.0%) |
| 65 to 74 Years | 86 (12.8%) | 57 (12.5%) |
| 75 Years and over | 105 (23.9%) | 251 (45.2%) |
Disability Class by Sex by Age in Tiburon
Disability Class: Hearing Difficulty
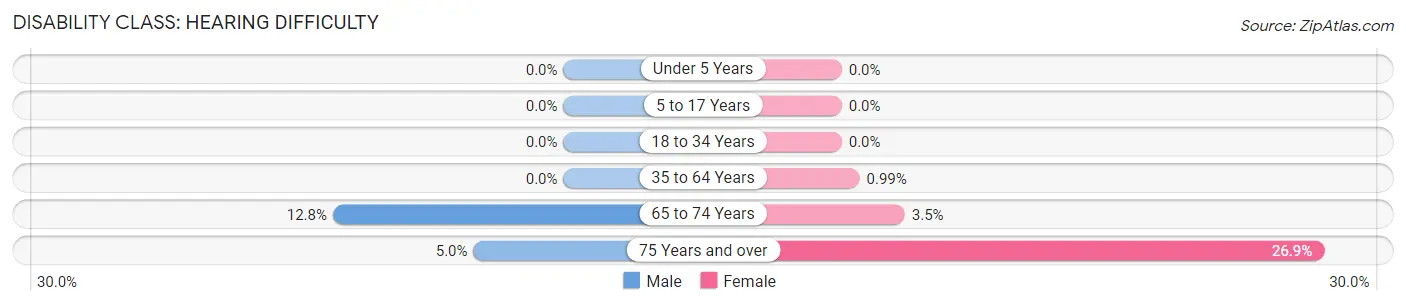
| Age Bracket | Male | Female |
| Under 5 Years | 0 (0.0%) | 0 (0.0%) |
| 5 to 17 Years | 0 (0.0%) | 0 (0.0%) |
| 18 to 34 Years | 0 (0.0%) | 0 (0.0%) |
| 35 to 64 Years | 0 (0.0%) | 22 (1.0%) |
| 65 to 74 Years | 86 (12.8%) | 16 (3.5%) |
| 75 Years and over | 22 (5.0%) | 149 (26.9%) |
Disability Class: Vision Difficulty
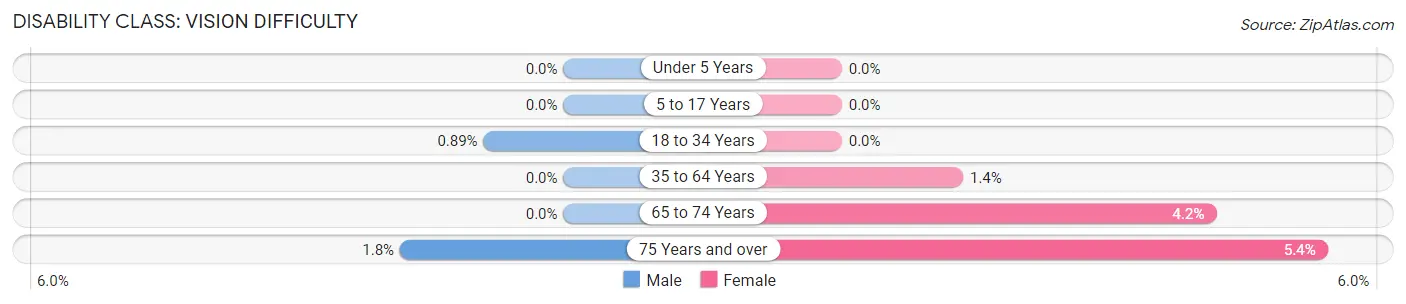
| Age Bracket | Male | Female |
| Under 5 Years | 0 (0.0%) | 0 (0.0%) |
| 5 to 17 Years | 0 (0.0%) | 0 (0.0%) |
| 18 to 34 Years | 6 (0.9%) | 0 (0.0%) |
| 35 to 64 Years | 0 (0.0%) | 30 (1.3%) |
| 65 to 74 Years | 0 (0.0%) | 19 (4.2%) |
| 75 Years and over | 8 (1.8%) | 30 (5.4%) |
Disability Class: Cognitive Difficulty
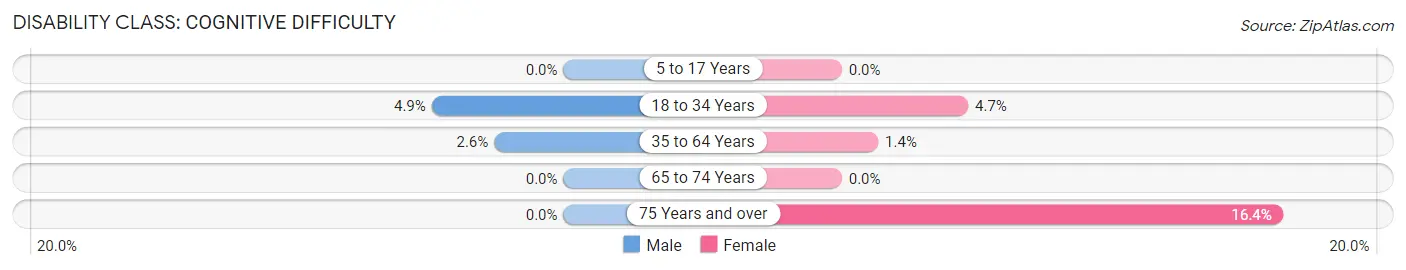
| Age Bracket | Male | Female |
| 5 to 17 Years | 0 (0.0%) | 0 (0.0%) |
| 18 to 34 Years | 33 (4.9%) | 13 (4.7%) |
| 35 to 64 Years | 51 (2.6%) | 30 (1.3%) |
| 65 to 74 Years | 0 (0.0%) | 0 (0.0%) |
| 75 Years and over | 0 (0.0%) | 91 (16.4%) |
Disability Class: Ambulatory Difficulty
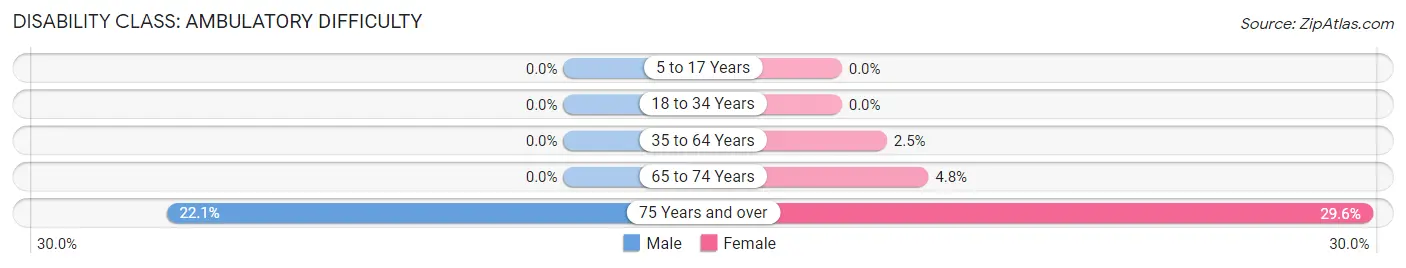
| Age Bracket | Male | Female |
| 5 to 17 Years | 0 (0.0%) | 0 (0.0%) |
| 18 to 34 Years | 0 (0.0%) | 0 (0.0%) |
| 35 to 64 Years | 0 (0.0%) | 56 (2.5%) |
| 65 to 74 Years | 0 (0.0%) | 22 (4.8%) |
| 75 Years and over | 97 (22.1%) | 164 (29.5%) |
Disability Class: Self-Care Difficulty
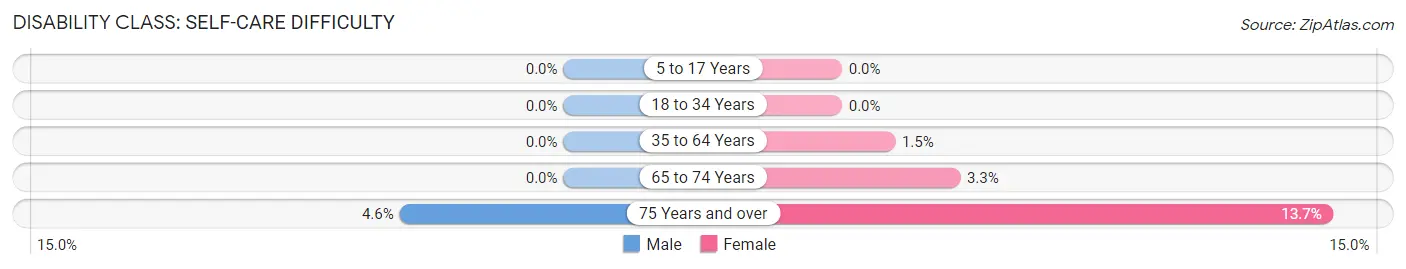
| Age Bracket | Male | Female |
| 5 to 17 Years | 0 (0.0%) | 0 (0.0%) |
| 18 to 34 Years | 0 (0.0%) | 0 (0.0%) |
| 35 to 64 Years | 0 (0.0%) | 33 (1.5%) |
| 65 to 74 Years | 0 (0.0%) | 15 (3.3%) |
| 75 Years and over | 20 (4.6%) | 76 (13.7%) |
Technology Access in Tiburon
Computing Device Access in Tiburon
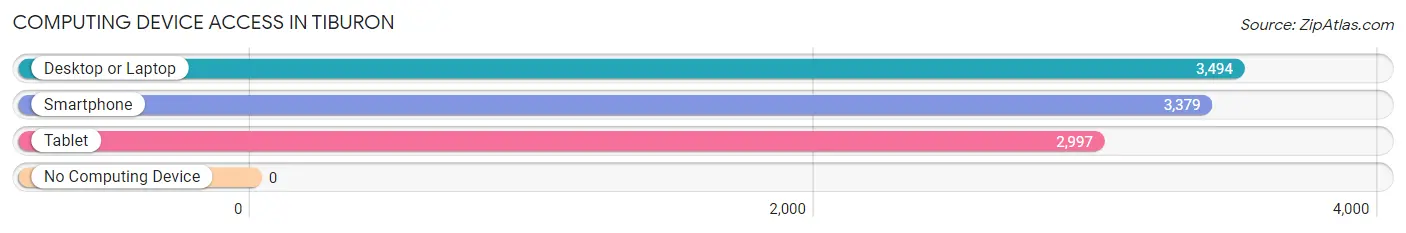
| Device Type | # Households | % Households |
| Desktop or Laptop | 3,494 | 98.2% |
| Smartphone | 3,379 | 95.0% |
| Tablet | 2,997 | 84.2% |
| No Computing Device | 0 | 0.0% |
| Total | 3,558 | 100.0% |
Internet Access in Tiburon
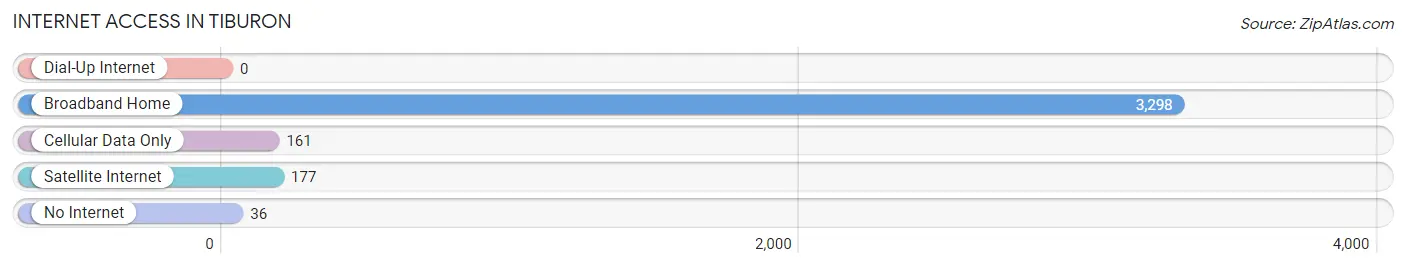
| Internet Type | # Households | % Households |
| Dial-Up Internet | 0 | 0.0% |
| Broadband Home | 3,298 | 92.7% |
| Cellular Data Only | 161 | 4.5% |
| Satellite Internet | 177 | 5.0% |
| No Internet | 36 | 1.0% |
| Total | 3,558 | 100.0% |
Tiburon Summary
Tiburon is a small town located in Marin County, California, United States. It is situated on the Tiburon Peninsula, which is bordered by the San Francisco Bay to the east and the Pacific Ocean to the west. The town has a population of approximately 8,962 people as of the 2010 census.
History
Tiburon was originally inhabited by the Coast Miwok Native American tribe. The first recorded European exploration of the area was in 1775, when Spanish explorer Juan de Ayala sailed into the San Francisco Bay and named the area “La Boca del Puerto de San Francisco” (The Mouth of the Port of San Francisco). In 1817, Tiburon was granted to the Mexican government as part of the Rancho Corte Madera del Presidio land grant. The area was then sold to William Richardson in 1844, who established a sheep ranch.
In 1868, the town was incorporated as the Town of Tiburon. The town was named after the Spanish word for “shark”, which was inspired by the large number of sharks in the bay. In the late 19th century, Tiburon became a popular tourist destination, with visitors coming to take advantage of the mild climate and scenic views.
Geography
Tiburon is located at 38°00′N 122°27′W (38.00, -122.27). It is situated on the Tiburon Peninsula, which is bordered by the San Francisco Bay to the east and the Pacific Ocean to the west. The town has a total area of 4.2 square miles, of which 2.8 square miles is land and 1.4 square miles is water.
The town is located in the San Francisco Bay Area, and is part of the San Francisco-Oakland-Hayward metropolitan area. It is located approximately 10 miles north of San Francisco and 25 miles south of Napa.
Economy
Tiburon’s economy is largely based on tourism and retail. The town is home to several restaurants, shops, and galleries, as well as a marina and yacht club. The town is also home to several corporate offices, including those of Autodesk, Inc., and the Tiburon Yacht Club.
Demographics
As of the 2010 census, Tiburon had a population of 8,962 people. The racial makeup of the town was 79.2% White, 1.2% African American, 0.3% Native American, 11.2% Asian, 0.1% Pacific Islander, 4.2% from other races, and 3.9% from two or more races. Hispanic or Latino of any race were 11.2% of the population.
The median income for a household in the town was $107,811, and the median income for a family was $125,917. The per capita income for the town was $63,945. About 4.2% of families and 5.7% of the population were below the poverty line, including 6.2% of those under age 18 and 3.2% of those age 65 or over.
Common Questions
What is Per Capita Income in Tiburon?
Per Capita income in Tiburon is $124,089.
What is the Median Family Income in Tiburon?
Median Family Income in Tiburon is $250,001.
What is the Median Household income in Tiburon?
Median Household Income in Tiburon is $200,886.
What is Income or Wage Gap in Tiburon?
Income or Wage Gap in Tiburon is 21.8%.
Women in Tiburon earn 78.2 cents for every dollar earned by a man.
What is Inequality or Gini Index in Tiburon?
Inequality or Gini Index in Tiburon is 0.48.
What is the Total Population of Tiburon?
Total Population of Tiburon is 9,115.
What is the Total Male Population of Tiburon?
Total Male Population of Tiburon is 4,696.
What is the Total Female Population of Tiburon?
Total Female Population of Tiburon is 4,419.
What is the Ratio of Males per 100 Females in Tiburon?
There are 106.27 Males per 100 Females in Tiburon.
What is the Ratio of Females per 100 Males in Tiburon?
There are 94.10 Females per 100 Males in Tiburon.
What is the Median Population Age in Tiburon?
Median Population Age in Tiburon is 49.3 Years.
What is the Average Family Size in Tiburon
Average Family Size in Tiburon is 3.0 People.
What is the Average Household Size in Tiburon
Average Household Size in Tiburon is 2.5 People.
How Large is the Labor Force in Tiburon?
There are 4,580 People in the Labor Forcein in Tiburon.
What is the Percentage of People in the Labor Force in Tiburon?
60.4% of People are in the Labor Force in Tiburon.
What is the Unemployment Rate in Tiburon?
Unemployment Rate in Tiburon is 9.5%.