Villa Park, CA Map & Demographics
Villa Park Map
Villa Park Overview
$96,167
PER CAPITA INCOME
$212,540
AVG FAMILY INCOME
$189,306
AVG HOUSEHOLD INCOME
52.0%
WAGE / INCOME GAP [ % ]
48.0¢/ $1
WAGE / INCOME GAP [ $ ]
$14,290
FAMILY INCOME DEFICIT
0.52
INEQUALITY / GINI INDEX
5,814
TOTAL POPULATION
2,761
MALE POPULATION
3,053
FEMALE POPULATION
90.44
MALES / 100 FEMALES
110.58
FEMALES / 100 MALES
51.7
MEDIAN AGE
3.2
AVG FAMILY SIZE
3.0
AVG HOUSEHOLD SIZE
2,433
LABOR FORCE [ PEOPLE ]
50.9%
PERCENT IN LABOR FORCE
1.3%
UNEMPLOYMENT RATE
Villa Park Zip Codes
Income in Villa Park
Income Overview in Villa Park
Per Capita Income in Villa Park is $96,167, while median incomes of families and households are $212,540 and $189,306 respectively.
| Characteristic | Number | Measure |
| Per Capita Income | 5,814 | $96,167 |
| Median Family Income | 1,657 | $212,540 |
| Mean Family Income | 1,657 | $302,790 |
| Median Household Income | 1,926 | $189,306 |
| Mean Household Income | 1,926 | $280,446 |
| Income Deficit | 1,657 | $14,290 |
| Wage / Income Gap (%) | 5,814 | 51.95% |
| Wage / Income Gap ($) | 5,814 | 48.05¢ per $1 |
| Gini / Inequality Index | 5,814 | 0.52 |
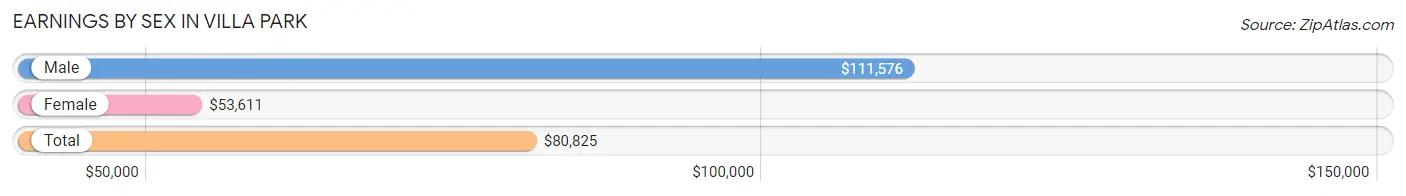
Earnings by Sex in Villa Park
Average Earnings in Villa Park are $80,825, $111,576 for men and $53,611 for women, a difference of 51.9%.
| Sex | Number | Average Earnings |
| Male | 1,347 (52.8%) | $111,576 |
| Female | 1,206 (47.2%) | $53,611 |
| Total | 2,553 (100.0%) | $80,825 |
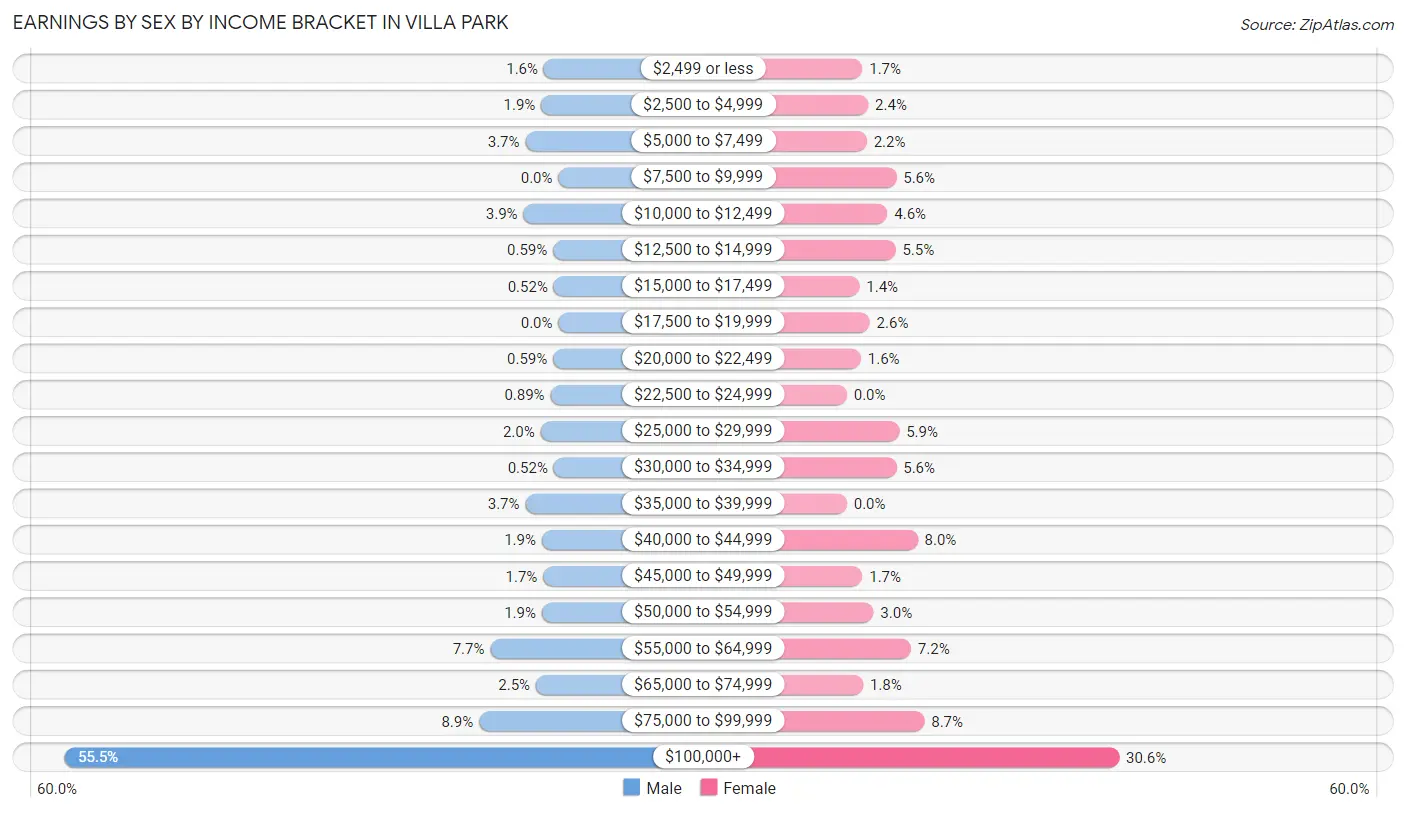
Earnings by Sex by Income Bracket in Villa Park
The most common earnings brackets in Villa Park are $100,000+ for men (747 | 55.5%) and $100,000+ for women (369 | 30.6%).
| Income | Male | Female |
| $2,499 or less | 22 (1.6%) | 21 (1.7%) |
| $2,500 to $4,999 | 26 (1.9%) | 29 (2.4%) |
| $5,000 to $7,499 | 50 (3.7%) | 27 (2.2%) |
| $7,500 to $9,999 | 0 (0.0%) | 67 (5.6%) |
| $10,000 to $12,499 | 53 (3.9%) | 55 (4.6%) |
| $12,500 to $14,999 | 8 (0.6%) | 66 (5.5%) |
| $15,000 to $17,499 | 7 (0.5%) | 17 (1.4%) |
| $17,500 to $19,999 | 0 (0.0%) | 31 (2.6%) |
| $20,000 to $22,499 | 8 (0.6%) | 19 (1.6%) |
| $22,500 to $24,999 | 12 (0.9%) | 0 (0.0%) |
| $25,000 to $29,999 | 27 (2.0%) | 71 (5.9%) |
| $30,000 to $34,999 | 7 (0.5%) | 67 (5.6%) |
| $35,000 to $39,999 | 50 (3.7%) | 0 (0.0%) |
| $40,000 to $44,999 | 25 (1.9%) | 96 (8.0%) |
| $45,000 to $49,999 | 23 (1.7%) | 21 (1.7%) |
| $50,000 to $54,999 | 25 (1.9%) | 36 (3.0%) |
| $55,000 to $64,999 | 103 (7.6%) | 87 (7.2%) |
| $65,000 to $74,999 | 34 (2.5%) | 22 (1.8%) |
| $75,000 to $99,999 | 120 (8.9%) | 105 (8.7%) |
| $100,000+ | 747 (55.5%) | 369 (30.6%) |
| Total | 1,347 (100.0%) | 1,206 (100.0%) |
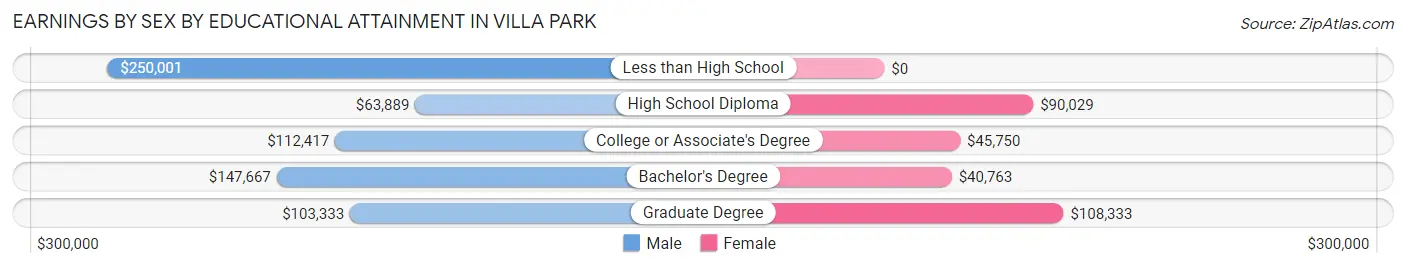
Earnings by Sex by Educational Attainment in Villa Park
Average earnings in Villa Park are $125,417 for men and $57,656 for women, a difference of 54.0%. Men with an educational attainment of less than high school enjoy the highest average annual earnings of $250,001, while those with high school diploma education earn the least with $63,889. Women with an educational attainment of graduate degree earn the most with the average annual earnings of $108,333, while those with bachelor's degree education have the smallest earnings of $40,763.
| Educational Attainment | Male Income | Female Income |
| Less than High School | $250,001 | $0 |
| High School Diploma | $63,889 | $90,029 |
| College or Associate's Degree | $112,417 | $45,750 |
| Bachelor's Degree | $147,667 | $40,763 |
| Graduate Degree | $103,333 | $108,333 |
| Total | $125,417 | $57,656 |
Family Income in Villa Park
Family Income Brackets in Villa Park
According to the Villa Park family income data, there are 828 families falling into the $200,000+ income range, which is the most common income bracket and makes up 50.0% of all families.
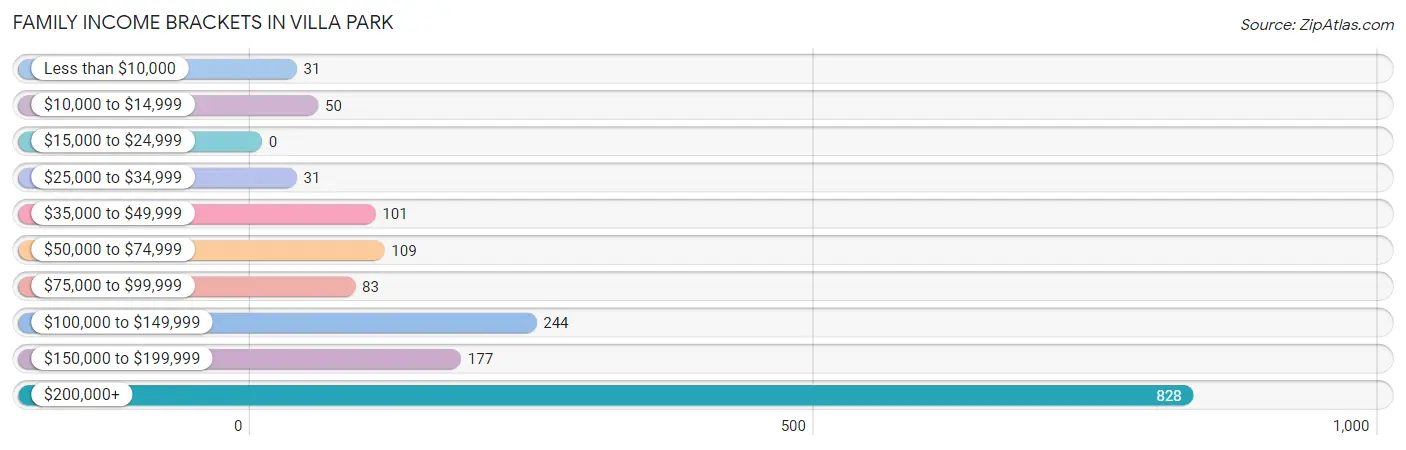
| Income Bracket | # Families | % Families |
| Less than $10,000 | 31 | 1.9% |
| $10,000 to $14,999 | 50 | 3.0% |
| $15,000 to $24,999 | 0 | 0.0% |
| $25,000 to $34,999 | 31 | 1.9% |
| $35,000 to $49,999 | 101 | 6.1% |
| $50,000 to $74,999 | 109 | 6.6% |
| $75,000 to $99,999 | 83 | 5.0% |
| $100,000 to $149,999 | 244 | 14.7% |
| $150,000 to $199,999 | 177 | 10.7% |
| $200,000+ | 828 | 50.0% |
Family Income by Famaliy Size in Villa Park
5-person families (144 | 8.7%) account for the highest median family income in Villa Park with $250,001 per family, while 2-person families (824 | 49.7%) have the highest median income of $88,026 per family member.
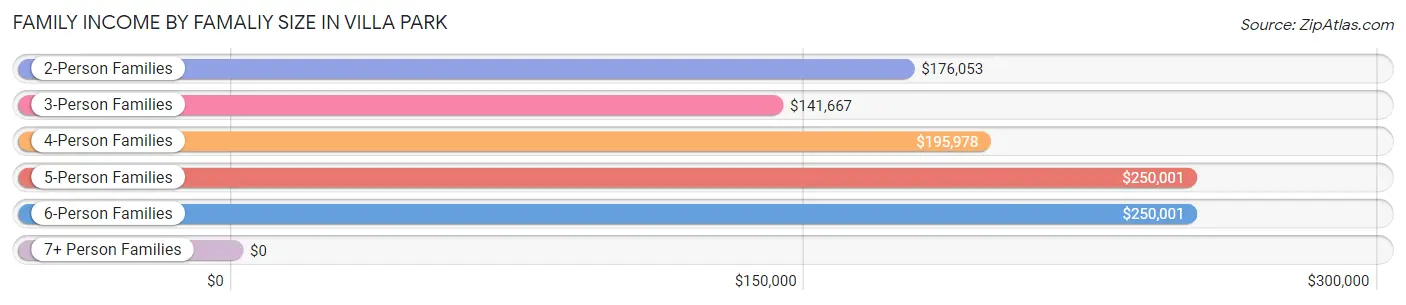
| Income Bracket | # Families | Median Income |
| 2-Person Families | 824 (49.7%) | $176,053 |
| 3-Person Families | 280 (16.9%) | $141,667 |
| 4-Person Families | 252 (15.2%) | $195,978 |
| 5-Person Families | 144 (8.7%) | $250,001 |
| 6-Person Families | 135 (8.2%) | $250,001 |
| 7+ Person Families | 22 (1.3%) | $0 |
| Total | 1,657 (100.0%) | $212,540 |
Family Income by Number of Earners in Villa Park
The median family income in Villa Park is $212,540, with families comprising 2 earners (704) having the highest median family income of $250,001, while families with no earners (394) have the lowest median family income of $77,778, accounting for 42.5% and 23.8% of families, respectively.
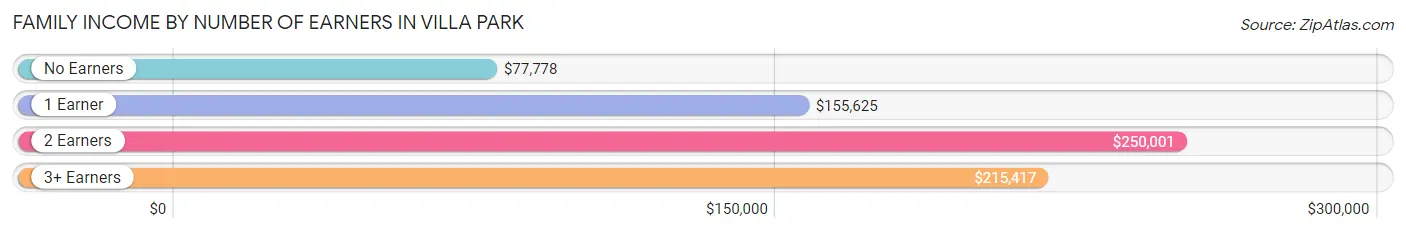
| Number of Earners | # Families | Median Income |
| No Earners | 394 (23.8%) | $77,778 |
| 1 Earner | 407 (24.6%) | $155,625 |
| 2 Earners | 704 (42.5%) | $250,001 |
| 3+ Earners | 152 (9.2%) | $215,417 |
| Total | 1,657 (100.0%) | $212,540 |
Household Income in Villa Park
Household Income Brackets in Villa Park
With 901 households falling in the category, the $200,000+ income range is the most frequent in Villa Park, accounting for 46.8% of all households. In contrast, only 8 households (0.4%) fall into the $15,000 to $24,999 income bracket, making it the least populous group.
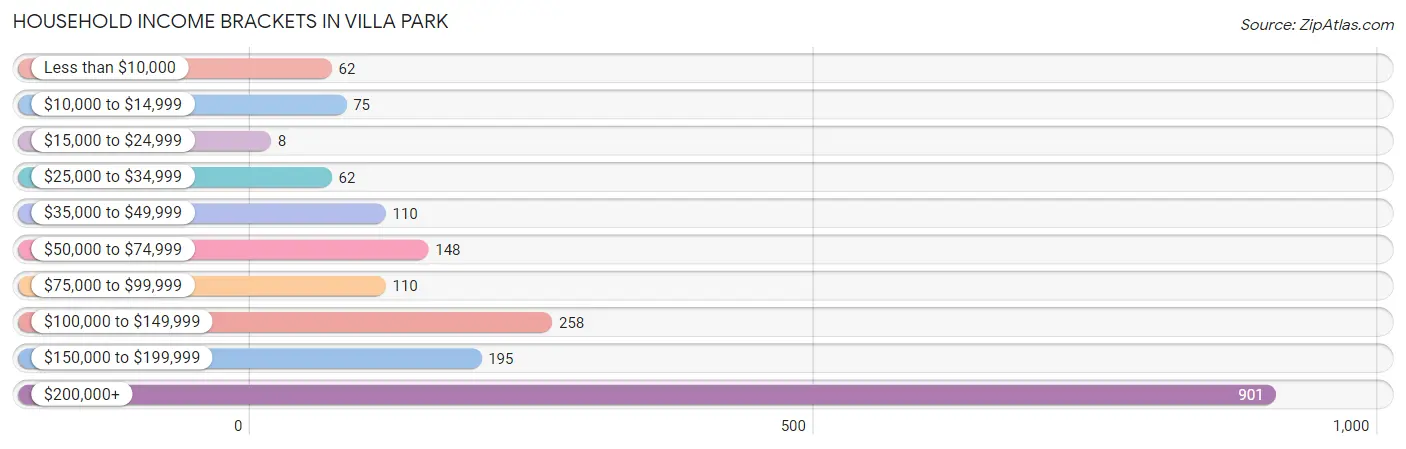
| Income Bracket | # Households | % Households |
| Less than $10,000 | 62 | 3.2% |
| $10,000 to $14,999 | 75 | 3.9% |
| $15,000 to $24,999 | 8 | 0.4% |
| $25,000 to $34,999 | 62 | 3.2% |
| $35,000 to $49,999 | 110 | 5.7% |
| $50,000 to $74,999 | 148 | 7.7% |
| $75,000 to $99,999 | 110 | 5.7% |
| $100,000 to $149,999 | 258 | 13.4% |
| $150,000 to $199,999 | 195 | 10.1% |
| $200,000+ | 901 | 46.8% |
Household Income by Householder Age in Villa Park
The median household income in Villa Park is $189,306, with the highest median household income of $250,001 found in the 25 to 44 years age bracket for the primary householder. A total of 239 households (12.4%) fall into this category.
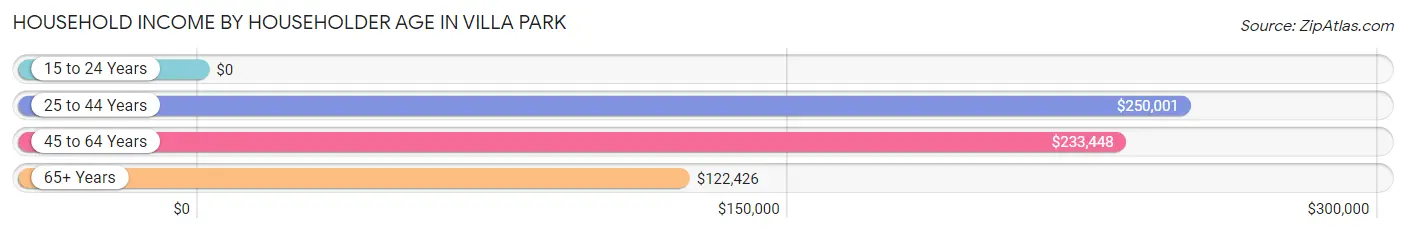
| Income Bracket | # Households | Median Income |
| 15 to 24 Years | 0 (0.0%) | $0 |
| 25 to 44 Years | 239 (12.4%) | $250,001 |
| 45 to 64 Years | 748 (38.8%) | $233,448 |
| 65+ Years | 939 (48.7%) | $122,426 |
| Total | 1,926 (100.0%) | $189,306 |
Poverty in Villa Park
Income Below Poverty by Sex and Age in Villa Park
With 4.3% poverty level for males and 9.7% for females among the residents of Villa Park, 55 to 64 year old males and under 5 year old females are the most vulnerable to poverty, with 55 males (12.0%) and 79 females (58.1%) in their respective age groups living below the poverty level.
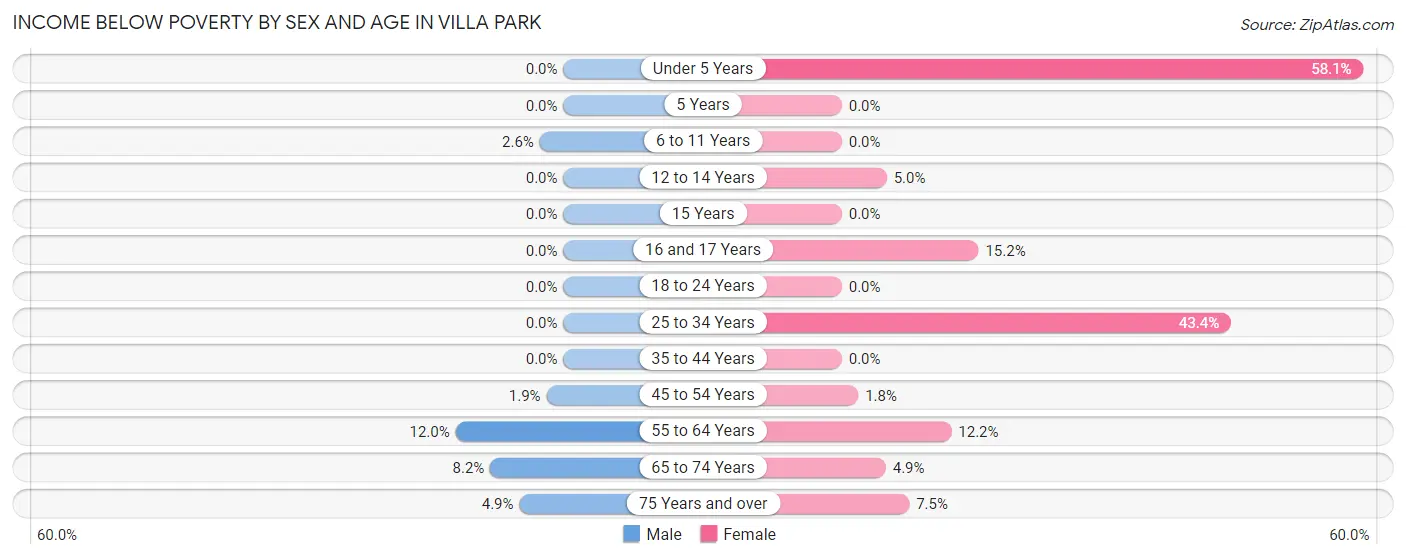
| Age Bracket | Male | Female |
| Under 5 Years | 0 (0.0%) | 79 (58.1%) |
| 5 Years | 0 (0.0%) | 0 (0.0%) |
| 6 to 11 Years | 6 (2.6%) | 0 (0.0%) |
| 12 to 14 Years | 0 (0.0%) | 6 (5.0%) |
| 15 Years | 0 (0.0%) | 0 (0.0%) |
| 16 and 17 Years | 0 (0.0%) | 7 (15.2%) |
| 18 to 24 Years | 0 (0.0%) | 0 (0.0%) |
| 25 to 34 Years | 0 (0.0%) | 75 (43.3%) |
| 35 to 44 Years | 0 (0.0%) | 0 (0.0%) |
| 45 to 54 Years | 6 (1.9%) | 6 (1.8%) |
| 55 to 64 Years | 55 (12.0%) | 62 (12.2%) |
| 65 to 74 Years | 38 (8.2%) | 24 (4.9%) |
| 75 Years and over | 14 (4.9%) | 38 (7.5%) |
| Total | 119 (4.3%) | 297 (9.7%) |
Income Above Poverty by Sex and Age in Villa Park
According to the poverty statistics in Villa Park, males aged under 5 years and females aged 5 years are the age groups that are most secure financially, with 100.0% of males and 100.0% of females in these age groups living above the poverty line.
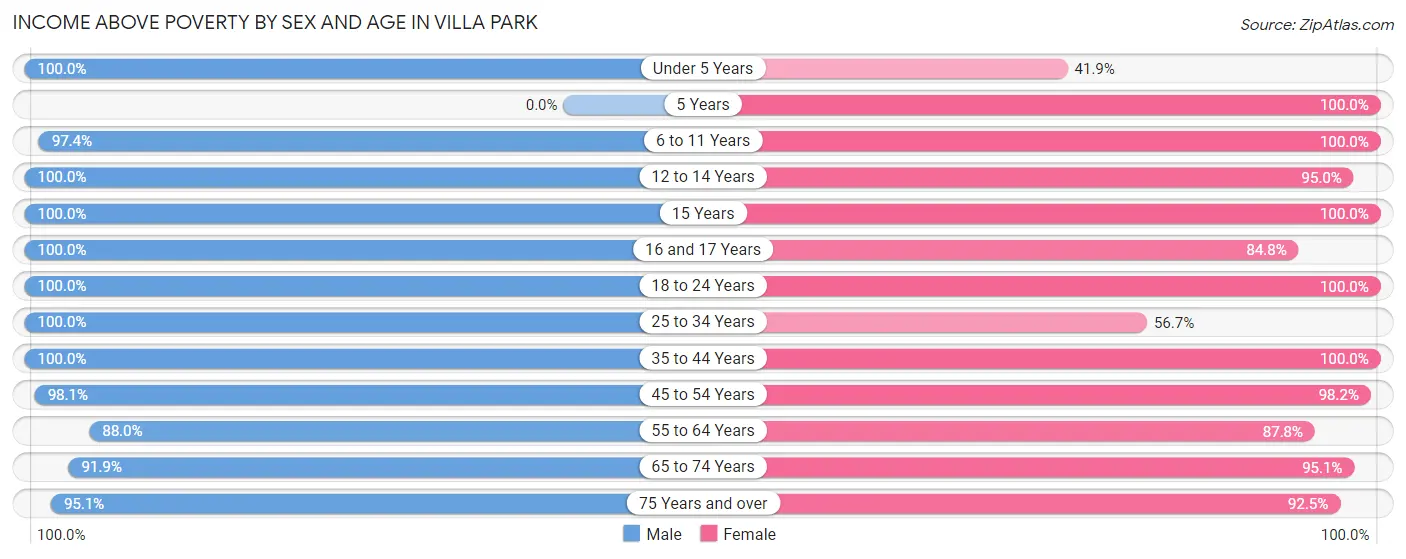
| Age Bracket | Male | Female |
| Under 5 Years | 65 (100.0%) | 57 (41.9%) |
| 5 Years | 0 (0.0%) | 15 (100.0%) |
| 6 to 11 Years | 221 (97.4%) | 238 (100.0%) |
| 12 to 14 Years | 191 (100.0%) | 114 (95.0%) |
| 15 Years | 32 (100.0%) | 10 (100.0%) |
| 16 and 17 Years | 148 (100.0%) | 39 (84.8%) |
| 18 to 24 Years | 142 (100.0%) | 117 (100.0%) |
| 25 to 34 Years | 160 (100.0%) | 98 (56.7%) |
| 35 to 44 Years | 266 (100.0%) | 366 (100.0%) |
| 45 to 54 Years | 314 (98.1%) | 322 (98.2%) |
| 55 to 64 Years | 403 (88.0%) | 446 (87.8%) |
| 65 to 74 Years | 428 (91.8%) | 466 (95.1%) |
| 75 Years and over | 272 (95.1%) | 468 (92.5%) |
| Total | 2,642 (95.7%) | 2,756 (90.3%) |
Income Below Poverty Among Married-Couple Families in Villa Park
The poverty statistics for married-couple families in Villa Park show that 5.8% or 87 of the total 1,509 families live below the poverty line. Families with 1 or 2 children have the highest poverty rate of 16.1%, comprising of 49 families. On the other hand, families with 3 or 4 children have the lowest poverty rate of 3.1%, which includes 6 families.
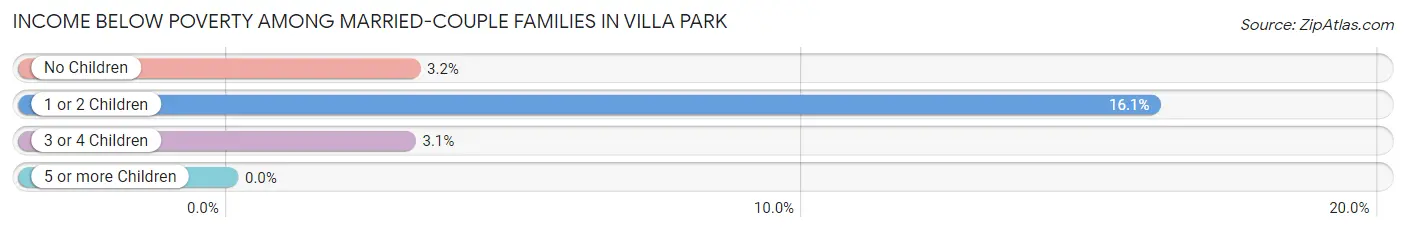
| Children | Above Poverty | Below Poverty |
| No Children | 978 (96.8%) | 32 (3.2%) |
| 1 or 2 Children | 256 (83.9%) | 49 (16.1%) |
| 3 or 4 Children | 188 (96.9%) | 6 (3.1%) |
| 5 or more Children | 0 (0.0%) | 0 (0.0%) |
| Total | 1,422 (94.2%) | 87 (5.8%) |
Income Below Poverty Among Single-Parent Households in Villa Park
| Children | Single Father | Single Mother |
| No Children | 0 (0.0%) | 0 (0.0%) |
| 1 or 2 Children | 0 (0.0%) | 0 (0.0%) |
| 3 or 4 Children | 0 (0.0%) | 0 (0.0%) |
| 5 or more Children | 0 (0.0%) | 0 (0.0%) |
| Total | 0 (0.0%) | 0 (0.0%) |
Income Below Poverty Among Married-Couple vs Single-Parent Households in Villa Park
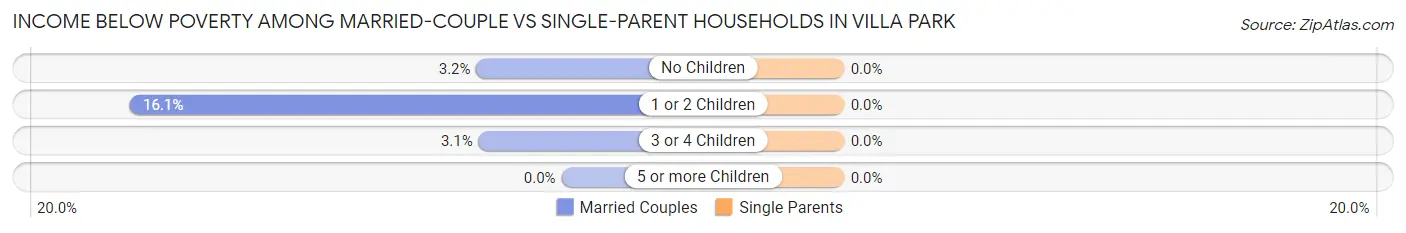
| Children | Married-Couple Families | Single-Parent Households |
| No Children | 32 (3.2%) | 0 (0.0%) |
| 1 or 2 Children | 49 (16.1%) | 0 (0.0%) |
| 3 or 4 Children | 6 (3.1%) | 0 (0.0%) |
| 5 or more Children | 0 (0.0%) | 0 (0.0%) |
| Total | 87 (5.8%) | 0 (0.0%) |
Race in Villa Park
The most populous races in Villa Park are White / Caucasian (4,105 | 70.6%), Asian (1,014 | 17.4%), and Hispanic or Latino (871 | 15.0%).
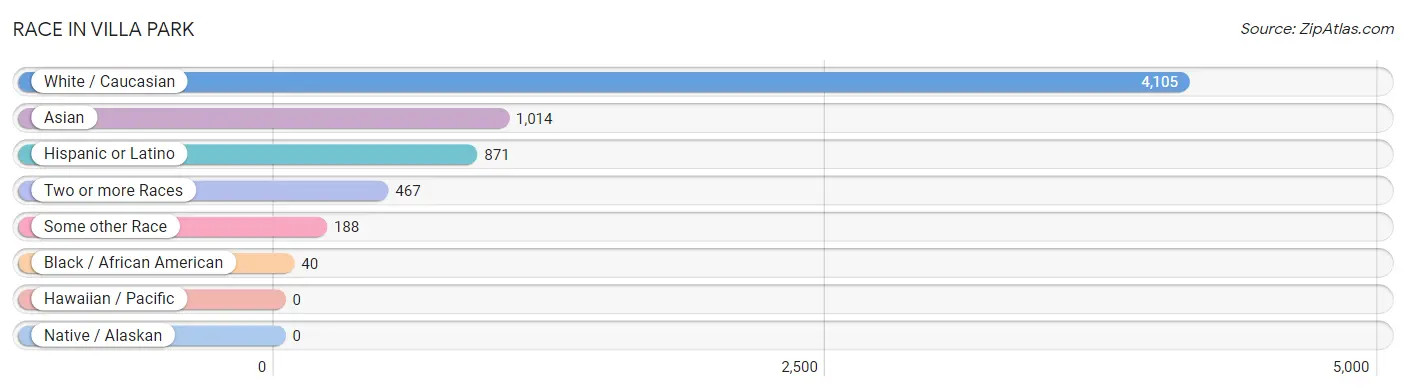
| Race | # Population | % Population |
| Asian | 1,014 | 17.4% |
| Black / African American | 40 | 0.7% |
| Hawaiian / Pacific | 0 | 0.0% |
| Hispanic or Latino | 871 | 15.0% |
| Native / Alaskan | 0 | 0.0% |
| White / Caucasian | 4,105 | 70.6% |
| Two or more Races | 467 | 8.0% |
| Some other Race | 188 | 3.2% |
| Total | 5,814 | 100.0% |
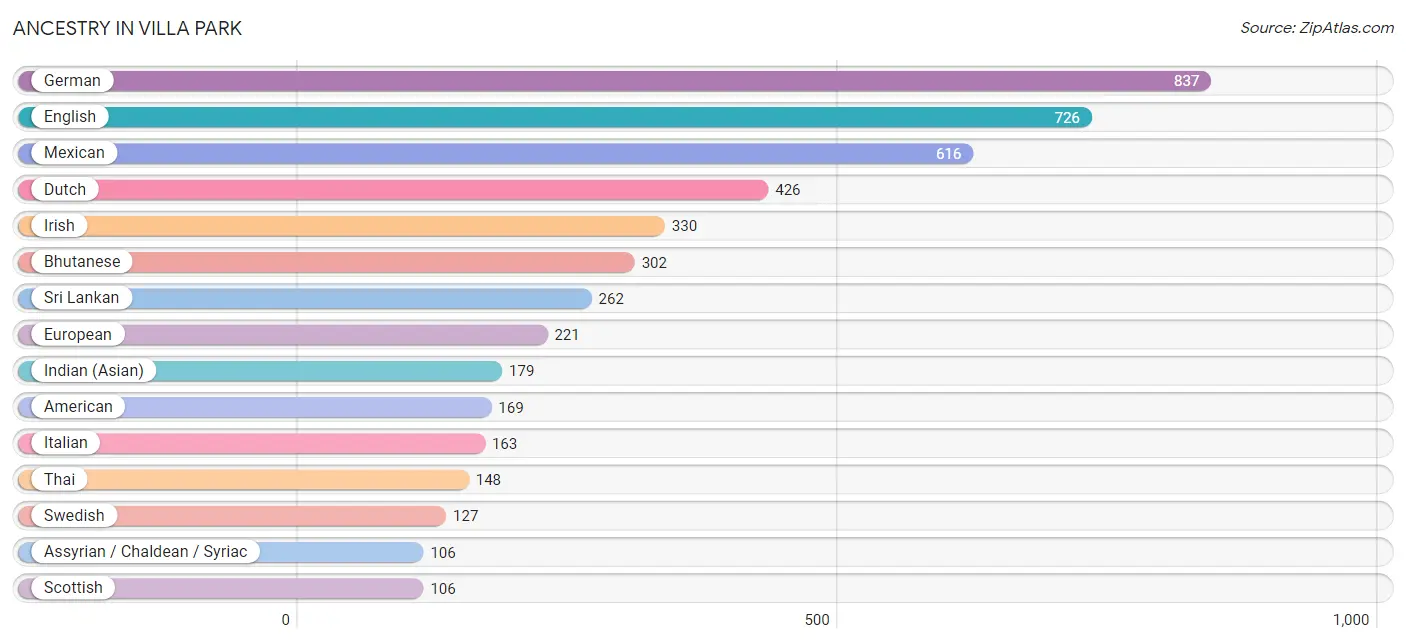
Ancestry in Villa Park
The most populous ancestries reported in Villa Park are German (837 | 14.4%), English (726 | 12.5%), Mexican (616 | 10.6%), Dutch (426 | 7.3%), and Irish (330 | 5.7%), together accounting for 50.5% of all Villa Park residents.
| Ancestry | # Population | % Population |
| American | 169 | 2.9% |
| Arab | 60 | 1.0% |
| Armenian | 58 | 1.0% |
| Assyrian / Chaldean / Syriac | 106 | 1.8% |
| Australian | 8 | 0.1% |
| Austrian | 12 | 0.2% |
| Belgian | 3 | 0.1% |
| Bhutanese | 302 | 5.2% |
| Blackfeet | 9 | 0.2% |
| Brazilian | 30 | 0.5% |
| British | 14 | 0.2% |
| Burmese | 76 | 1.3% |
| Canadian | 19 | 0.3% |
| Central American | 36 | 0.6% |
| Colombian | 9 | 0.2% |
| Croatian | 6 | 0.1% |
| Cuban | 15 | 0.3% |
| Czechoslovakian | 14 | 0.2% |
| Dutch | 426 | 7.3% |
| Eastern European | 42 | 0.7% |
| Ecuadorian | 7 | 0.1% |
| Egyptian | 37 | 0.6% |
| English | 726 | 12.5% |
| European | 221 | 3.8% |
| Filipino | 62 | 1.1% |
| French | 66 | 1.1% |
| German | 837 | 14.4% |
| Greek | 43 | 0.7% |
| Indian (Asian) | 179 | 3.1% |
| Iranian | 11 | 0.2% |
| Irish | 330 | 5.7% |
| Italian | 163 | 2.8% |
| Jordanian | 4 | 0.1% |
| Korean | 23 | 0.4% |
| Mexican | 616 | 10.6% |
| Native Hawaiian | 29 | 0.5% |
| Navajo | 8 | 0.1% |
| Northern European | 41 | 0.7% |
| Norwegian | 29 | 0.5% |
| Peruvian | 7 | 0.1% |
| Polish | 59 | 1.0% |
| Portuguese | 17 | 0.3% |
| Puerto Rican | 21 | 0.4% |
| Russian | 50 | 0.9% |
| Salvadoran | 36 | 0.6% |
| Samoan | 11 | 0.2% |
| Scandinavian | 23 | 0.4% |
| Scotch-Irish | 40 | 0.7% |
| Scottish | 106 | 1.8% |
| Slovak | 26 | 0.4% |
| South American | 23 | 0.4% |
| Spanish | 11 | 0.2% |
| Sri Lankan | 262 | 4.5% |
| Swedish | 127 | 2.2% |
| Swiss | 3 | 0.1% |
| Thai | 148 | 2.5% |
| Ukrainian | 4 | 0.1% | View All 57 Rows |
Immigrants in Villa Park
The most numerous immigrant groups reported in Villa Park came from Asia (407 | 7.0%), Latin America (134 | 2.3%), South Central Asia (134 | 2.3%), Europe (130 | 2.2%), and Eastern Asia (128 | 2.2%), together accounting for 16.0% of all Villa Park residents.
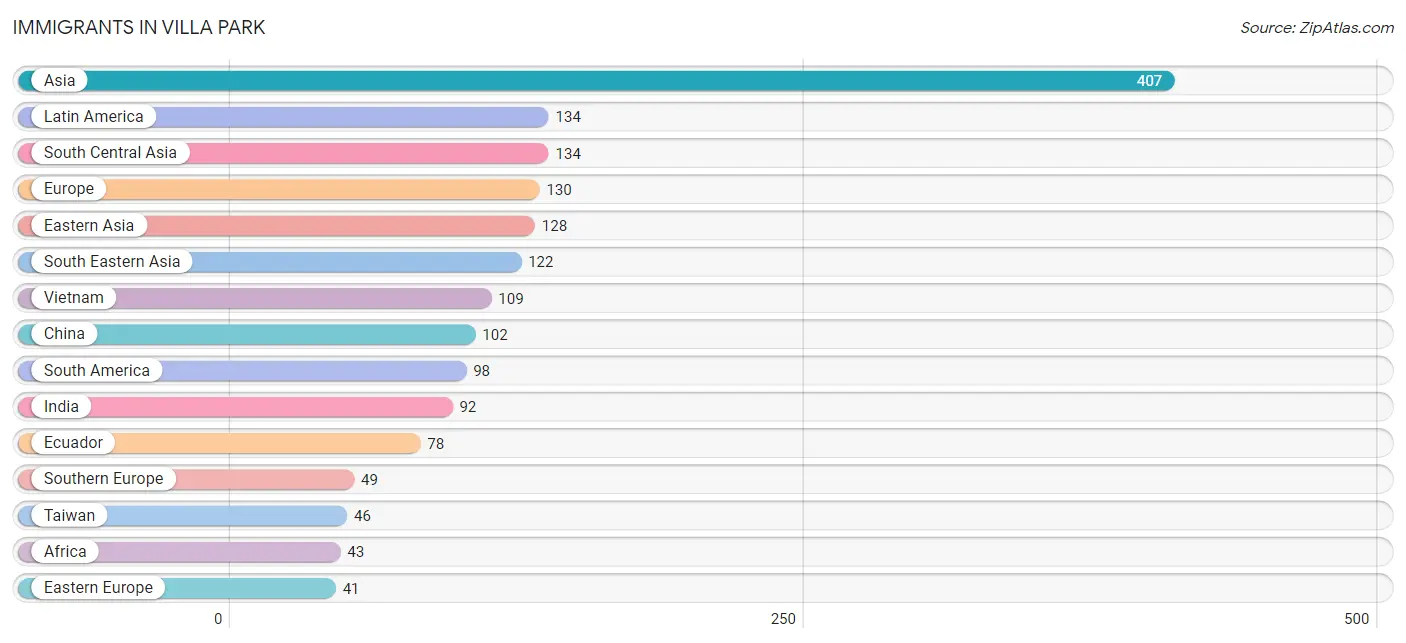
| Immigration Origin | # Population | % Population |
| Africa | 43 | 0.7% |
| Argentina | 8 | 0.1% |
| Asia | 407 | 7.0% |
| Australia | 4 | 0.1% |
| Canada | 31 | 0.5% |
| Central America | 36 | 0.6% |
| China | 102 | 1.8% |
| Colombia | 5 | 0.1% |
| Croatia | 6 | 0.1% |
| Eastern Africa | 6 | 0.1% |
| Eastern Asia | 128 | 2.2% |
| Eastern Europe | 41 | 0.7% |
| Ecuador | 78 | 1.3% |
| Egypt | 37 | 0.6% |
| El Salvador | 6 | 0.1% |
| Europe | 130 | 2.2% |
| Greece | 17 | 0.3% |
| Hong Kong | 17 | 0.3% |
| India | 92 | 1.6% |
| Iran | 35 | 0.6% |
| Iraq | 23 | 0.4% |
| Ireland | 6 | 0.1% |
| Italy | 32 | 0.5% |
| Korea | 26 | 0.4% |
| Latin America | 134 | 2.3% |
| Mexico | 30 | 0.5% |
| Netherlands | 7 | 0.1% |
| Northern Africa | 37 | 0.6% |
| Northern Europe | 33 | 0.6% |
| Oceania | 4 | 0.1% |
| Pakistan | 7 | 0.1% |
| Peru | 7 | 0.1% |
| Philippines | 13 | 0.2% |
| Russia | 35 | 0.6% |
| Scotland | 20 | 0.3% |
| South America | 98 | 1.7% |
| South Central Asia | 134 | 2.3% |
| South Eastern Asia | 122 | 2.1% |
| Southern Europe | 49 | 0.8% |
| Taiwan | 46 | 0.8% |
| Vietnam | 109 | 1.9% |
| Western Asia | 23 | 0.4% |
| Western Europe | 7 | 0.1% | View All 43 Rows |
Sex and Age in Villa Park
Sex and Age in Villa Park
The most populous age groups in Villa Park are 70 to 74 Years (276 | 10.0%) for men and 70 to 74 Years (314 | 10.3%) for women.
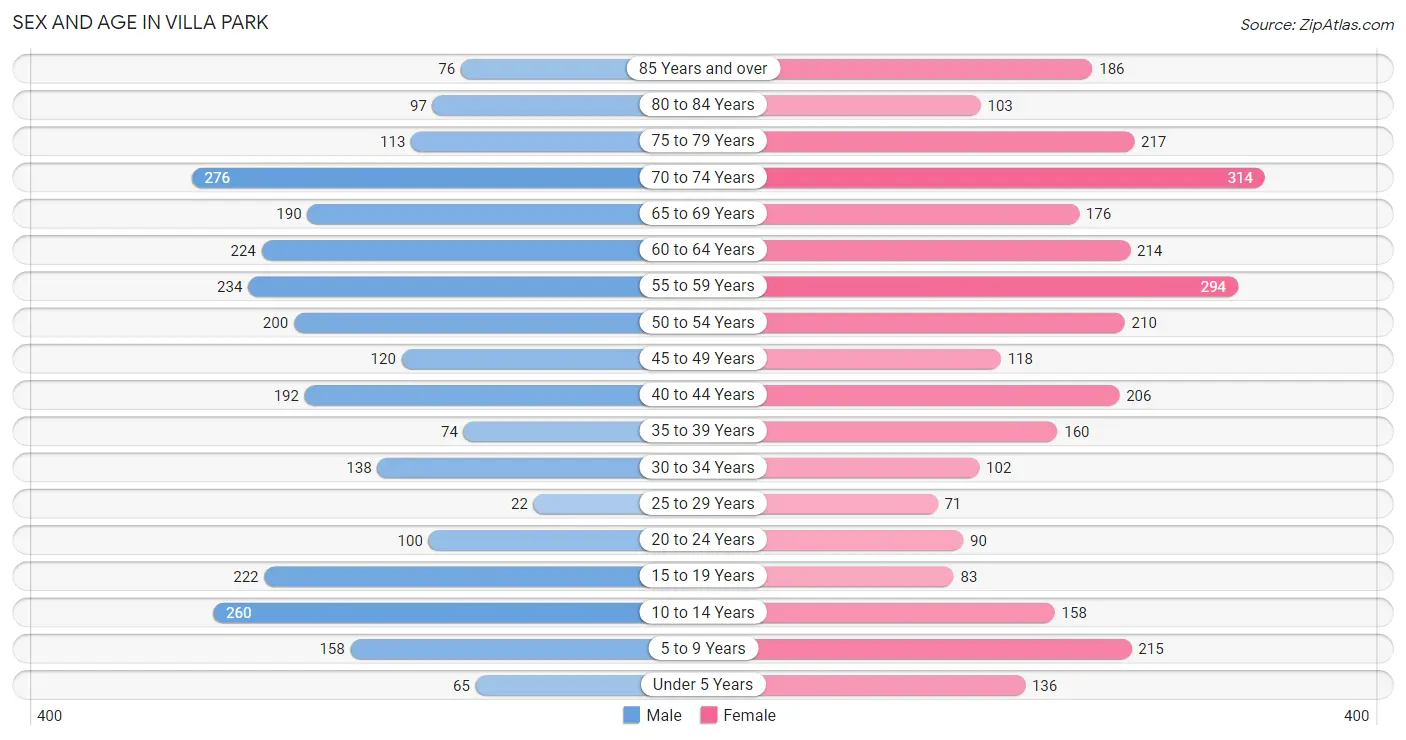
| Age Bracket | Male | Female |
| Under 5 Years | 65 (2.4%) | 136 (4.4%) |
| 5 to 9 Years | 158 (5.7%) | 215 (7.0%) |
| 10 to 14 Years | 260 (9.4%) | 158 (5.2%) |
| 15 to 19 Years | 222 (8.0%) | 83 (2.7%) |
| 20 to 24 Years | 100 (3.6%) | 90 (2.9%) |
| 25 to 29 Years | 22 (0.8%) | 71 (2.3%) |
| 30 to 34 Years | 138 (5.0%) | 102 (3.3%) |
| 35 to 39 Years | 74 (2.7%) | 160 (5.2%) |
| 40 to 44 Years | 192 (7.0%) | 206 (6.8%) |
| 45 to 49 Years | 120 (4.3%) | 118 (3.9%) |
| 50 to 54 Years | 200 (7.2%) | 210 (6.9%) |
| 55 to 59 Years | 234 (8.5%) | 294 (9.6%) |
| 60 to 64 Years | 224 (8.1%) | 214 (7.0%) |
| 65 to 69 Years | 190 (6.9%) | 176 (5.8%) |
| 70 to 74 Years | 276 (10.0%) | 314 (10.3%) |
| 75 to 79 Years | 113 (4.1%) | 217 (7.1%) |
| 80 to 84 Years | 97 (3.5%) | 103 (3.4%) |
| 85 Years and over | 76 (2.8%) | 186 (6.1%) |
| Total | 2,761 (100.0%) | 3,053 (100.0%) |
Families and Households in Villa Park
Median Family Size in Villa Park
The median family size in Villa Park is 3.24 persons per family, with married-couple families (1,509 | 91.1%) accounting for the largest median family size of 3.28 persons per family. On the other hand, single female/mother families (86 | 5.2%) represent the smallest median family size with 2.59 persons per family.
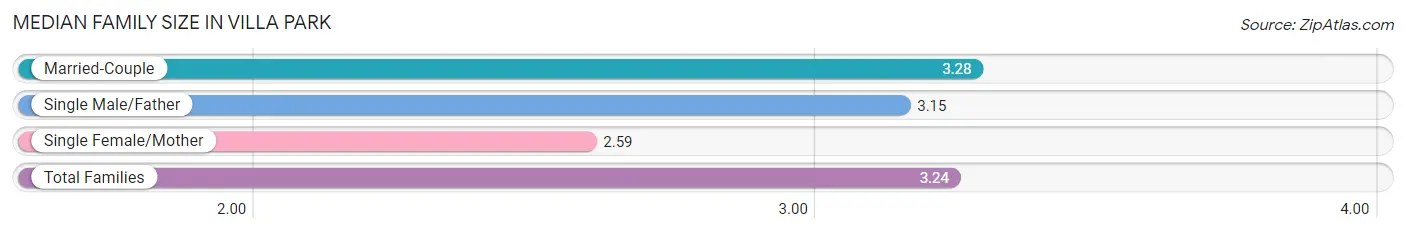
| Family Type | # Families | Family Size |
| Married-Couple | 1,509 (91.1%) | 3.28 |
| Single Male/Father | 62 (3.7%) | 3.15 |
| Single Female/Mother | 86 (5.2%) | 2.59 |
| Total Families | 1,657 (100.0%) | 3.24 |
Median Household Size in Villa Park
The median household size in Villa Park is 2.98 persons per household, with married-couple households (1,509 | 78.3%) accounting for the largest median household size of 3.29 persons per household. non-family households (269 | 14.0%) represent the smallest median household size with 1.31 persons per household.
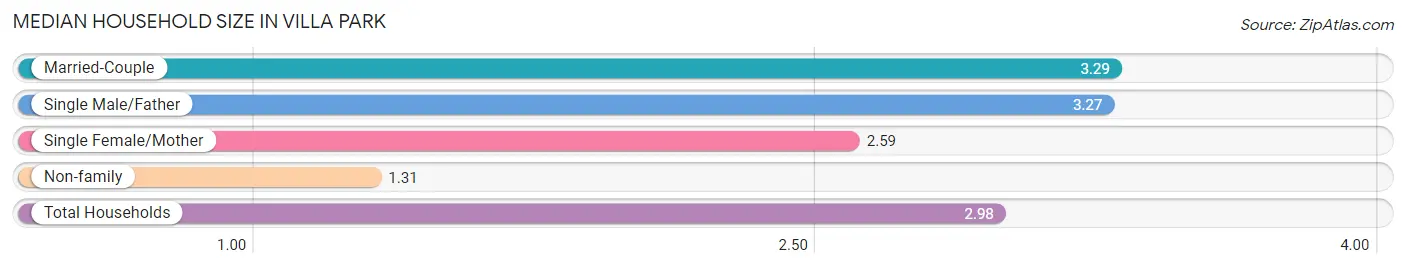
| Household Type | # Households | Household Size |
| Married-Couple | 1,509 (78.3%) | 3.29 |
| Single Male/Father | 62 (3.2%) | 3.27 |
| Single Female/Mother | 86 (4.5%) | 2.59 |
| Non-family | 269 (14.0%) | 1.31 |
| Total Households | 1,926 (100.0%) | 2.98 |
Household Size by Marriage Status in Villa Park
Out of a total of 1,926 households in Villa Park, 1,657 (86.0%) are family households, while 269 (14.0%) are nonfamily households. The most numerous type of family households are 2-person households, comprising 824, and the most common type of nonfamily households are 1-person households, comprising 216.
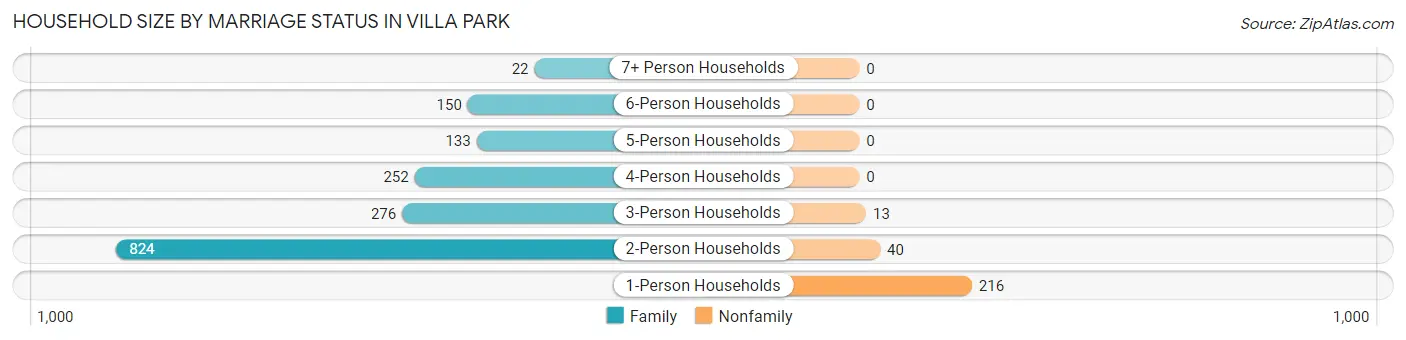
| Household Size | Family Households | Nonfamily Households |
| 1-Person Households | - | 216 (11.2%) |
| 2-Person Households | 824 (42.8%) | 40 (2.1%) |
| 3-Person Households | 276 (14.3%) | 13 (0.7%) |
| 4-Person Households | 252 (13.1%) | 0 (0.0%) |
| 5-Person Households | 133 (6.9%) | 0 (0.0%) |
| 6-Person Households | 150 (7.8%) | 0 (0.0%) |
| 7+ Person Households | 22 (1.1%) | 0 (0.0%) |
| Total | 1,657 (86.0%) | 269 (14.0%) |
Female Fertility in Villa Park
Fertility by Age in Villa Park
Average fertility rate in Villa Park is 15.0 births per 1,000 women. Women in the age bracket of 35 to 50 years have the highest fertility rate with 24.0 births per 1,000 women. Women in the age bracket of 35 to 50 years acount for 100.0% of all women with births.
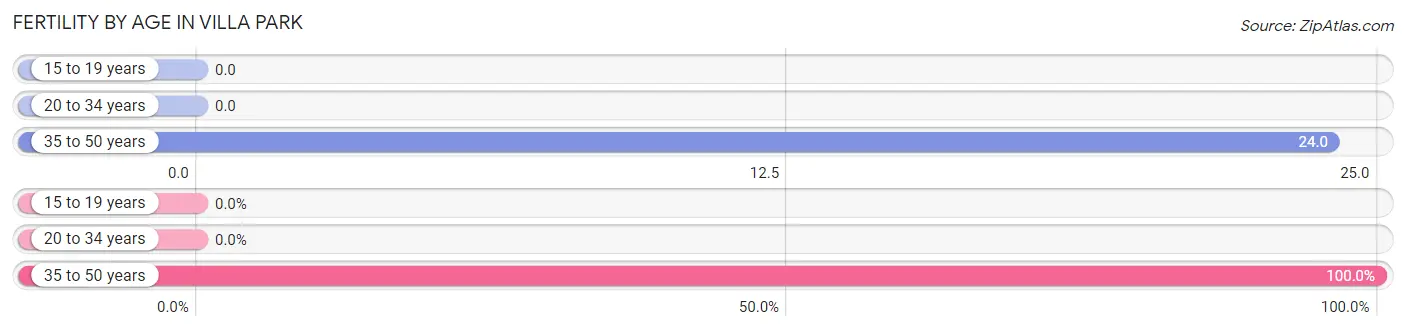
| Age Bracket | Women with Births | Births / 1,000 Women |
| 15 to 19 years | 0 (0.0%) | 0.0 |
| 20 to 34 years | 0 (0.0%) | 0.0 |
| 35 to 50 years | 13 (100.0%) | 24.0 |
| Total | 13 (100.0%) | 15.0 |
Fertility by Age by Marriage Status in Villa Park
69.2% of women with births (13) in Villa Park are married. The highest percentage of unmarried women with births falls into 35 to 50 years age bracket with 30.8% of them unmarried at the time of birth, while the lowest percentage of unmarried women with births belong to 35 to 50 years age bracket with 30.8% of them unmarried.
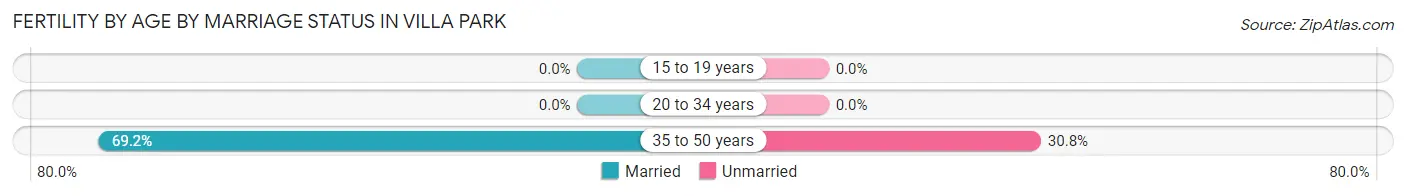
| Age Bracket | Married | Unmarried |
| 15 to 19 years | 0 (0.0%) | 0 (0.0%) |
| 20 to 34 years | 0 (0.0%) | 0 (0.0%) |
| 35 to 50 years | 9 (69.2%) | 4 (30.8%) |
| Total | 9 (69.2%) | 4 (30.8%) |
Fertility by Education in Villa Park
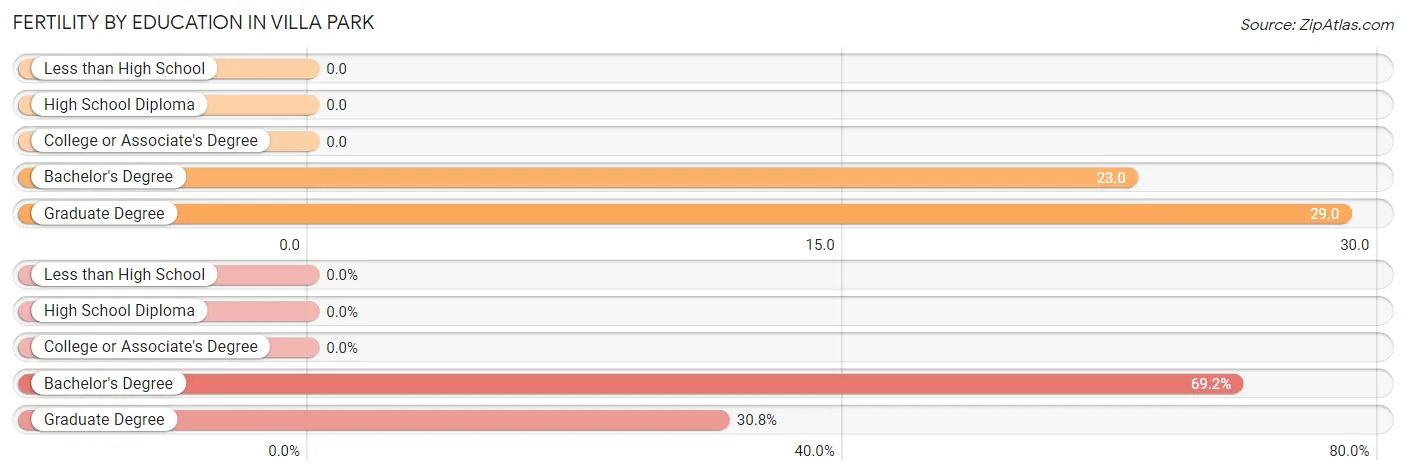
| Educational Attainment | Women with Births | Births / 1,000 Women |
| Less than High School | 0 (0.0%) | 0.0 |
| High School Diploma | 0 (0.0%) | 0.0 |
| College or Associate's Degree | 0 (0.0%) | 0.0 |
| Bachelor's Degree | 9 (69.2%) | 23.0 |
| Graduate Degree | 4 (30.8%) | 29.0 |
| Total | 13 (100.0%) | 15.0 |
Fertility by Education by Marriage Status in Villa Park
30.8% of women with births in Villa Park are unmarried. Women with the educational attainment of graduate degree are most likely to be married with 100.0% of them married at childbirth, while women with the educational attainment of bachelor's degree are least likely to be married with 44.4% of them unmarried at childbirth.
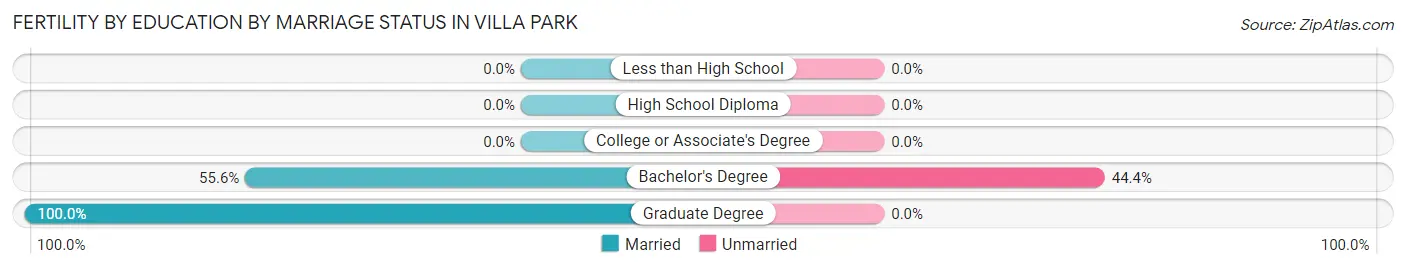
| Educational Attainment | Married | Unmarried |
| Less than High School | 0 (0.0%) | 0 (0.0%) |
| High School Diploma | 0 (0.0%) | 0 (0.0%) |
| College or Associate's Degree | 0 (0.0%) | 0 (0.0%) |
| Bachelor's Degree | 5 (55.6%) | 4 (44.4%) |
| Graduate Degree | 4 (100.0%) | 0 (0.0%) |
| Total | 9 (69.2%) | 4 (30.8%) |
Employment Characteristics in Villa Park
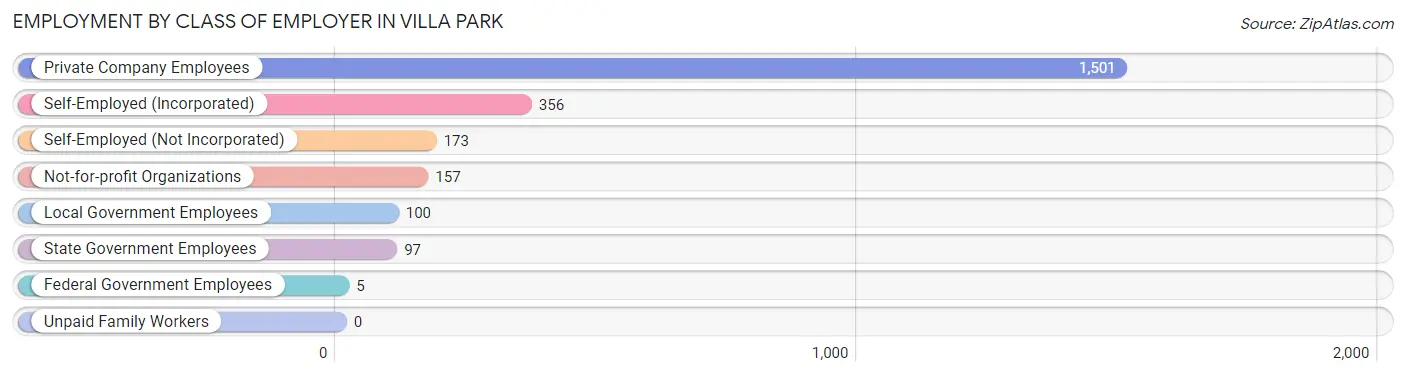
Employment by Class of Employer in Villa Park
Among the 2,389 employed individuals in Villa Park, private company employees (1,501 | 62.8%), self-employed (incorporated) (356 | 14.9%), and self-employed (not incorporated) (173 | 7.2%) make up the most common classes of employment.
| Employer Class | # Employees | % Employees |
| Private Company Employees | 1,501 | 62.8% |
| Self-Employed (Incorporated) | 356 | 14.9% |
| Self-Employed (Not Incorporated) | 173 | 7.2% |
| Not-for-profit Organizations | 157 | 6.6% |
| Local Government Employees | 100 | 4.2% |
| State Government Employees | 97 | 4.1% |
| Federal Government Employees | 5 | 0.2% |
| Unpaid Family Workers | 0 | 0.0% |
| Total | 2,389 | 100.0% |
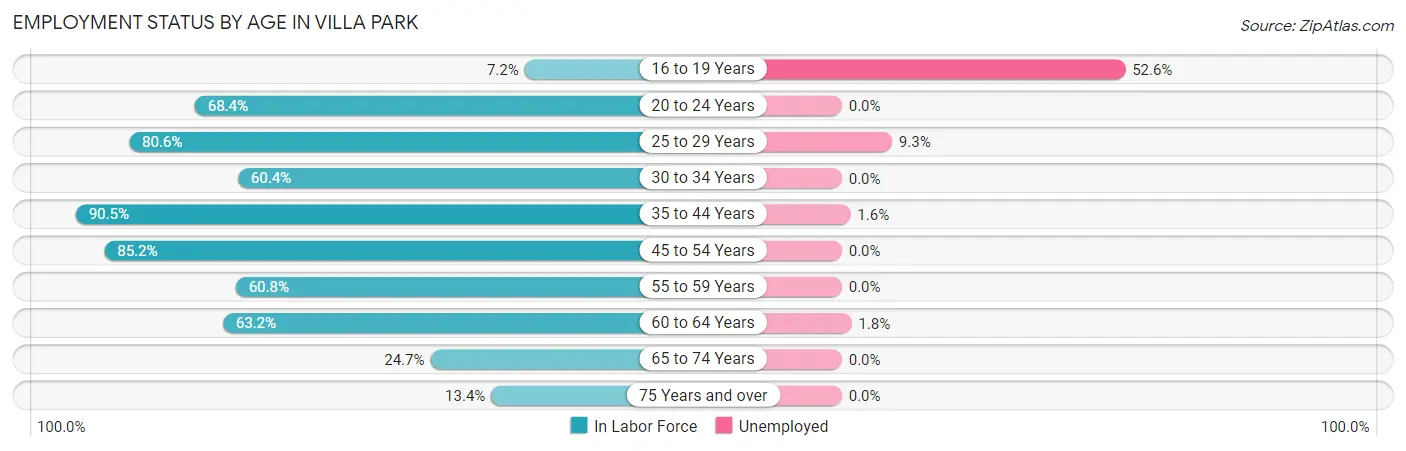
Employment Status by Age in Villa Park
According to the labor force statistics for Villa Park, out of the total population over 16 years of age (4,780), 50.9% or 2,433 individuals are in the labor force, with 1.3% or 32 of them unemployed. The age group with the highest labor force participation rate is 35 to 44 years, with 90.5% or 572 individuals in the labor force. Within the labor force, the 16 to 19 years age range has the highest percentage of unemployed individuals, with 52.6% or 10 of them being unemployed.
| Age Bracket | In Labor Force | Unemployed |
| 16 to 19 Years | 19 (7.2%) | 10 (52.6%) |
| 20 to 24 Years | 130 (68.4%) | 0 (0.0%) |
| 25 to 29 Years | 75 (80.6%) | 7 (9.3%) |
| 30 to 34 Years | 145 (60.4%) | 0 (0.0%) |
| 35 to 44 Years | 572 (90.5%) | 9 (1.6%) |
| 45 to 54 Years | 552 (85.2%) | 0 (0.0%) |
| 55 to 59 Years | 321 (60.8%) | 0 (0.0%) |
| 60 to 64 Years | 277 (63.2%) | 5 (1.8%) |
| 65 to 74 Years | 236 (24.7%) | 0 (0.0%) |
| 75 Years and over | 106 (13.4%) | 0 (0.0%) |
| Total | 2,433 (50.9%) | 32 (1.3%) |
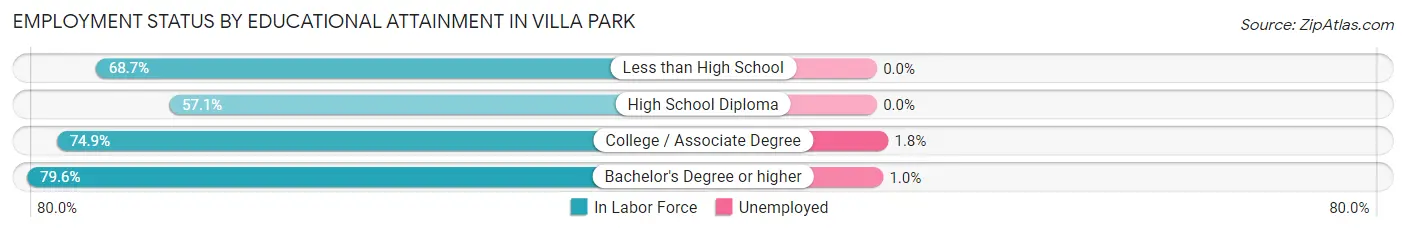
Employment Status by Educational Attainment in Villa Park
According to labor force statistics for Villa Park, 75.3% of individuals (1,942) out of the total population between 25 and 64 years of age (2,579) are in the labor force, with 1.1% or 21 of them being unemployed. The group with the highest labor force participation rate are those with the educational attainment of bachelor's degree or higher, with 79.6% or 1,214 individuals in the labor force. Within the labor force, individuals with college / associate degree education have the highest percentage of unemployment, with 1.8% or 9 of them being unemployed.
| Educational Attainment | In Labor Force | Unemployed |
| Less than High School | 57 (68.7%) | 0 (0.0%) |
| High School Diploma | 181 (57.1%) | 0 (0.0%) |
| College / Associate Degree | 490 (74.9%) | 12 (1.8%) |
| Bachelor's Degree or higher | 1,214 (79.6%) | 15 (1.0%) |
| Total | 1,942 (75.3%) | 28 (1.1%) |
Employment Occupations by Sex in Villa Park
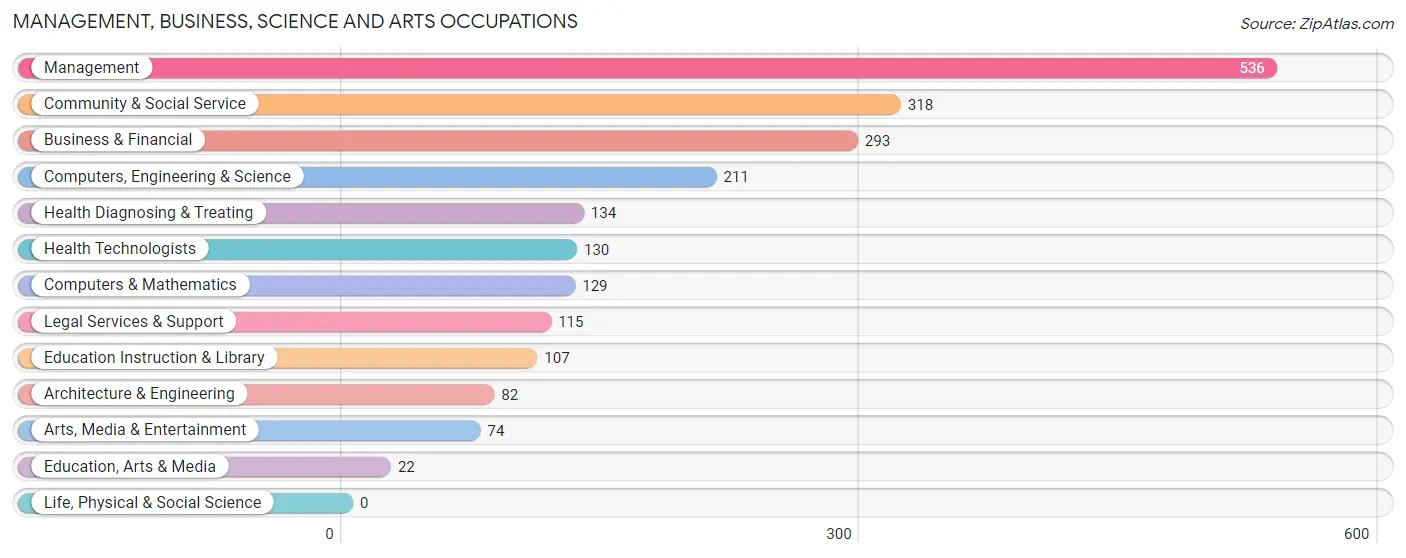
Management, Business, Science and Arts Occupations
The most common Management, Business, Science and Arts occupations in Villa Park are Management (536 | 22.3%), Community & Social Service (318 | 13.2%), Business & Financial (293 | 12.2%), Computers, Engineering & Science (211 | 8.8%), and Health Diagnosing & Treating (134 | 5.6%).
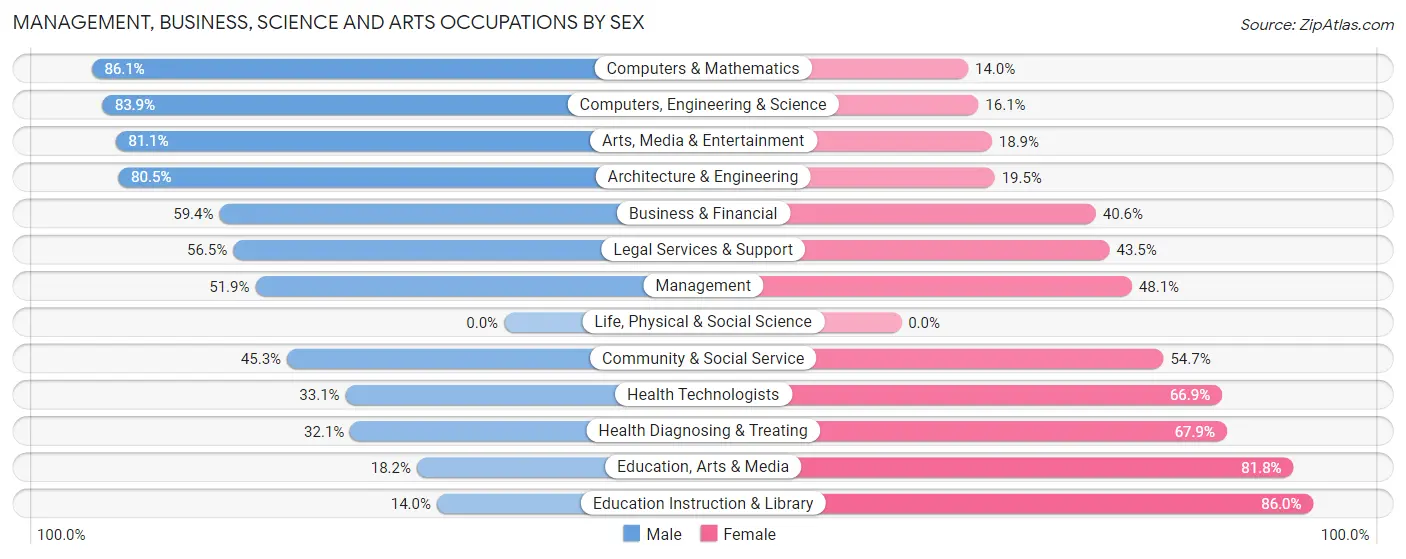
Management, Business, Science and Arts Occupations by Sex
Within the Management, Business, Science and Arts occupations in Villa Park, the most male-oriented occupations are Computers & Mathematics (86.1%), Computers, Engineering & Science (83.9%), and Arts, Media & Entertainment (81.1%), while the most female-oriented occupations are Education Instruction & Library (86.0%), Education, Arts & Media (81.8%), and Health Diagnosing & Treating (67.9%).
| Occupation | Male | Female |
| Management | 278 (51.9%) | 258 (48.1%) |
| Business & Financial | 174 (59.4%) | 119 (40.6%) |
| Computers, Engineering & Science | 177 (83.9%) | 34 (16.1%) |
| Computers & Mathematics | 111 (86.1%) | 18 (14.0%) |
| Architecture & Engineering | 66 (80.5%) | 16 (19.5%) |
| Life, Physical & Social Science | 0 (0.0%) | 0 (0.0%) |
| Community & Social Service | 144 (45.3%) | 174 (54.7%) |
| Education, Arts & Media | 4 (18.2%) | 18 (81.8%) |
| Legal Services & Support | 65 (56.5%) | 50 (43.5%) |
| Education Instruction & Library | 15 (14.0%) | 92 (86.0%) |
| Arts, Media & Entertainment | 60 (81.1%) | 14 (18.9%) |
| Health Diagnosing & Treating | 43 (32.1%) | 91 (67.9%) |
| Health Technologists | 43 (33.1%) | 87 (66.9%) |
| Total (Category) | 816 (54.7%) | 676 (45.3%) |
| Total (Overall) | 1,296 (54.0%) | 1,106 (46.0%) |
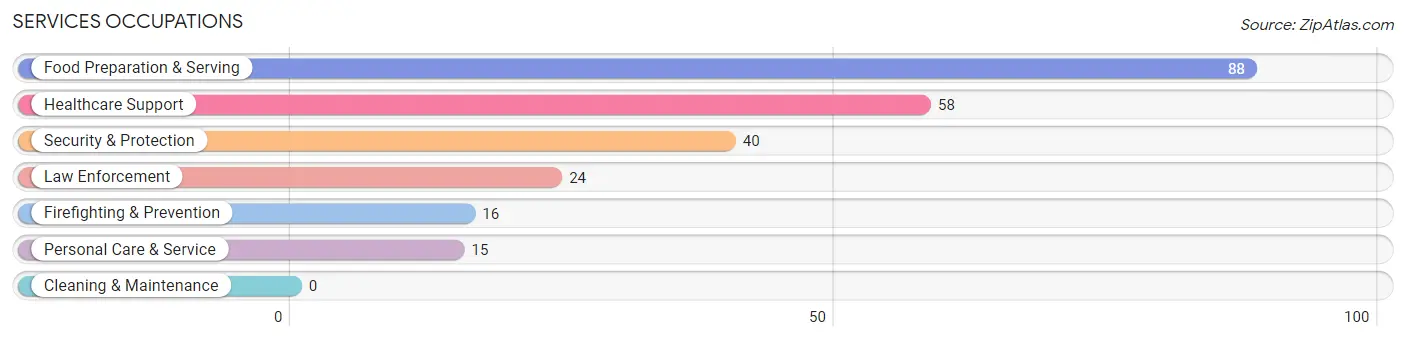
Services Occupations
The most common Services occupations in Villa Park are Food Preparation & Serving (88 | 3.7%), Healthcare Support (58 | 2.4%), Security & Protection (40 | 1.7%), Law Enforcement (24 | 1.0%), and Firefighting & Prevention (16 | 0.7%).
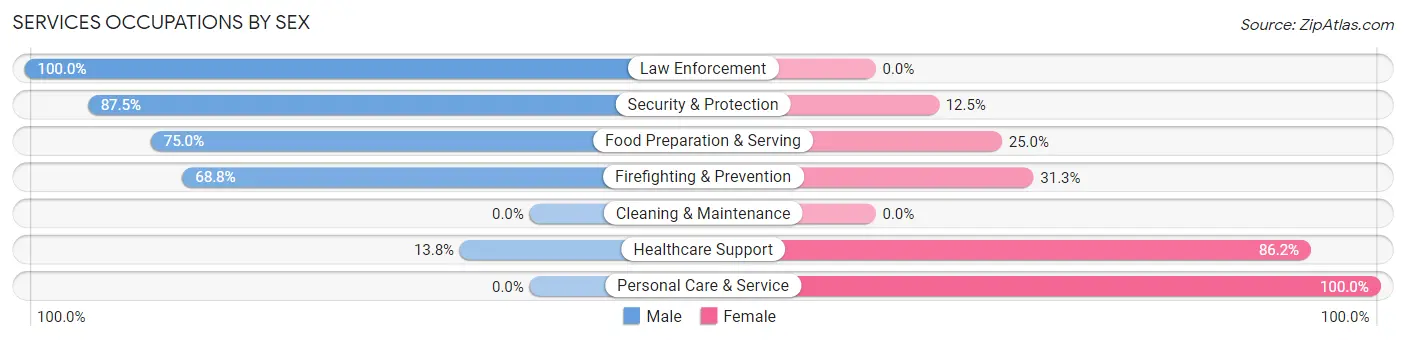
Services Occupations by Sex
Within the Services occupations in Villa Park, the most male-oriented occupations are Law Enforcement (100.0%), Security & Protection (87.5%), and Food Preparation & Serving (75.0%), while the most female-oriented occupations are Personal Care & Service (100.0%), Healthcare Support (86.2%), and Firefighting & Prevention (31.2%).
| Occupation | Male | Female |
| Healthcare Support | 8 (13.8%) | 50 (86.2%) |
| Security & Protection | 35 (87.5%) | 5 (12.5%) |
| Firefighting & Prevention | 11 (68.8%) | 5 (31.2%) |
| Law Enforcement | 24 (100.0%) | 0 (0.0%) |
| Food Preparation & Serving | 66 (75.0%) | 22 (25.0%) |
| Cleaning & Maintenance | 0 (0.0%) | 0 (0.0%) |
| Personal Care & Service | 0 (0.0%) | 15 (100.0%) |
| Total (Category) | 109 (54.2%) | 92 (45.8%) |
| Total (Overall) | 1,296 (54.0%) | 1,106 (46.0%) |
Sales and Office Occupations
The most common Sales and Office occupations in Villa Park are Sales & Related (355 | 14.8%), and Office & Administration (187 | 7.8%).
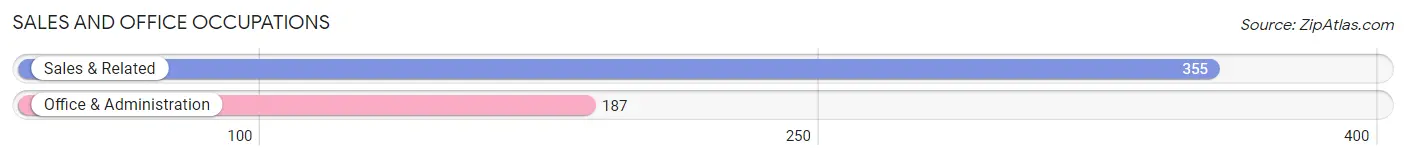
Sales and Office Occupations by Sex
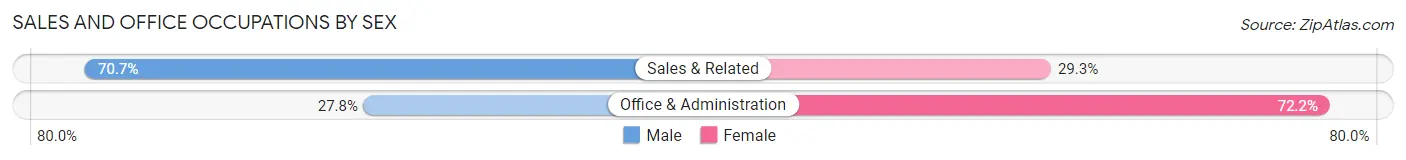
| Occupation | Male | Female |
| Sales & Related | 251 (70.7%) | 104 (29.3%) |
| Office & Administration | 52 (27.8%) | 135 (72.2%) |
| Total (Category) | 303 (55.9%) | 239 (44.1%) |
| Total (Overall) | 1,296 (54.0%) | 1,106 (46.0%) |
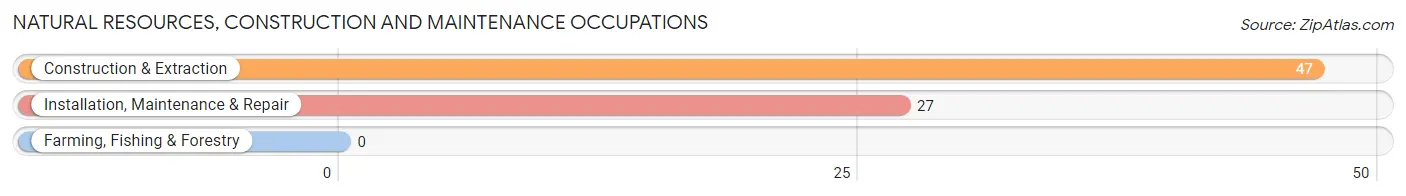
Natural Resources, Construction and Maintenance Occupations
The most common Natural Resources, Construction and Maintenance occupations in Villa Park are Construction & Extraction (47 | 2.0%), and Installation, Maintenance & Repair (27 | 1.1%).
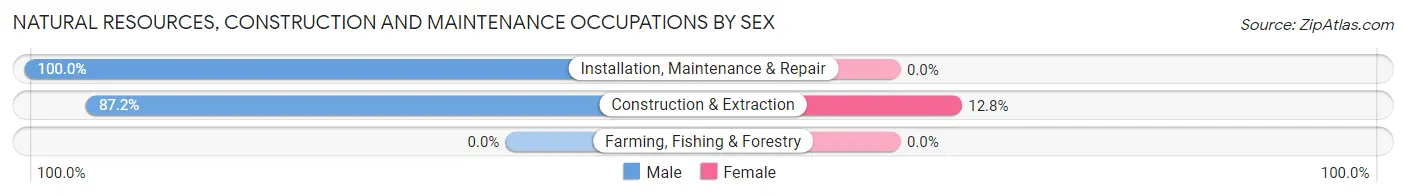
Natural Resources, Construction and Maintenance Occupations by Sex
| Occupation | Male | Female |
| Farming, Fishing & Forestry | 0 (0.0%) | 0 (0.0%) |
| Construction & Extraction | 41 (87.2%) | 6 (12.8%) |
| Installation, Maintenance & Repair | 27 (100.0%) | 0 (0.0%) |
| Total (Category) | 68 (91.9%) | 6 (8.1%) |
| Total (Overall) | 1,296 (54.0%) | 1,106 (46.0%) |
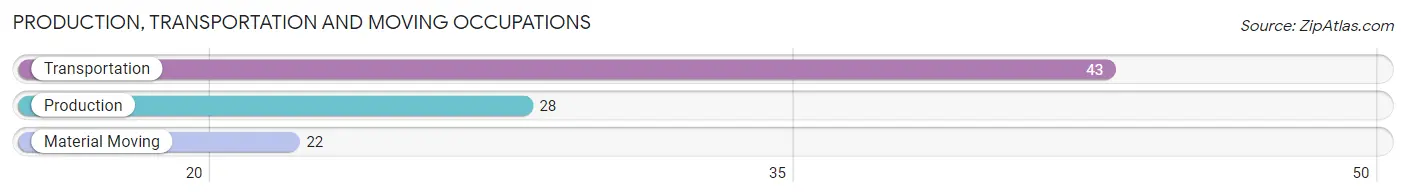
Production, Transportation and Moving Occupations
The most common Production, Transportation and Moving occupations in Villa Park are Transportation (43 | 1.8%), Production (28 | 1.2%), and Material Moving (22 | 0.9%).
Production, Transportation and Moving Occupations by Sex
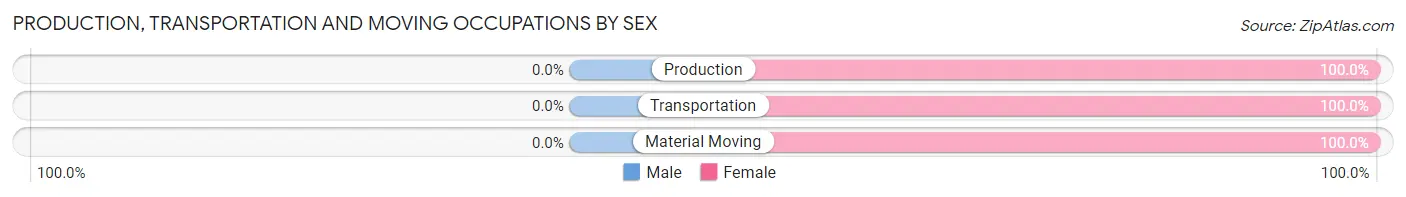
| Occupation | Male | Female |
| Production | 0 (0.0%) | 28 (100.0%) |
| Transportation | 0 (0.0%) | 43 (100.0%) |
| Material Moving | 0 (0.0%) | 22 (100.0%) |
| Total (Category) | 0 (0.0%) | 93 (100.0%) |
| Total (Overall) | 1,296 (54.0%) | 1,106 (46.0%) |
Employment Industries by Sex in Villa Park
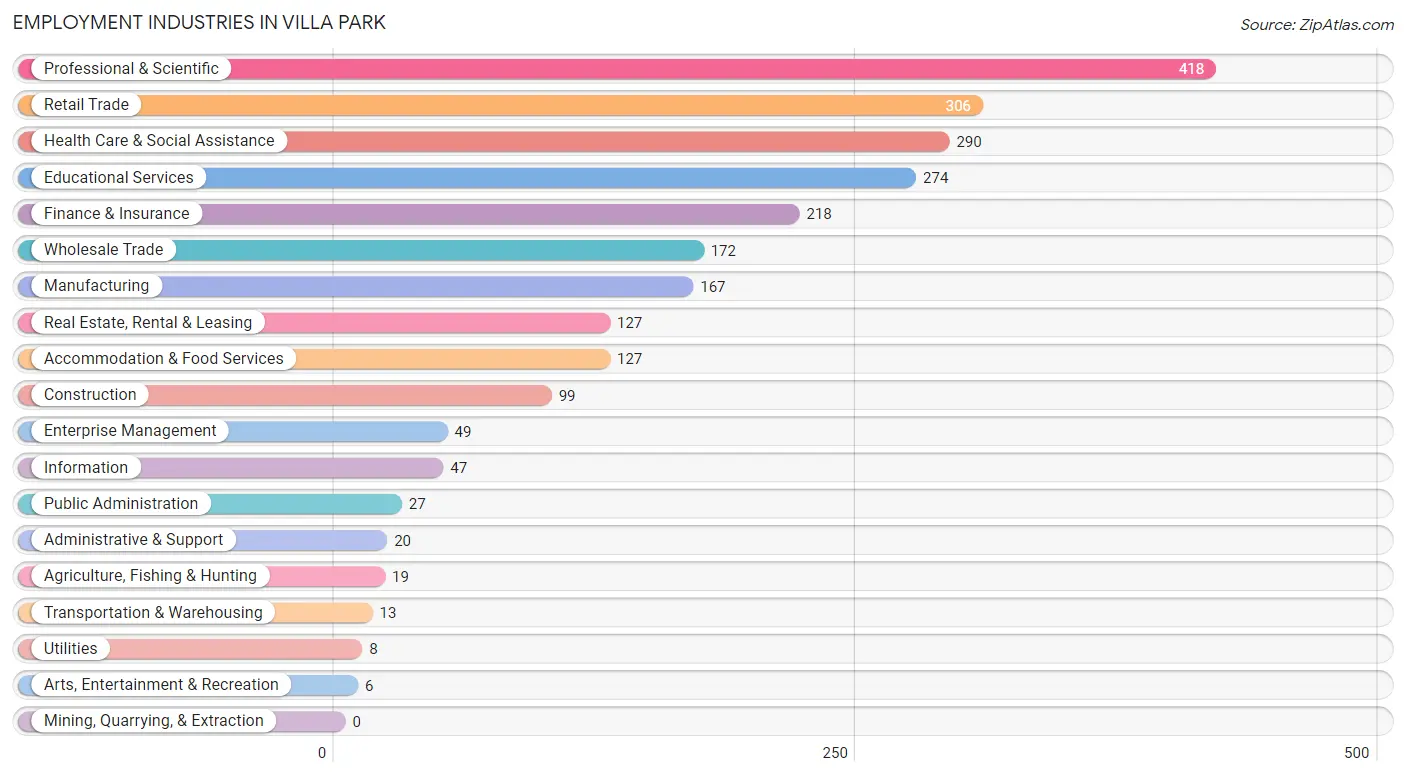
Employment Industries in Villa Park
The major employment industries in Villa Park include Professional & Scientific (418 | 17.4%), Retail Trade (306 | 12.7%), Health Care & Social Assistance (290 | 12.1%), Educational Services (274 | 11.4%), and Finance & Insurance (218 | 9.1%).
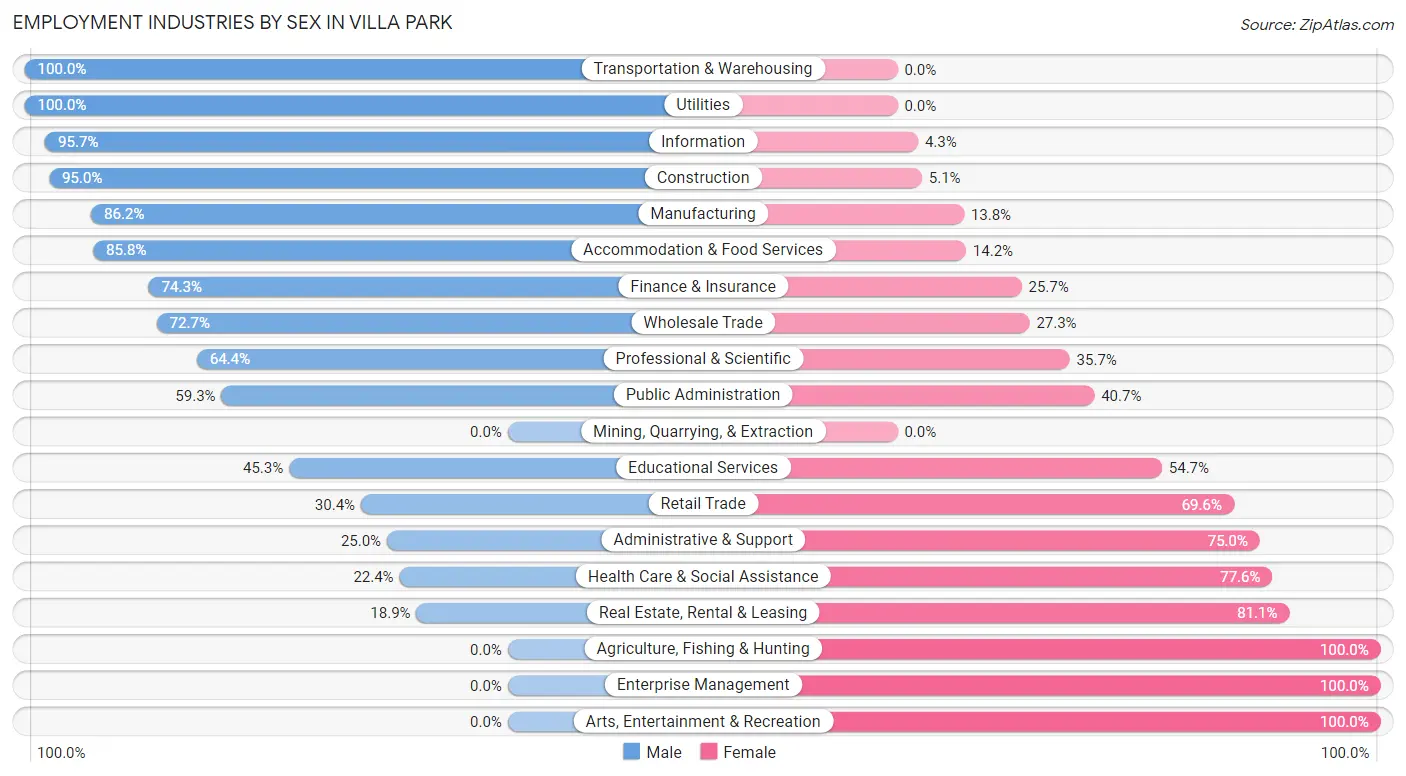
Employment Industries by Sex in Villa Park
The Villa Park industries that see more men than women are Transportation & Warehousing (100.0%), Utilities (100.0%), and Information (95.7%), whereas the industries that tend to have a higher number of women are Agriculture, Fishing & Hunting (100.0%), Enterprise Management (100.0%), and Arts, Entertainment & Recreation (100.0%).
| Industry | Male | Female |
| Agriculture, Fishing & Hunting | 0 (0.0%) | 19 (100.0%) |
| Mining, Quarrying, & Extraction | 0 (0.0%) | 0 (0.0%) |
| Construction | 94 (95.0%) | 5 (5.1%) |
| Manufacturing | 144 (86.2%) | 23 (13.8%) |
| Wholesale Trade | 125 (72.7%) | 47 (27.3%) |
| Retail Trade | 93 (30.4%) | 213 (69.6%) |
| Transportation & Warehousing | 13 (100.0%) | 0 (0.0%) |
| Utilities | 8 (100.0%) | 0 (0.0%) |
| Information | 45 (95.7%) | 2 (4.3%) |
| Finance & Insurance | 162 (74.3%) | 56 (25.7%) |
| Real Estate, Rental & Leasing | 24 (18.9%) | 103 (81.1%) |
| Professional & Scientific | 269 (64.3%) | 149 (35.6%) |
| Enterprise Management | 0 (0.0%) | 49 (100.0%) |
| Administrative & Support | 5 (25.0%) | 15 (75.0%) |
| Educational Services | 124 (45.3%) | 150 (54.7%) |
| Health Care & Social Assistance | 65 (22.4%) | 225 (77.6%) |
| Arts, Entertainment & Recreation | 0 (0.0%) | 6 (100.0%) |
| Accommodation & Food Services | 109 (85.8%) | 18 (14.2%) |
| Public Administration | 16 (59.3%) | 11 (40.7%) |
| Total | 1,296 (54.0%) | 1,106 (46.0%) |
Education in Villa Park
School Enrollment in Villa Park
The most common levels of schooling among the 1,438 students in Villa Park are elementary school (350 | 24.3%), high school (344 | 23.9%), and middle school (335 | 23.3%).
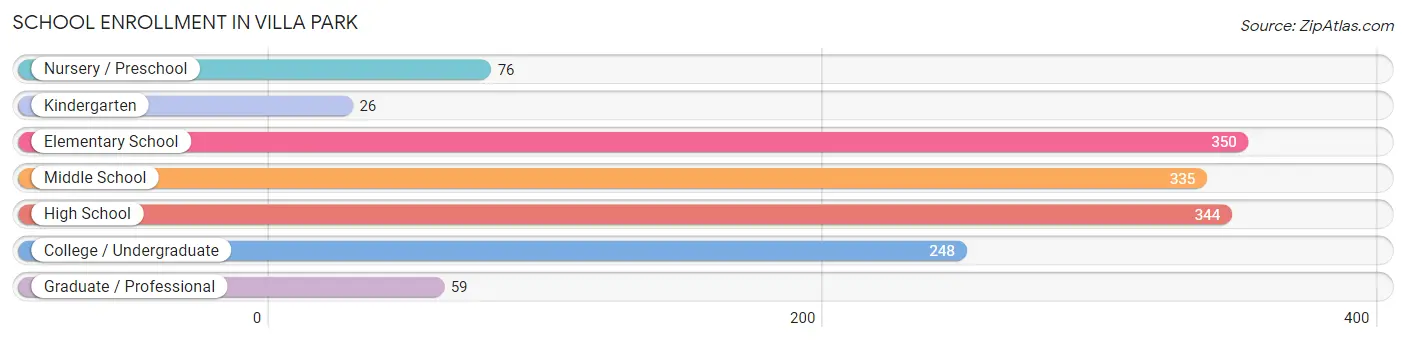
| School Level | # Students | % Students |
| Nursery / Preschool | 76 | 5.3% |
| Kindergarten | 26 | 1.8% |
| Elementary School | 350 | 24.3% |
| Middle School | 335 | 23.3% |
| High School | 344 | 23.9% |
| College / Undergraduate | 248 | 17.2% |
| Graduate / Professional | 59 | 4.1% |
| Total | 1,438 | 100.0% |
School Enrollment by Age by Funding Source in Villa Park
Out of a total of 1,438 students who are enrolled in schools in Villa Park, 561 (39.0%) attend a private institution, while the remaining 877 (61.0%) are enrolled in public schools. The age group of 5 to 9 year old has the highest likelihood of being enrolled in private schools, with 182 (49.7% in the age bracket) enrolled. Conversely, the age group of 25 to 34 year olds has the lowest likelihood of being enrolled in a private school, with 18 (100.0% in the age bracket) attending a public institution.
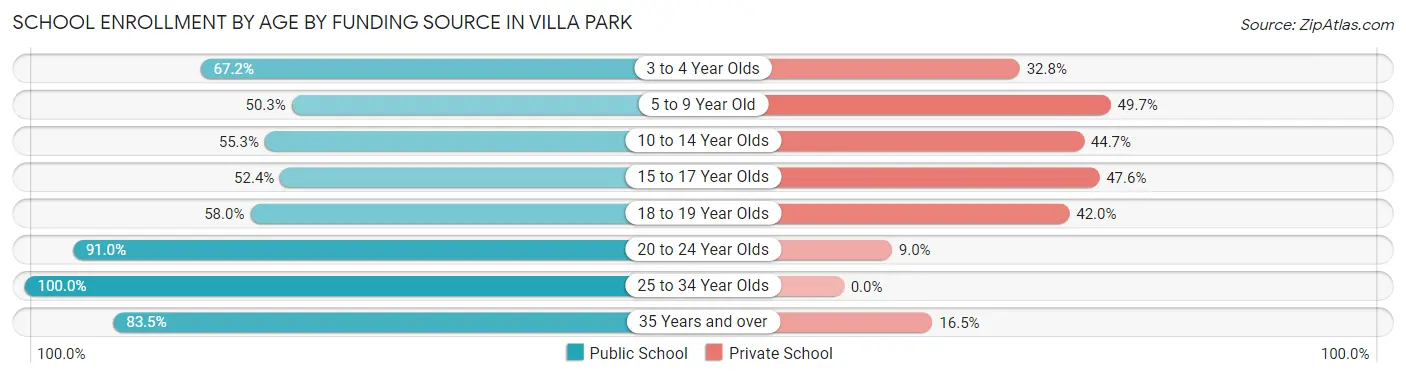
| Age Bracket | Public School | Private School |
| 3 to 4 Year Olds | 41 (67.2%) | 20 (32.8%) |
| 5 to 9 Year Old | 184 (50.3%) | 182 (49.7%) |
| 10 to 14 Year Olds | 231 (55.3%) | 187 (44.7%) |
| 15 to 17 Year Olds | 120 (52.4%) | 109 (47.6%) |
| 18 to 19 Year Olds | 40 (58.0%) | 29 (42.0%) |
| 20 to 24 Year Olds | 142 (91.0%) | 14 (9.0%) |
| 25 to 34 Year Olds | 18 (100.0%) | 0 (0.0%) |
| 35 Years and over | 101 (83.5%) | 20 (16.5%) |
| Total | 877 (61.0%) | 561 (39.0%) |
Educational Attainment by Field of Study in Villa Park
Business (567 | 23.7%), social sciences (299 | 12.5%), science & technology (203 | 8.5%), bio, nature & agricultural (194 | 8.1%), and psychology (169 | 7.1%) are the most common fields of study among 2,393 individuals in Villa Park who have obtained a bachelor's degree or higher.
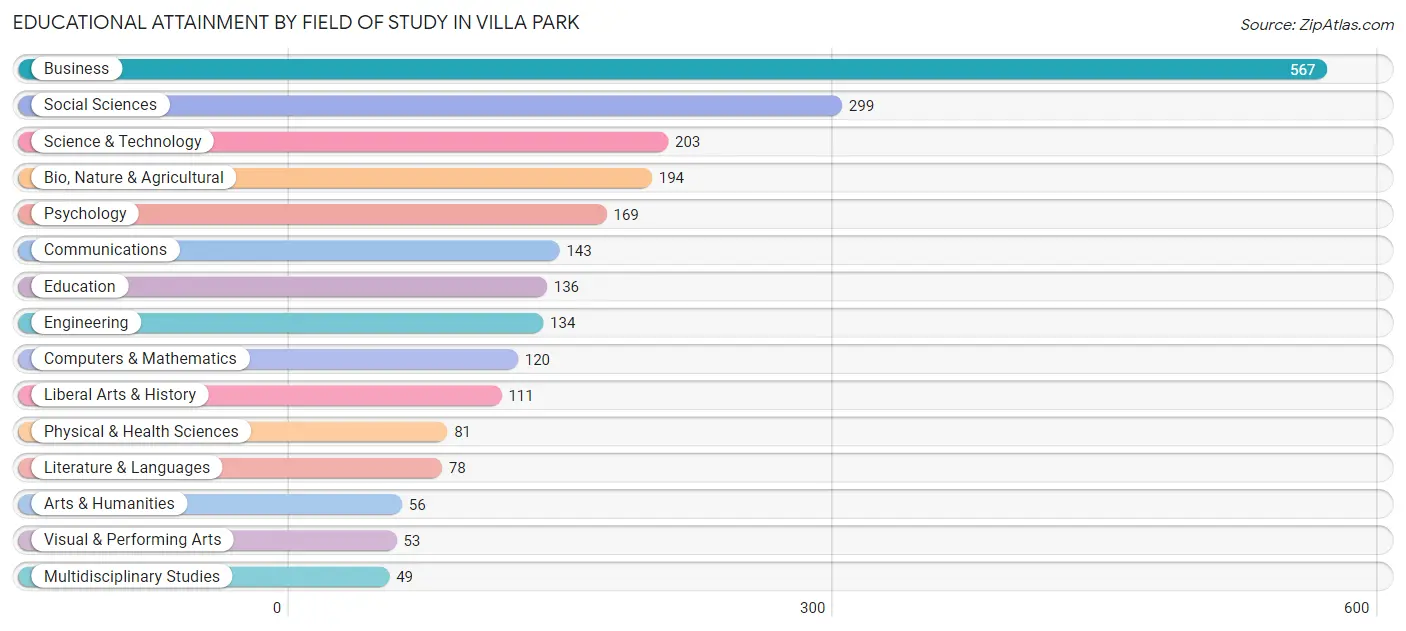
| Field of Study | # Graduates | % Graduates |
| Computers & Mathematics | 120 | 5.0% |
| Bio, Nature & Agricultural | 194 | 8.1% |
| Physical & Health Sciences | 81 | 3.4% |
| Psychology | 169 | 7.1% |
| Social Sciences | 299 | 12.5% |
| Engineering | 134 | 5.6% |
| Multidisciplinary Studies | 49 | 2.1% |
| Science & Technology | 203 | 8.5% |
| Business | 567 | 23.7% |
| Education | 136 | 5.7% |
| Literature & Languages | 78 | 3.3% |
| Liberal Arts & History | 111 | 4.6% |
| Visual & Performing Arts | 53 | 2.2% |
| Communications | 143 | 6.0% |
| Arts & Humanities | 56 | 2.3% |
| Total | 2,393 | 100.0% |
Transportation & Commute in Villa Park
Vehicle Availability by Sex in Villa Park
The most prevalent vehicle ownership categories in Villa Park are males with 3 vehicles (387, accounting for 29.9%) and females with 3 vehicles (344, making up 36.1%).
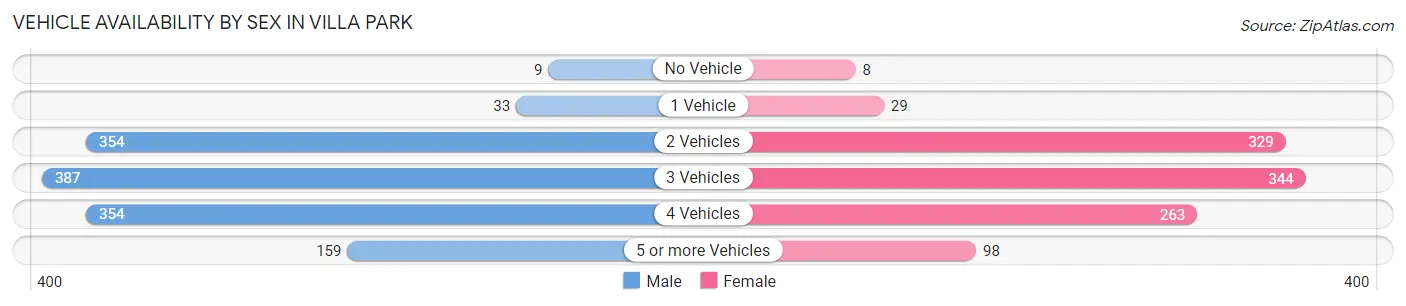
| Vehicles Available | Male | Female |
| No Vehicle | 9 (0.7%) | 8 (0.7%) |
| 1 Vehicle | 33 (2.5%) | 29 (2.7%) |
| 2 Vehicles | 354 (27.3%) | 329 (30.7%) |
| 3 Vehicles | 387 (29.9%) | 344 (32.1%) |
| 4 Vehicles | 354 (27.3%) | 263 (24.6%) |
| 5 or more Vehicles | 159 (12.3%) | 98 (9.1%) |
| Total | 1,296 (100.0%) | 1,071 (100.0%) |
Commute Time in Villa Park
The most frequently occuring commute durations in Villa Park are 30 to 34 minutes (345 commuters, 18.3%), 20 to 24 minutes (303 commuters, 16.1%), and 15 to 19 minutes (268 commuters, 14.2%).
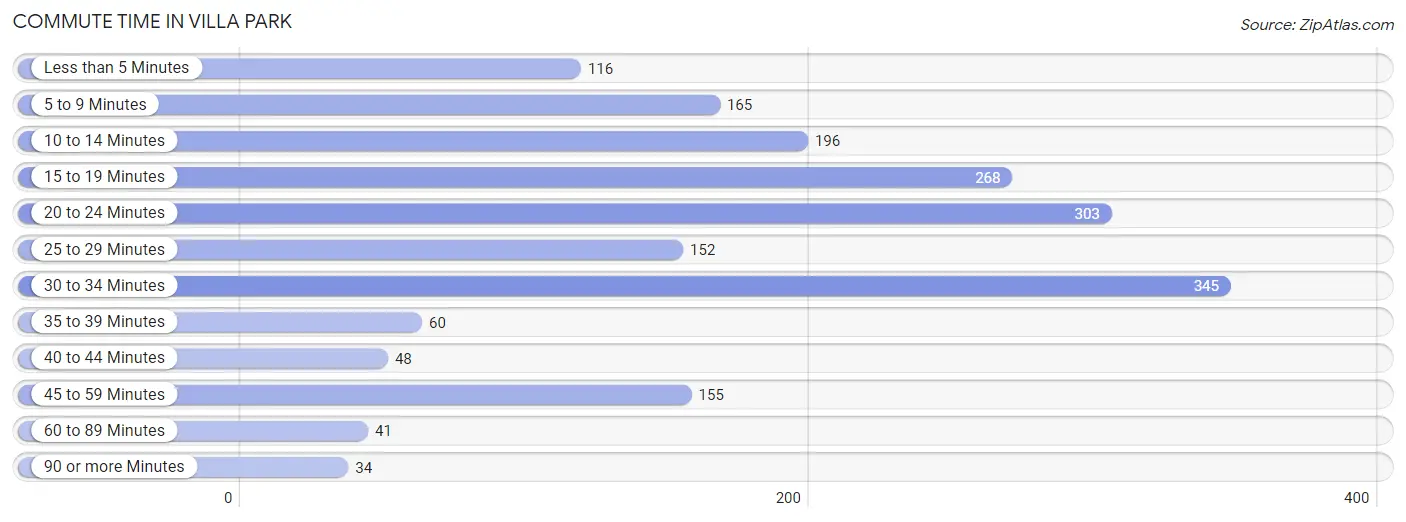
| Commute Time | # Commuters | % Commuters |
| Less than 5 Minutes | 116 | 6.2% |
| 5 to 9 Minutes | 165 | 8.8% |
| 10 to 14 Minutes | 196 | 10.4% |
| 15 to 19 Minutes | 268 | 14.2% |
| 20 to 24 Minutes | 303 | 16.1% |
| 25 to 29 Minutes | 152 | 8.1% |
| 30 to 34 Minutes | 345 | 18.3% |
| 35 to 39 Minutes | 60 | 3.2% |
| 40 to 44 Minutes | 48 | 2.5% |
| 45 to 59 Minutes | 155 | 8.2% |
| 60 to 89 Minutes | 41 | 2.2% |
| 90 or more Minutes | 34 | 1.8% |
Commute Time by Sex in Villa Park
The most common commute times in Villa Park are 15 to 19 minutes (210 commuters, 21.1%) for males and 30 to 34 minutes (171 commuters, 19.3%) for females.
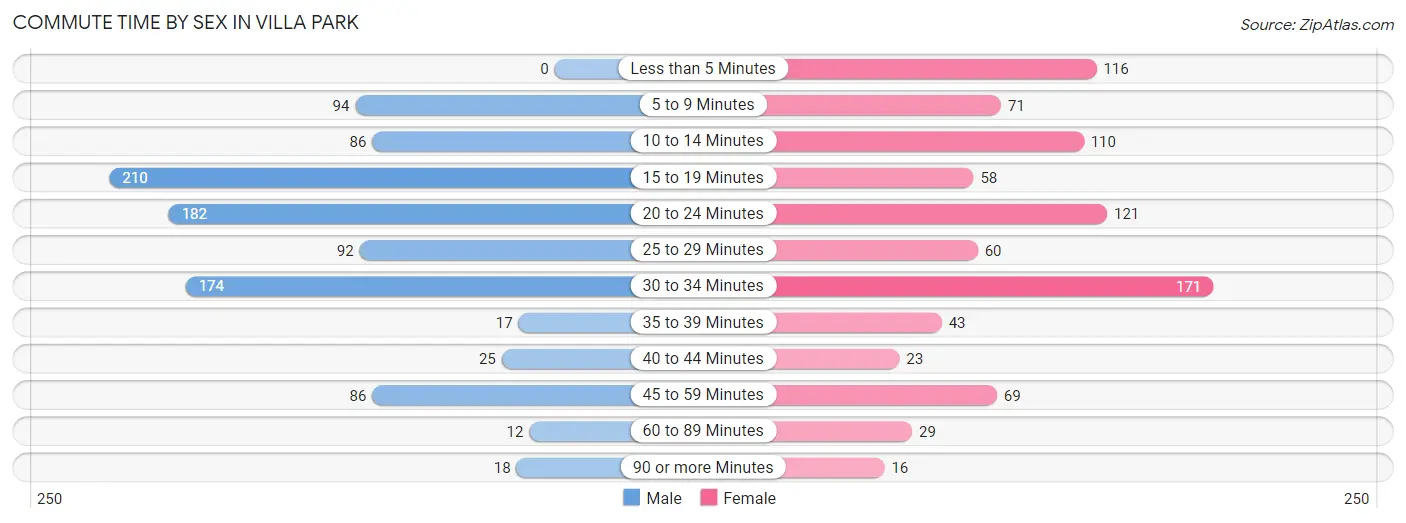
| Commute Time | Male | Female |
| Less than 5 Minutes | 0 (0.0%) | 116 (13.1%) |
| 5 to 9 Minutes | 94 (9.4%) | 71 (8.0%) |
| 10 to 14 Minutes | 86 (8.6%) | 110 (12.4%) |
| 15 to 19 Minutes | 210 (21.1%) | 58 (6.5%) |
| 20 to 24 Minutes | 182 (18.3%) | 121 (13.6%) |
| 25 to 29 Minutes | 92 (9.2%) | 60 (6.8%) |
| 30 to 34 Minutes | 174 (17.5%) | 171 (19.3%) |
| 35 to 39 Minutes | 17 (1.7%) | 43 (4.9%) |
| 40 to 44 Minutes | 25 (2.5%) | 23 (2.6%) |
| 45 to 59 Minutes | 86 (8.6%) | 69 (7.8%) |
| 60 to 89 Minutes | 12 (1.2%) | 29 (3.3%) |
| 90 or more Minutes | 18 (1.8%) | 16 (1.8%) |
Time of Departure to Work by Sex in Villa Park
The most frequent times of departure to work in Villa Park are 7:30 AM to 7:59 AM (172, 17.3%) for males and 8:00 AM to 8:29 AM (158, 17.8%) for females.
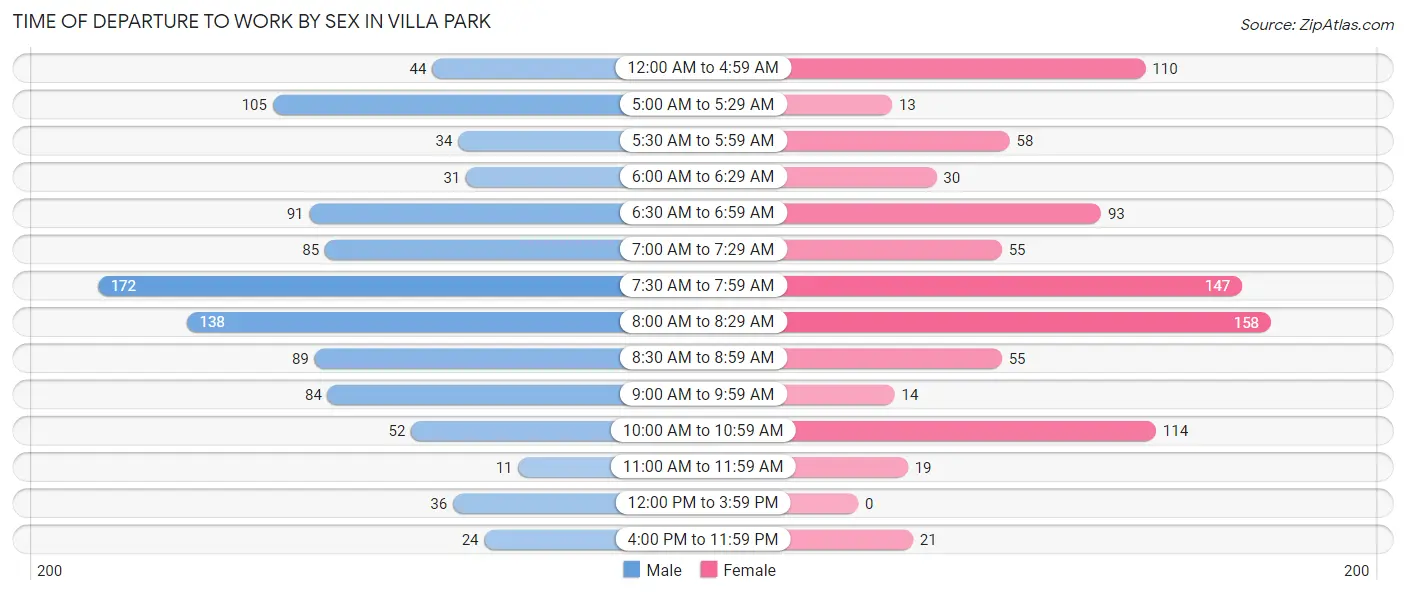
| Time of Departure | Male | Female |
| 12:00 AM to 4:59 AM | 44 (4.4%) | 110 (12.4%) |
| 5:00 AM to 5:29 AM | 105 (10.5%) | 13 (1.5%) |
| 5:30 AM to 5:59 AM | 34 (3.4%) | 58 (6.5%) |
| 6:00 AM to 6:29 AM | 31 (3.1%) | 30 (3.4%) |
| 6:30 AM to 6:59 AM | 91 (9.1%) | 93 (10.5%) |
| 7:00 AM to 7:29 AM | 85 (8.5%) | 55 (6.2%) |
| 7:30 AM to 7:59 AM | 172 (17.3%) | 147 (16.6%) |
| 8:00 AM to 8:29 AM | 138 (13.9%) | 158 (17.8%) |
| 8:30 AM to 8:59 AM | 89 (8.9%) | 55 (6.2%) |
| 9:00 AM to 9:59 AM | 84 (8.4%) | 14 (1.6%) |
| 10:00 AM to 10:59 AM | 52 (5.2%) | 114 (12.9%) |
| 11:00 AM to 11:59 AM | 11 (1.1%) | 19 (2.1%) |
| 12:00 PM to 3:59 PM | 36 (3.6%) | 0 (0.0%) |
| 4:00 PM to 11:59 PM | 24 (2.4%) | 21 (2.4%) |
| Total | 996 (100.0%) | 887 (100.0%) |
Housing Occupancy in Villa Park
Occupancy by Ownership in Villa Park
Of the total 1,926 dwellings in Villa Park, owner-occupied units account for 1,737 (90.2%), while renter-occupied units make up 189 (9.8%).
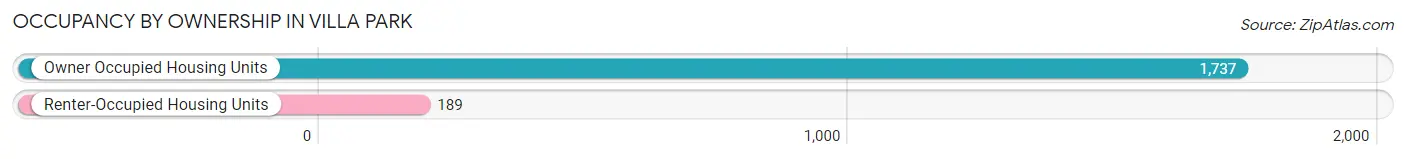
| Occupancy | # Housing Units | % Housing Units |
| Owner Occupied Housing Units | 1,737 | 90.2% |
| Renter-Occupied Housing Units | 189 | 9.8% |
| Total Occupied Housing Units | 1,926 | 100.0% |
Occupancy by Household Size in Villa Park
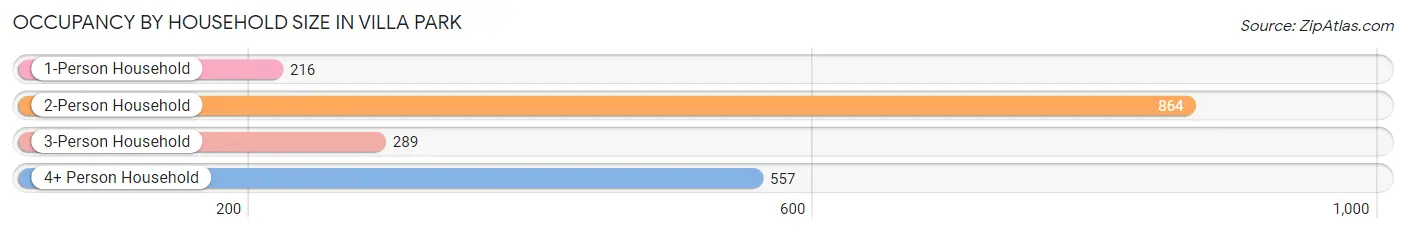
| Household Size | # Housing Units | % Housing Units |
| 1-Person Household | 216 | 11.2% |
| 2-Person Household | 864 | 44.9% |
| 3-Person Household | 289 | 15.0% |
| 4+ Person Household | 557 | 28.9% |
| Total Housing Units | 1,926 | 100.0% |
Occupancy by Ownership by Household Size in Villa Park
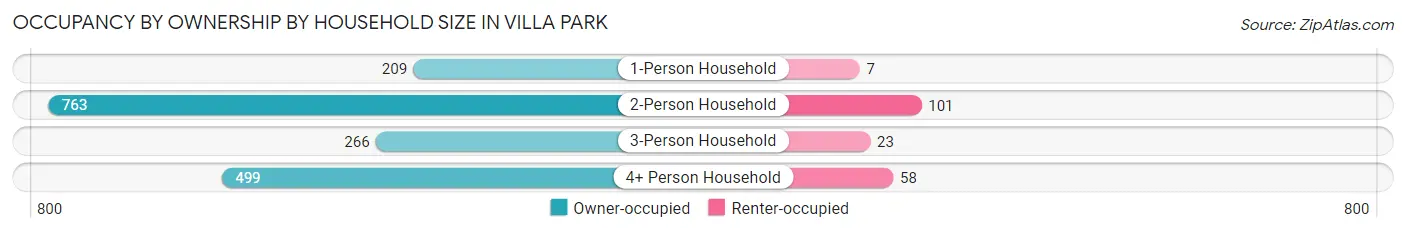
| Household Size | Owner-occupied | Renter-occupied |
| 1-Person Household | 209 (96.8%) | 7 (3.2%) |
| 2-Person Household | 763 (88.3%) | 101 (11.7%) |
| 3-Person Household | 266 (92.0%) | 23 (8.0%) |
| 4+ Person Household | 499 (89.6%) | 58 (10.4%) |
| Total Housing Units | 1,737 (90.2%) | 189 (9.8%) |
Occupancy by Educational Attainment in Villa Park
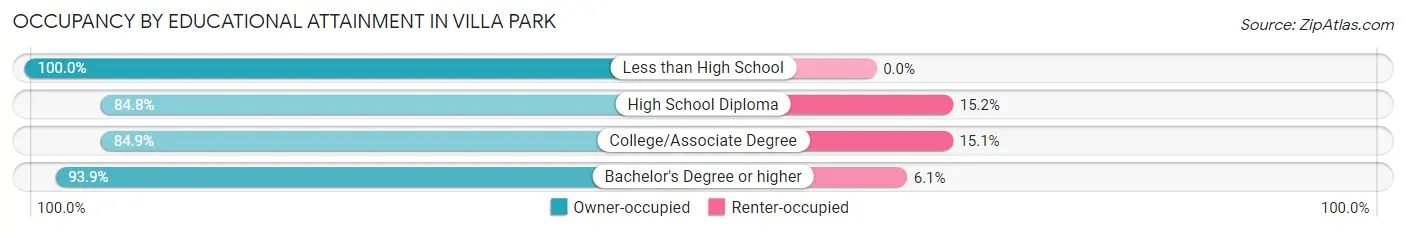
| Household Size | Owner-occupied | Renter-occupied |
| Less than High School | 36 (100.0%) | 0 (0.0%) |
| High School Diploma | 201 (84.8%) | 36 (15.2%) |
| College/Associate Degree | 494 (84.9%) | 88 (15.1%) |
| Bachelor's Degree or higher | 1,006 (93.9%) | 65 (6.1%) |
Occupancy by Age of Householder in Villa Park
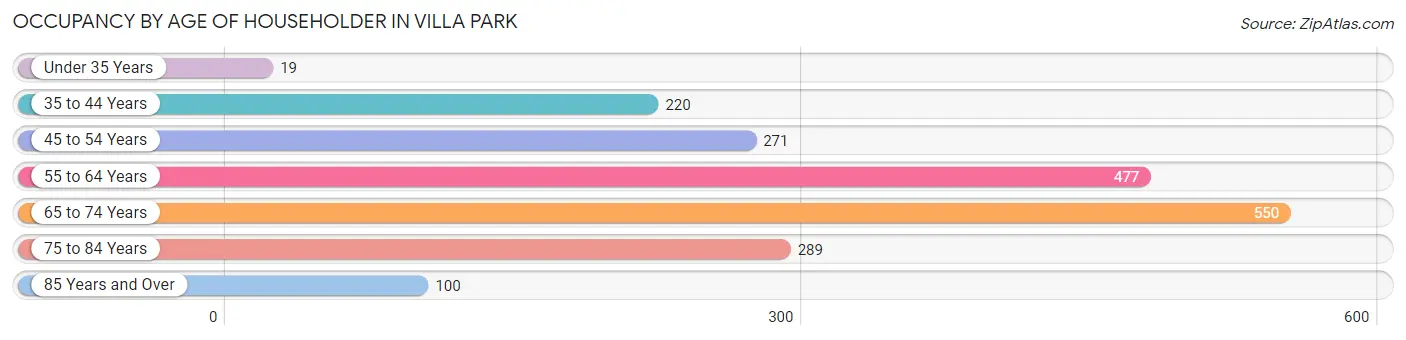
| Age Bracket | # Households | % Households |
| Under 35 Years | 19 | 1.0% |
| 35 to 44 Years | 220 | 11.4% |
| 45 to 54 Years | 271 | 14.1% |
| 55 to 64 Years | 477 | 24.8% |
| 65 to 74 Years | 550 | 28.6% |
| 75 to 84 Years | 289 | 15.0% |
| 85 Years and Over | 100 | 5.2% |
| Total | 1,926 | 100.0% |
Housing Finances in Villa Park
Median Income by Occupancy in Villa Park
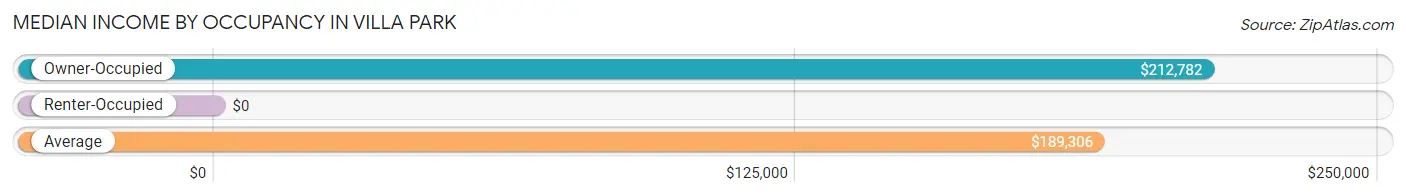
| Occupancy Type | # Households | Median Income |
| Owner-Occupied | 1,737 (90.2%) | $212,782 |
| Renter-Occupied | 189 (9.8%) | $0 |
| Average | 1,926 (100.0%) | $189,306 |
Occupancy by Householder Income Bracket in Villa Park
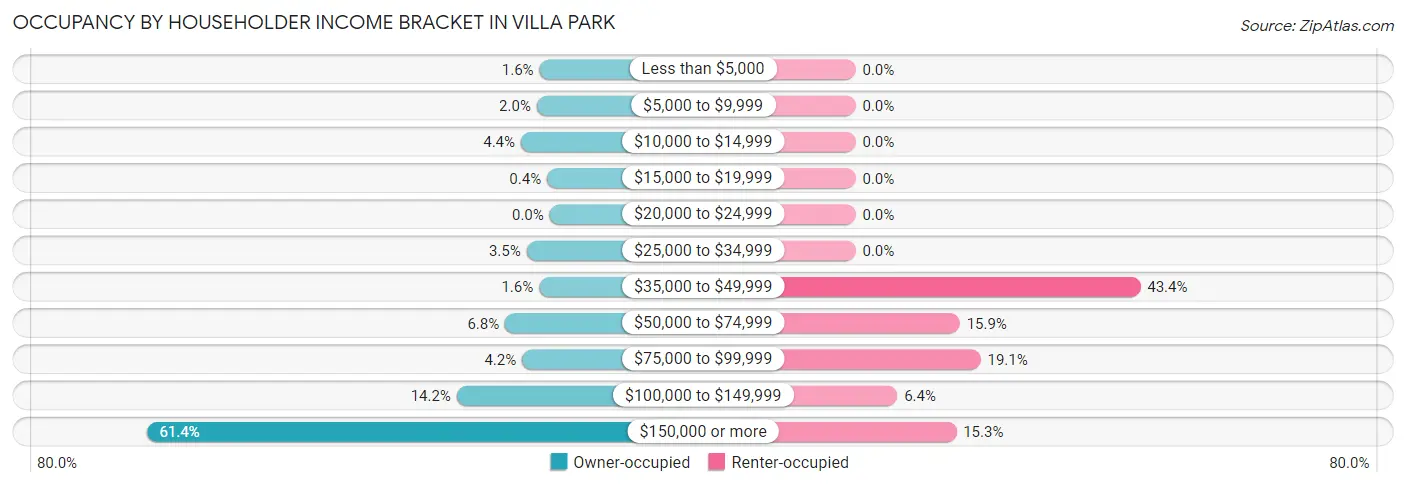
| Income Bracket | Owner-occupied | Renter-occupied |
| Less than $5,000 | 27 (1.5%) | 0 (0.0%) |
| $5,000 to $9,999 | 34 (2.0%) | 0 (0.0%) |
| $10,000 to $14,999 | 76 (4.4%) | 0 (0.0%) |
| $15,000 to $19,999 | 7 (0.4%) | 0 (0.0%) |
| $20,000 to $24,999 | 0 (0.0%) | 0 (0.0%) |
| $25,000 to $34,999 | 61 (3.5%) | 0 (0.0%) |
| $35,000 to $49,999 | 28 (1.6%) | 82 (43.4%) |
| $50,000 to $74,999 | 118 (6.8%) | 30 (15.9%) |
| $75,000 to $99,999 | 73 (4.2%) | 36 (19.1%) |
| $100,000 to $149,999 | 246 (14.2%) | 12 (6.4%) |
| $150,000 or more | 1,067 (61.4%) | 29 (15.3%) |
| Total | 1,737 (100.0%) | 189 (100.0%) |
Monthly Housing Cost Tiers in Villa Park
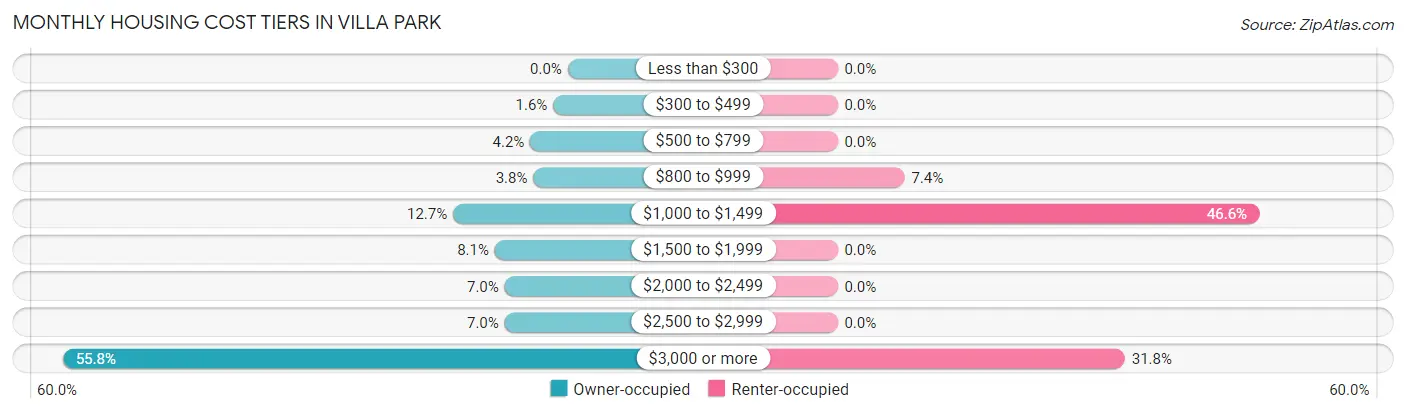
| Monthly Cost | Owner-occupied | Renter-occupied |
| Less than $300 | 0 (0.0%) | 0 (0.0%) |
| $300 to $499 | 28 (1.6%) | 0 (0.0%) |
| $500 to $799 | 72 (4.2%) | 0 (0.0%) |
| $800 to $999 | 66 (3.8%) | 14 (7.4%) |
| $1,000 to $1,499 | 220 (12.7%) | 88 (46.6%) |
| $1,500 to $1,999 | 140 (8.1%) | 0 (0.0%) |
| $2,000 to $2,499 | 121 (7.0%) | 0 (0.0%) |
| $2,500 to $2,999 | 121 (7.0%) | 0 (0.0%) |
| $3,000 or more | 969 (55.8%) | 60 (31.8%) |
| Total | 1,737 (100.0%) | 189 (100.0%) |
Physical Housing Characteristics in Villa Park
Housing Structures in Villa Park
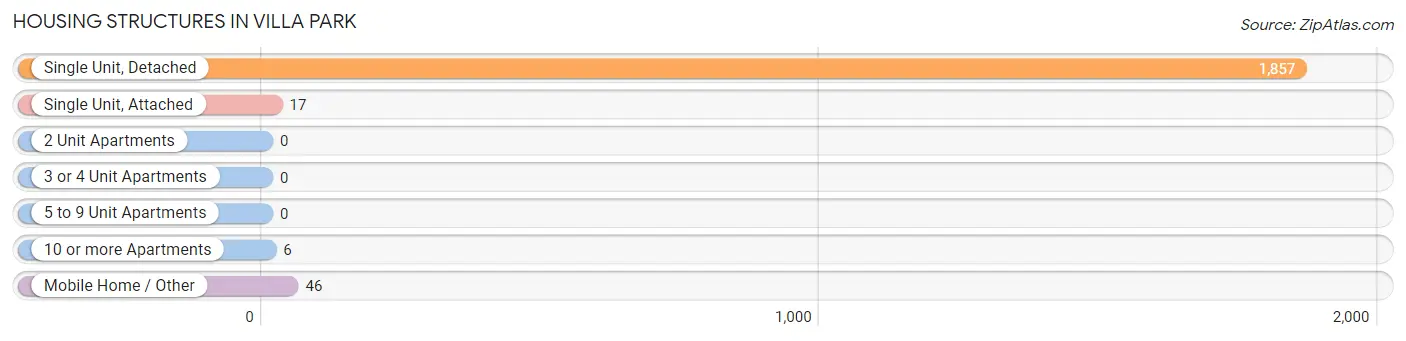
| Structure Type | # Housing Units | % Housing Units |
| Single Unit, Detached | 1,857 | 96.4% |
| Single Unit, Attached | 17 | 0.9% |
| 2 Unit Apartments | 0 | 0.0% |
| 3 or 4 Unit Apartments | 0 | 0.0% |
| 5 to 9 Unit Apartments | 0 | 0.0% |
| 10 or more Apartments | 6 | 0.3% |
| Mobile Home / Other | 46 | 2.4% |
| Total | 1,926 | 100.0% |
Housing Structures by Occupancy in Villa Park
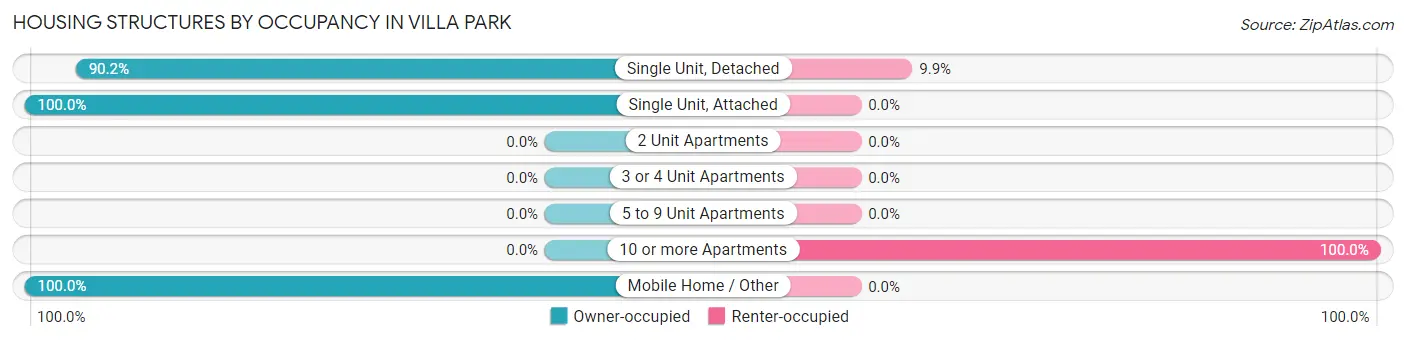
| Structure Type | Owner-occupied | Renter-occupied |
| Single Unit, Detached | 1,674 (90.1%) | 183 (9.9%) |
| Single Unit, Attached | 17 (100.0%) | 0 (0.0%) |
| 2 Unit Apartments | 0 (0.0%) | 0 (0.0%) |
| 3 or 4 Unit Apartments | 0 (0.0%) | 0 (0.0%) |
| 5 to 9 Unit Apartments | 0 (0.0%) | 0 (0.0%) |
| 10 or more Apartments | 0 (0.0%) | 6 (100.0%) |
| Mobile Home / Other | 46 (100.0%) | 0 (0.0%) |
| Total | 1,737 (90.2%) | 189 (9.8%) |
Housing Structures by Number of Rooms in Villa Park
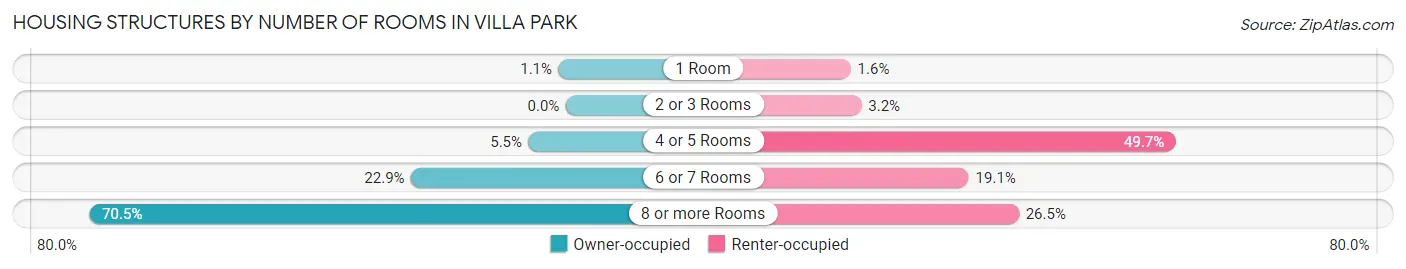
| Number of Rooms | Owner-occupied | Renter-occupied |
| 1 Room | 19 (1.1%) | 3 (1.6%) |
| 2 or 3 Rooms | 0 (0.0%) | 6 (3.2%) |
| 4 or 5 Rooms | 96 (5.5%) | 94 (49.7%) |
| 6 or 7 Rooms | 398 (22.9%) | 36 (19.1%) |
| 8 or more Rooms | 1,224 (70.5%) | 50 (26.5%) |
| Total | 1,737 (100.0%) | 189 (100.0%) |
Housing Structure by Heating Type in Villa Park
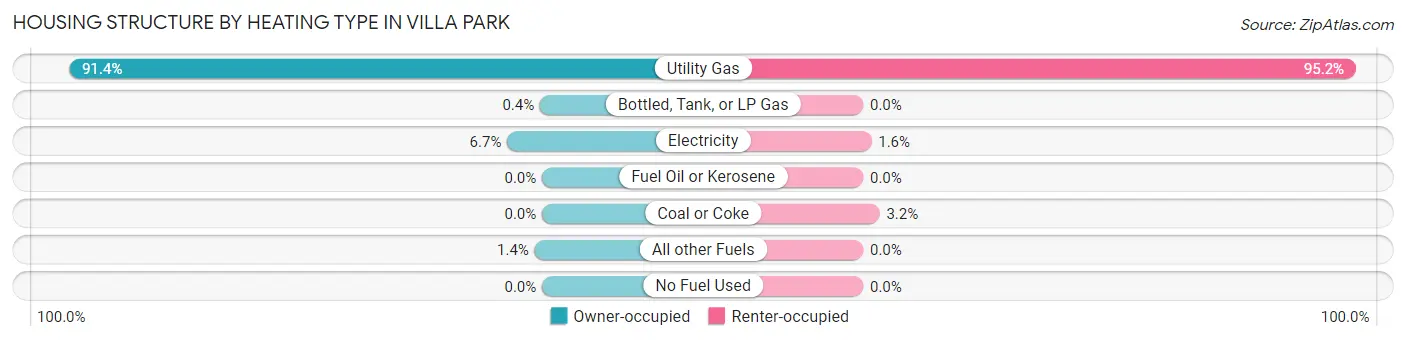
| Heating Type | Owner-occupied | Renter-occupied |
| Utility Gas | 1,588 (91.4%) | 180 (95.2%) |
| Bottled, Tank, or LP Gas | 7 (0.4%) | 0 (0.0%) |
| Electricity | 117 (6.7%) | 3 (1.6%) |
| Fuel Oil or Kerosene | 0 (0.0%) | 0 (0.0%) |
| Coal or Coke | 0 (0.0%) | 6 (3.2%) |
| All other Fuels | 25 (1.4%) | 0 (0.0%) |
| No Fuel Used | 0 (0.0%) | 0 (0.0%) |
| Total | 1,737 (100.0%) | 189 (100.0%) |
Household Vehicle Usage in Villa Park
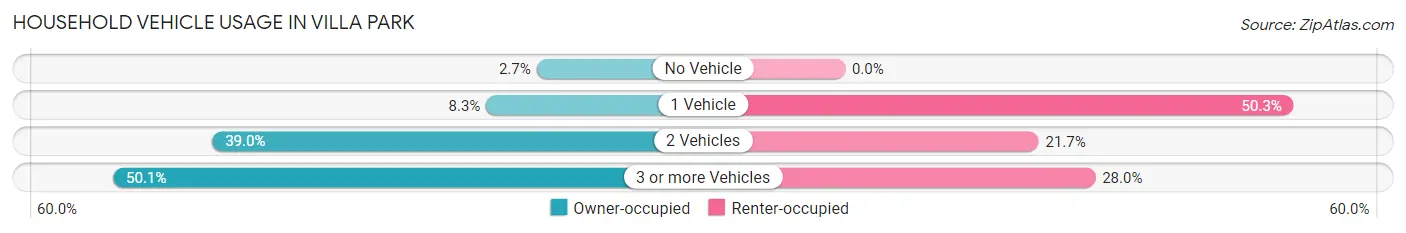
| Vehicles per Household | Owner-occupied | Renter-occupied |
| No Vehicle | 46 (2.6%) | 0 (0.0%) |
| 1 Vehicle | 144 (8.3%) | 95 (50.3%) |
| 2 Vehicles | 677 (39.0%) | 41 (21.7%) |
| 3 or more Vehicles | 870 (50.1%) | 53 (28.0%) |
| Total | 1,737 (100.0%) | 189 (100.0%) |
Real Estate & Mortgages in Villa Park
Real Estate and Mortgage Overview in Villa Park
| Characteristic | Without Mortgage | With Mortgage |
| Housing Units | 620 | 1,117 |
| Median Property Value | $1,364,600 | $1,535,000 |
| Median Household Income | $174,167 | $726 |
| Monthly Housing Costs | $1,422 | $957 |
| Real Estate Taxes | $9,005 | $2 |
Property Value by Mortgage Status in Villa Park
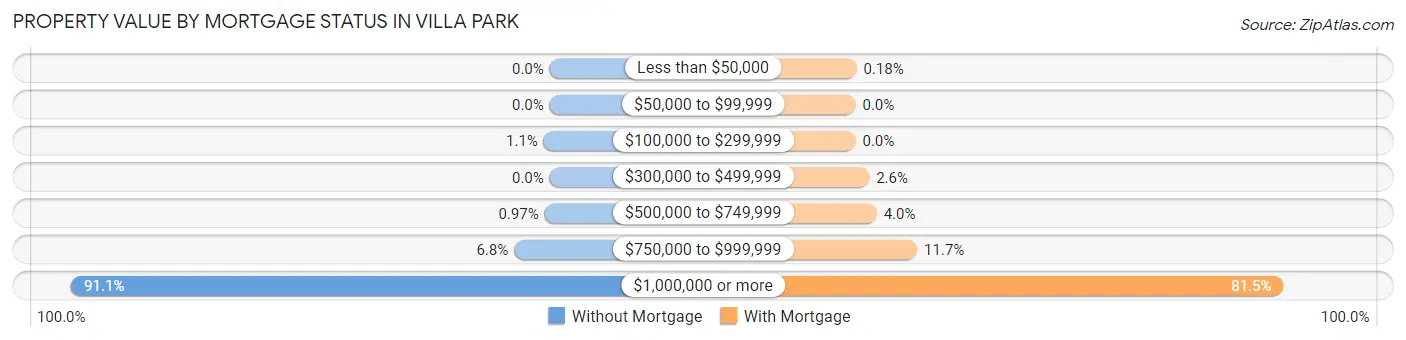
| Property Value | Without Mortgage | With Mortgage |
| Less than $50,000 | 0 (0.0%) | 2 (0.2%) |
| $50,000 to $99,999 | 0 (0.0%) | 0 (0.0%) |
| $100,000 to $299,999 | 7 (1.1%) | 0 (0.0%) |
| $300,000 to $499,999 | 0 (0.0%) | 29 (2.6%) |
| $500,000 to $749,999 | 6 (1.0%) | 45 (4.0%) |
| $750,000 to $999,999 | 42 (6.8%) | 131 (11.7%) |
| $1,000,000 or more | 565 (91.1%) | 910 (81.5%) |
| Total | 620 (100.0%) | 1,117 (100.0%) |
Household Income by Mortgage Status in Villa Park
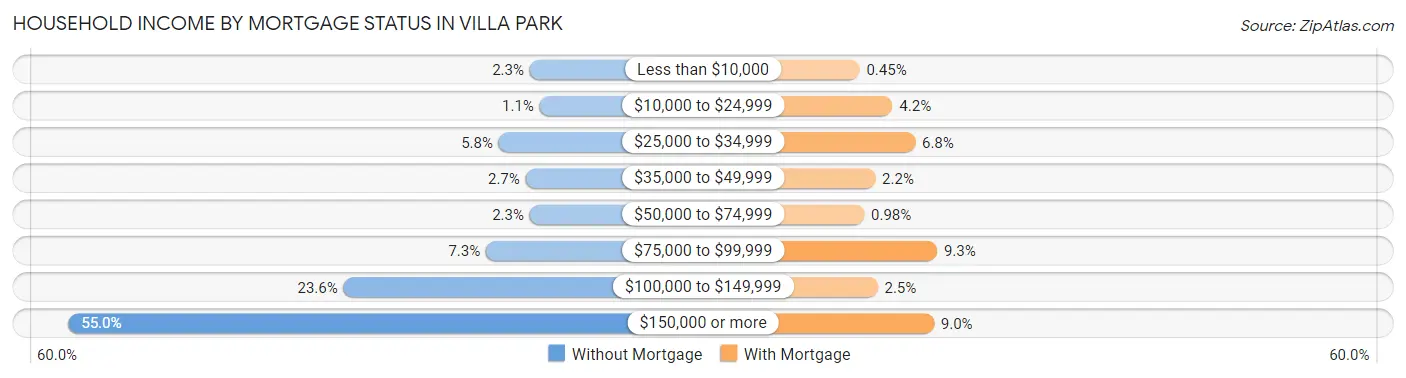
| Household Income | Without Mortgage | With Mortgage |
| Less than $10,000 | 14 (2.3%) | 5 (0.4%) |
| $10,000 to $24,999 | 7 (1.1%) | 47 (4.2%) |
| $25,000 to $34,999 | 36 (5.8%) | 76 (6.8%) |
| $35,000 to $49,999 | 17 (2.7%) | 25 (2.2%) |
| $50,000 to $74,999 | 14 (2.3%) | 11 (1.0%) |
| $75,000 to $99,999 | 45 (7.3%) | 104 (9.3%) |
| $100,000 to $149,999 | 146 (23.5%) | 28 (2.5%) |
| $150,000 or more | 341 (55.0%) | 100 (8.9%) |
| Total | 620 (100.0%) | 1,117 (100.0%) |
Property Value to Household Income Ratio in Villa Park
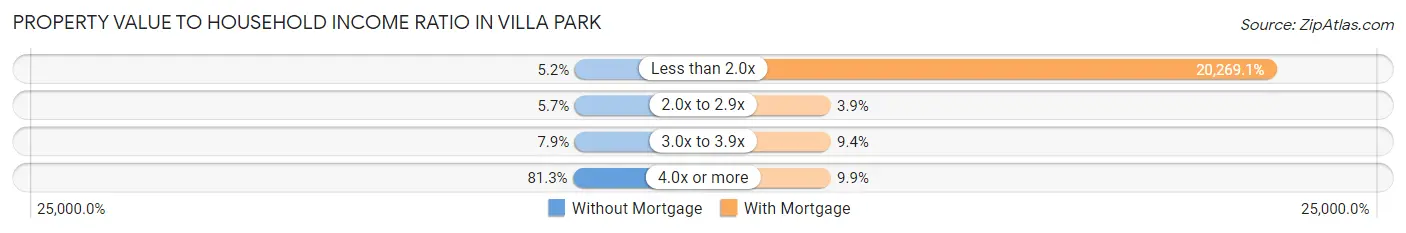
| Value-to-Income Ratio | Without Mortgage | With Mortgage |
| Less than 2.0x | 32 (5.2%) | 226,406 (20,269.1%) |
| 2.0x to 2.9x | 35 (5.7%) | 44 (3.9%) |
| 3.0x to 3.9x | 49 (7.9%) | 105 (9.4%) |
| 4.0x or more | 504 (81.3%) | 110 (9.9%) |
| Total | 620 (100.0%) | 1,117 (100.0%) |
Real Estate Taxes by Mortgage Status in Villa Park
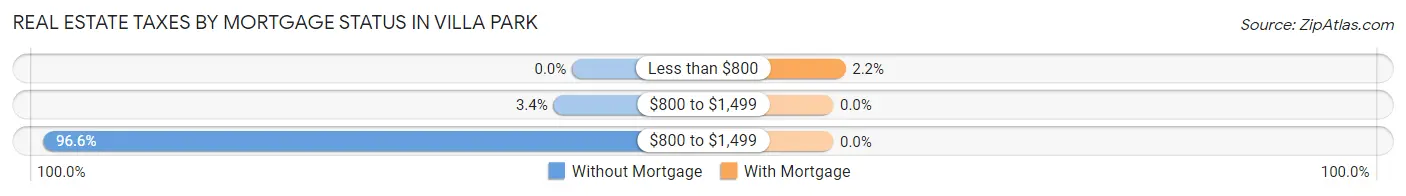
| Property Taxes | Without Mortgage | With Mortgage |
| Less than $800 | 0 (0.0%) | 25 (2.2%) |
| $800 to $1,499 | 21 (3.4%) | 0 (0.0%) |
| $800 to $1,499 | 599 (96.6%) | 0 (0.0%) |
| Total | 620 (100.0%) | 1,117 (100.0%) |
Health & Disability in Villa Park
Health Insurance Coverage by Age in Villa Park
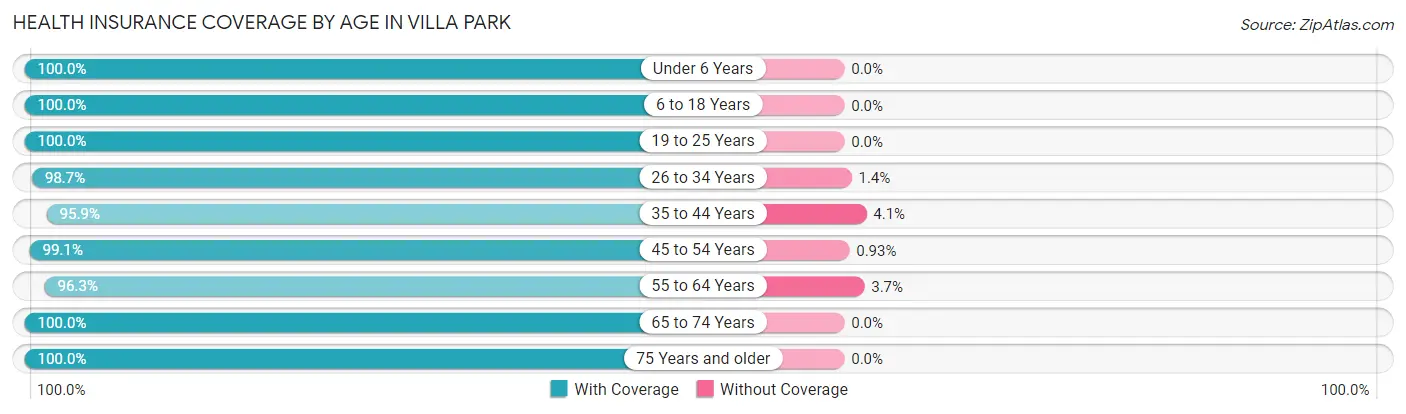
| Age Bracket | With Coverage | Without Coverage |
| Under 6 Years | 216 (100.0%) | 0 (0.0%) |
| 6 to 18 Years | 1,058 (100.0%) | 0 (0.0%) |
| 19 to 25 Years | 250 (100.0%) | 0 (0.0%) |
| 26 to 34 Years | 292 (98.7%) | 4 (1.3%) |
| 35 to 44 Years | 606 (95.9%) | 26 (4.1%) |
| 45 to 54 Years | 642 (99.1%) | 6 (0.9%) |
| 55 to 64 Years | 930 (96.3%) | 36 (3.7%) |
| 65 to 74 Years | 956 (100.0%) | 0 (0.0%) |
| 75 Years and older | 792 (100.0%) | 0 (0.0%) |
| Total | 5,742 (98.8%) | 72 (1.2%) |
Health Insurance Coverage by Citizenship Status in Villa Park
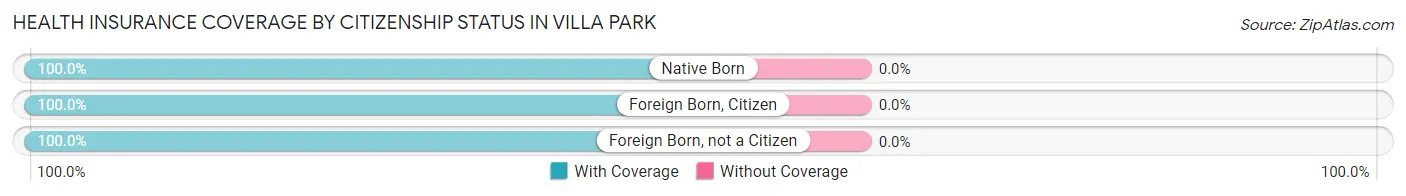
| Citizenship Status | With Coverage | Without Coverage |
| Native Born | 216 (100.0%) | 0 (0.0%) |
| Foreign Born, Citizen | 1,058 (100.0%) | 0 (0.0%) |
| Foreign Born, not a Citizen | 250 (100.0%) | 0 (0.0%) |
Health Insurance Coverage by Household Income in Villa Park
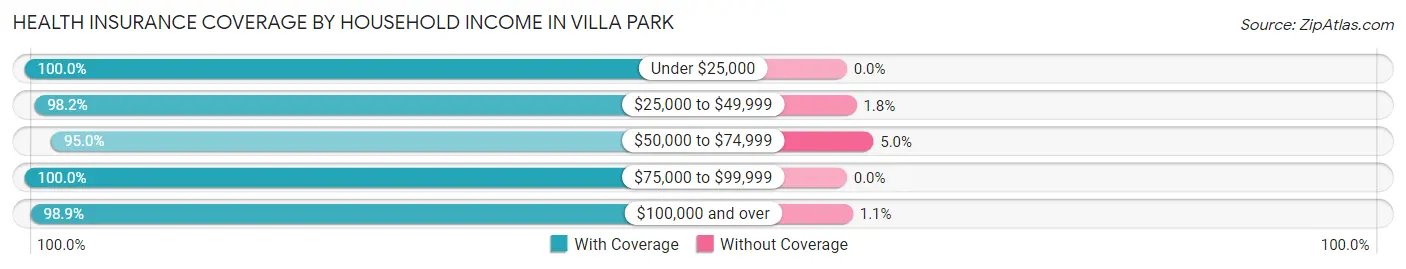
| Household Income | With Coverage | Without Coverage |
| Under $25,000 | 384 (100.0%) | 0 (0.0%) |
| $25,000 to $49,999 | 325 (98.2%) | 6 (1.8%) |
| $50,000 to $74,999 | 326 (95.0%) | 17 (5.0%) |
| $75,000 to $99,999 | 292 (100.0%) | 0 (0.0%) |
| $100,000 and over | 4,341 (98.9%) | 49 (1.1%) |
Public vs Private Health Insurance Coverage by Age in Villa Park
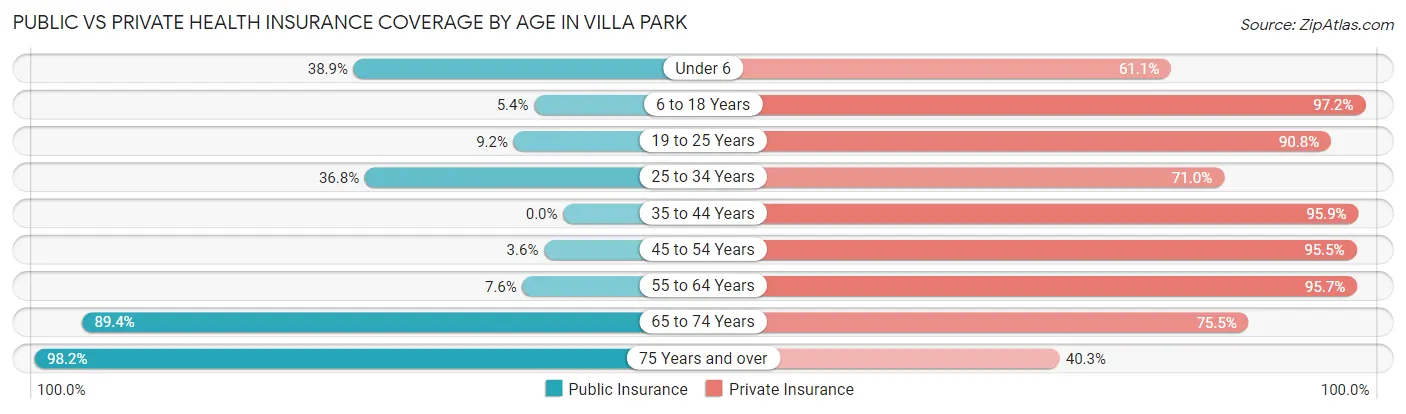
| Age Bracket | Public Insurance | Private Insurance |
| Under 6 | 84 (38.9%) | 132 (61.1%) |
| 6 to 18 Years | 57 (5.4%) | 1,028 (97.2%) |
| 19 to 25 Years | 23 (9.2%) | 227 (90.8%) |
| 25 to 34 Years | 109 (36.8%) | 210 (71.0%) |
| 35 to 44 Years | 0 (0.0%) | 606 (95.9%) |
| 45 to 54 Years | 23 (3.5%) | 619 (95.5%) |
| 55 to 64 Years | 73 (7.6%) | 924 (95.7%) |
| 65 to 74 Years | 855 (89.4%) | 722 (75.5%) |
| 75 Years and over | 778 (98.2%) | 319 (40.3%) |
| Total | 2,002 (34.4%) | 4,787 (82.3%) |
Disability Status by Sex by Age in Villa Park
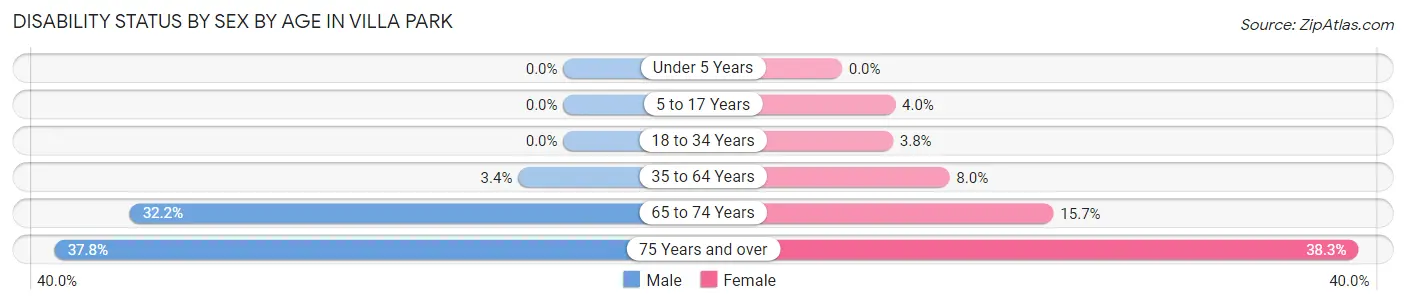
| Age Bracket | Male | Female |
| Under 5 Years | 0 (0.0%) | 0 (0.0%) |
| 5 to 17 Years | 0 (0.0%) | 17 (4.0%) |
| 18 to 34 Years | 0 (0.0%) | 11 (3.8%) |
| 35 to 64 Years | 35 (3.4%) | 96 (8.0%) |
| 65 to 74 Years | 150 (32.2%) | 77 (15.7%) |
| 75 Years and over | 108 (37.8%) | 194 (38.3%) |
Disability Class by Sex by Age in Villa Park
Disability Class: Hearing Difficulty
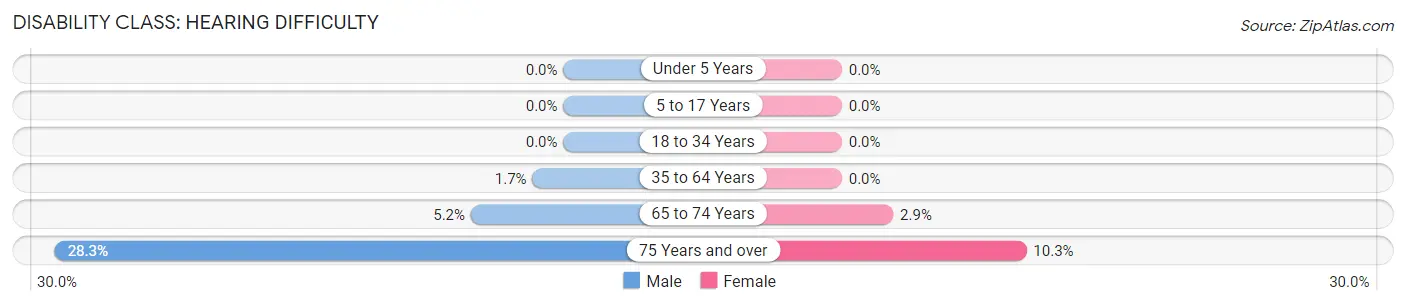
| Age Bracket | Male | Female |
| Under 5 Years | 0 (0.0%) | 0 (0.0%) |
| 5 to 17 Years | 0 (0.0%) | 0 (0.0%) |
| 18 to 34 Years | 0 (0.0%) | 0 (0.0%) |
| 35 to 64 Years | 18 (1.7%) | 0 (0.0%) |
| 65 to 74 Years | 24 (5.1%) | 14 (2.9%) |
| 75 Years and over | 81 (28.3%) | 52 (10.3%) |
Disability Class: Vision Difficulty
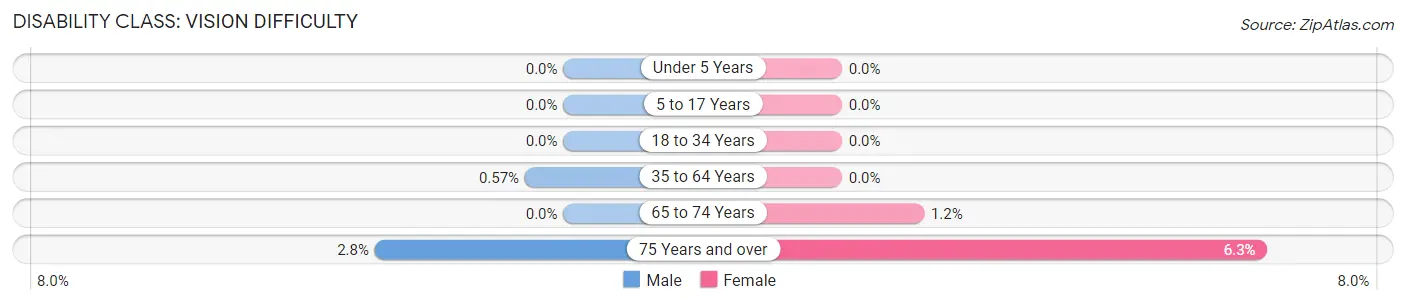
| Age Bracket | Male | Female |
| Under 5 Years | 0 (0.0%) | 0 (0.0%) |
| 5 to 17 Years | 0 (0.0%) | 0 (0.0%) |
| 18 to 34 Years | 0 (0.0%) | 0 (0.0%) |
| 35 to 64 Years | 6 (0.6%) | 0 (0.0%) |
| 65 to 74 Years | 0 (0.0%) | 6 (1.2%) |
| 75 Years and over | 8 (2.8%) | 32 (6.3%) |
Disability Class: Cognitive Difficulty
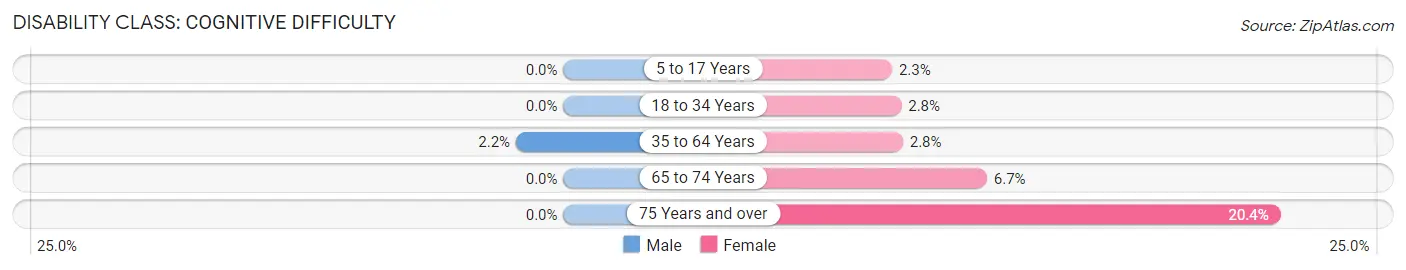
| Age Bracket | Male | Female |
| 5 to 17 Years | 0 (0.0%) | 10 (2.3%) |
| 18 to 34 Years | 0 (0.0%) | 8 (2.8%) |
| 35 to 64 Years | 23 (2.2%) | 34 (2.8%) |
| 65 to 74 Years | 0 (0.0%) | 33 (6.7%) |
| 75 Years and over | 0 (0.0%) | 103 (20.4%) |
Disability Class: Ambulatory Difficulty
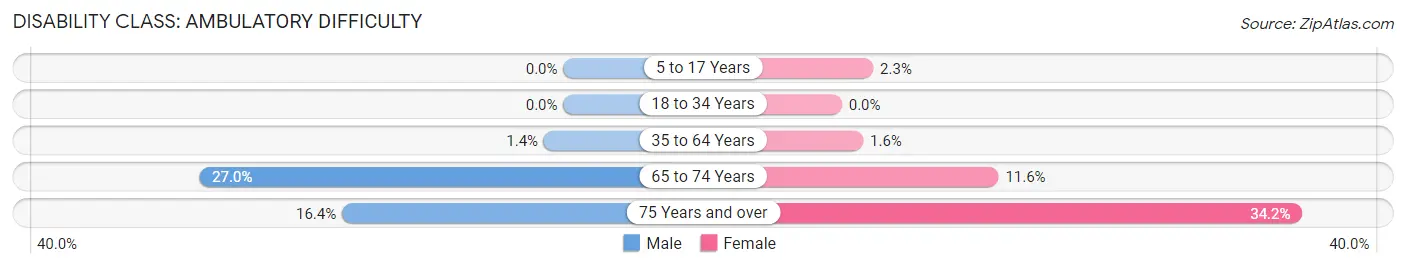
| Age Bracket | Male | Female |
| 5 to 17 Years | 0 (0.0%) | 10 (2.3%) |
| 18 to 34 Years | 0 (0.0%) | 0 (0.0%) |
| 35 to 64 Years | 15 (1.4%) | 19 (1.6%) |
| 65 to 74 Years | 126 (27.0%) | 57 (11.6%) |
| 75 Years and over | 47 (16.4%) | 173 (34.2%) |
Disability Class: Self-Care Difficulty
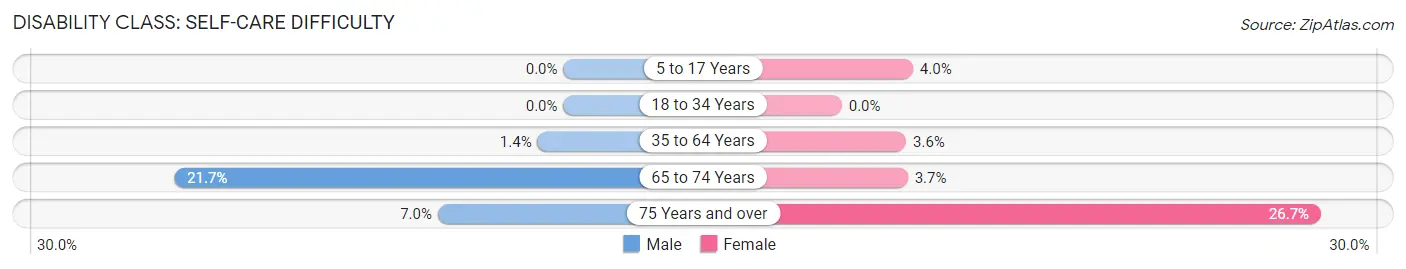
| Age Bracket | Male | Female |
| 5 to 17 Years | 0 (0.0%) | 17 (4.0%) |
| 18 to 34 Years | 0 (0.0%) | 0 (0.0%) |
| 35 to 64 Years | 15 (1.4%) | 43 (3.6%) |
| 65 to 74 Years | 101 (21.7%) | 18 (3.7%) |
| 75 Years and over | 20 (7.0%) | 135 (26.7%) |
Technology Access in Villa Park
Computing Device Access in Villa Park
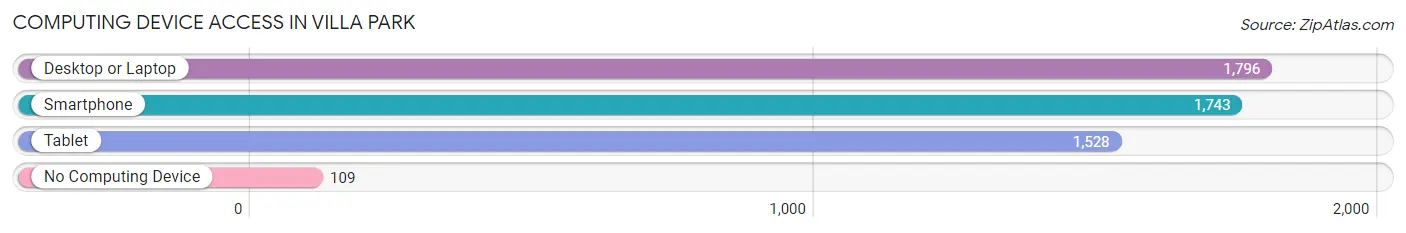
| Device Type | # Households | % Households |
| Desktop or Laptop | 1,796 | 93.2% |
| Smartphone | 1,743 | 90.5% |
| Tablet | 1,528 | 79.3% |
| No Computing Device | 109 | 5.7% |
| Total | 1,926 | 100.0% |
Internet Access in Villa Park
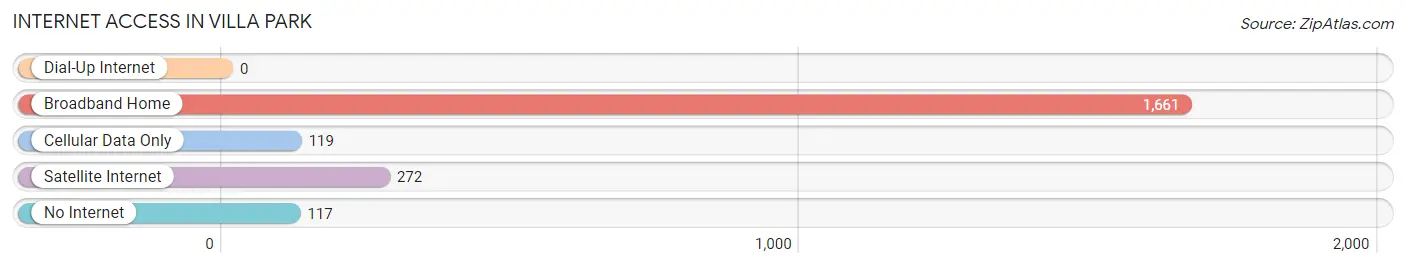
| Internet Type | # Households | % Households |
| Dial-Up Internet | 0 | 0.0% |
| Broadband Home | 1,661 | 86.2% |
| Cellular Data Only | 119 | 6.2% |
| Satellite Internet | 272 | 14.1% |
| No Internet | 117 | 6.1% |
| Total | 1,926 | 100.0% |
Villa Park Summary
Villa Park is a small city located in Orange County, California. It is bordered by the cities of Orange, Anaheim, and Santa Ana. The city has a population of approximately 5,000 people and covers an area of 1.7 square miles.
History
Villa Park was originally part of the Rancho Santiago de Santa Ana, a Mexican land grant given to Jose Antonio Yorba in 1810. The Yorba family owned the land until the late 19th century, when it was sold to James Irvine. In the early 20th century, the Irvine Company began to develop the area, and in 1923, Villa Park was incorporated as a city.
Geography
Villa Park is located in the foothills of the Santa Ana Mountains, and is surrounded by the cities of Orange, Anaheim, and Santa Ana. The city is situated at an elevation of about 500 feet above sea level. The climate is mild, with temperatures ranging from the mid-50s to the mid-80s throughout the year.
Economy
Villa Park is primarily a residential community, and the majority of its residents are employed in the nearby cities of Orange, Anaheim, and Santa Ana. The city does not have any major industries, but there are several small businesses located in the area. These include restaurants, retail stores, and professional services.
Demographics
As of the 2010 census, the population of Villa Park was 5,000. The racial makeup of the city was 79.2% White, 8.2% Asian, 6.2% Hispanic or Latino, and 4.2% African American. The median household income was $90,000, and the median age was 44.
Conclusion
Villa Park is a small city located in Orange County, California. It has a population of approximately 5,000 people and covers an area of 1.7 square miles. The city was originally part of the Rancho Santiago de Santa Ana, and was incorporated in 1923. Villa Park is primarily a residential community, and the majority of its residents are employed in the nearby cities of Orange, Anaheim, and Santa Ana. The racial makeup of the city is 79.2% White, 8.2% Asian, 6.2% Hispanic or Latino, and 4.2% African American. The median household income is $90,000, and the median age is 44.
Common Questions
What is Per Capita Income in Villa Park?
Per Capita income in Villa Park is $96,167.
What is the Median Family Income in Villa Park?
Median Family Income in Villa Park is $212,540.
What is the Median Household income in Villa Park?
Median Household Income in Villa Park is $189,306.
What is Income or Wage Gap in Villa Park?
Income or Wage Gap in Villa Park is 52.0%.
Women in Villa Park earn 48.0 cents for every dollar earned by a man.
What is Family Income Deficit in Villa Park?
Family Income Deficit in Villa Park is $14,290.
Families that are below poverty line in Villa Park earn $14,290 less on average than the poverty threshold level.
What is Inequality or Gini Index in Villa Park?
Inequality or Gini Index in Villa Park is 0.52.
What is the Total Population of Villa Park?
Total Population of Villa Park is 5,814.
What is the Total Male Population of Villa Park?
Total Male Population of Villa Park is 2,761.
What is the Total Female Population of Villa Park?
Total Female Population of Villa Park is 3,053.
What is the Ratio of Males per 100 Females in Villa Park?
There are 90.44 Males per 100 Females in Villa Park.
What is the Ratio of Females per 100 Males in Villa Park?
There are 110.58 Females per 100 Males in Villa Park.
What is the Median Population Age in Villa Park?
Median Population Age in Villa Park is 51.7 Years.
What is the Average Family Size in Villa Park
Average Family Size in Villa Park is 3.2 People.
What is the Average Household Size in Villa Park
Average Household Size in Villa Park is 3.0 People.
How Large is the Labor Force in Villa Park?
There are 2,433 People in the Labor Forcein in Villa Park.
What is the Percentage of People in the Labor Force in Villa Park?
50.9% of People are in the Labor Force in Villa Park.
What is the Unemployment Rate in Villa Park?
Unemployment Rate in Villa Park is 1.3%.