Cities with the Highest Percentage of Population Employed in Legal Services & Support in Rhode Island
RELATED REPORTS & OPTIONS
Legal Services & Support
Rhode Island
Compare Cities
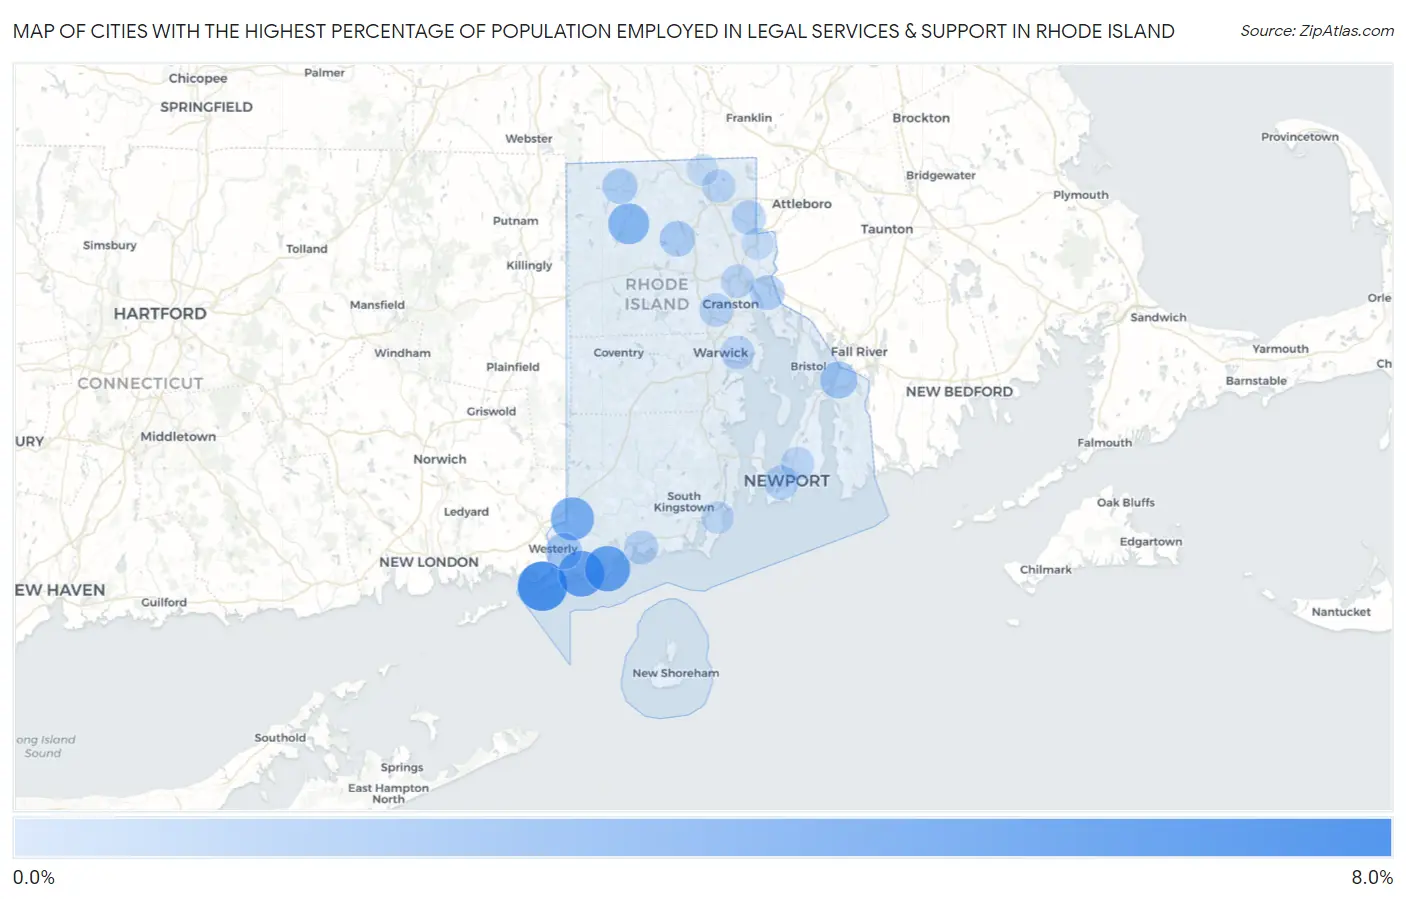
Map of Cities with the Highest Percentage of Population Employed in Legal Services & Support in Rhode Island
0.0%
8.0%
Cities with the Highest Percentage of Population Employed in Legal Services & Support in Rhode Island
| City | % Employed | vs State | vs National | |
| 1. | Watch Hill | 6.6% | 1.2%(+5.41)#1 | 1.2%(+5.41)#492 |
| 2. | Weekapaug | 5.3% | 1.2%(+4.14)#2 | 1.2%(+4.14)#753 |
| 3. | Quonochontaug | 5.2% | 1.2%(+4.02)#3 | 1.2%(+4.02)#785 |
| 4. | Ashaway | 4.4% | 1.2%(+3.18)#4 | 1.2%(+3.18)#1,057 |
| 5. | Chepachet | 3.6% | 1.2%(+2.43)#5 | 1.2%(+2.44)#1,451 |
| 6. | Tiverton | 2.3% | 1.2%(+1.11)#6 | 1.2%(+1.11)#2,728 |
| 7. | Westerly | 2.1% | 1.2%(+0.949)#7 | 1.2%(+0.953)#2,978 |
| 8. | Greenville | 1.8% | 1.2%(+0.657)#8 | 1.2%(+0.661)#3,528 |
| 9. | Harrisville | 1.7% | 1.2%(+0.555)#9 | 1.2%(+0.559)#3,770 |
| 10. | East Providence | 1.6% | 1.2%(+0.422)#10 | 1.2%(+0.426)#4,094 |
| 11. | Valley Falls | 1.4% | 1.2%(+0.248)#11 | 1.2%(+0.252)#4,626 |
| 12. | Newport | 1.4% | 1.2%(+0.209)#12 | 1.2%(+0.213)#4,755 |
| 13. | Charlestown | 1.3% | 1.2%(+0.113)#13 | 1.2%(+0.117)#5,059 |
| 14. | Cranston | 1.3% | 1.2%(+0.105)#14 | 1.2%(+0.109)#5,087 |
| 15. | Warwick | 1.2% | 1.2%(-0.007)#15 | 1.2%(-0.003)#5,527 |
| 16. | Newport East | 1.2% | 1.2%(-0.013)#16 | 1.2%(-0.009)#5,550 |
| 17. | Providence | 1.1% | 1.2%(-0.040)#17 | 1.2%(-0.036)#5,654 |
| 18. | Cumberland Hill | 1.1% | 1.2%(-0.056)#18 | 1.2%(-0.052)#5,725 |
| 19. | Narragansett Pier | 0.89% | 1.2%(-0.294)#19 | 1.2%(-0.290)#6,912 |
| 20. | Pawtucket | 0.69% | 1.2%(-0.502)#20 | 1.2%(-0.498)#8,179 |
| 21. | Woonsocket | 0.60% | 1.2%(-0.586)#21 | 1.2%(-0.582)#8,776 |
| 22. | Wakefield-Peace Dale | 0.42% | 1.2%(-0.772)#22 | 1.2%(-0.768)#10,146 |
1
Common Questions
What are the Top 10 Cities with the Highest Percentage of Population Employed in Legal Services & Support in Rhode Island?
Top 10 Cities with the Highest Percentage of Population Employed in Legal Services & Support in Rhode Island are:
#1
6.6%
#2
5.3%
#3
5.2%
#4
4.4%
#5
3.6%
#6
2.3%
#7
2.1%
#8
1.8%
#9
1.7%
#10
1.6%
What city has the Highest Percentage of Population Employed in Legal Services & Support in Rhode Island?
Watch Hill has the Highest Percentage of Population Employed in Legal Services & Support in Rhode Island with 6.6%.
What is the Percentage of Population Employed in Legal Services & Support in the State of Rhode Island?
Percentage of Population Employed in Legal Services & Support in Rhode Island is 1.2%.
What is the Percentage of Population Employed in Legal Services & Support in the United States?
Percentage of Population Employed in Legal Services & Support in the United States is 1.2%.