Zip Codes with the Highest Percentage of Population Employed in Legal Services & Support in San Jose, CA
RELATED REPORTS & OPTIONS
Legal Services & Support
San Jose
Compare Zip Codes
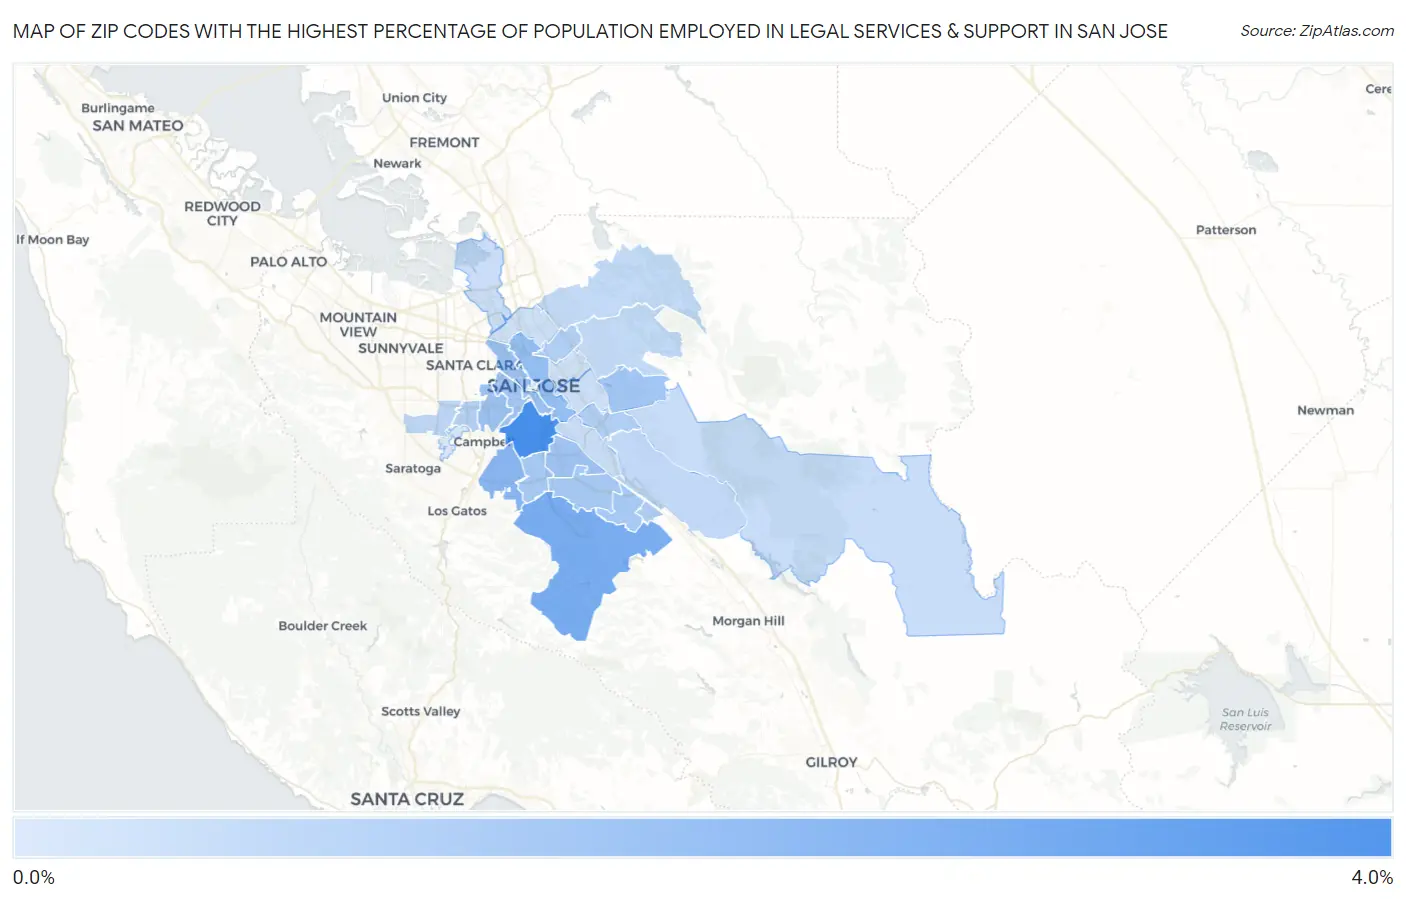
Map of Zip Codes with the Highest Percentage of Population Employed in Legal Services & Support in San Jose
0.015%
3.1%
Zip Codes with the Highest Percentage of Population Employed in Legal Services & Support in San Jose, CA
| Zip Code | % Employed | vs State | vs National | |
| 1. | 95125 | 3.1% | 1.3%(+1.86)#157 | 1.2%(+1.93)#1,732 |
| 2. | 95120 | 2.0% | 1.3%(+0.787)#289 | 1.2%(+0.862)#3,345 |
| 3. | 95124 | 1.7% | 1.3%(+0.486)#354 | 1.2%(+0.561)#4,160 |
| 4. | 95112 | 1.5% | 1.3%(+0.223)#435 | 1.2%(+0.297)#5,120 |
| 5. | 95128 | 1.3% | 1.3%(+0.029)#489 | 1.2%(+0.103)#5,998 |
| 6. | 95110 | 1.3% | 1.3%(+0.025)#492 | 1.2%(+0.099)#6,025 |
| 7. | 95136 | 1.3% | 1.3%(+0.004)#508 | 1.2%(+0.078)#6,142 |
| 8. | 95126 | 1.2% | 1.3%(-0.049)#527 | 1.2%(+0.025)#6,427 |
| 9. | 95148 | 1.2% | 1.3%(-0.072)#543 | 1.2%(+0.002)#6,599 |
| 10. | 95119 | 1.1% | 1.3%(-0.139)#578 | 1.2%(-0.064)#7,022 |
| 11. | 95118 | 1.1% | 1.3%(-0.154)#590 | 1.2%(-0.079)#7,139 |
| 12. | 95123 | 1.1% | 1.3%(-0.165)#598 | 1.2%(-0.091)#7,225 |
| 13. | 95139 | 0.91% | 1.3%(-0.352)#678 | 1.2%(-0.277)#8,547 |
| 14. | 95121 | 0.88% | 1.3%(-0.383)#695 | 1.2%(-0.308)#8,816 |
| 15. | 95133 | 0.87% | 1.3%(-0.390)#701 | 1.2%(-0.316)#8,873 |
| 16. | 95117 | 0.81% | 1.3%(-0.446)#734 | 1.2%(-0.372)#9,339 |
| 17. | 95129 | 0.62% | 1.3%(-0.641)#856 | 1.2%(-0.567)#11,289 |
| 18. | 95138 | 0.58% | 1.3%(-0.681)#876 | 1.2%(-0.607)#11,729 |
| 19. | 95132 | 0.55% | 1.3%(-0.711)#902 | 1.2%(-0.637)#12,086 |
| 20. | 95127 | 0.53% | 1.3%(-0.730)#911 | 1.2%(-0.655)#12,275 |
| 21. | 95135 | 0.45% | 1.3%(-0.810)#974 | 1.2%(-0.735)#13,263 |
| 22. | 95111 | 0.38% | 1.3%(-0.878)#1,020 | 1.2%(-0.803)#14,077 |
| 23. | 95134 | 0.37% | 1.3%(-0.887)#1,032 | 1.2%(-0.813)#14,185 |
| 24. | 95131 | 0.29% | 1.3%(-0.965)#1,064 | 1.2%(-0.890)#15,118 |
| 25. | 95122 | 0.29% | 1.3%(-0.973)#1,069 | 1.2%(-0.899)#15,194 |
| 26. | 95116 | 0.25% | 1.3%(-1.01)#1,090 | 1.2%(-0.931)#15,598 |
| 27. | 95130 | 0.015% | 1.3%(-1.24)#1,189 | 1.2%(-1.17)#17,504 |
1
Common Questions
What are the Top 10 Zip Codes with the Highest Percentage of Population Employed in Legal Services & Support in San Jose, CA?
Top 10 Zip Codes with the Highest Percentage of Population Employed in Legal Services & Support in San Jose, CA are:
What zip code has the Highest Percentage of Population Employed in Legal Services & Support in San Jose, CA?
95125 has the Highest Percentage of Population Employed in Legal Services & Support in San Jose, CA with 3.1%.
What is the Percentage of Population Employed in Legal Services & Support in San Jose, CA?
Percentage of Population Employed in Legal Services & Support in San Jose is 0.98%.
What is the Percentage of Population Employed in Legal Services & Support in California?
Percentage of Population Employed in Legal Services & Support in California is 1.3%.
What is the Percentage of Population Employed in Legal Services & Support in the United States?
Percentage of Population Employed in Legal Services & Support in the United States is 1.2%.