Keene, CA Map & Demographics
Keene Map
Keene Overview
$52,737
PER CAPITA INCOME
$107,163
AVG FAMILY INCOME
$102,361
AVG HOUSEHOLD INCOME
0.37
INEQUALITY / GINI INDEX
404
TOTAL POPULATION
228
MALE POPULATION
176
FEMALE POPULATION
129.55
MALES / 100 FEMALES
77.19
FEMALES / 100 MALES
55.3
MEDIAN AGE
2.7
AVG FAMILY SIZE
2.4
AVG HOUSEHOLD SIZE
199
LABOR FORCE [ PEOPLE ]
53.1%
PERCENT IN LABOR FORCE
Keene Zip Codes
Keene Area Codes
Income in Keene
Income Overview in Keene
Per Capita Income in Keene is $52,737, while median incomes of families and households are $107,163 and $102,361 respectively.
| Characteristic | Number | Measure |
| Per Capita Income | 404 | $52,737 |
| Median Family Income | 125 | $107,163 |
| Mean Family Income | 125 | $148,485 |
| Median Household Income | 171 | $102,361 |
| Mean Household Income | 171 | $124,373 |
| Income Deficit | 125 | $0 |
| Wage / Income Gap (%) | 404 | 0.00% |
| Wage / Income Gap ($) | 404 | 100.00¢ per $1 |
| Gini / Inequality Index | 404 | 0.37 |
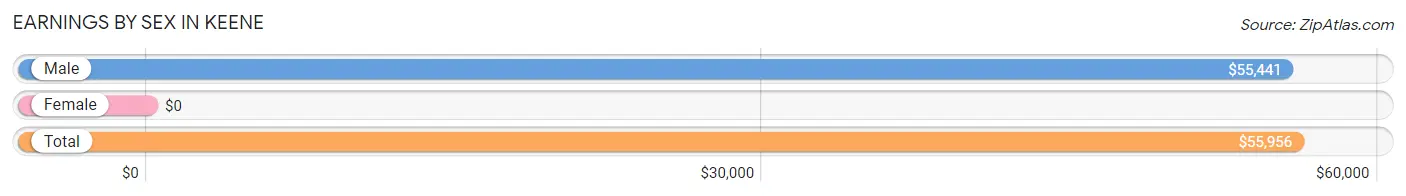
Earnings by Sex in Keene
| Sex | Number | Average Earnings |
| Male | 98 (49.2%) | $55,441 |
| Female | 101 (50.7%) | $0 |
| Total | 199 (100.0%) | $55,956 |
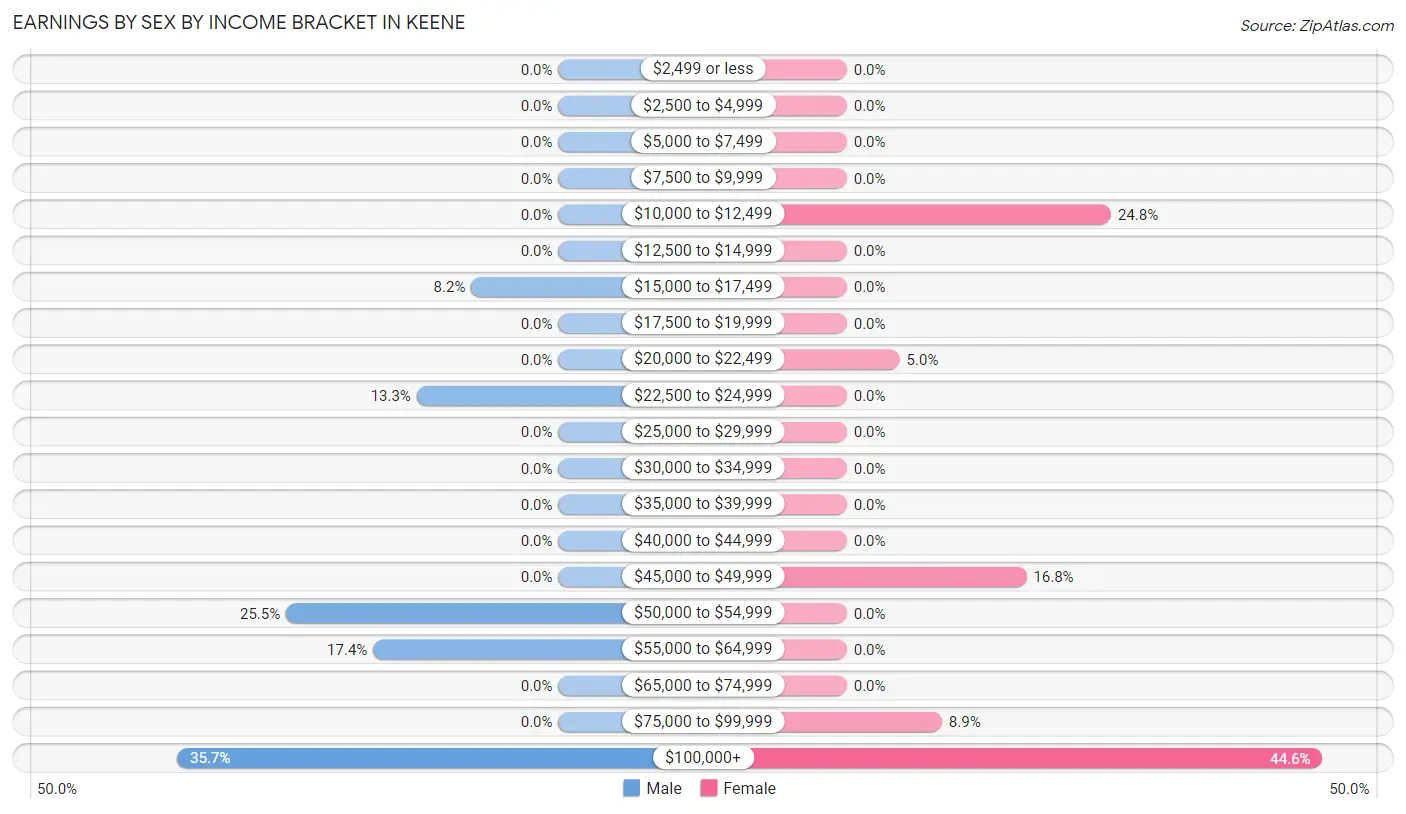
Earnings by Sex by Income Bracket in Keene
The most common earnings brackets in Keene are $100,000+ for men (35 | 35.7%) and $100,000+ for women (45 | 44.6%).
| Income | Male | Female |
| $2,499 or less | 0 (0.0%) | 0 (0.0%) |
| $2,500 to $4,999 | 0 (0.0%) | 0 (0.0%) |
| $5,000 to $7,499 | 0 (0.0%) | 0 (0.0%) |
| $7,500 to $9,999 | 0 (0.0%) | 0 (0.0%) |
| $10,000 to $12,499 | 0 (0.0%) | 25 (24.7%) |
| $12,500 to $14,999 | 0 (0.0%) | 0 (0.0%) |
| $15,000 to $17,499 | 8 (8.2%) | 0 (0.0%) |
| $17,500 to $19,999 | 0 (0.0%) | 0 (0.0%) |
| $20,000 to $22,499 | 0 (0.0%) | 5 (5.0%) |
| $22,500 to $24,999 | 13 (13.3%) | 0 (0.0%) |
| $25,000 to $29,999 | 0 (0.0%) | 0 (0.0%) |
| $30,000 to $34,999 | 0 (0.0%) | 0 (0.0%) |
| $35,000 to $39,999 | 0 (0.0%) | 0 (0.0%) |
| $40,000 to $44,999 | 0 (0.0%) | 0 (0.0%) |
| $45,000 to $49,999 | 0 (0.0%) | 17 (16.8%) |
| $50,000 to $54,999 | 25 (25.5%) | 0 (0.0%) |
| $55,000 to $64,999 | 17 (17.3%) | 0 (0.0%) |
| $65,000 to $74,999 | 0 (0.0%) | 0 (0.0%) |
| $75,000 to $99,999 | 0 (0.0%) | 9 (8.9%) |
| $100,000+ | 35 (35.7%) | 45 (44.6%) |
| Total | 98 (100.0%) | 101 (100.0%) |
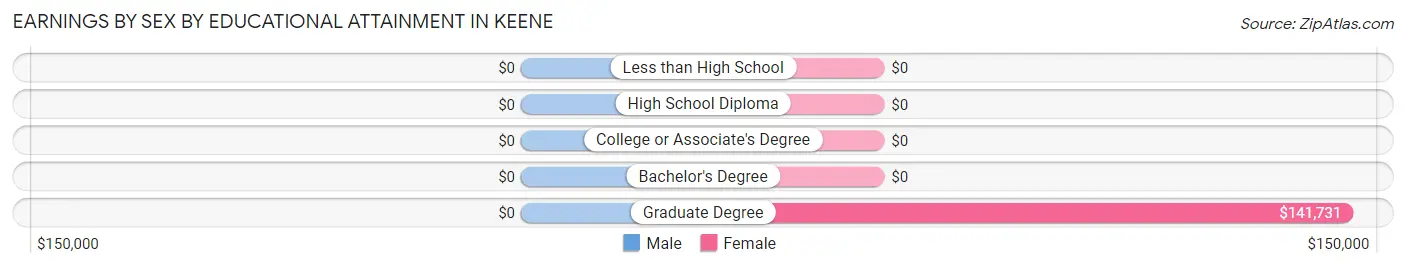
Earnings by Sex by Educational Attainment in Keene
| Educational Attainment | Male Income | Female Income |
| Less than High School | - | - |
| High School Diploma | - | - |
| College or Associate's Degree | - | - |
| Bachelor's Degree | - | - |
| Graduate Degree | - | - |
| Total | $55,441 | $0 |
Family Income in Keene
Family Income Brackets in Keene
According to the Keene family income data, there are 50 families falling into the $200,000+ income range, which is the most common income bracket and makes up 40.0% of all families.
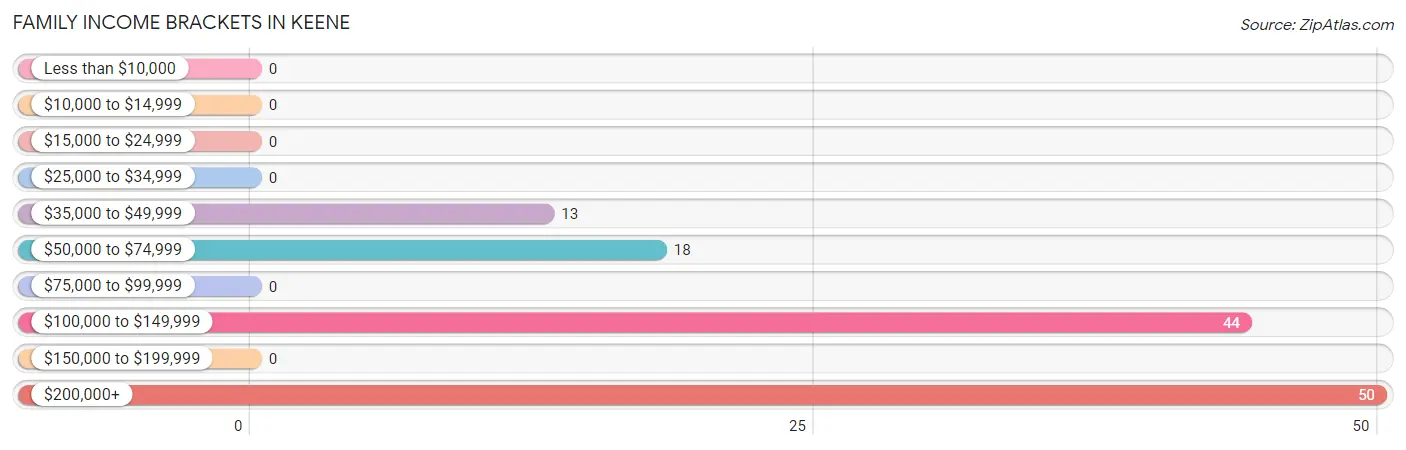
| Income Bracket | # Families | % Families |
| Less than $10,000 | 0 | 0.0% |
| $10,000 to $14,999 | 0 | 0.0% |
| $15,000 to $24,999 | 0 | 0.0% |
| $25,000 to $34,999 | 0 | 0.0% |
| $35,000 to $49,999 | 13 | 10.4% |
| $50,000 to $74,999 | 18 | 14.4% |
| $75,000 to $99,999 | 0 | 0.0% |
| $100,000 to $149,999 | 44 | 35.2% |
| $150,000 to $199,999 | 0 | 0.0% |
| $200,000+ | 50 | 40.0% |
Family Income by Famaliy Size in Keene
2-person families (71 | 56.8%) account for the highest median family income in Keene with $105,817 per family, while 2-person families (71 | 56.8%) have the highest median income of $52,908 per family member.
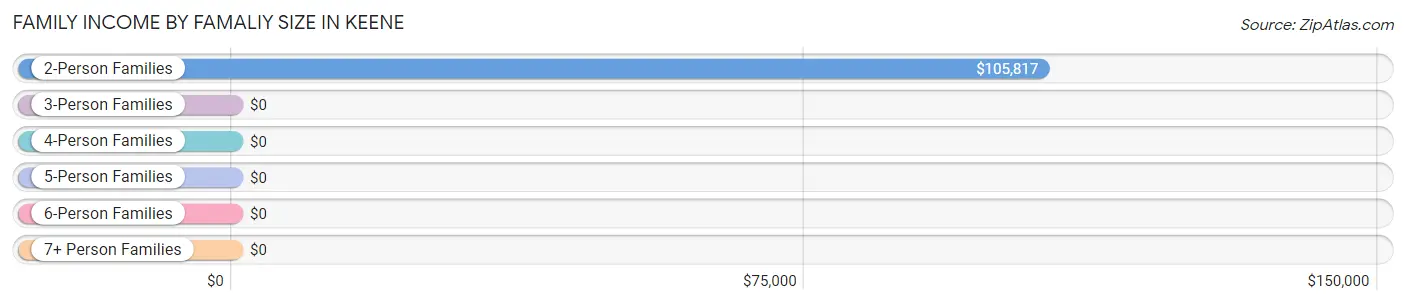
| Income Bracket | # Families | Median Income |
| 2-Person Families | 71 (56.8%) | $105,817 |
| 3-Person Families | 32 (25.6%) | $0 |
| 4-Person Families | 22 (17.6%) | $0 |
| 5-Person Families | 0 (0.0%) | $0 |
| 6-Person Families | 0 (0.0%) | $0 |
| 7+ Person Families | 0 (0.0%) | $0 |
| Total | 125 (100.0%) | $107,163 |
Family Income by Number of Earners in Keene
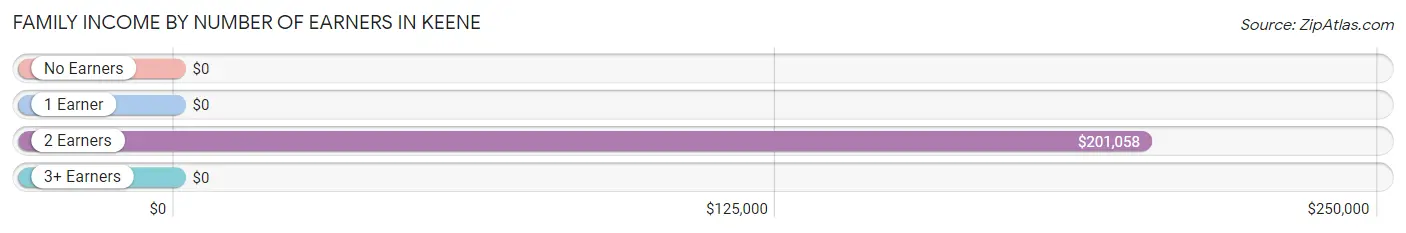
| Number of Earners | # Families | Median Income |
| No Earners | 26 (20.8%) | $0 |
| 1 Earner | 27 (21.6%) | $0 |
| 2 Earners | 66 (52.8%) | $201,058 |
| 3+ Earners | 6 (4.8%) | $0 |
| Total | 125 (100.0%) | $107,163 |
Household Income in Keene
Household Income Brackets in Keene
With 64 households falling in the category, the $50,000 to $74,999 income range is the most frequent in Keene, accounting for 37.4% of all households.
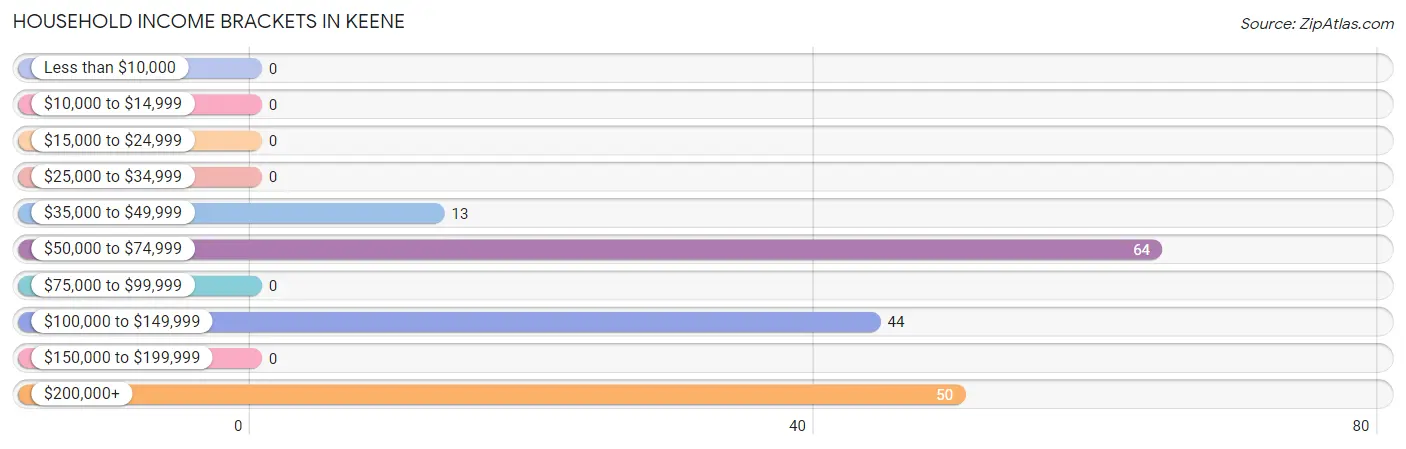
| Income Bracket | # Households | % Households |
| Less than $10,000 | 0 | 0.0% |
| $10,000 to $14,999 | 0 | 0.0% |
| $15,000 to $24,999 | 0 | 0.0% |
| $25,000 to $34,999 | 0 | 0.0% |
| $35,000 to $49,999 | 13 | 7.6% |
| $50,000 to $74,999 | 64 | 37.4% |
| $75,000 to $99,999 | 0 | 0.0% |
| $100,000 to $149,999 | 44 | 25.7% |
| $150,000 to $199,999 | 0 | 0.0% |
| $200,000+ | 50 | 29.2% |
Household Income by Householder Age in Keene
The median household income in Keene is $102,361, with the highest median household income of $200,625 found in the 45 to 64 years age bracket for the primary householder. A total of 75 households (43.9%) fall into this category.
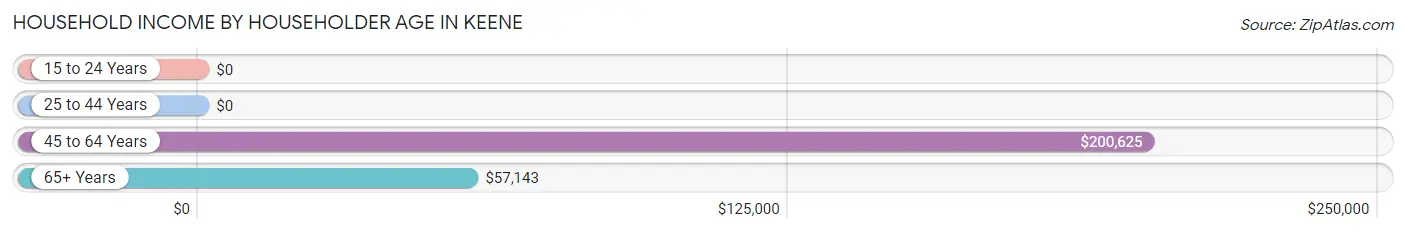
| Income Bracket | # Households | Median Income |
| 15 to 24 Years | 0 (0.0%) | $0 |
| 25 to 44 Years | 0 (0.0%) | $0 |
| 45 to 64 Years | 75 (43.9%) | $200,625 |
| 65+ Years | 96 (56.1%) | $57,143 |
| Total | 171 (100.0%) | $102,361 |
Poverty in Keene
Income Below Poverty by Sex and Age in Keene
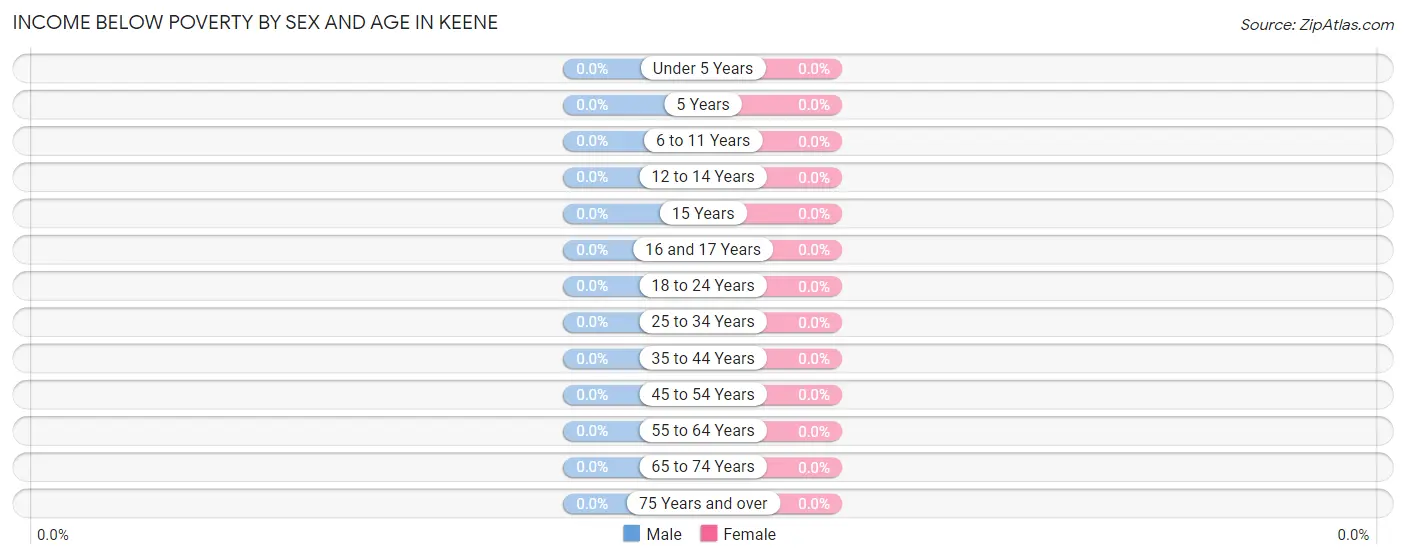
| Age Bracket | Male | Female |
| Under 5 Years | 0 (0.0%) | 0 (0.0%) |
| 5 Years | 0 (0.0%) | 0 (0.0%) |
| 6 to 11 Years | 0 (0.0%) | 0 (0.0%) |
| 12 to 14 Years | 0 (0.0%) | 0 (0.0%) |
| 15 Years | 0 (0.0%) | 0 (0.0%) |
| 16 and 17 Years | 0 (0.0%) | 0 (0.0%) |
| 18 to 24 Years | 0 (0.0%) | 0 (0.0%) |
| 25 to 34 Years | 0 (0.0%) | 0 (0.0%) |
| 35 to 44 Years | 0 (0.0%) | 0 (0.0%) |
| 45 to 54 Years | 0 (0.0%) | 0 (0.0%) |
| 55 to 64 Years | 0 (0.0%) | 0 (0.0%) |
| 65 to 74 Years | 0 (0.0%) | 0 (0.0%) |
| 75 Years and over | 0 (0.0%) | 0 (0.0%) |
| Total | 0 (0.0%) | 0 (0.0%) |
Income Above Poverty by Sex and Age in Keene
According to the poverty statistics in Keene, males aged 12 to 14 years and females aged 18 to 24 years are the age groups that are most secure financially, with 100.0% of males and 100.0% of females in these age groups living above the poverty line.
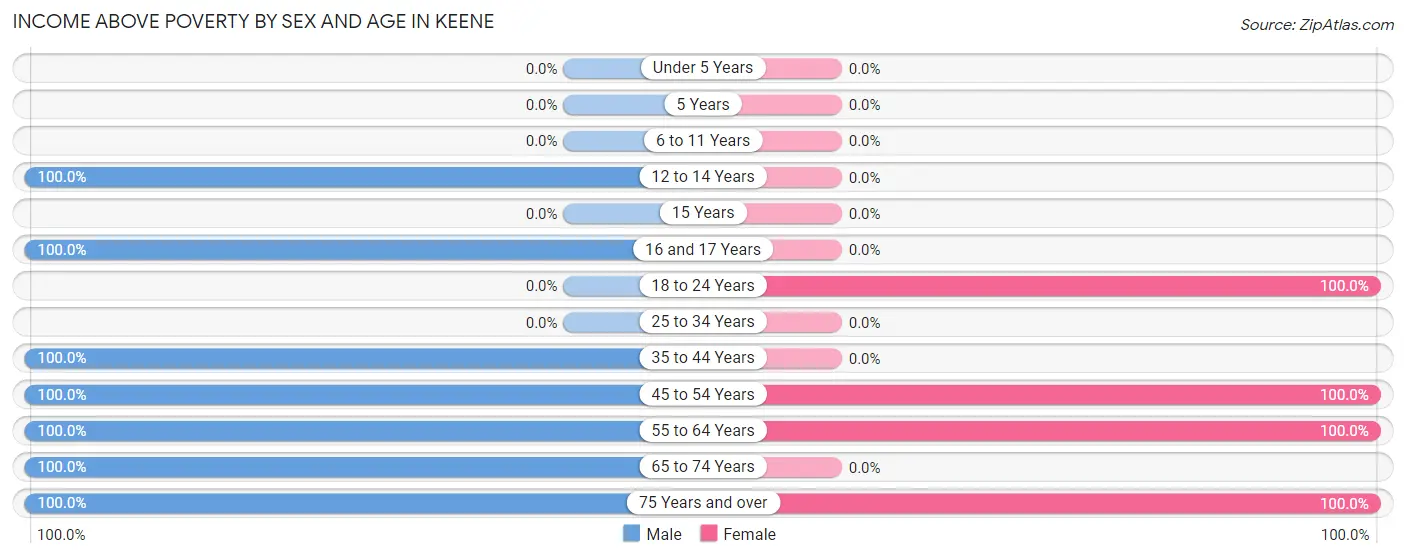
| Age Bracket | Male | Female |
| Under 5 Years | 0 (0.0%) | 0 (0.0%) |
| 5 Years | 0 (0.0%) | 0 (0.0%) |
| 6 to 11 Years | 0 (0.0%) | 0 (0.0%) |
| 12 to 14 Years | 29 (100.0%) | 0 (0.0%) |
| 15 Years | 0 (0.0%) | 0 (0.0%) |
| 16 and 17 Years | 14 (100.0%) | 0 (0.0%) |
| 18 to 24 Years | 0 (0.0%) | 42 (100.0%) |
| 25 to 34 Years | 0 (0.0%) | 0 (0.0%) |
| 35 to 44 Years | 8 (100.0%) | 0 (0.0%) |
| 45 to 54 Years | 49 (100.0%) | 57 (100.0%) |
| 55 to 64 Years | 40 (100.0%) | 40 (100.0%) |
| 65 to 74 Years | 77 (100.0%) | 0 (0.0%) |
| 75 Years and over | 11 (100.0%) | 37 (100.0%) |
| Total | 228 (100.0%) | 176 (100.0%) |
Income Below Poverty Among Married-Couple Families in Keene
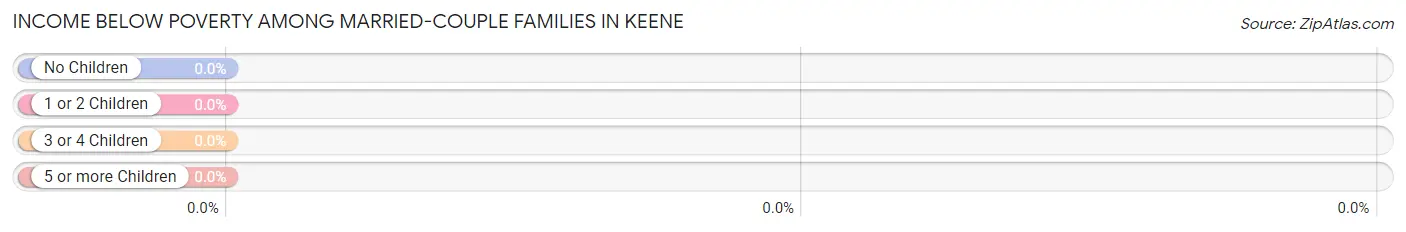
| Children | Above Poverty | Below Poverty |
| No Children | 86 (100.0%) | 0 (0.0%) |
| 1 or 2 Children | 39 (100.0%) | 0 (0.0%) |
| 3 or 4 Children | 0 (0.0%) | 0 (0.0%) |
| 5 or more Children | 0 (0.0%) | 0 (0.0%) |
| Total | 125 (100.0%) | 0 (0.0%) |
Income Below Poverty Among Single-Parent Households in Keene
| Children | Single Father | Single Mother |
| No Children | 0 (0.0%) | 0 (0.0%) |
| 1 or 2 Children | 0 (0.0%) | 0 (0.0%) |
| 3 or 4 Children | 0 (0.0%) | 0 (0.0%) |
| 5 or more Children | 0 (0.0%) | 0 (0.0%) |
| Total | 0 (0.0%) | 0 (0.0%) |
Income Below Poverty Among Married-Couple vs Single-Parent Households in Keene
| Children | Married-Couple Families | Single-Parent Households |
| No Children | 0 (0.0%) | 0 (0.0%) |
| 1 or 2 Children | 0 (0.0%) | 0 (0.0%) |
| 3 or 4 Children | 0 (0.0%) | 0 (0.0%) |
| 5 or more Children | 0 (0.0%) | 0 (0.0%) |
| Total | 0 (0.0%) | 0 (0.0%) |
Race in Keene
The most populous races in Keene are White / Caucasian (375 | 92.8%), Hispanic or Latino (54 | 13.4%), and Asian (29 | 7.2%).
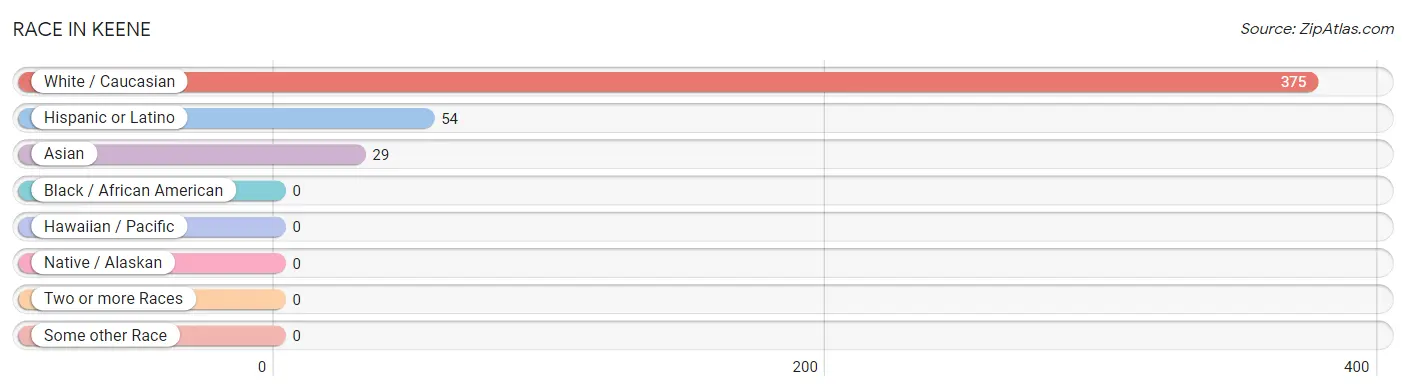
| Race | # Population | % Population |
| Asian | 29 | 7.2% |
| Black / African American | 0 | 0.0% |
| Hawaiian / Pacific | 0 | 0.0% |
| Hispanic or Latino | 54 | 13.4% |
| Native / Alaskan | 0 | 0.0% |
| White / Caucasian | 375 | 92.8% |
| Two or more Races | 0 | 0.0% |
| Some other Race | 0 | 0.0% |
| Total | 404 | 100.0% |
Ancestry in Keene
The most populous ancestries reported in Keene are German (75 | 18.6%), American (74 | 18.3%), English (57 | 14.1%), Mexican (54 | 13.4%), and Indian (Asian) (29 | 7.2%), together accounting for 71.5% of all Keene residents.
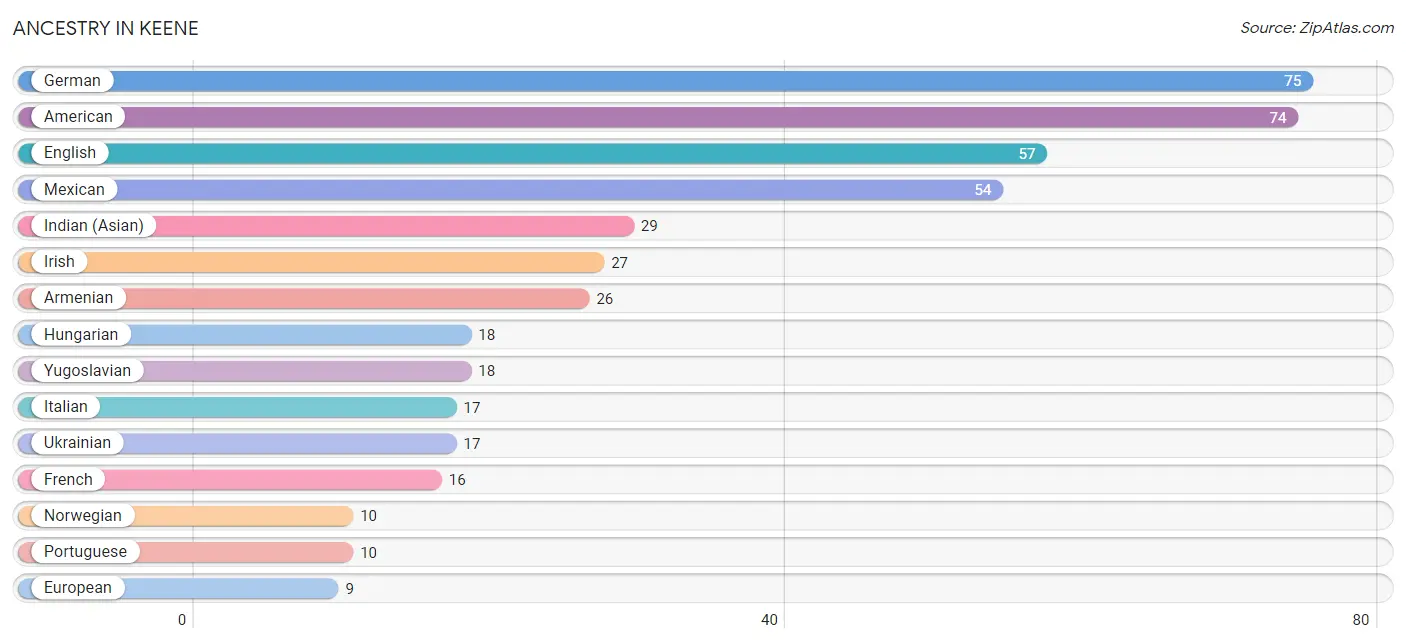
| Ancestry | # Population | % Population |
| American | 74 | 18.3% |
| Armenian | 26 | 6.4% |
| English | 57 | 14.1% |
| European | 9 | 2.2% |
| French | 16 | 4.0% |
| German | 75 | 18.6% |
| Hungarian | 18 | 4.5% |
| Indian (Asian) | 29 | 7.2% |
| Irish | 27 | 6.7% |
| Italian | 17 | 4.2% |
| Mexican | 54 | 13.4% |
| Norwegian | 10 | 2.5% |
| Portuguese | 10 | 2.5% |
| Ukrainian | 17 | 4.2% |
| Yugoslavian | 18 | 4.5% | View All 15 Rows |
Immigrants in Keene
The most numerous immigrant groups reported in Keene came from Central America (40 | 9.9%), Latin America (40 | 9.9%), Mexico (40 | 9.9%), Asia (29 | 7.2%), and China (29 | 7.2%), together accounting for 44.1% of all Keene residents.
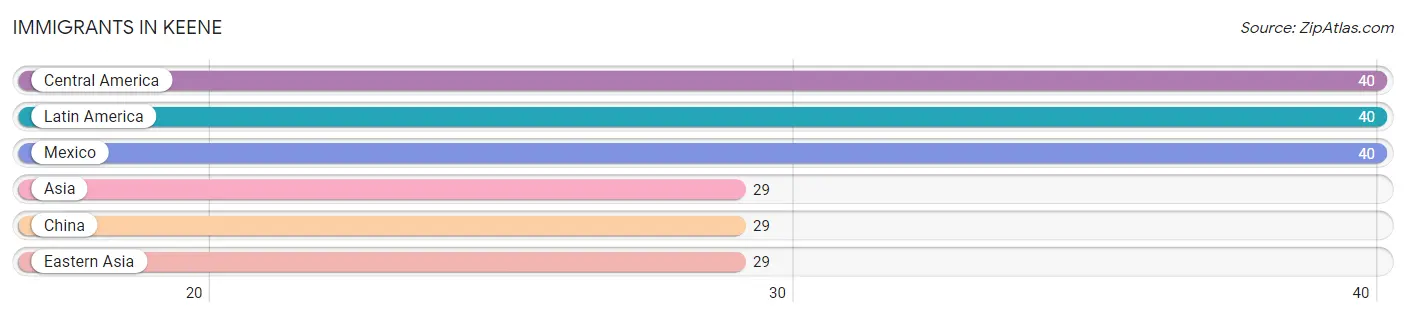
| Immigration Origin | # Population | % Population |
| Asia | 29 | 7.2% |
| Central America | 40 | 9.9% |
| China | 29 | 7.2% |
| Eastern Asia | 29 | 7.2% |
| Latin America | 40 | 9.9% |
| Mexico | 40 | 9.9% | View All 6 Rows |
Sex and Age in Keene
Sex and Age in Keene
The most populous age groups in Keene are 65 to 69 Years (77 | 33.8%) for men and 20 to 24 Years (42 | 23.9%) for women.
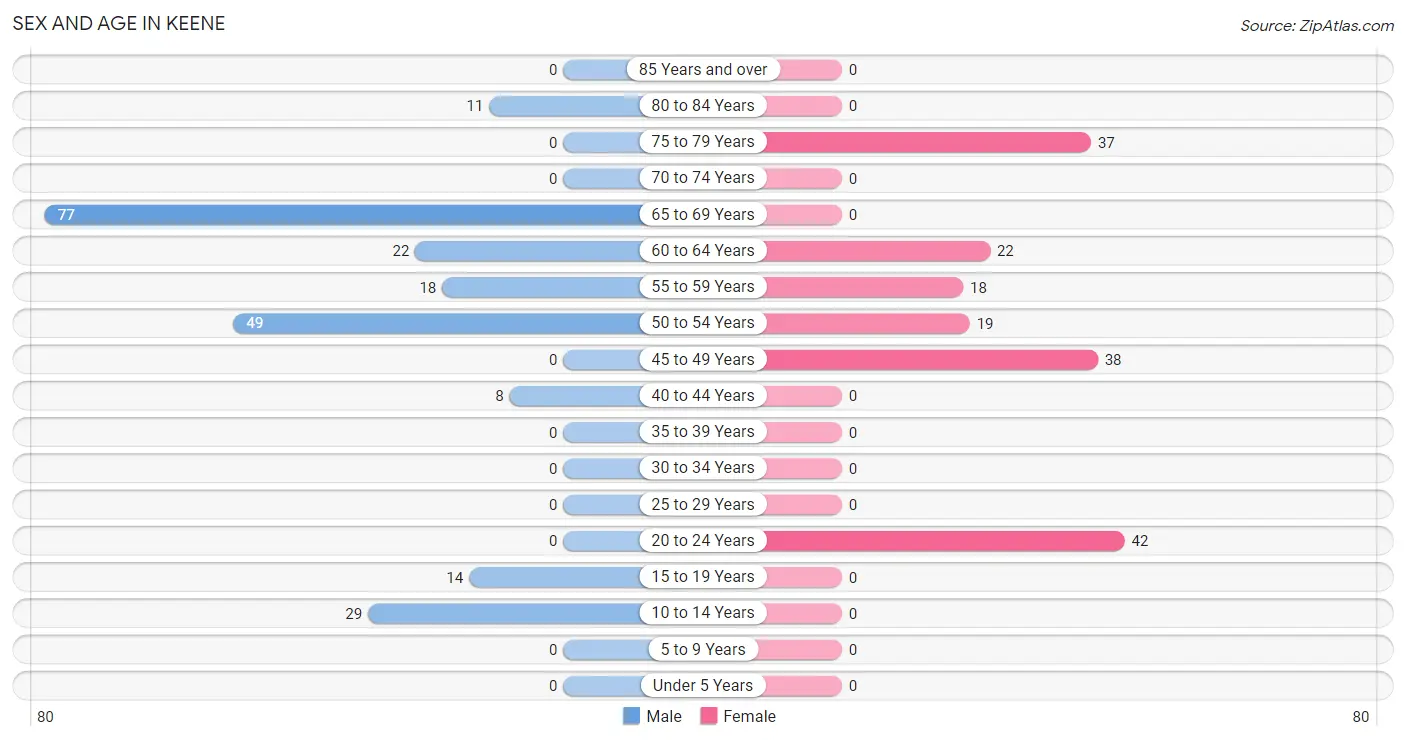
| Age Bracket | Male | Female |
| Under 5 Years | 0 (0.0%) | 0 (0.0%) |
| 5 to 9 Years | 0 (0.0%) | 0 (0.0%) |
| 10 to 14 Years | 29 (12.7%) | 0 (0.0%) |
| 15 to 19 Years | 14 (6.1%) | 0 (0.0%) |
| 20 to 24 Years | 0 (0.0%) | 42 (23.9%) |
| 25 to 29 Years | 0 (0.0%) | 0 (0.0%) |
| 30 to 34 Years | 0 (0.0%) | 0 (0.0%) |
| 35 to 39 Years | 0 (0.0%) | 0 (0.0%) |
| 40 to 44 Years | 8 (3.5%) | 0 (0.0%) |
| 45 to 49 Years | 0 (0.0%) | 38 (21.6%) |
| 50 to 54 Years | 49 (21.5%) | 19 (10.8%) |
| 55 to 59 Years | 18 (7.9%) | 18 (10.2%) |
| 60 to 64 Years | 22 (9.7%) | 22 (12.5%) |
| 65 to 69 Years | 77 (33.8%) | 0 (0.0%) |
| 70 to 74 Years | 0 (0.0%) | 0 (0.0%) |
| 75 to 79 Years | 0 (0.0%) | 37 (21.0%) |
| 80 to 84 Years | 11 (4.8%) | 0 (0.0%) |
| 85 Years and over | 0 (0.0%) | 0 (0.0%) |
| Total | 228 (100.0%) | 176 (100.0%) |
Families and Households in Keene
Median Family Size in Keene
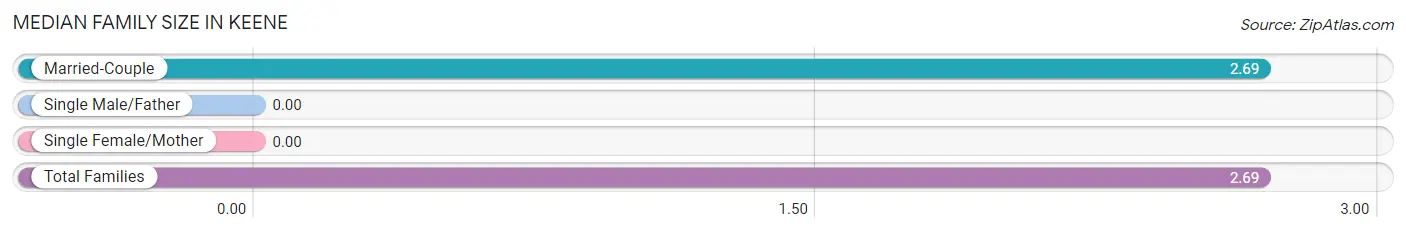
| Family Type | # Families | Family Size |
| Married-Couple | 125 (100.0%) | 2.69 |
| Single Male/Father | 0 (0.0%) | - |
| Single Female/Mother | 0 (0.0%) | - |
| Total Families | 125 (100.0%) | 2.69 |
Median Household Size in Keene
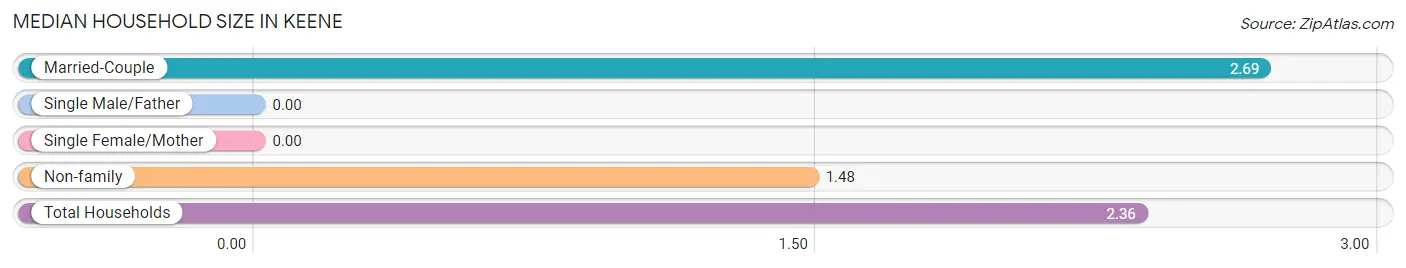
| Household Type | # Households | Household Size |
| Married-Couple | 125 (73.1%) | 2.69 |
| Single Male/Father | 0 (0.0%) | - |
| Single Female/Mother | 0 (0.0%) | - |
| Non-family | 46 (26.9%) | 1.48 |
| Total Households | 171 (100.0%) | 2.36 |
Household Size by Marriage Status in Keene
Out of a total of 171 households in Keene, 125 (73.1%) are family households, while 46 (26.9%) are nonfamily households. The most numerous type of family households are 2-person households, comprising 71, and the most common type of nonfamily households are 1-person households, comprising 28.
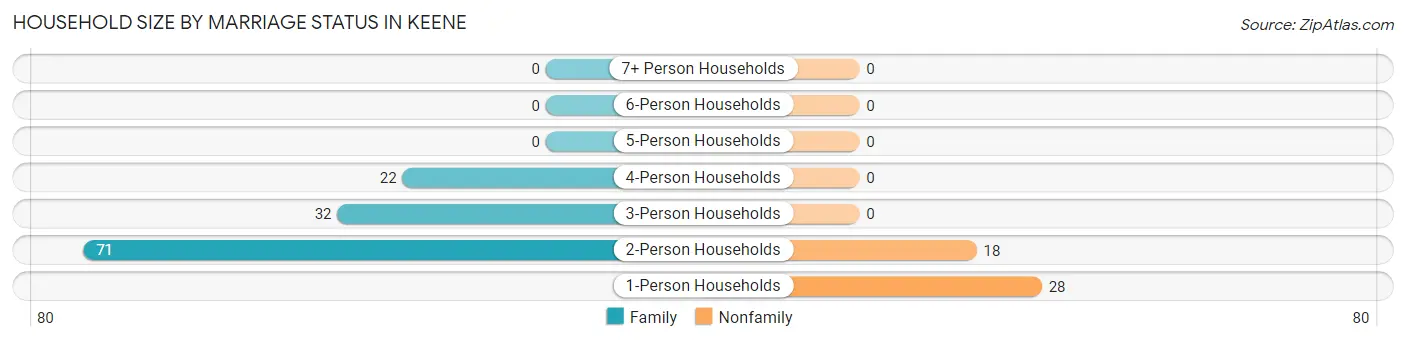
| Household Size | Family Households | Nonfamily Households |
| 1-Person Households | - | 28 (16.4%) |
| 2-Person Households | 71 (41.5%) | 18 (10.5%) |
| 3-Person Households | 32 (18.7%) | 0 (0.0%) |
| 4-Person Households | 22 (12.9%) | 0 (0.0%) |
| 5-Person Households | 0 (0.0%) | 0 (0.0%) |
| 6-Person Households | 0 (0.0%) | 0 (0.0%) |
| 7+ Person Households | 0 (0.0%) | 0 (0.0%) |
| Total | 125 (73.1%) | 46 (26.9%) |
Female Fertility in Keene
Fertility by Age in Keene
| Age Bracket | Women with Births | Births / 1,000 Women |
| 15 to 19 years | 0 (0.0%) | 0.0 |
| 20 to 34 years | 0 (0.0%) | 0.0 |
| 35 to 50 years | 0 (0.0%) | 0.0 |
| Total | 0 (0.0%) | 0.0 |
Fertility by Age by Marriage Status in Keene
| Age Bracket | Married | Unmarried |
| 15 to 19 years | 0 (0.0%) | 0 (0.0%) |
| 20 to 34 years | 0 (0.0%) | 0 (0.0%) |
| 35 to 50 years | 0 (0.0%) | 0 (0.0%) |
| Total | 0 (0.0%) | 0 (0.0%) |
Fertility by Education in Keene
| Educational Attainment | Women with Births | Births / 1,000 Women |
| Less than High School | 0 (0.0%) | 0.0 |
| High School Diploma | 0 (0.0%) | 0.0 |
| College or Associate's Degree | 0 (0.0%) | 0.0 |
| Bachelor's Degree | 0 (0.0%) | 0.0 |
| Graduate Degree | 0 (0.0%) | 0.0 |
| Total | 0 (0.0%) | 0.0 |
Fertility by Education by Marriage Status in Keene
| Educational Attainment | Married | Unmarried |
| Less than High School | 0 (0.0%) | 0 (0.0%) |
| High School Diploma | 0 (0.0%) | 0 (0.0%) |
| College or Associate's Degree | 0 (0.0%) | 0 (0.0%) |
| Bachelor's Degree | 0 (0.0%) | 0 (0.0%) |
| Graduate Degree | 0 (0.0%) | 0 (0.0%) |
| Total | 0 (0.0%) | 0 (0.0%) |
Employment Characteristics in Keene
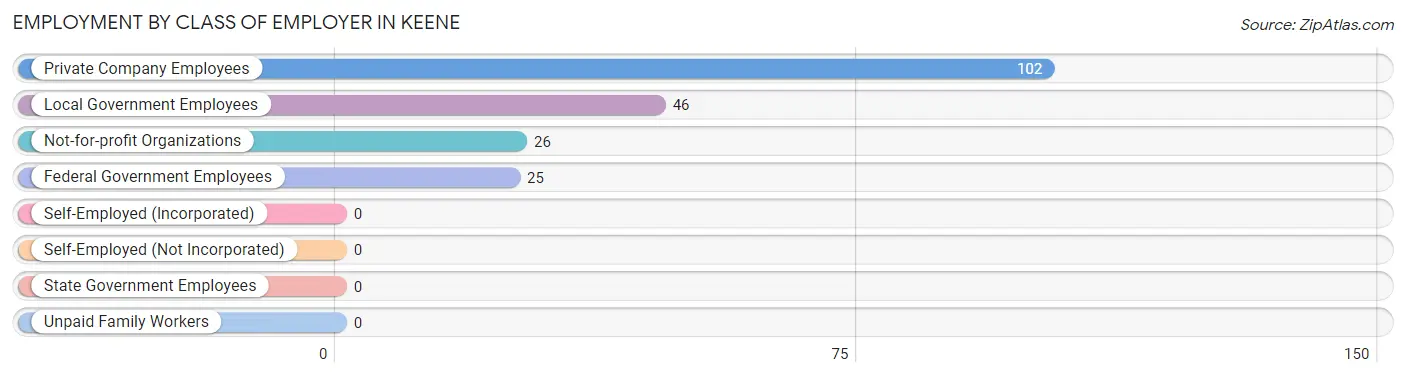
Employment by Class of Employer in Keene
Among the 199 employed individuals in Keene, private company employees (102 | 51.3%), local government employees (46 | 23.1%), and not-for-profit organizations (26 | 13.1%) make up the most common classes of employment.
| Employer Class | # Employees | % Employees |
| Private Company Employees | 102 | 51.3% |
| Self-Employed (Incorporated) | 0 | 0.0% |
| Self-Employed (Not Incorporated) | 0 | 0.0% |
| Not-for-profit Organizations | 26 | 13.1% |
| Local Government Employees | 46 | 23.1% |
| State Government Employees | 0 | 0.0% |
| Federal Government Employees | 25 | 12.6% |
| Unpaid Family Workers | 0 | 0.0% |
| Total | 199 | 100.0% |
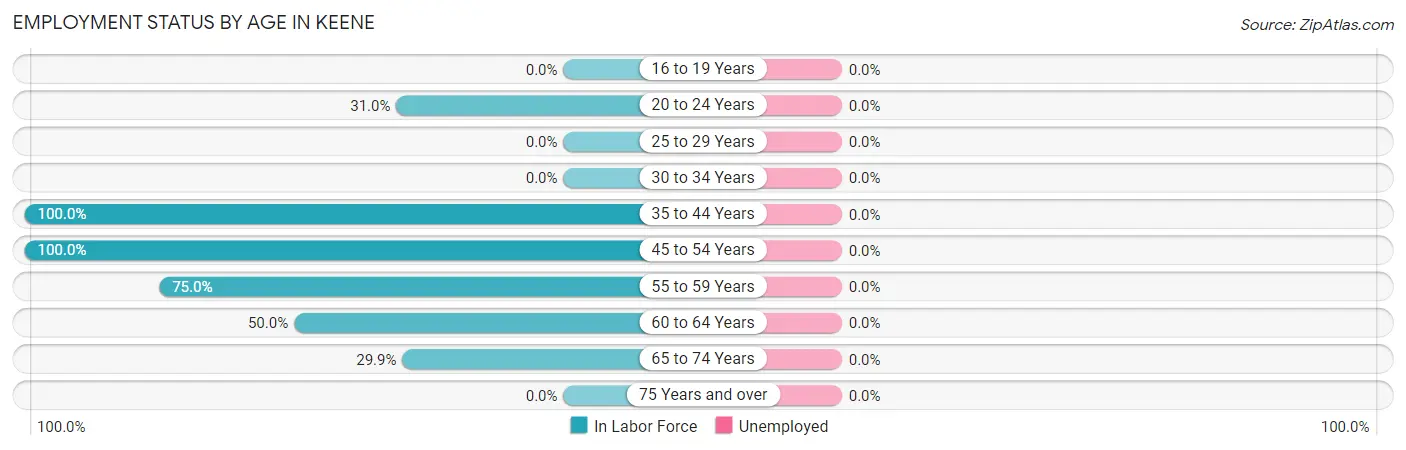
Employment Status by Age in Keene
| Age Bracket | In Labor Force | Unemployed |
| 16 to 19 Years | 0 (0.0%) | 0 (0.0%) |
| 20 to 24 Years | 13 (31.0%) | 0 (0.0%) |
| 25 to 29 Years | 0 (0.0%) | 0 (0.0%) |
| 30 to 34 Years | 0 (0.0%) | 0 (0.0%) |
| 35 to 44 Years | 8 (100.0%) | 0 (0.0%) |
| 45 to 54 Years | 106 (100.0%) | 0 (0.0%) |
| 55 to 59 Years | 27 (75.0%) | 0 (0.0%) |
| 60 to 64 Years | 22 (50.0%) | 0 (0.0%) |
| 65 to 74 Years | 23 (29.9%) | 0 (0.0%) |
| 75 Years and over | 0 (0.0%) | 0 (0.0%) |
| Total | 199 (53.1%) | 0 (0.0%) |
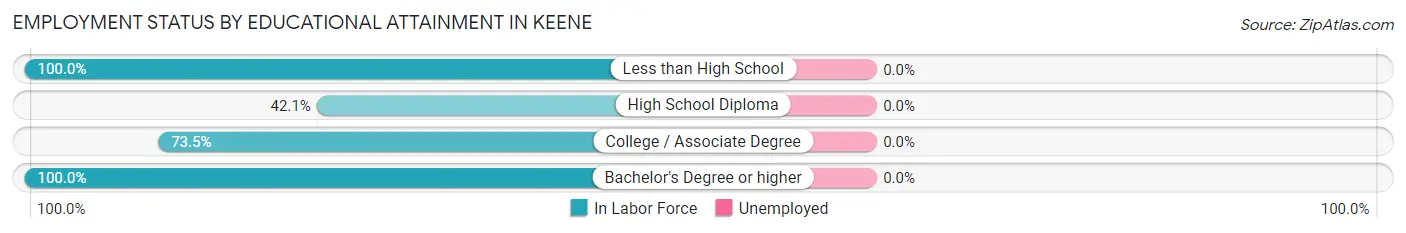
Employment Status by Educational Attainment in Keene
| Educational Attainment | In Labor Force | Unemployed |
| Less than High School | 25 (100.0%) | 0 (0.0%) |
| High School Diploma | 16 (42.1%) | 0 (0.0%) |
| College / Associate Degree | 25 (73.5%) | 0 (0.0%) |
| Bachelor's Degree or higher | 97 (100.0%) | 0 (0.0%) |
| Total | 163 (84.0%) | 0 (0.0%) |
Employment Occupations by Sex in Keene
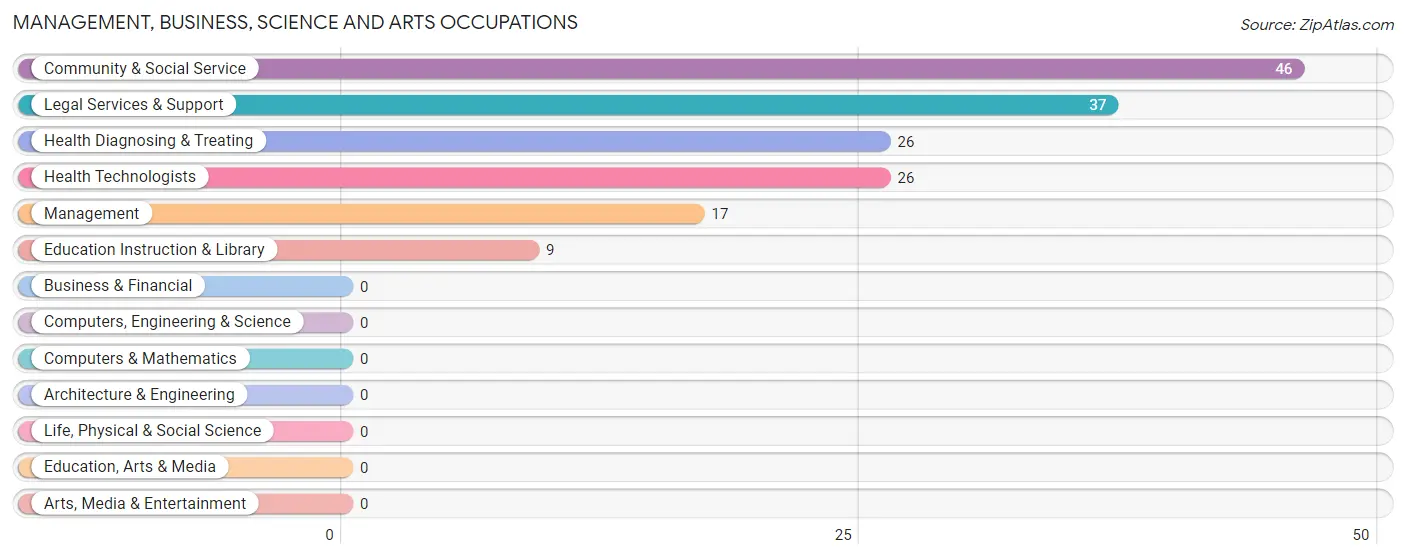
Management, Business, Science and Arts Occupations
The most common Management, Business, Science and Arts occupations in Keene are Community & Social Service (46 | 23.1%), Legal Services & Support (37 | 18.6%), Health Diagnosing & Treating (26 | 13.1%), Health Technologists (26 | 13.1%), and Management (17 | 8.5%).
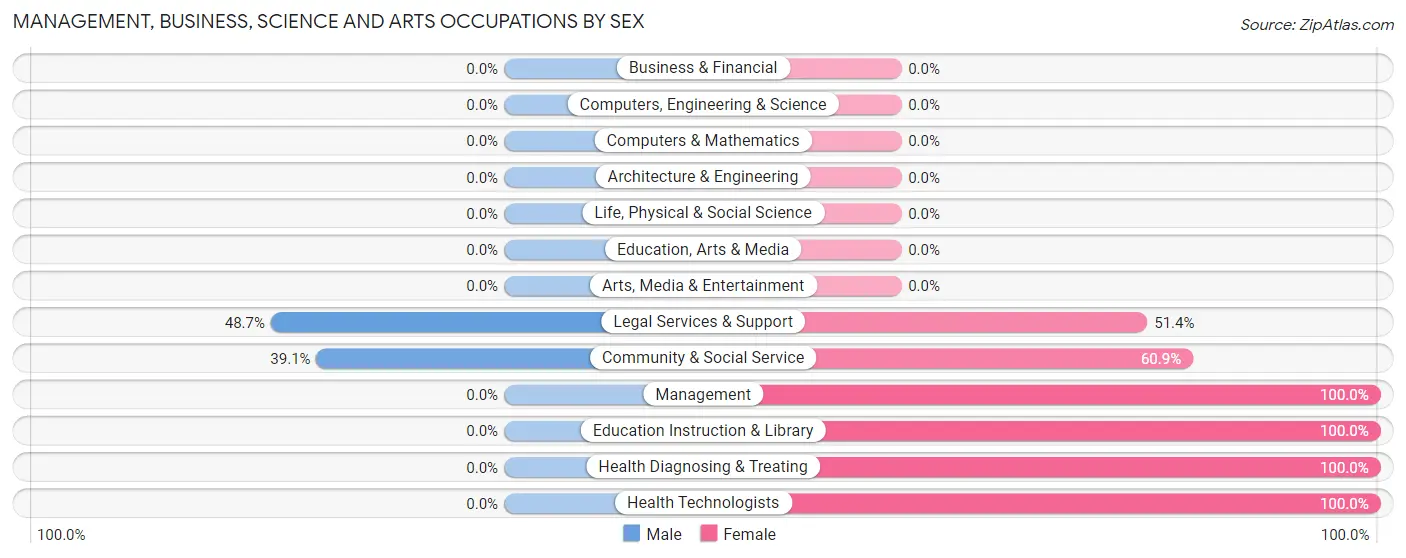
Management, Business, Science and Arts Occupations by Sex
Within the Management, Business, Science and Arts occupations in Keene, the most male-oriented occupations are Legal Services & Support (48.6%), and Community & Social Service (39.1%), while the most female-oriented occupations are Management (100.0%), Education Instruction & Library (100.0%), and Health Diagnosing & Treating (100.0%).
| Occupation | Male | Female |
| Management | 0 (0.0%) | 17 (100.0%) |
| Business & Financial | 0 (0.0%) | 0 (0.0%) |
| Computers, Engineering & Science | 0 (0.0%) | 0 (0.0%) |
| Computers & Mathematics | 0 (0.0%) | 0 (0.0%) |
| Architecture & Engineering | 0 (0.0%) | 0 (0.0%) |
| Life, Physical & Social Science | 0 (0.0%) | 0 (0.0%) |
| Community & Social Service | 18 (39.1%) | 28 (60.9%) |
| Education, Arts & Media | 0 (0.0%) | 0 (0.0%) |
| Legal Services & Support | 18 (48.6%) | 19 (51.3%) |
| Education Instruction & Library | 0 (0.0%) | 9 (100.0%) |
| Arts, Media & Entertainment | 0 (0.0%) | 0 (0.0%) |
| Health Diagnosing & Treating | 0 (0.0%) | 26 (100.0%) |
| Health Technologists | 0 (0.0%) | 26 (100.0%) |
| Total (Category) | 18 (20.2%) | 71 (79.8%) |
| Total (Overall) | 98 (49.2%) | 101 (50.7%) |
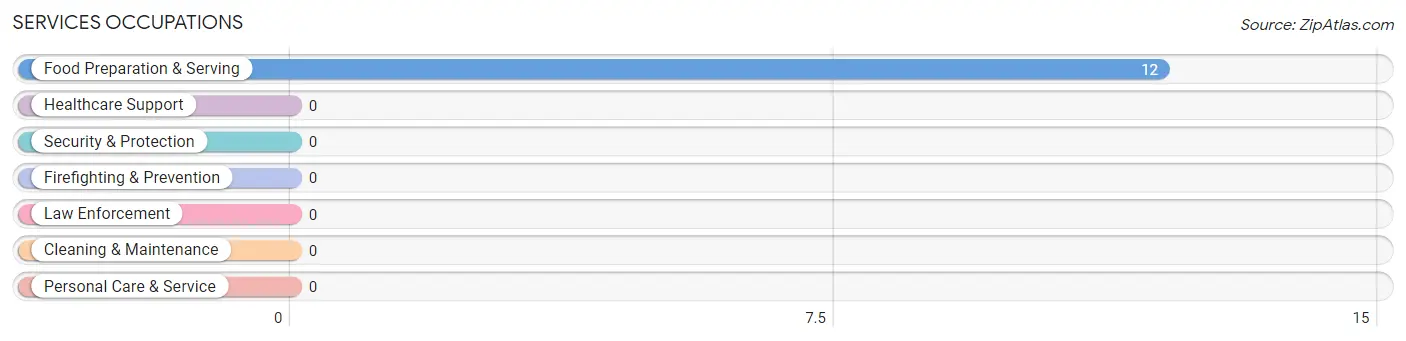
Services Occupations
The most common Services occupations in Keene are , and Food Preparation & Serving (12 | 6.0%).
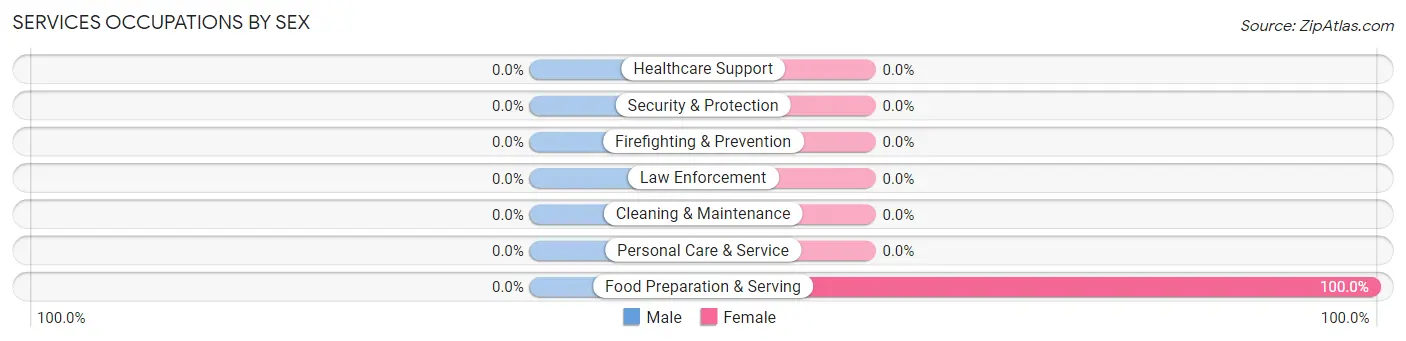
Services Occupations by Sex
| Occupation | Male | Female |
| Healthcare Support | 0 (0.0%) | 0 (0.0%) |
| Security & Protection | 0 (0.0%) | 0 (0.0%) |
| Firefighting & Prevention | 0 (0.0%) | 0 (0.0%) |
| Law Enforcement | 0 (0.0%) | 0 (0.0%) |
| Food Preparation & Serving | 0 (0.0%) | 12 (100.0%) |
| Cleaning & Maintenance | 0 (0.0%) | 0 (0.0%) |
| Personal Care & Service | 0 (0.0%) | 0 (0.0%) |
| Total (Category) | 0 (0.0%) | 12 (100.0%) |
| Total (Overall) | 98 (49.2%) | 101 (50.7%) |
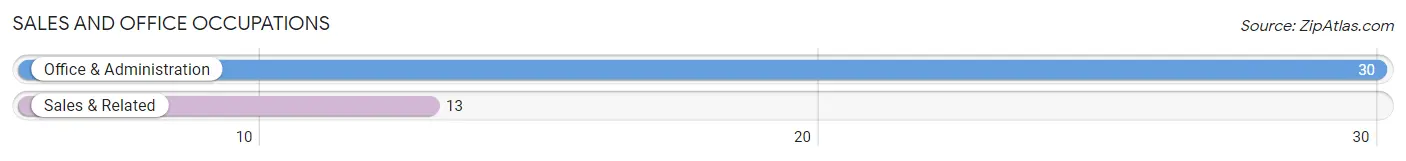
Sales and Office Occupations
The most common Sales and Office occupations in Keene are Office & Administration (30 | 15.1%), and Sales & Related (13 | 6.5%).
Sales and Office Occupations by Sex
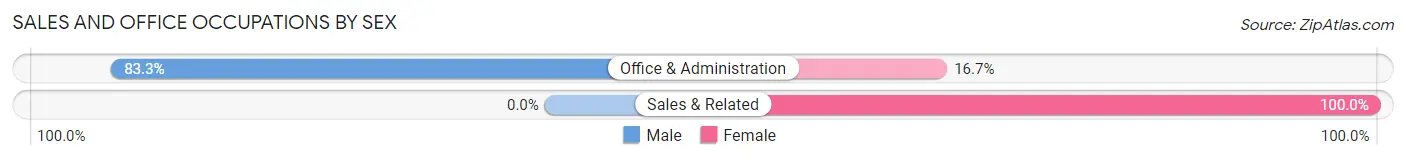
| Occupation | Male | Female |
| Sales & Related | 0 (0.0%) | 13 (100.0%) |
| Office & Administration | 25 (83.3%) | 5 (16.7%) |
| Total (Category) | 25 (58.1%) | 18 (41.9%) |
| Total (Overall) | 98 (49.2%) | 101 (50.7%) |
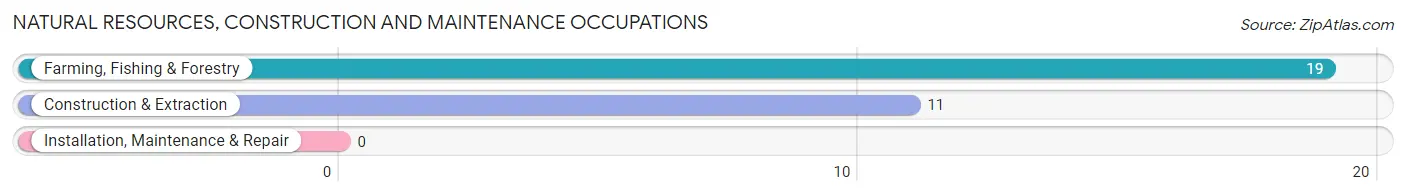
Natural Resources, Construction and Maintenance Occupations
The most common Natural Resources, Construction and Maintenance occupations in Keene are Farming, Fishing & Forestry (19 | 9.6%), and Construction & Extraction (11 | 5.5%).
Natural Resources, Construction and Maintenance Occupations by Sex
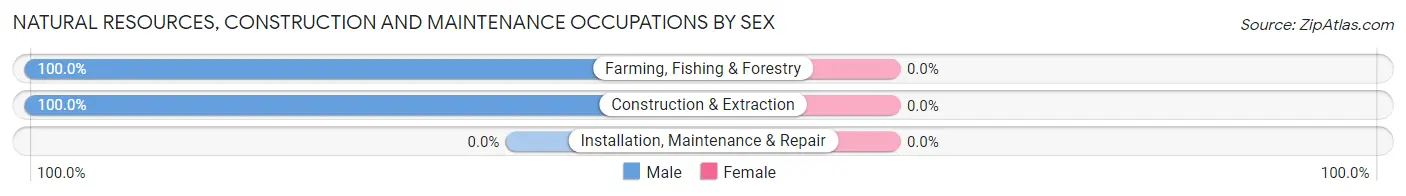
| Occupation | Male | Female |
| Farming, Fishing & Forestry | 19 (100.0%) | 0 (0.0%) |
| Construction & Extraction | 11 (100.0%) | 0 (0.0%) |
| Installation, Maintenance & Repair | 0 (0.0%) | 0 (0.0%) |
| Total (Category) | 30 (100.0%) | 0 (0.0%) |
| Total (Overall) | 98 (49.2%) | 101 (50.7%) |
Production, Transportation and Moving Occupations
The most common Production, Transportation and Moving occupations in Keene are Transportation (17 | 8.5%), and Material Moving (8 | 4.0%).
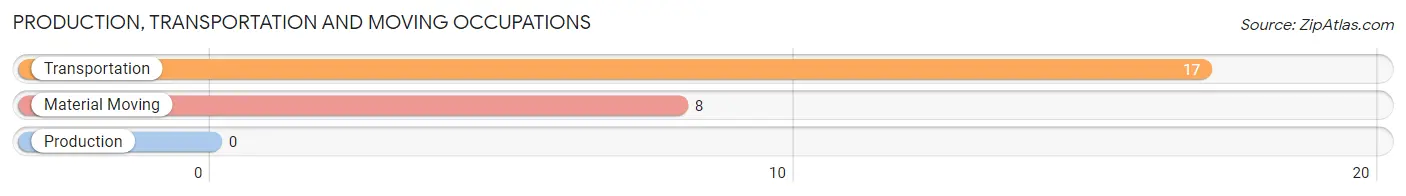
Production, Transportation and Moving Occupations by Sex
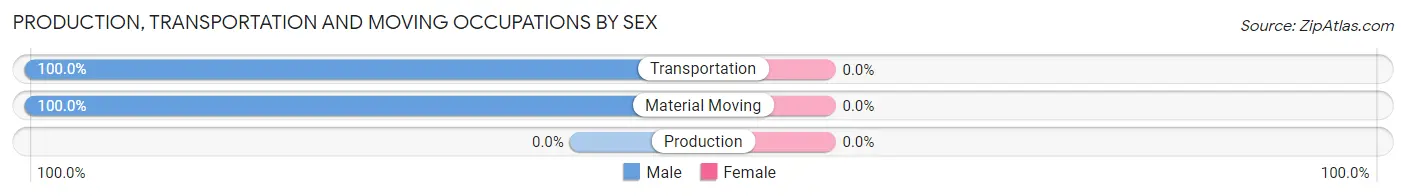
| Occupation | Male | Female |
| Production | 0 (0.0%) | 0 (0.0%) |
| Transportation | 17 (100.0%) | 0 (0.0%) |
| Material Moving | 8 (100.0%) | 0 (0.0%) |
| Total (Category) | 25 (100.0%) | 0 (0.0%) |
| Total (Overall) | 98 (49.2%) | 101 (50.7%) |
Employment Industries by Sex in Keene
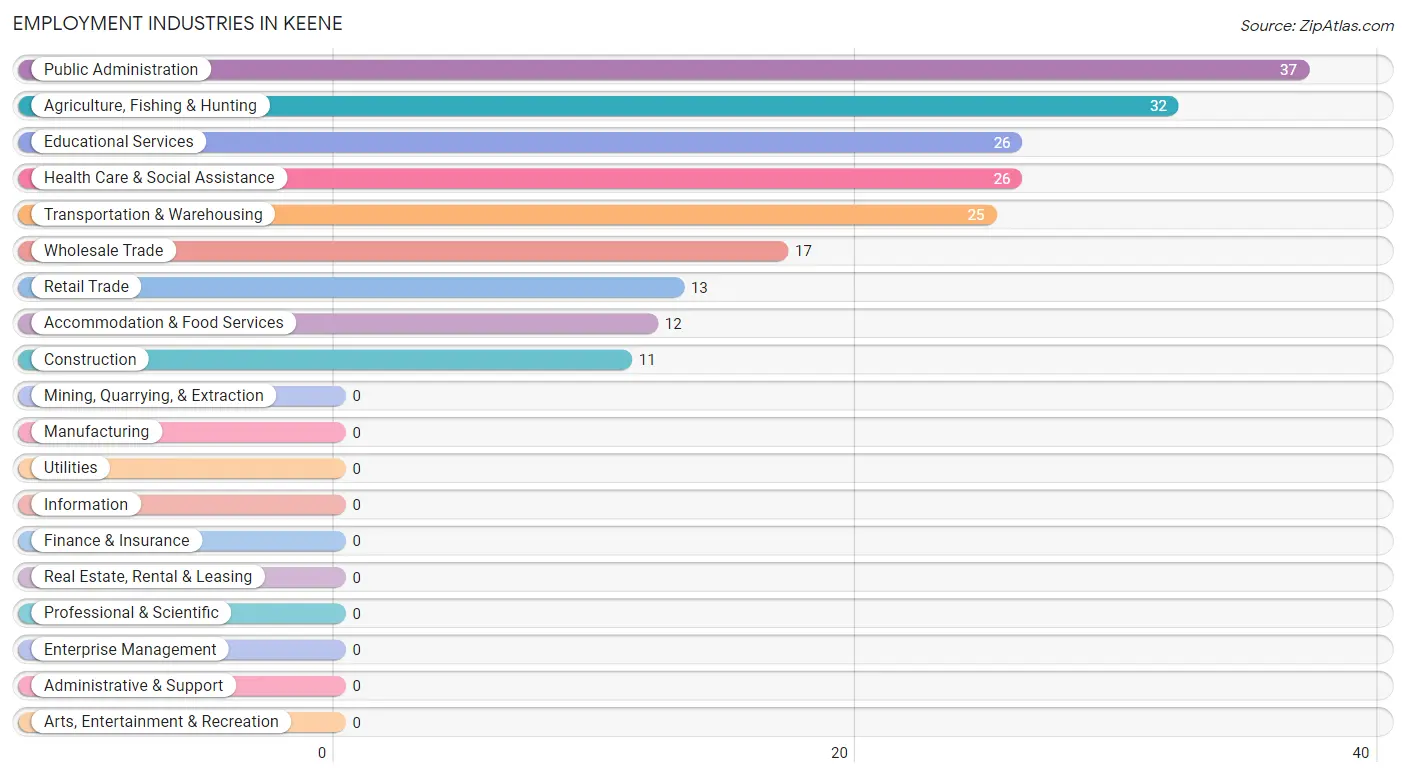
Employment Industries in Keene
The major employment industries in Keene include Public Administration (37 | 18.6%), Agriculture, Fishing & Hunting (32 | 16.1%), Educational Services (26 | 13.1%), Health Care & Social Assistance (26 | 13.1%), and Transportation & Warehousing (25 | 12.6%).
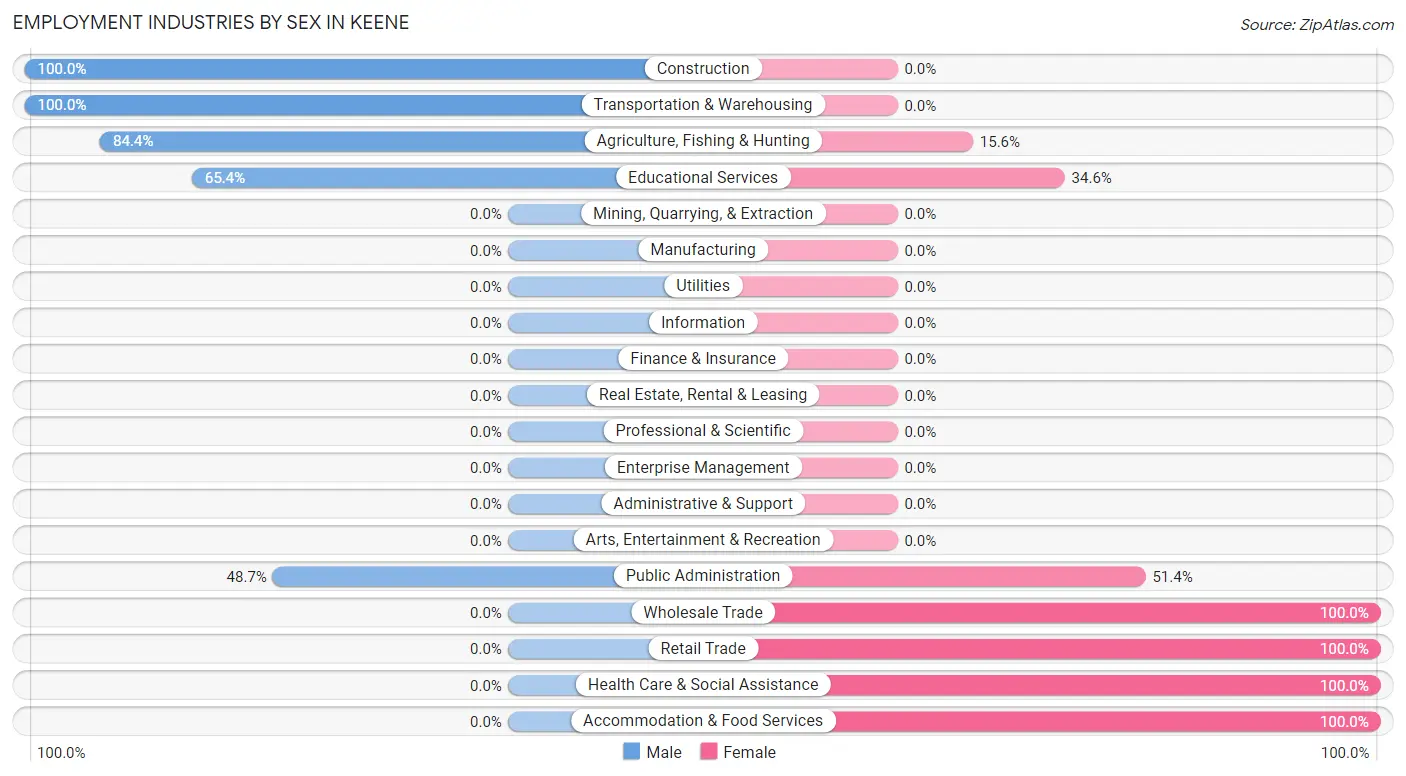
Employment Industries by Sex in Keene
The Keene industries that see more men than women are Construction (100.0%), Transportation & Warehousing (100.0%), and Agriculture, Fishing & Hunting (84.4%), whereas the industries that tend to have a higher number of women are Wholesale Trade (100.0%), Retail Trade (100.0%), and Health Care & Social Assistance (100.0%).
| Industry | Male | Female |
| Agriculture, Fishing & Hunting | 27 (84.4%) | 5 (15.6%) |
| Mining, Quarrying, & Extraction | 0 (0.0%) | 0 (0.0%) |
| Construction | 11 (100.0%) | 0 (0.0%) |
| Manufacturing | 0 (0.0%) | 0 (0.0%) |
| Wholesale Trade | 0 (0.0%) | 17 (100.0%) |
| Retail Trade | 0 (0.0%) | 13 (100.0%) |
| Transportation & Warehousing | 25 (100.0%) | 0 (0.0%) |
| Utilities | 0 (0.0%) | 0 (0.0%) |
| Information | 0 (0.0%) | 0 (0.0%) |
| Finance & Insurance | 0 (0.0%) | 0 (0.0%) |
| Real Estate, Rental & Leasing | 0 (0.0%) | 0 (0.0%) |
| Professional & Scientific | 0 (0.0%) | 0 (0.0%) |
| Enterprise Management | 0 (0.0%) | 0 (0.0%) |
| Administrative & Support | 0 (0.0%) | 0 (0.0%) |
| Educational Services | 17 (65.4%) | 9 (34.6%) |
| Health Care & Social Assistance | 0 (0.0%) | 26 (100.0%) |
| Arts, Entertainment & Recreation | 0 (0.0%) | 0 (0.0%) |
| Accommodation & Food Services | 0 (0.0%) | 12 (100.0%) |
| Public Administration | 18 (48.6%) | 19 (51.3%) |
| Total | 98 (49.2%) | 101 (50.7%) |
Education in Keene
School Enrollment in Keene
The most common levels of schooling among the 76 students in Keene are middle school (29 | 38.2%), graduate / professional (18 | 23.7%), and college / undergraduate (15 | 19.7%).
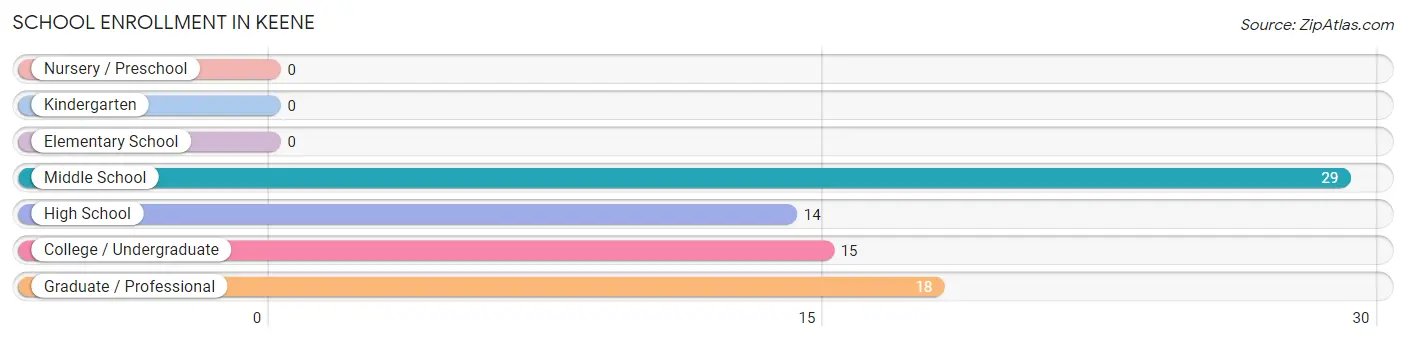
| School Level | # Students | % Students |
| Nursery / Preschool | 0 | 0.0% |
| Kindergarten | 0 | 0.0% |
| Elementary School | 0 | 0.0% |
| Middle School | 29 | 38.2% |
| High School | 14 | 18.4% |
| College / Undergraduate | 15 | 19.7% |
| Graduate / Professional | 18 | 23.7% |
| Total | 76 | 100.0% |
School Enrollment by Age by Funding Source in Keene
Out of a total of 76 students who are enrolled in schools in Keene, 33 (43.4%) attend a private institution, while the remaining 43 (56.6%) are enrolled in public schools. The age group of 20 to 24 year olds has the highest likelihood of being enrolled in private schools, with 15 (100.0% in the age bracket) enrolled. Conversely, the age group of 10 to 14 year olds has the lowest likelihood of being enrolled in a private school, with 29 (100.0% in the age bracket) attending a public institution.
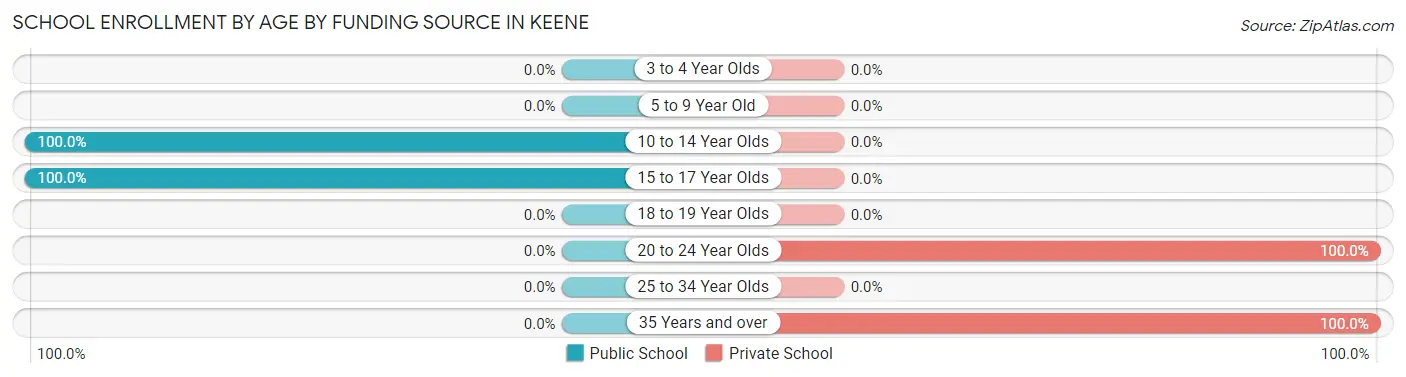
| Age Bracket | Public School | Private School |
| 3 to 4 Year Olds | 0 (0.0%) | 0 (0.0%) |
| 5 to 9 Year Old | 0 (0.0%) | 0 (0.0%) |
| 10 to 14 Year Olds | 29 (100.0%) | 0 (0.0%) |
| 15 to 17 Year Olds | 14 (100.0%) | 0 (0.0%) |
| 18 to 19 Year Olds | 0 (0.0%) | 0 (0.0%) |
| 20 to 24 Year Olds | 0 (0.0%) | 15 (100.0%) |
| 25 to 34 Year Olds | 0 (0.0%) | 0 (0.0%) |
| 35 Years and over | 0 (0.0%) | 18 (100.0%) |
| Total | 43 (56.6%) | 33 (43.4%) |
Educational Attainment by Field of Study in Keene
Social sciences (71 | 33.2%), business (42 | 19.6%), science & technology (37 | 17.3%), education (19 | 8.9%), and bio, nature & agricultural (18 | 8.4%) are the most common fields of study among 214 individuals in Keene who have obtained a bachelor's degree or higher.
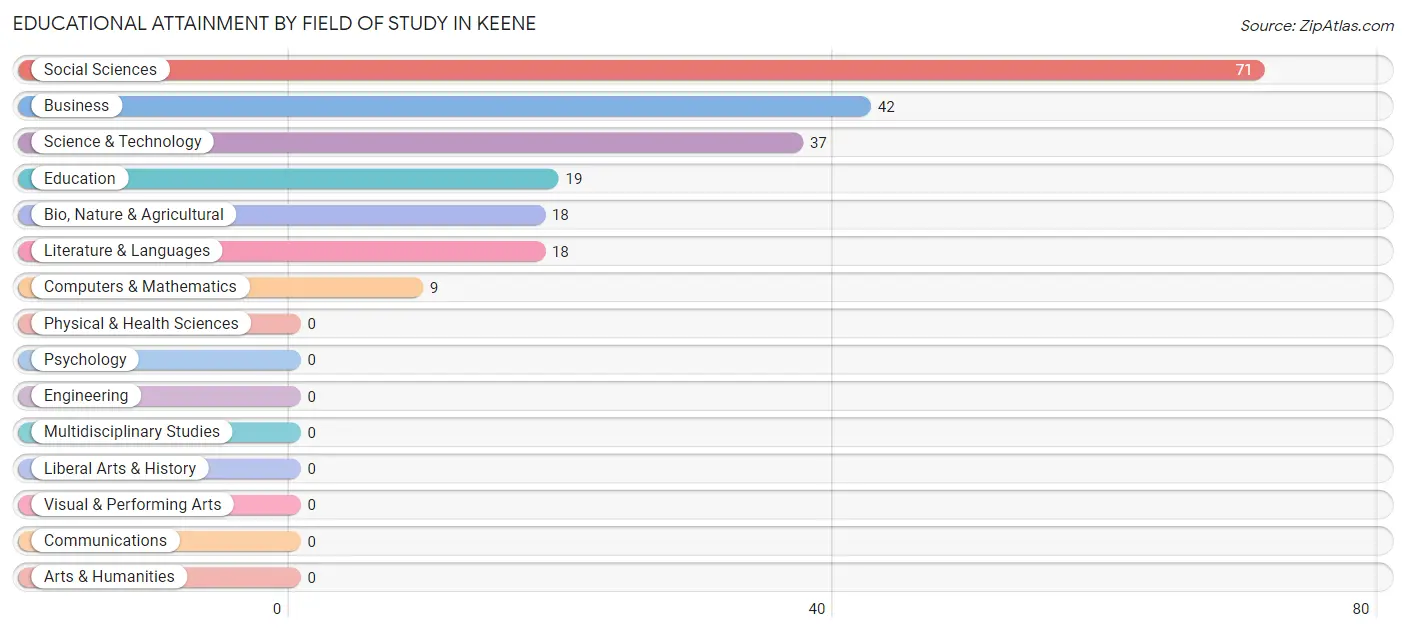
| Field of Study | # Graduates | % Graduates |
| Computers & Mathematics | 9 | 4.2% |
| Bio, Nature & Agricultural | 18 | 8.4% |
| Physical & Health Sciences | 0 | 0.0% |
| Psychology | 0 | 0.0% |
| Social Sciences | 71 | 33.2% |
| Engineering | 0 | 0.0% |
| Multidisciplinary Studies | 0 | 0.0% |
| Science & Technology | 37 | 17.3% |
| Business | 42 | 19.6% |
| Education | 19 | 8.9% |
| Literature & Languages | 18 | 8.4% |
| Liberal Arts & History | 0 | 0.0% |
| Visual & Performing Arts | 0 | 0.0% |
| Communications | 0 | 0.0% |
| Arts & Humanities | 0 | 0.0% |
| Total | 214 | 100.0% |
Transportation & Commute in Keene
Vehicle Availability by Sex in Keene
The most prevalent vehicle ownership categories in Keene are males with 2 vehicles (87, accounting for 88.8%) and females with 2 vehicles (62, making up 86.1%).
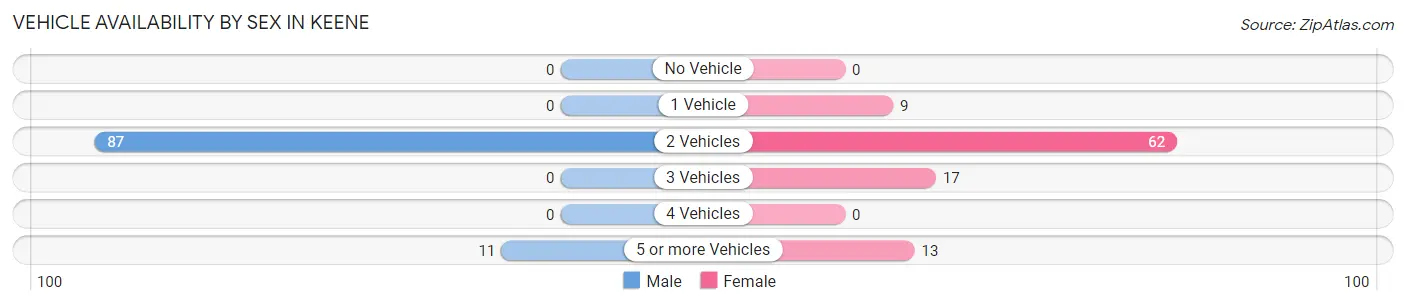
| Vehicles Available | Male | Female |
| No Vehicle | 0 (0.0%) | 0 (0.0%) |
| 1 Vehicle | 0 (0.0%) | 9 (8.9%) |
| 2 Vehicles | 87 (88.8%) | 62 (61.4%) |
| 3 Vehicles | 0 (0.0%) | 17 (16.8%) |
| 4 Vehicles | 0 (0.0%) | 0 (0.0%) |
| 5 or more Vehicles | 11 (11.2%) | 13 (12.9%) |
| Total | 98 (100.0%) | 101 (100.0%) |
Commute Time in Keene
The most frequently occuring commute durations in Keene are 30 to 34 minutes (51 commuters, 25.6%), 40 to 44 minutes (37 commuters, 18.6%), and 35 to 39 minutes (36 commuters, 18.1%).
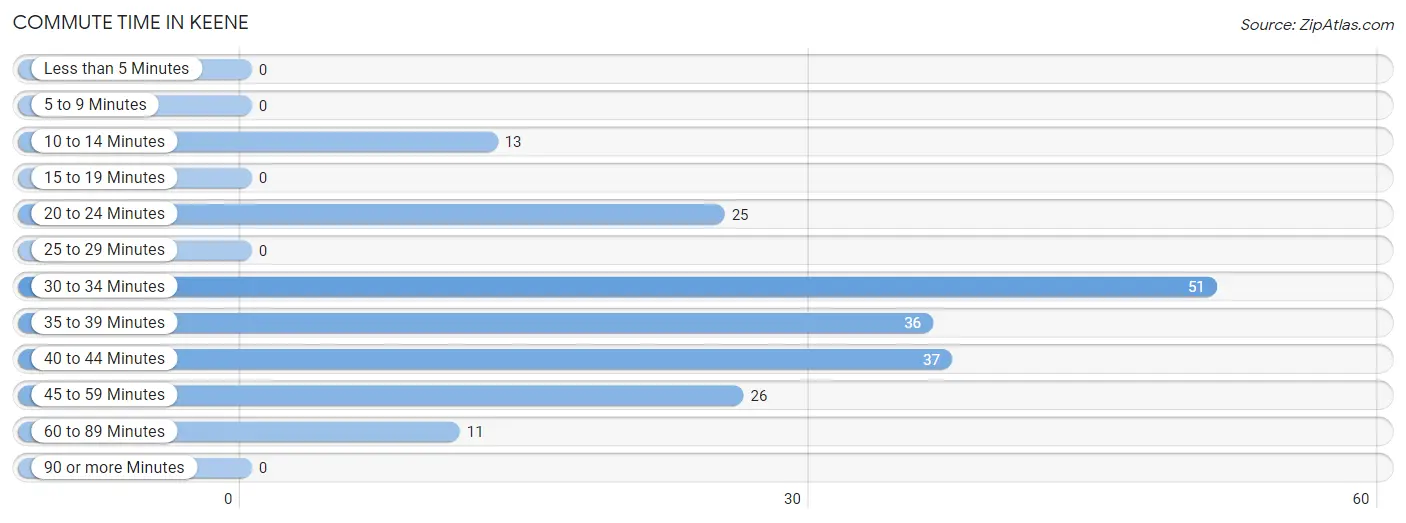
| Commute Time | # Commuters | % Commuters |
| Less than 5 Minutes | 0 | 0.0% |
| 5 to 9 Minutes | 0 | 0.0% |
| 10 to 14 Minutes | 13 | 6.5% |
| 15 to 19 Minutes | 0 | 0.0% |
| 20 to 24 Minutes | 25 | 12.6% |
| 25 to 29 Minutes | 0 | 0.0% |
| 30 to 34 Minutes | 51 | 25.6% |
| 35 to 39 Minutes | 36 | 18.1% |
| 40 to 44 Minutes | 37 | 18.6% |
| 45 to 59 Minutes | 26 | 13.1% |
| 60 to 89 Minutes | 11 | 5.5% |
| 90 or more Minutes | 0 | 0.0% |
Commute Time by Sex in Keene
The most common commute times in Keene are 35 to 39 minutes (31 commuters, 31.6%) for males and 30 to 34 minutes (26 commuters, 25.7%) for females.
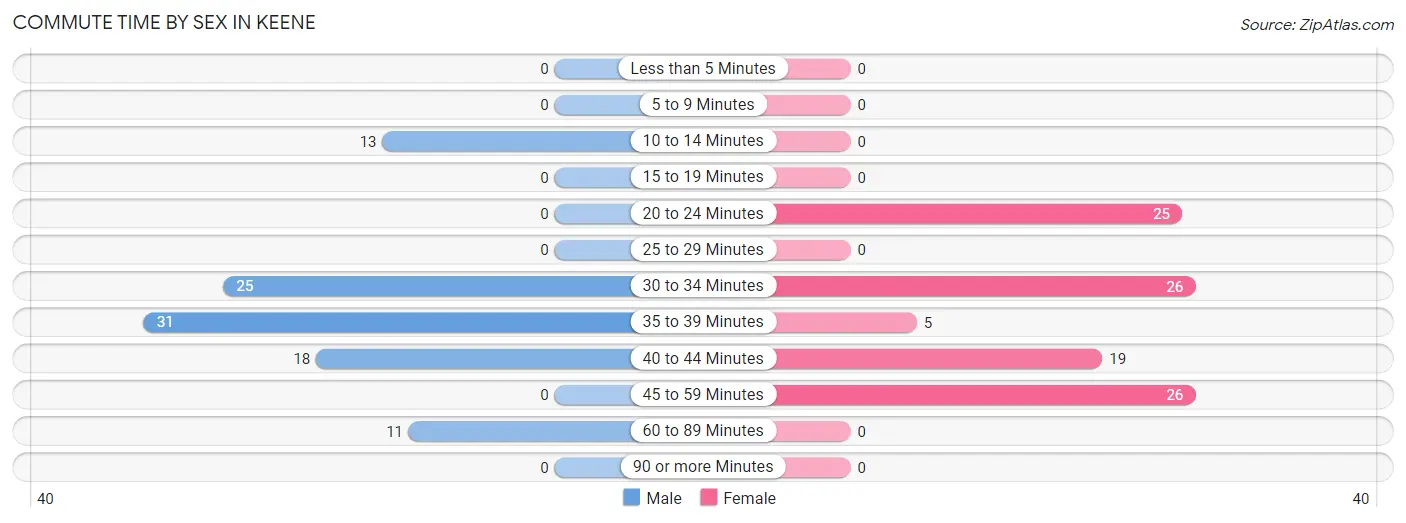
| Commute Time | Male | Female |
| Less than 5 Minutes | 0 (0.0%) | 0 (0.0%) |
| 5 to 9 Minutes | 0 (0.0%) | 0 (0.0%) |
| 10 to 14 Minutes | 13 (13.3%) | 0 (0.0%) |
| 15 to 19 Minutes | 0 (0.0%) | 0 (0.0%) |
| 20 to 24 Minutes | 0 (0.0%) | 25 (24.7%) |
| 25 to 29 Minutes | 0 (0.0%) | 0 (0.0%) |
| 30 to 34 Minutes | 25 (25.5%) | 26 (25.7%) |
| 35 to 39 Minutes | 31 (31.6%) | 5 (5.0%) |
| 40 to 44 Minutes | 18 (18.4%) | 19 (18.8%) |
| 45 to 59 Minutes | 0 (0.0%) | 26 (25.7%) |
| 60 to 89 Minutes | 11 (11.2%) | 0 (0.0%) |
| 90 or more Minutes | 0 (0.0%) | 0 (0.0%) |
Time of Departure to Work by Sex in Keene
The most frequent times of departure to work in Keene are 12:00 AM to 4:59 AM (36, 36.7%) for males and 8:00 AM to 8:29 AM (35, 34.6%) for females.
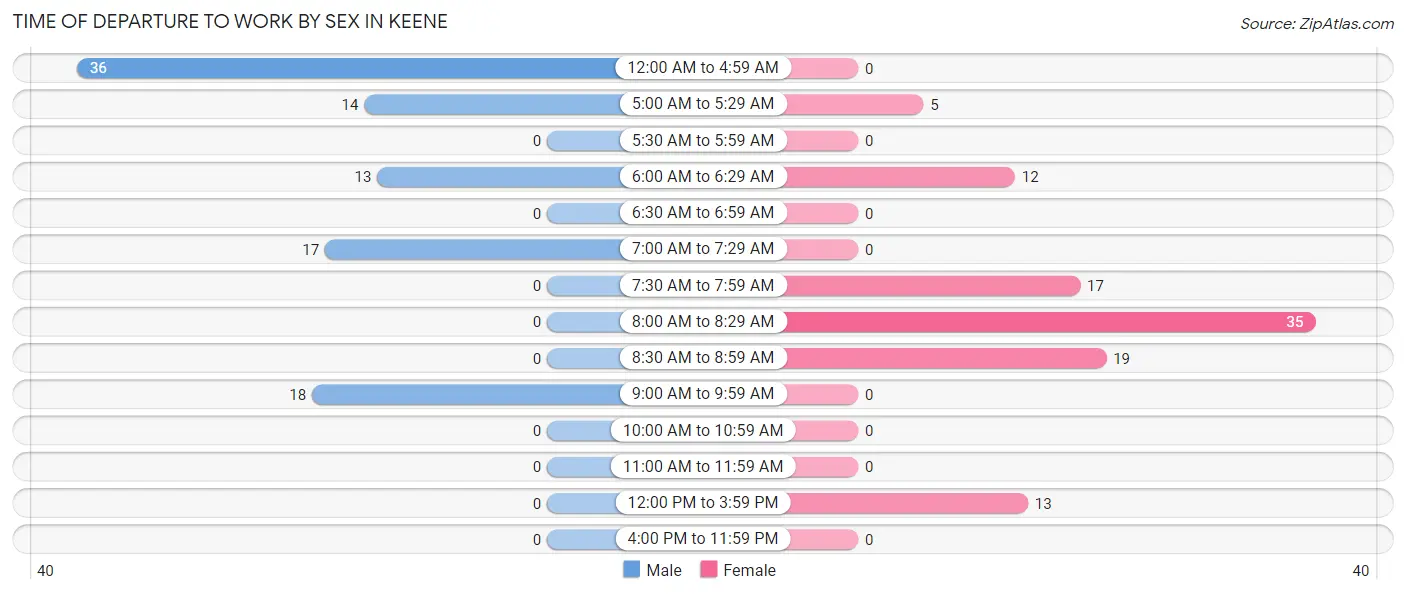
| Time of Departure | Male | Female |
| 12:00 AM to 4:59 AM | 36 (36.7%) | 0 (0.0%) |
| 5:00 AM to 5:29 AM | 14 (14.3%) | 5 (5.0%) |
| 5:30 AM to 5:59 AM | 0 (0.0%) | 0 (0.0%) |
| 6:00 AM to 6:29 AM | 13 (13.3%) | 12 (11.9%) |
| 6:30 AM to 6:59 AM | 0 (0.0%) | 0 (0.0%) |
| 7:00 AM to 7:29 AM | 17 (17.3%) | 0 (0.0%) |
| 7:30 AM to 7:59 AM | 0 (0.0%) | 17 (16.8%) |
| 8:00 AM to 8:29 AM | 0 (0.0%) | 35 (34.6%) |
| 8:30 AM to 8:59 AM | 0 (0.0%) | 19 (18.8%) |
| 9:00 AM to 9:59 AM | 18 (18.4%) | 0 (0.0%) |
| 10:00 AM to 10:59 AM | 0 (0.0%) | 0 (0.0%) |
| 11:00 AM to 11:59 AM | 0 (0.0%) | 0 (0.0%) |
| 12:00 PM to 3:59 PM | 0 (0.0%) | 13 (12.9%) |
| 4:00 PM to 11:59 PM | 0 (0.0%) | 0 (0.0%) |
| Total | 98 (100.0%) | 101 (100.0%) |
Housing Occupancy in Keene
Occupancy by Ownership in Keene
Of the total 171 dwellings in Keene, owner-occupied units account for 158 (92.4%), while renter-occupied units make up 13 (7.6%).
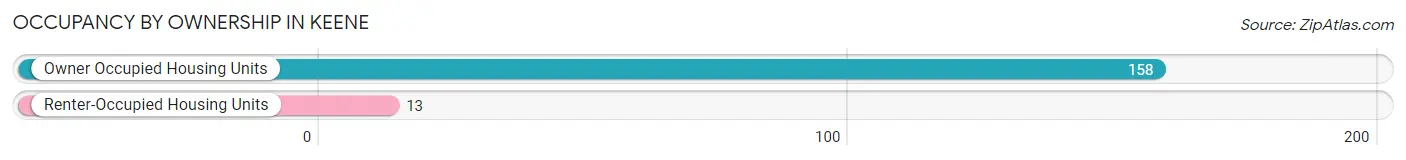
| Occupancy | # Housing Units | % Housing Units |
| Owner Occupied Housing Units | 158 | 92.4% |
| Renter-Occupied Housing Units | 13 | 7.6% |
| Total Occupied Housing Units | 171 | 100.0% |
Occupancy by Household Size in Keene
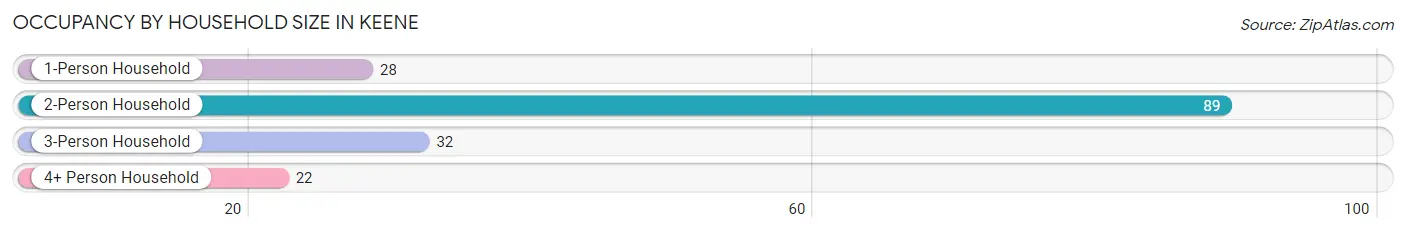
| Household Size | # Housing Units | % Housing Units |
| 1-Person Household | 28 | 16.4% |
| 2-Person Household | 89 | 52.0% |
| 3-Person Household | 32 | 18.7% |
| 4+ Person Household | 22 | 12.9% |
| Total Housing Units | 171 | 100.0% |
Occupancy by Ownership by Household Size in Keene
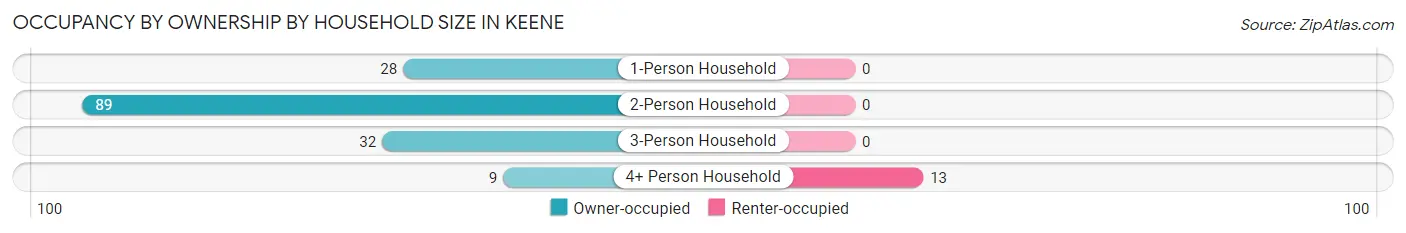
| Household Size | Owner-occupied | Renter-occupied |
| 1-Person Household | 28 (100.0%) | 0 (0.0%) |
| 2-Person Household | 89 (100.0%) | 0 (0.0%) |
| 3-Person Household | 32 (100.0%) | 0 (0.0%) |
| 4+ Person Household | 9 (40.9%) | 13 (59.1%) |
| Total Housing Units | 158 (92.4%) | 13 (7.6%) |
Occupancy by Educational Attainment in Keene
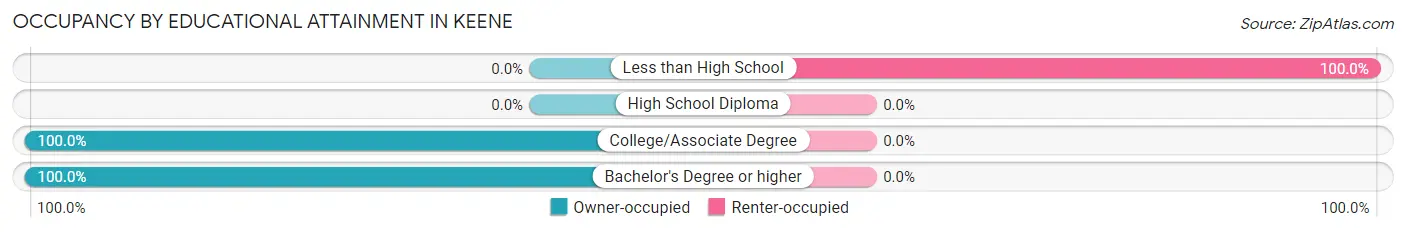
| Household Size | Owner-occupied | Renter-occupied |
| Less than High School | 0 (0.0%) | 13 (100.0%) |
| High School Diploma | 0 (0.0%) | 0 (0.0%) |
| College/Associate Degree | 44 (100.0%) | 0 (0.0%) |
| Bachelor's Degree or higher | 114 (100.0%) | 0 (0.0%) |
Occupancy by Age of Householder in Keene
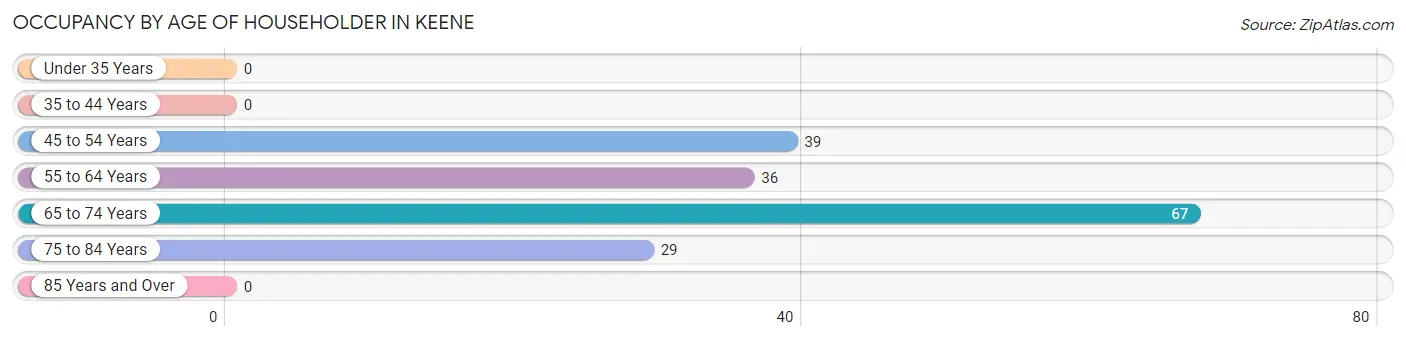
| Age Bracket | # Households | % Households |
| Under 35 Years | 0 | 0.0% |
| 35 to 44 Years | 0 | 0.0% |
| 45 to 54 Years | 39 | 22.8% |
| 55 to 64 Years | 36 | 21.0% |
| 65 to 74 Years | 67 | 39.2% |
| 75 to 84 Years | 29 | 17.0% |
| 85 Years and Over | 0 | 0.0% |
| Total | 171 | 100.0% |
Housing Finances in Keene
Median Income by Occupancy in Keene
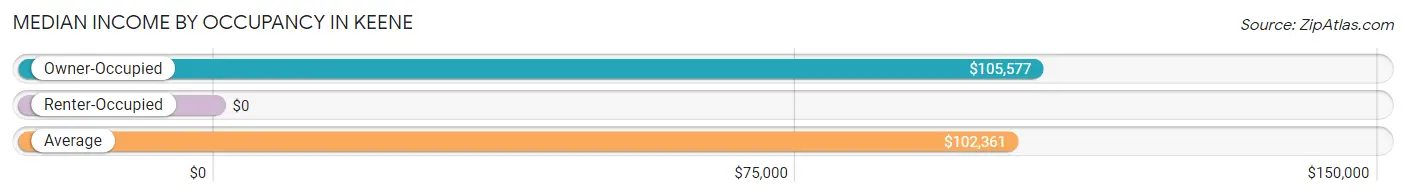
| Occupancy Type | # Households | Median Income |
| Owner-Occupied | 158 (92.4%) | $105,577 |
| Renter-Occupied | 13 (7.6%) | $0 |
| Average | 171 (100.0%) | $102,361 |
Occupancy by Householder Income Bracket in Keene
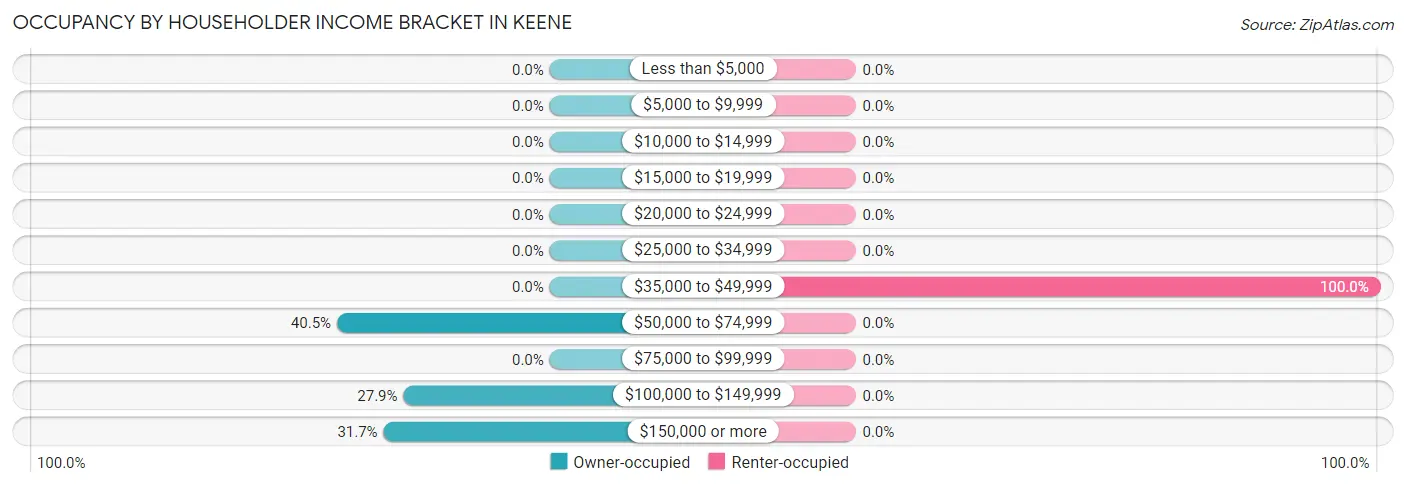
| Income Bracket | Owner-occupied | Renter-occupied |
| Less than $5,000 | 0 (0.0%) | 0 (0.0%) |
| $5,000 to $9,999 | 0 (0.0%) | 0 (0.0%) |
| $10,000 to $14,999 | 0 (0.0%) | 0 (0.0%) |
| $15,000 to $19,999 | 0 (0.0%) | 0 (0.0%) |
| $20,000 to $24,999 | 0 (0.0%) | 0 (0.0%) |
| $25,000 to $34,999 | 0 (0.0%) | 0 (0.0%) |
| $35,000 to $49,999 | 0 (0.0%) | 13 (100.0%) |
| $50,000 to $74,999 | 64 (40.5%) | 0 (0.0%) |
| $75,000 to $99,999 | 0 (0.0%) | 0 (0.0%) |
| $100,000 to $149,999 | 44 (27.9%) | 0 (0.0%) |
| $150,000 or more | 50 (31.7%) | 0 (0.0%) |
| Total | 158 (100.0%) | 13 (100.0%) |
Monthly Housing Cost Tiers in Keene
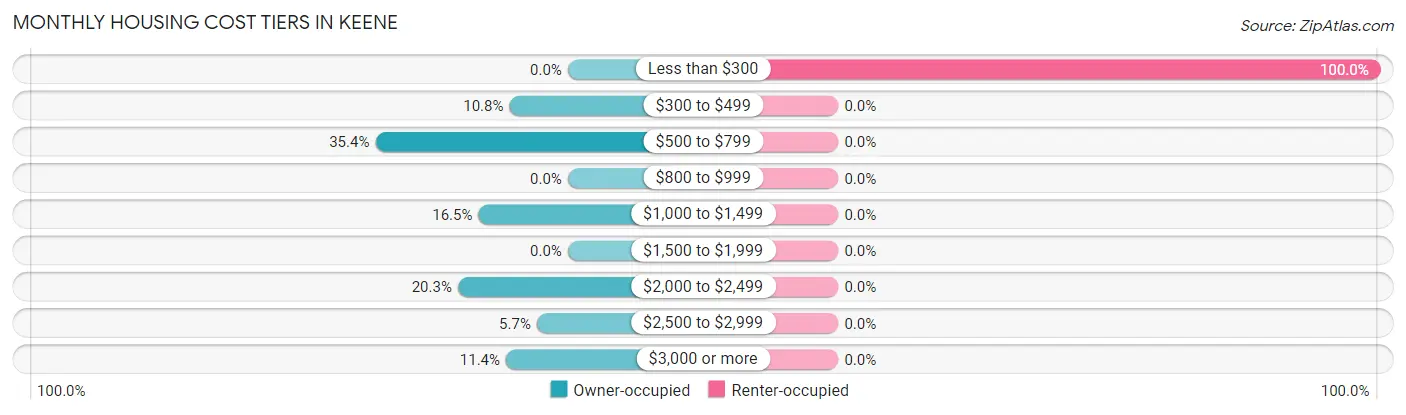
| Monthly Cost | Owner-occupied | Renter-occupied |
| Less than $300 | 0 (0.0%) | 13 (100.0%) |
| $300 to $499 | 17 (10.8%) | 0 (0.0%) |
| $500 to $799 | 56 (35.4%) | 0 (0.0%) |
| $800 to $999 | 0 (0.0%) | 0 (0.0%) |
| $1,000 to $1,499 | 26 (16.5%) | 0 (0.0%) |
| $1,500 to $1,999 | 0 (0.0%) | 0 (0.0%) |
| $2,000 to $2,499 | 32 (20.3%) | 0 (0.0%) |
| $2,500 to $2,999 | 9 (5.7%) | 0 (0.0%) |
| $3,000 or more | 18 (11.4%) | 0 (0.0%) |
| Total | 158 (100.0%) | 13 (100.0%) |
Physical Housing Characteristics in Keene
Housing Structures in Keene
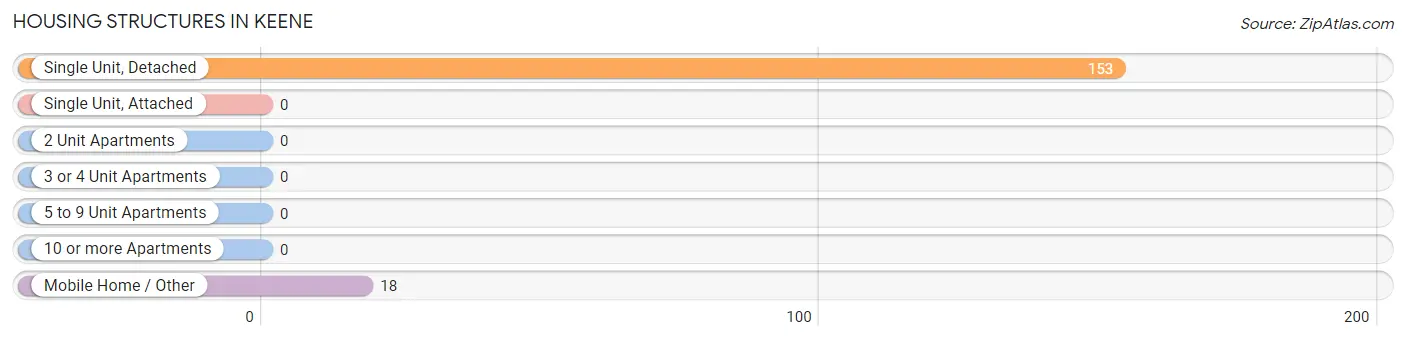
| Structure Type | # Housing Units | % Housing Units |
| Single Unit, Detached | 153 | 89.5% |
| Single Unit, Attached | 0 | 0.0% |
| 2 Unit Apartments | 0 | 0.0% |
| 3 or 4 Unit Apartments | 0 | 0.0% |
| 5 to 9 Unit Apartments | 0 | 0.0% |
| 10 or more Apartments | 0 | 0.0% |
| Mobile Home / Other | 18 | 10.5% |
| Total | 171 | 100.0% |
Housing Structures by Occupancy in Keene
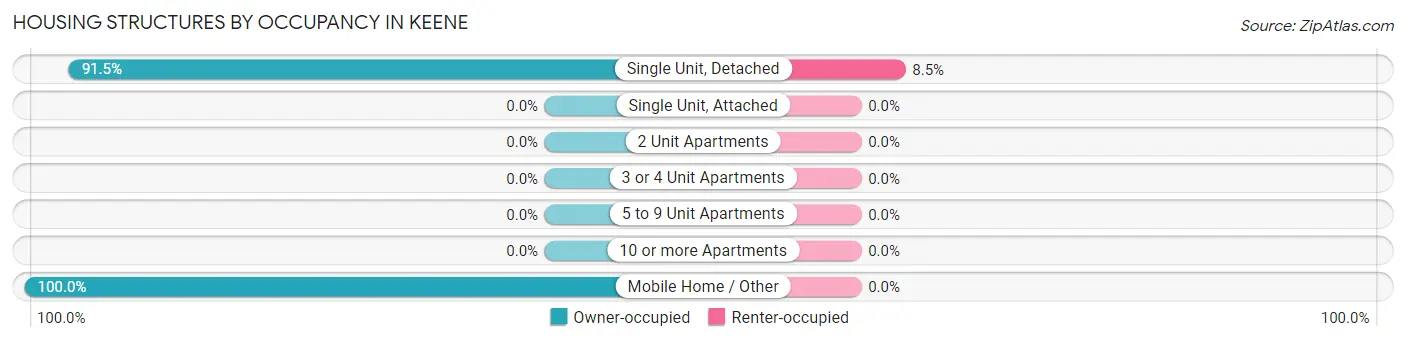
| Structure Type | Owner-occupied | Renter-occupied |
| Single Unit, Detached | 140 (91.5%) | 13 (8.5%) |
| Single Unit, Attached | 0 (0.0%) | 0 (0.0%) |
| 2 Unit Apartments | 0 (0.0%) | 0 (0.0%) |
| 3 or 4 Unit Apartments | 0 (0.0%) | 0 (0.0%) |
| 5 to 9 Unit Apartments | 0 (0.0%) | 0 (0.0%) |
| 10 or more Apartments | 0 (0.0%) | 0 (0.0%) |
| Mobile Home / Other | 18 (100.0%) | 0 (0.0%) |
| Total | 158 (92.4%) | 13 (7.6%) |
Housing Structures by Number of Rooms in Keene
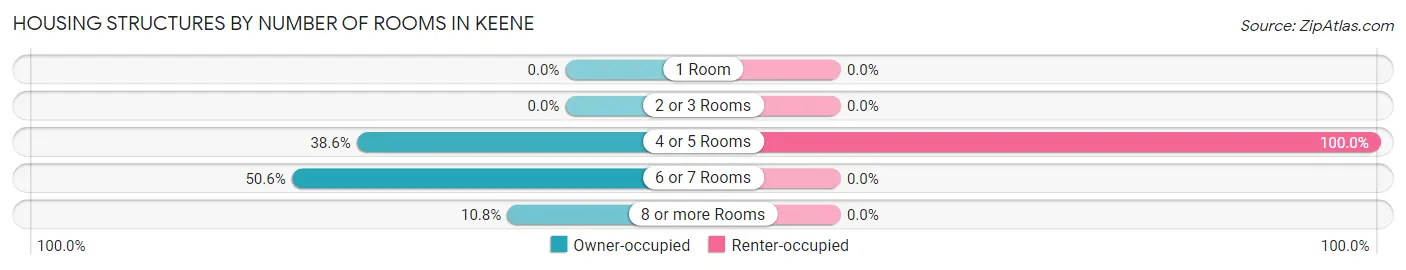
| Number of Rooms | Owner-occupied | Renter-occupied |
| 1 Room | 0 (0.0%) | 0 (0.0%) |
| 2 or 3 Rooms | 0 (0.0%) | 0 (0.0%) |
| 4 or 5 Rooms | 61 (38.6%) | 13 (100.0%) |
| 6 or 7 Rooms | 80 (50.6%) | 0 (0.0%) |
| 8 or more Rooms | 17 (10.8%) | 0 (0.0%) |
| Total | 158 (100.0%) | 13 (100.0%) |
Housing Structure by Heating Type in Keene
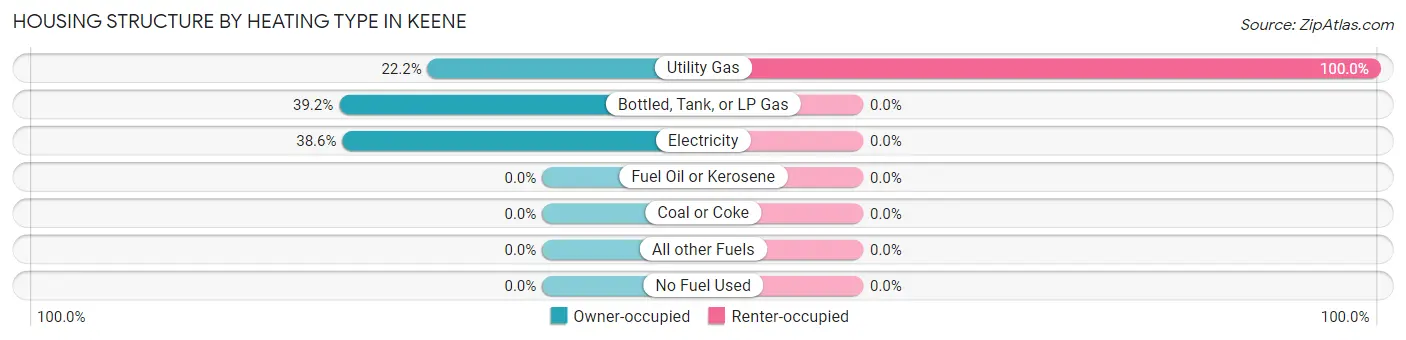
| Heating Type | Owner-occupied | Renter-occupied |
| Utility Gas | 35 (22.2%) | 13 (100.0%) |
| Bottled, Tank, or LP Gas | 62 (39.2%) | 0 (0.0%) |
| Electricity | 61 (38.6%) | 0 (0.0%) |
| Fuel Oil or Kerosene | 0 (0.0%) | 0 (0.0%) |
| Coal or Coke | 0 (0.0%) | 0 (0.0%) |
| All other Fuels | 0 (0.0%) | 0 (0.0%) |
| No Fuel Used | 0 (0.0%) | 0 (0.0%) |
| Total | 158 (100.0%) | 13 (100.0%) |
Household Vehicle Usage in Keene
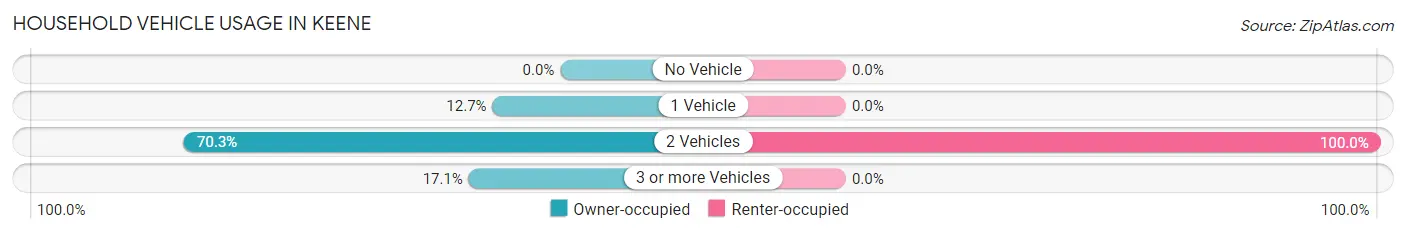
| Vehicles per Household | Owner-occupied | Renter-occupied |
| No Vehicle | 0 (0.0%) | 0 (0.0%) |
| 1 Vehicle | 20 (12.7%) | 0 (0.0%) |
| 2 Vehicles | 111 (70.3%) | 13 (100.0%) |
| 3 or more Vehicles | 27 (17.1%) | 0 (0.0%) |
| Total | 158 (100.0%) | 13 (100.0%) |
Real Estate & Mortgages in Keene
Real Estate and Mortgage Overview in Keene
| Characteristic | Without Mortgage | With Mortgage |
| Housing Units | 105 | 53 |
| Median Property Value | $269,000 | $560,700 |
| Median Household Income | - | - |
| Monthly Housing Costs | $754 | $18 |
| Real Estate Taxes | - | - |
Property Value by Mortgage Status in Keene
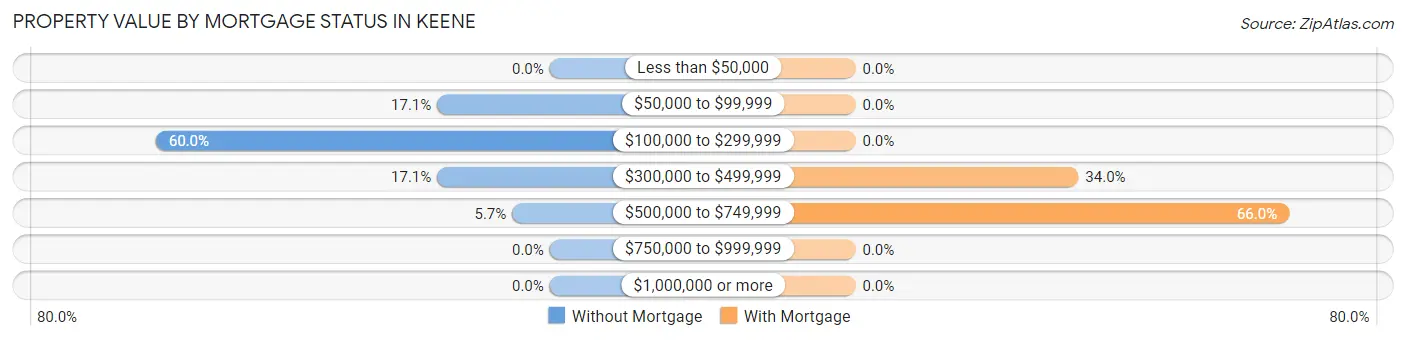
| Property Value | Without Mortgage | With Mortgage |
| Less than $50,000 | 0 (0.0%) | 0 (0.0%) |
| $50,000 to $99,999 | 18 (17.1%) | 0 (0.0%) |
| $100,000 to $299,999 | 63 (60.0%) | 0 (0.0%) |
| $300,000 to $499,999 | 18 (17.1%) | 18 (34.0%) |
| $500,000 to $749,999 | 6 (5.7%) | 35 (66.0%) |
| $750,000 to $999,999 | 0 (0.0%) | 0 (0.0%) |
| $1,000,000 or more | 0 (0.0%) | 0 (0.0%) |
| Total | 105 (100.0%) | 53 (100.0%) |
Household Income by Mortgage Status in Keene
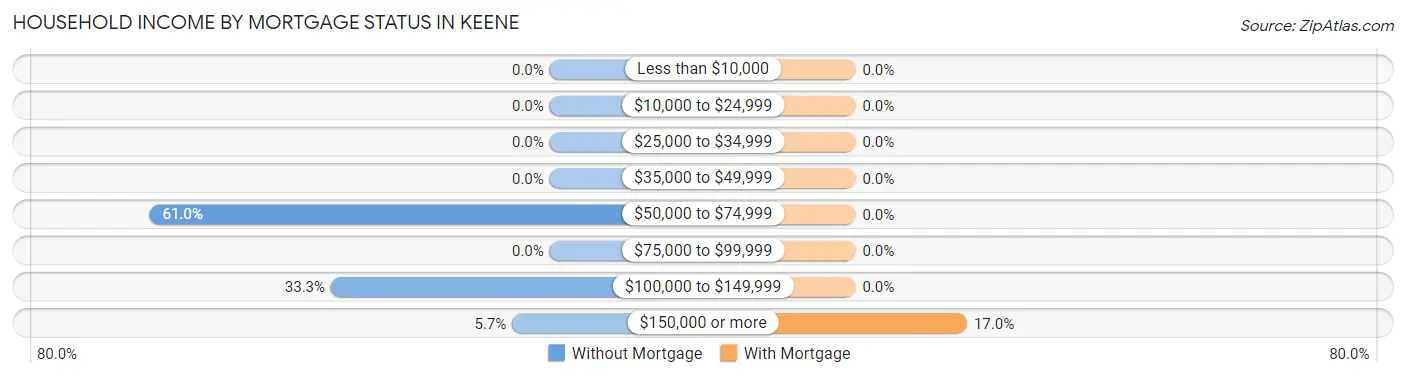
| Household Income | Without Mortgage | With Mortgage |
| Less than $10,000 | 0 (0.0%) | 0 (0.0%) |
| $10,000 to $24,999 | 0 (0.0%) | 0 (0.0%) |
| $25,000 to $34,999 | 0 (0.0%) | 0 (0.0%) |
| $35,000 to $49,999 | 0 (0.0%) | 0 (0.0%) |
| $50,000 to $74,999 | 64 (61.0%) | 0 (0.0%) |
| $75,000 to $99,999 | 0 (0.0%) | 0 (0.0%) |
| $100,000 to $149,999 | 35 (33.3%) | 0 (0.0%) |
| $150,000 or more | 6 (5.7%) | 9 (17.0%) |
| Total | 105 (100.0%) | 53 (100.0%) |
Property Value to Household Income Ratio in Keene
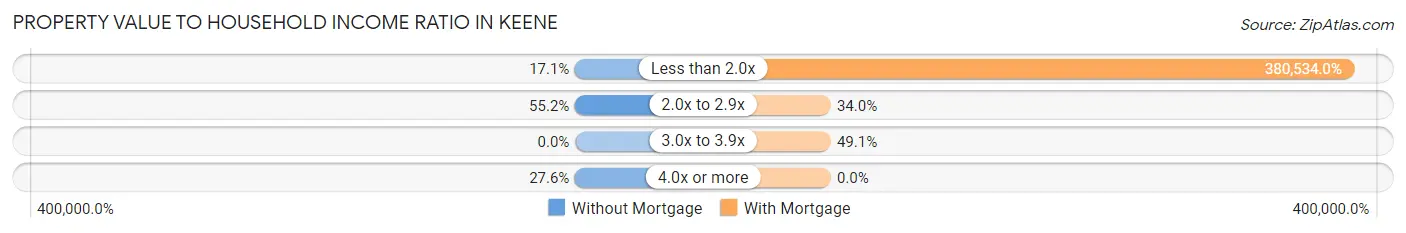
| Value-to-Income Ratio | Without Mortgage | With Mortgage |
| Less than 2.0x | 18 (17.1%) | 201,683 (380,534.0%) |
| 2.0x to 2.9x | 58 (55.2%) | 18 (34.0%) |
| 3.0x to 3.9x | 0 (0.0%) | 26 (49.1%) |
| 4.0x or more | 29 (27.6%) | 0 (0.0%) |
| Total | 105 (100.0%) | 53 (100.0%) |
Real Estate Taxes by Mortgage Status in Keene
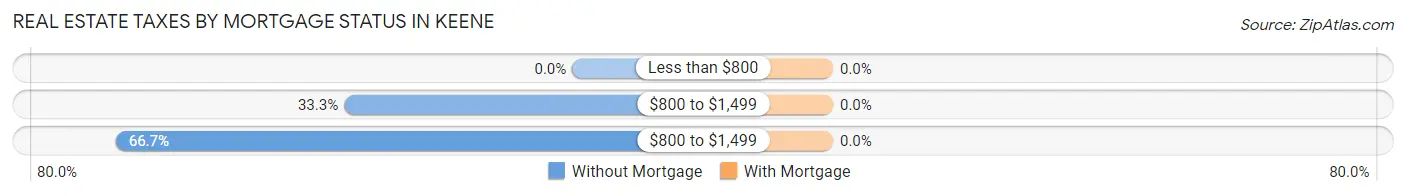
| Property Taxes | Without Mortgage | With Mortgage |
| Less than $800 | 0 (0.0%) | 0 (0.0%) |
| $800 to $1,499 | 35 (33.3%) | 0 (0.0%) |
| $800 to $1,499 | 70 (66.7%) | 0 (0.0%) |
| Total | 105 (100.0%) | 53 (100.0%) |
Health & Disability in Keene
Health Insurance Coverage by Age in Keene
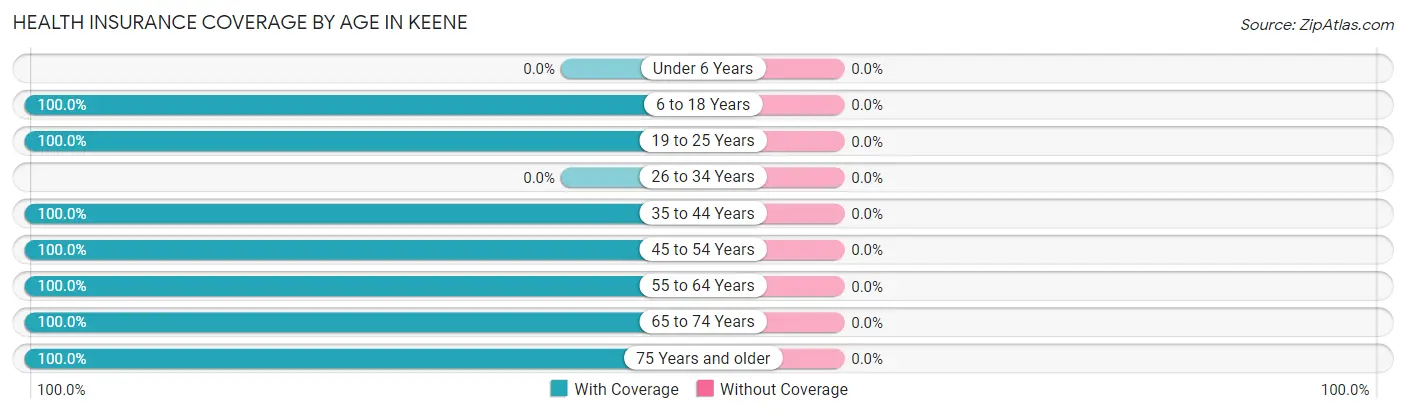
| Age Bracket | With Coverage | Without Coverage |
| Under 6 Years | 0 (0.0%) | 0 (0.0%) |
| 6 to 18 Years | 43 (100.0%) | 0 (0.0%) |
| 19 to 25 Years | 42 (100.0%) | 0 (0.0%) |
| 26 to 34 Years | 0 (0.0%) | 0 (0.0%) |
| 35 to 44 Years | 8 (100.0%) | 0 (0.0%) |
| 45 to 54 Years | 106 (100.0%) | 0 (0.0%) |
| 55 to 64 Years | 80 (100.0%) | 0 (0.0%) |
| 65 to 74 Years | 77 (100.0%) | 0 (0.0%) |
| 75 Years and older | 48 (100.0%) | 0 (0.0%) |
| Total | 404 (100.0%) | 0 (0.0%) |
Health Insurance Coverage by Citizenship Status in Keene
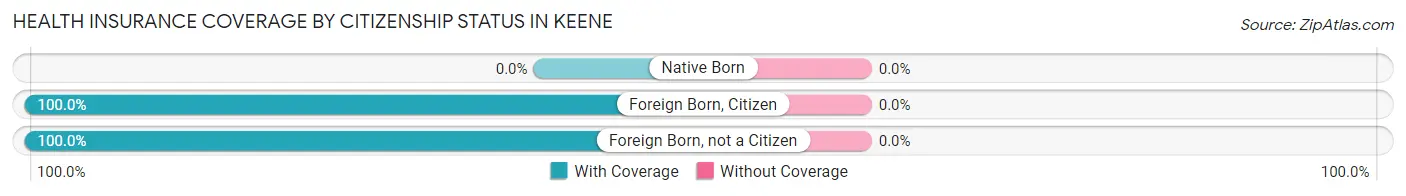
| Citizenship Status | With Coverage | Without Coverage |
| Native Born | 0 (0.0%) | 0 (0.0%) |
| Foreign Born, Citizen | 43 (100.0%) | 0 (0.0%) |
| Foreign Born, not a Citizen | 42 (100.0%) | 0 (0.0%) |
Health Insurance Coverage by Household Income in Keene
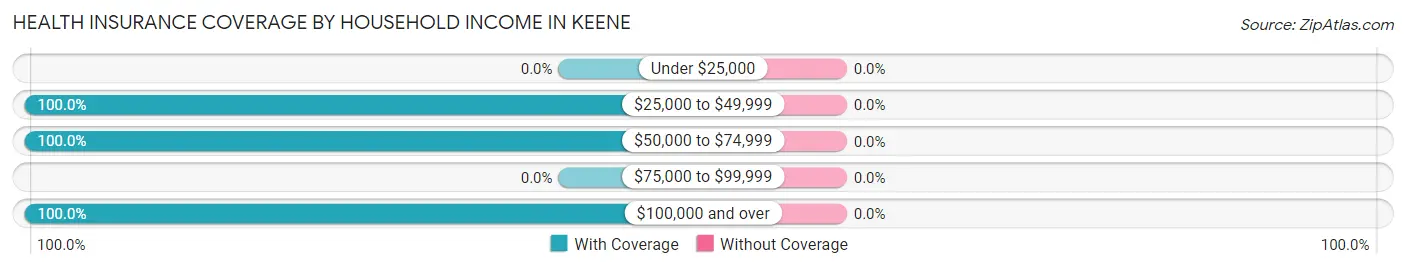
| Household Income | With Coverage | Without Coverage |
| Under $25,000 | 0 (0.0%) | 0 (0.0%) |
| $25,000 to $49,999 | 54 (100.0%) | 0 (0.0%) |
| $50,000 to $74,999 | 103 (100.0%) | 0 (0.0%) |
| $75,000 to $99,999 | 0 (0.0%) | 0 (0.0%) |
| $100,000 and over | 247 (100.0%) | 0 (0.0%) |
Public vs Private Health Insurance Coverage by Age in Keene
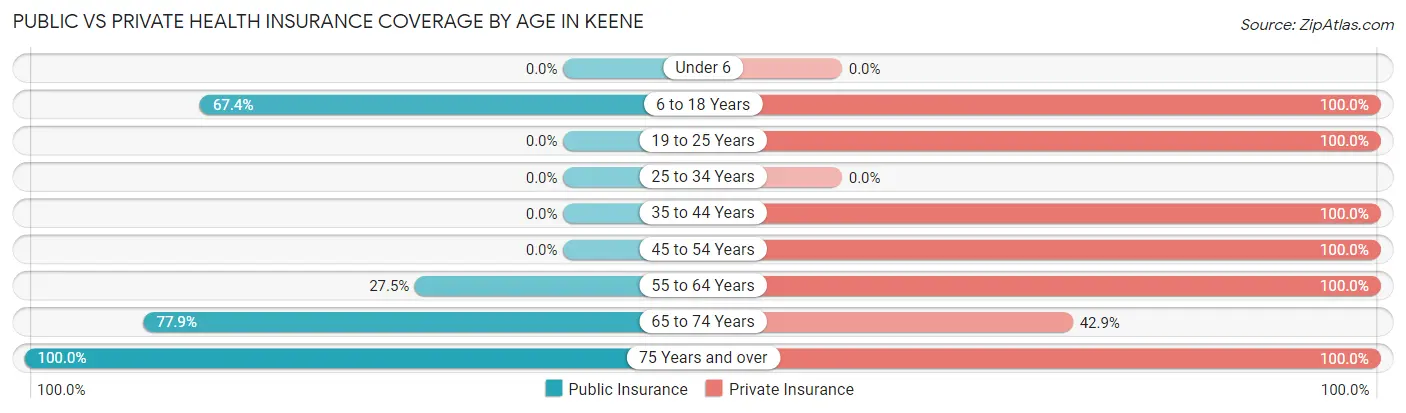
| Age Bracket | Public Insurance | Private Insurance |
| Under 6 | 0 (0.0%) | 0 (0.0%) |
| 6 to 18 Years | 29 (67.4%) | 43 (100.0%) |
| 19 to 25 Years | 0 (0.0%) | 42 (100.0%) |
| 25 to 34 Years | 0 (0.0%) | 0 (0.0%) |
| 35 to 44 Years | 0 (0.0%) | 8 (100.0%) |
| 45 to 54 Years | 0 (0.0%) | 106 (100.0%) |
| 55 to 64 Years | 22 (27.5%) | 80 (100.0%) |
| 65 to 74 Years | 60 (77.9%) | 33 (42.9%) |
| 75 Years and over | 48 (100.0%) | 48 (100.0%) |
| Total | 159 (39.4%) | 360 (89.1%) |
Disability Status by Sex by Age in Keene
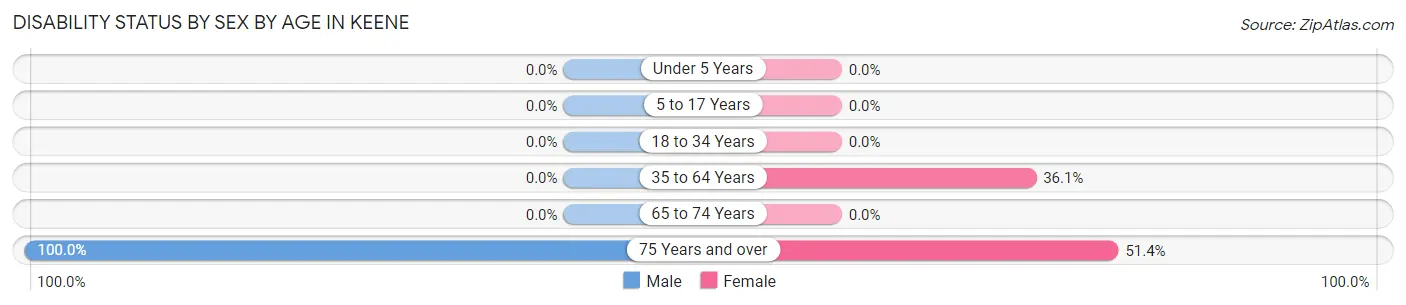
| Age Bracket | Male | Female |
| Under 5 Years | 0 (0.0%) | 0 (0.0%) |
| 5 to 17 Years | 0 (0.0%) | 0 (0.0%) |
| 18 to 34 Years | 0 (0.0%) | 0 (0.0%) |
| 35 to 64 Years | 0 (0.0%) | 35 (36.1%) |
| 65 to 74 Years | 0 (0.0%) | 0 (0.0%) |
| 75 Years and over | 11 (100.0%) | 19 (51.3%) |
Disability Class by Sex by Age in Keene
Disability Class: Hearing Difficulty
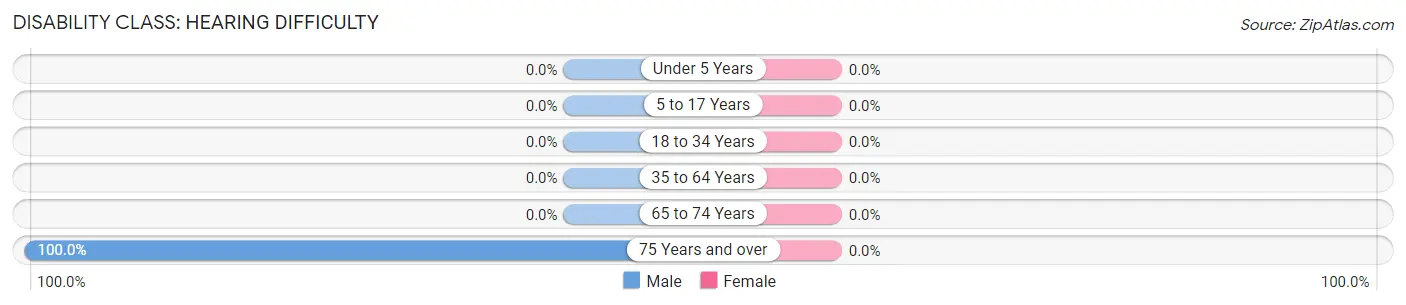
| Age Bracket | Male | Female |
| Under 5 Years | 0 (0.0%) | 0 (0.0%) |
| 5 to 17 Years | 0 (0.0%) | 0 (0.0%) |
| 18 to 34 Years | 0 (0.0%) | 0 (0.0%) |
| 35 to 64 Years | 0 (0.0%) | 0 (0.0%) |
| 65 to 74 Years | 0 (0.0%) | 0 (0.0%) |
| 75 Years and over | 11 (100.0%) | 0 (0.0%) |
Disability Class: Vision Difficulty
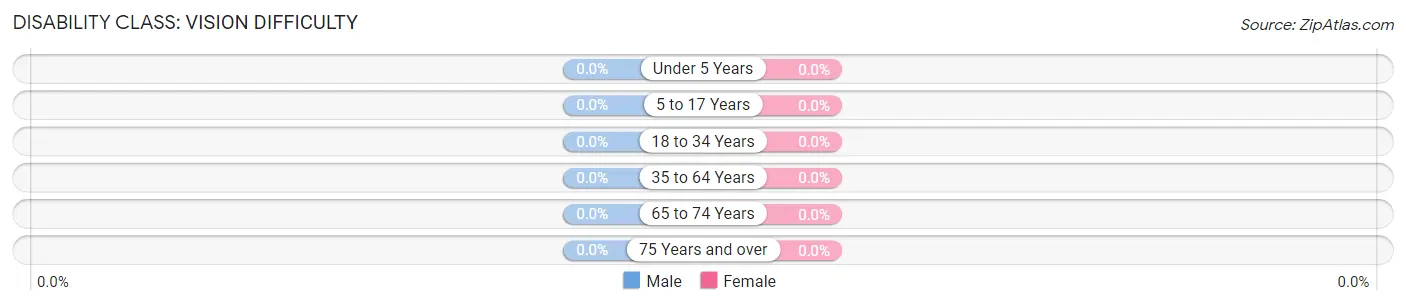
| Age Bracket | Male | Female |
| Under 5 Years | 0 (0.0%) | 0 (0.0%) |
| 5 to 17 Years | 0 (0.0%) | 0 (0.0%) |
| 18 to 34 Years | 0 (0.0%) | 0 (0.0%) |
| 35 to 64 Years | 0 (0.0%) | 0 (0.0%) |
| 65 to 74 Years | 0 (0.0%) | 0 (0.0%) |
| 75 Years and over | 0 (0.0%) | 0 (0.0%) |
Disability Class: Cognitive Difficulty
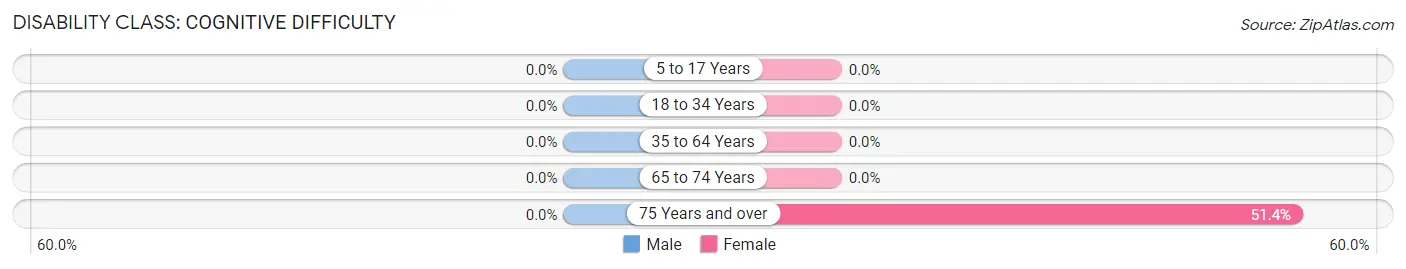
| Age Bracket | Male | Female |
| 5 to 17 Years | 0 (0.0%) | 0 (0.0%) |
| 18 to 34 Years | 0 (0.0%) | 0 (0.0%) |
| 35 to 64 Years | 0 (0.0%) | 0 (0.0%) |
| 65 to 74 Years | 0 (0.0%) | 0 (0.0%) |
| 75 Years and over | 0 (0.0%) | 19 (51.3%) |
Disability Class: Ambulatory Difficulty
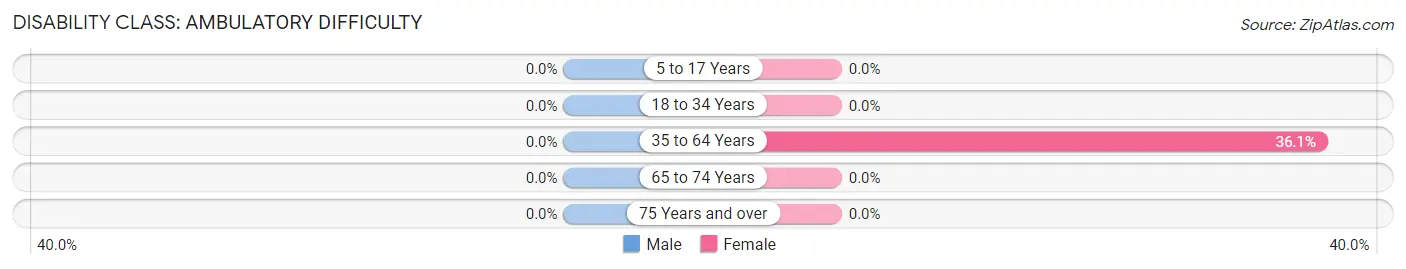
| Age Bracket | Male | Female |
| 5 to 17 Years | 0 (0.0%) | 0 (0.0%) |
| 18 to 34 Years | 0 (0.0%) | 0 (0.0%) |
| 35 to 64 Years | 0 (0.0%) | 35 (36.1%) |
| 65 to 74 Years | 0 (0.0%) | 0 (0.0%) |
| 75 Years and over | 0 (0.0%) | 0 (0.0%) |
Disability Class: Self-Care Difficulty
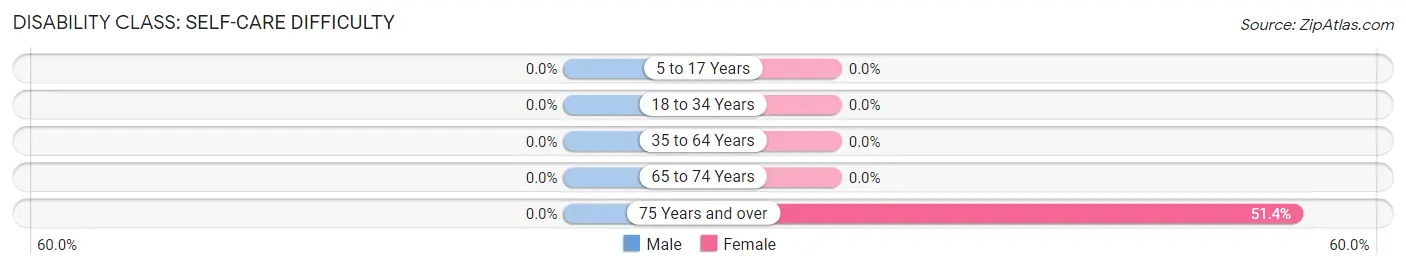
| Age Bracket | Male | Female |
| 5 to 17 Years | 0 (0.0%) | 0 (0.0%) |
| 18 to 34 Years | 0 (0.0%) | 0 (0.0%) |
| 35 to 64 Years | 0 (0.0%) | 0 (0.0%) |
| 65 to 74 Years | 0 (0.0%) | 0 (0.0%) |
| 75 Years and over | 0 (0.0%) | 19 (51.3%) |
Technology Access in Keene
Computing Device Access in Keene
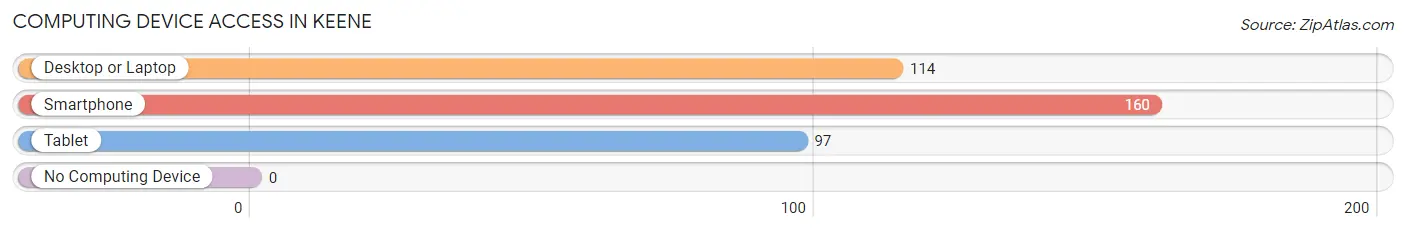
| Device Type | # Households | % Households |
| Desktop or Laptop | 114 | 66.7% |
| Smartphone | 160 | 93.6% |
| Tablet | 97 | 56.7% |
| No Computing Device | 0 | 0.0% |
| Total | 171 | 100.0% |
Internet Access in Keene
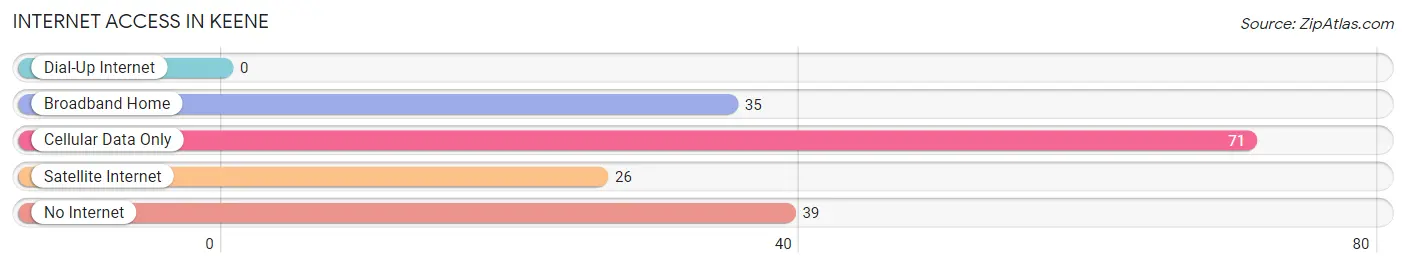
| Internet Type | # Households | % Households |
| Dial-Up Internet | 0 | 0.0% |
| Broadband Home | 35 | 20.5% |
| Cellular Data Only | 71 | 41.5% |
| Satellite Internet | 26 | 15.2% |
| No Internet | 39 | 22.8% |
| Total | 171 | 100.0% |
Keene Summary
Keene is a small unincorporated community located in Kern County, California. It is situated in the Tehachapi Mountains, approximately 8 miles east of Tehachapi and about 40 miles southeast of Bakersfield. The population of Keene was estimated to be 1,717 in 2019.
Geography
Keene is located in the Tehachapi Mountains at an elevation of 4,000 feet. The area is characterized by rolling hills and valleys, with the Tehachapi Mountains to the west and the Sierra Nevada Mountains to the east. The climate is semi-arid, with hot summers and mild winters. The average annual precipitation is approximately 10 inches.
The community is located along State Route 58, which connects it to Tehachapi and Bakersfield. The nearest major airport is Meadows Field Airport in Bakersfield, which is about 40 miles away.
History
Keene was founded in 1876 by William Keene, a rancher from Missouri. He purchased a large tract of land in the Tehachapi Mountains and established a ranch. The town was named after him.
In the early 1900s, the town began to grow as a result of the construction of the Southern Pacific Railroad. The railroad provided a link to the outside world and allowed the town to become a center for commerce and trade.
In the 1950s, the town experienced a period of growth as a result of the construction of the Tehachapi Loop, a railroad loop that allowed trains to climb the steep grade of the Tehachapi Mountains. The loop was completed in 1952 and is still in use today.
Economy
Keene’s economy is largely based on agriculture and tourism. The town is home to several farms and ranches, which produce a variety of crops, including alfalfa, wheat, and corn. The town is also home to several wineries, which produce a variety of wines.
Tourism is an important part of the local economy. The town is home to several attractions, including the Tehachapi Loop, the Tehachapi Museum, and the Tehachapi Pass Wind Farm. The town is also a popular destination for outdoor activities, such as hiking, camping, and fishing.
Demographics
As of 2019, the population of Keene was estimated to be 1,717. The racial makeup of the town was 79.3% White, 0.7% African American, 0.3% Native American, 0.2% Asian, 0.1% Pacific Islander, 16.2% from other races, and 3.4% from two or more races. Hispanic or Latino of any race were 33.2% of the population.
The median household income in Keene was $45,938 in 2019. The per capita income was $20,945. About 16.2% of the population was below the poverty line.
Conclusion
Keene is a small unincorporated community located in Kern County, California. It is situated in the Tehachapi Mountains, approximately 8 miles east of Tehachapi and about 40 miles southeast of Bakersfield. The population of Keene was estimated to be 1,717 in 2019. The town’s economy is largely based on agriculture and tourism. The racial makeup of the town was 79.3% White, 0.7% African American, 0.3% Native American, 0.2% Asian, 0.1% Pacific Islander, 16.2% from other races, and 3.4% from two or more races. The median household income in Keene was $45,938 in 2019. The per capita income was $20,945. About 16.2% of the population was below the poverty line.
Common Questions
What is Per Capita Income in Keene?
Per Capita income in Keene is $52,737.
What is the Median Family Income in Keene?
Median Family Income in Keene is $107,163.
What is the Median Household income in Keene?
Median Household Income in Keene is $102,361.
What is Inequality or Gini Index in Keene?
Inequality or Gini Index in Keene is 0.37.
What is the Total Population of Keene?
Total Population of Keene is 404.
What is the Total Male Population of Keene?
Total Male Population of Keene is 228.
What is the Total Female Population of Keene?
Total Female Population of Keene is 176.
What is the Ratio of Males per 100 Females in Keene?
There are 129.55 Males per 100 Females in Keene.
What is the Ratio of Females per 100 Males in Keene?
There are 77.19 Females per 100 Males in Keene.
What is the Median Population Age in Keene?
Median Population Age in Keene is 55.3 Years.
What is the Average Family Size in Keene
Average Family Size in Keene is 2.7 People.
What is the Average Household Size in Keene
Average Household Size in Keene is 2.4 People.
How Large is the Labor Force in Keene?
There are 199 People in the Labor Forcein in Keene.
What is the Percentage of People in the Labor Force in Keene?
53.1% of People are in the Labor Force in Keene.