Cities with the Highest Percentage of Population Employed in Legal Services & Support in Kentucky
RELATED REPORTS & OPTIONS
Legal Services & Support
Kentucky
Compare Cities
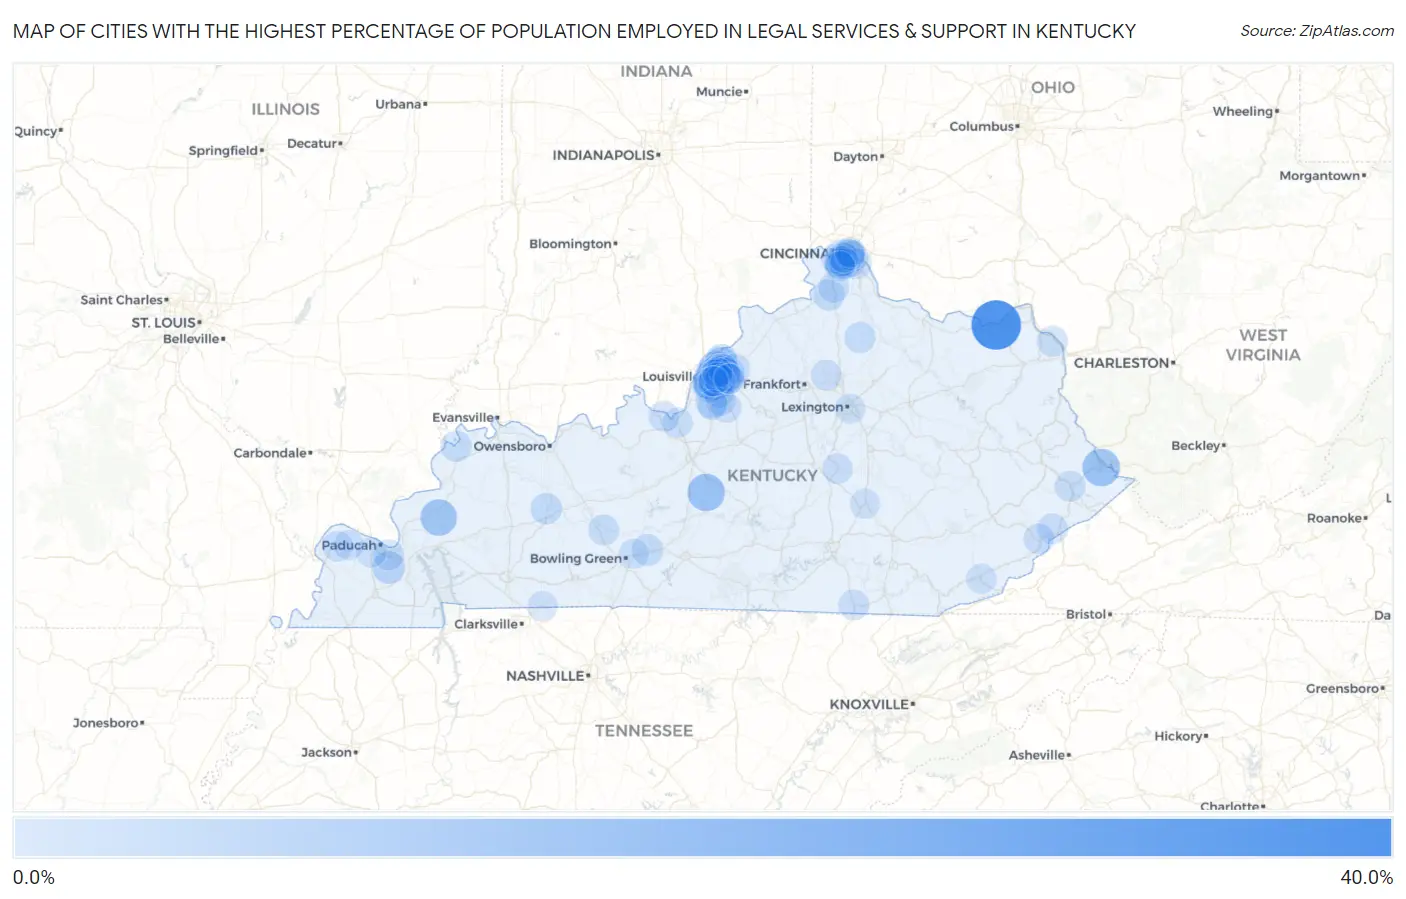
Map of Cities with the Highest Percentage of Population Employed in Legal Services & Support in Kentucky
0.0%
40.0%
Cities with the Highest Percentage of Population Employed in Legal Services & Support in Kentucky
| City | % Employed | vs State | vs National | |
| 1. | Garrison | 37.0% | 0.95%(+36.0)#1 | 1.2%(+35.8)#17 |
| 2. | Strathmoor Manor | 16.2% | 0.95%(+15.2)#2 | 1.2%(+15.0)#90 |
| 3. | Belfry | 14.7% | 0.95%(+13.7)#3 | 1.2%(+13.5)#107 |
| 4. | Magnolia | 14.4% | 0.95%(+13.4)#4 | 1.2%(+13.2)#110 |
| 5. | Crayne | 12.8% | 0.95%(+11.9)#5 | 1.2%(+11.6)#144 |
| 6. | Rolling Fields | 12.4% | 0.95%(+11.4)#6 | 1.2%(+11.2)#150 |
| 7. | Norbourne Estates | 12.3% | 0.95%(+11.4)#7 | 1.2%(+11.1)#151 |
| 8. | Glenview | 11.1% | 0.95%(+10.2)#8 | 1.2%(+9.97)#178 |
| 9. | Druid Hills | 9.8% | 0.95%(+8.88)#9 | 1.2%(+8.64)#233 |
| 10. | Seneca Gardens | 9.8% | 0.95%(+8.81)#10 | 1.2%(+8.57)#240 |
| 11. | Indian Hills | 8.9% | 0.95%(+7.94)#11 | 1.2%(+7.70)#281 |
| 12. | Meadowview Estates | 8.8% | 0.95%(+7.83)#12 | 1.2%(+7.59)#288 |
| 13. | Goose Creek | 6.8% | 0.95%(+5.83)#13 | 1.2%(+5.60)#463 |
| 14. | Prospect | 6.7% | 0.95%(+5.77)#14 | 1.2%(+5.53)#470 |
| 15. | Bellemeade | 6.6% | 0.95%(+5.65)#15 | 1.2%(+5.41)#490 |
| 16. | Maryhill Estates | 6.5% | 0.95%(+5.51)#16 | 1.2%(+5.27)#524 |
| 17. | Thornhill | 6.4% | 0.95%(+5.44)#17 | 1.2%(+5.20)#533 |
| 18. | Hills And Dales | 6.3% | 0.95%(+5.40)#18 | 1.2%(+5.17)#538 |
| 19. | Symsonia | 6.1% | 0.95%(+5.17)#19 | 1.2%(+4.93)#580 |
| 20. | Wilder | 5.7% | 0.95%(+4.76)#20 | 1.2%(+4.52)#663 |
| 21. | Woodlawn Park | 5.6% | 0.95%(+4.68)#21 | 1.2%(+4.44)#677 |
| 22. | Beechwood Village | 5.4% | 0.95%(+4.49)#22 | 1.2%(+4.25)#722 |
| 23. | Anchorage | 5.2% | 0.95%(+4.25)#23 | 1.2%(+4.01)#792 |
| 24. | Norwood | 5.1% | 0.95%(+4.13)#24 | 1.2%(+3.89)#821 |
| 25. | Riverwood | 5.1% | 0.95%(+4.11)#25 | 1.2%(+3.87)#826 |
| 26. | Richlawn | 5.0% | 0.95%(+4.05)#26 | 1.2%(+3.82)#840 |
| 27. | Bancroft | 4.7% | 0.95%(+3.75)#27 | 1.2%(+3.51)#951 |
| 28. | Green Spring | 4.4% | 0.95%(+3.50)#28 | 1.2%(+3.26)#1,034 |
| 29. | Wildwood | 4.4% | 0.95%(+3.44)#29 | 1.2%(+3.20)#1,051 |
| 30. | River Bluff | 4.4% | 0.95%(+3.42)#30 | 1.2%(+3.18)#1,058 |
| 31. | Houston Acres | 4.3% | 0.95%(+3.36)#31 | 1.2%(+3.12)#1,087 |
| 32. | Newport | 4.2% | 0.95%(+3.27)#32 | 1.2%(+3.04)#1,125 |
| 33. | Brownsboro Village | 4.2% | 0.95%(+3.22)#33 | 1.2%(+2.98)#1,147 |
| 34. | Oakland | 4.2% | 0.95%(+3.22)#34 | 1.2%(+2.98)#1,149 |
| 35. | Verona | 4.1% | 0.95%(+3.13)#35 | 1.2%(+2.89)#1,193 |
| 36. | Lincolnshire | 4.0% | 0.95%(+3.05)#36 | 1.2%(+2.82)#1,232 |
| 37. | Glenview Manor | 4.0% | 0.95%(+3.01)#37 | 1.2%(+2.78)#1,251 |
| 38. | Barbourmeade | 3.8% | 0.95%(+2.81)#38 | 1.2%(+2.57)#1,352 |
| 39. | South Carrollton | 3.7% | 0.95%(+2.76)#39 | 1.2%(+2.52)#1,393 |
| 40. | Windy Hills | 3.7% | 0.95%(+2.75)#40 | 1.2%(+2.52)#1,398 |
| 41. | Hunters Hollow | 3.5% | 0.95%(+2.58)#41 | 1.2%(+2.35)#1,511 |
| 42. | Berry | 3.4% | 0.95%(+2.50)#42 | 1.2%(+2.26)#1,574 |
| 43. | Mockingbird Valley | 3.4% | 0.95%(+2.50)#43 | 1.2%(+2.26)#1,575 |
| 44. | Lakeside Park | 3.3% | 0.95%(+2.37)#44 | 1.2%(+2.14)#1,670 |
| 45. | Glenview Hills | 3.3% | 0.95%(+2.35)#45 | 1.2%(+2.11)#1,686 |
| 46. | Uniontown | 3.2% | 0.95%(+2.25)#46 | 1.2%(+2.01)#1,760 |
| 47. | Manor Creek | 3.2% | 0.95%(+2.24)#47 | 1.2%(+2.00)#1,769 |
| 48. | Wellington | 3.1% | 0.95%(+2.15)#48 | 1.2%(+1.92)#1,835 |
| 49. | Graymoor Devondale | 3.0% | 0.95%(+2.06)#49 | 1.2%(+1.82)#1,930 |
| 50. | Heritage Creek | 3.0% | 0.95%(+2.03)#50 | 1.2%(+1.79)#1,956 |
| 51. | Bellefonte | 3.0% | 0.95%(+2.01)#51 | 1.2%(+1.77)#1,979 |
| 52. | Lynnview | 2.8% | 0.95%(+1.89)#52 | 1.2%(+1.65)#2,091 |
| 53. | Ludlow | 2.8% | 0.95%(+1.88)#53 | 1.2%(+1.64)#2,103 |
| 54. | Blue Ridge Manor | 2.8% | 0.95%(+1.87)#54 | 1.2%(+1.63)#2,119 |
| 55. | Walton | 2.8% | 0.95%(+1.84)#55 | 1.2%(+1.61)#2,138 |
| 56. | Reidland | 2.8% | 0.95%(+1.84)#56 | 1.2%(+1.60)#2,145 |
| 57. | Woodbury | 2.8% | 0.95%(+1.83)#57 | 1.2%(+1.59)#2,162 |
| 58. | Fort Thomas | 2.8% | 0.95%(+1.82)#58 | 1.2%(+1.58)#2,173 |
| 59. | Pikeville | 2.7% | 0.95%(+1.75)#59 | 1.2%(+1.51)#2,240 |
| 60. | Fleming Neon | 2.6% | 0.95%(+1.66)#60 | 1.2%(+1.42)#2,339 |
| 61. | La Center | 2.5% | 0.95%(+1.59)#61 | 1.2%(+1.35)#2,412 |
| 62. | Whitesburg | 2.5% | 0.95%(+1.51)#62 | 1.2%(+1.27)#2,494 |
| 63. | Bellewood | 2.4% | 0.95%(+1.49)#63 | 1.2%(+1.26)#2,524 |
| 64. | Crestview | 2.4% | 0.95%(+1.49)#64 | 1.2%(+1.25)#2,535 |
| 65. | Audubon Park | 2.4% | 0.95%(+1.48)#65 | 1.2%(+1.24)#2,541 |
| 66. | Brownsboro Farm | 2.4% | 0.95%(+1.48)#66 | 1.2%(+1.24)#2,553 |
| 67. | Pine Knot | 2.4% | 0.95%(+1.47)#67 | 1.2%(+1.23)#2,560 |
| 68. | Fort Mitchell | 2.4% | 0.95%(+1.46)#68 | 1.2%(+1.22)#2,575 |
| 69. | Doe Valley | 2.4% | 0.95%(+1.46)#69 | 1.2%(+1.22)#2,576 |
| 70. | Stamping Ground | 2.4% | 0.95%(+1.42)#70 | 1.2%(+1.19)#2,621 |
| 71. | Crestview Hills | 2.4% | 0.95%(+1.42)#71 | 1.2%(+1.18)#2,629 |
| 72. | Old Brownsboro Place | 2.3% | 0.95%(+1.37)#72 | 1.2%(+1.13)#2,701 |
| 73. | Lancaster | 2.3% | 0.95%(+1.35)#73 | 1.2%(+1.11)#2,725 |
| 74. | Villa Hills | 2.2% | 0.95%(+1.26)#74 | 1.2%(+1.02)#2,861 |
| 75. | Spring Mill | 2.2% | 0.95%(+1.25)#75 | 1.2%(+1.01)#2,871 |
| 76. | Pewee Valley | 2.2% | 0.95%(+1.21)#76 | 1.2%(+0.970)#2,955 |
| 77. | Meadow Vale | 2.1% | 0.95%(+1.18)#77 | 1.2%(+0.944)#2,989 |
| 78. | Covington | 2.1% | 0.95%(+1.11)#78 | 1.2%(+0.870)#3,122 |
| 79. | Woodland Hills | 2.0% | 0.95%(+1.09)#79 | 1.2%(+0.851)#3,150 |
| 80. | St Regis Park | 2.0% | 0.95%(+1.02)#80 | 1.2%(+0.787)#3,269 |
| 81. | Mount Washington | 1.9% | 0.95%(+0.992)#81 | 1.2%(+0.754)#3,330 |
| 82. | Muldraugh | 1.9% | 0.95%(+0.977)#82 | 1.2%(+0.739)#3,356 |
| 83. | Fort Wright | 1.9% | 0.95%(+0.954)#83 | 1.2%(+0.716)#3,404 |
| 84. | Massac | 1.9% | 0.95%(+0.948)#84 | 1.2%(+0.710)#3,415 |
| 85. | Harlan | 1.9% | 0.95%(+0.935)#85 | 1.2%(+0.697)#3,452 |
| 86. | Strathmoor Village | 1.9% | 0.95%(+0.906)#86 | 1.2%(+0.668)#3,508 |
| 87. | Guthrie | 1.8% | 0.95%(+0.902)#87 | 1.2%(+0.664)#3,520 |
| 88. | Pioneer Village | 1.8% | 0.95%(+0.896)#88 | 1.2%(+0.658)#3,531 |
| 89. | Woodlawn | 1.8% | 0.95%(+0.889)#89 | 1.2%(+0.651)#3,552 |
| 90. | Northfield | 1.8% | 0.95%(+0.858)#90 | 1.2%(+0.620)#3,630 |
| 91. | St Matthews | 1.8% | 0.95%(+0.834)#91 | 1.2%(+0.596)#3,684 |
| 92. | Kevil | 1.8% | 0.95%(+0.816)#92 | 1.2%(+0.578)#3,726 |
| 93. | Park Hills | 1.7% | 0.95%(+0.741)#93 | 1.2%(+0.503)#3,924 |
| 94. | Kingsley | 1.7% | 0.95%(+0.735)#94 | 1.2%(+0.497)#3,939 |
| 95. | Bellevue | 1.7% | 0.95%(+0.730)#95 | 1.2%(+0.492)#3,952 |
| 96. | Douglass Hills | 1.7% | 0.95%(+0.722)#96 | 1.2%(+0.485)#3,966 |
| 97. | Mount Vernon | 1.7% | 0.95%(+0.713)#97 | 1.2%(+0.475)#3,984 |
| 98. | Lexington | 1.6% | 0.95%(+0.678)#98 | 1.2%(+0.440)#4,059 |
| 99. | Edgewood | 1.6% | 0.95%(+0.671)#99 | 1.2%(+0.433)#4,072 |
| 100. | Plum Springs | 1.6% | 0.95%(+0.658)#100 | 1.2%(+0.420)#4,115 |
Common Questions
What are the Top 10 Cities with the Highest Percentage of Population Employed in Legal Services & Support in Kentucky?
Top 10 Cities with the Highest Percentage of Population Employed in Legal Services & Support in Kentucky are:
#1
37.0%
#2
16.2%
#3
14.7%
#4
14.4%
#5
12.8%
#6
12.4%
#7
12.3%
#8
11.1%
#9
9.8%
#10
9.8%
What city has the Highest Percentage of Population Employed in Legal Services & Support in Kentucky?
Garrison has the Highest Percentage of Population Employed in Legal Services & Support in Kentucky with 37.0%.
What is the Percentage of Population Employed in Legal Services & Support in the State of Kentucky?
Percentage of Population Employed in Legal Services & Support in Kentucky is 0.95%.
What is the Percentage of Population Employed in Legal Services & Support in the United States?
Percentage of Population Employed in Legal Services & Support in the United States is 1.2%.