Silverado Resort, CA Map & Demographics
Silverado Resort Map
Silverado Resort Overview
$114,032
PER CAPITA INCOME
$175,000
AVG FAMILY INCOME
$161,778
AVG HOUSEHOLD INCOME
0.42
INEQUALITY / GINI INDEX
1,012
TOTAL POPULATION
523
MALE POPULATION
489
FEMALE POPULATION
106.95
MALES / 100 FEMALES
93.50
FEMALES / 100 MALES
69.4
MEDIAN AGE
2.2
AVG FAMILY SIZE
1.9
AVG HOUSEHOLD SIZE
349
LABOR FORCE [ PEOPLE ]
35.9%
PERCENT IN LABOR FORCE
5.2%
UNEMPLOYMENT RATE
Income in Silverado Resort
Income Overview in Silverado Resort
Per Capita Income in Silverado Resort is $114,032, while median incomes of families and households are $175,000 and $161,778 respectively.
| Characteristic | Number | Measure |
| Per Capita Income | 1,012 | $114,032 |
| Median Family Income | 380 | $175,000 |
| Mean Family Income | 380 | $253,249 |
| Median Household Income | 542 | $161,778 |
| Mean Household Income | 542 | $213,404 |
| Income Deficit | 380 | $0 |
| Wage / Income Gap (%) | 1,012 | 0.00% |
| Wage / Income Gap ($) | 1,012 | 100.00¢ per $1 |
| Gini / Inequality Index | 1,012 | 0.42 |
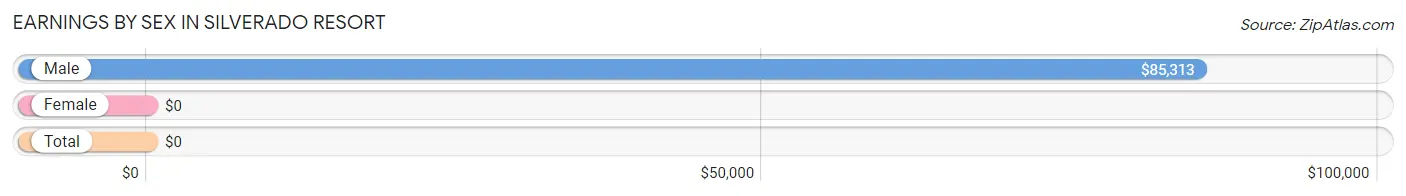
Earnings by Sex in Silverado Resort
| Sex | Number | Average Earnings |
| Male | 203 (52.7%) | $85,313 |
| Female | 182 (47.3%) | $0 |
| Total | 385 (100.0%) | $0 |
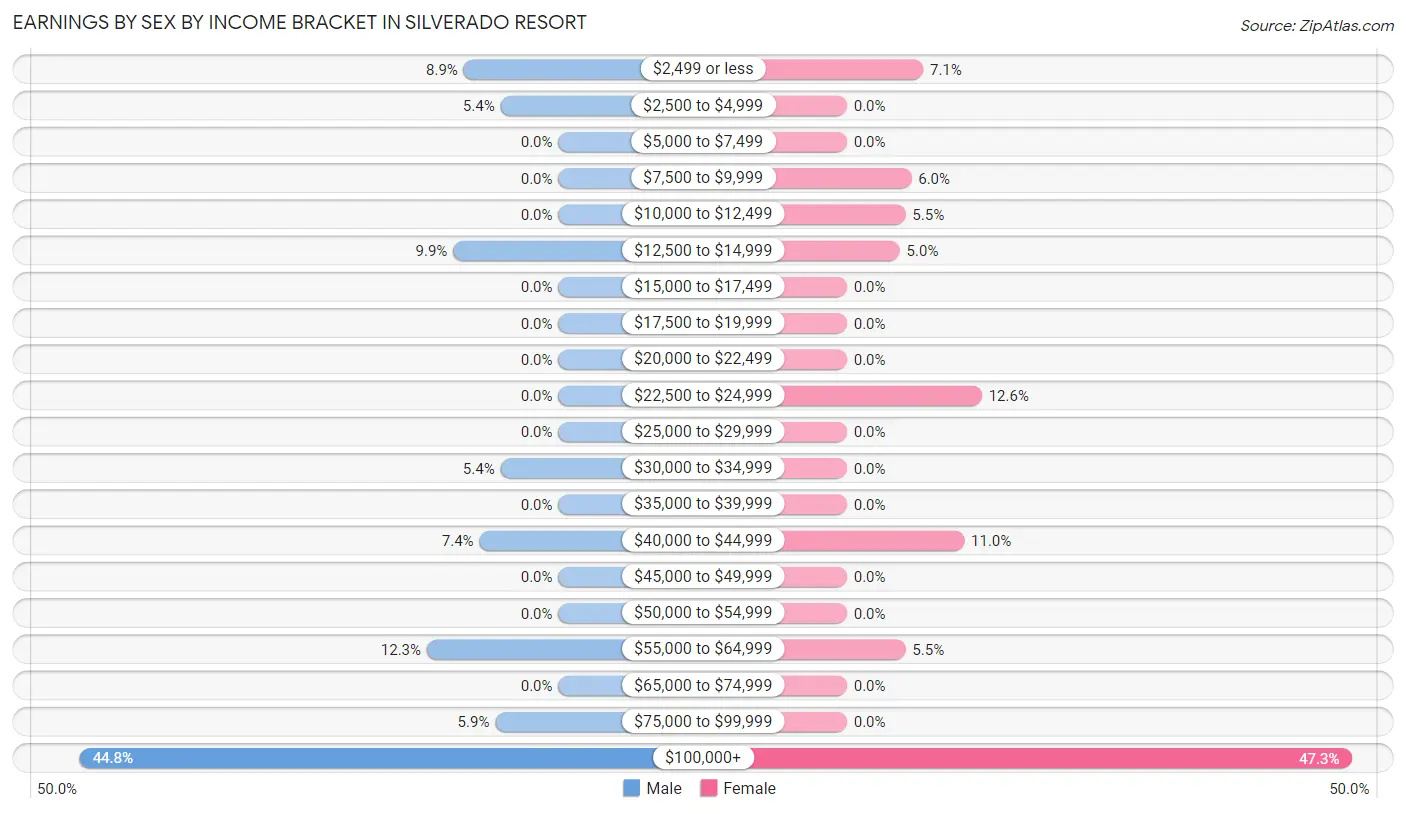
Earnings by Sex by Income Bracket in Silverado Resort
The most common earnings brackets in Silverado Resort are $100,000+ for men (91 | 44.8%) and $100,000+ for women (86 | 47.2%).
| Income | Male | Female |
| $2,499 or less | 18 (8.9%) | 13 (7.1%) |
| $2,500 to $4,999 | 11 (5.4%) | 0 (0.0%) |
| $5,000 to $7,499 | 0 (0.0%) | 0 (0.0%) |
| $7,500 to $9,999 | 0 (0.0%) | 11 (6.0%) |
| $10,000 to $12,499 | 0 (0.0%) | 10 (5.5%) |
| $12,500 to $14,999 | 20 (9.9%) | 9 (5.0%) |
| $15,000 to $17,499 | 0 (0.0%) | 0 (0.0%) |
| $17,500 to $19,999 | 0 (0.0%) | 0 (0.0%) |
| $20,000 to $22,499 | 0 (0.0%) | 0 (0.0%) |
| $22,500 to $24,999 | 0 (0.0%) | 23 (12.6%) |
| $25,000 to $29,999 | 0 (0.0%) | 0 (0.0%) |
| $30,000 to $34,999 | 11 (5.4%) | 0 (0.0%) |
| $35,000 to $39,999 | 0 (0.0%) | 0 (0.0%) |
| $40,000 to $44,999 | 15 (7.4%) | 20 (11.0%) |
| $45,000 to $49,999 | 0 (0.0%) | 0 (0.0%) |
| $50,000 to $54,999 | 0 (0.0%) | 0 (0.0%) |
| $55,000 to $64,999 | 25 (12.3%) | 10 (5.5%) |
| $65,000 to $74,999 | 0 (0.0%) | 0 (0.0%) |
| $75,000 to $99,999 | 12 (5.9%) | 0 (0.0%) |
| $100,000+ | 91 (44.8%) | 86 (47.2%) |
| Total | 203 (100.0%) | 182 (100.0%) |
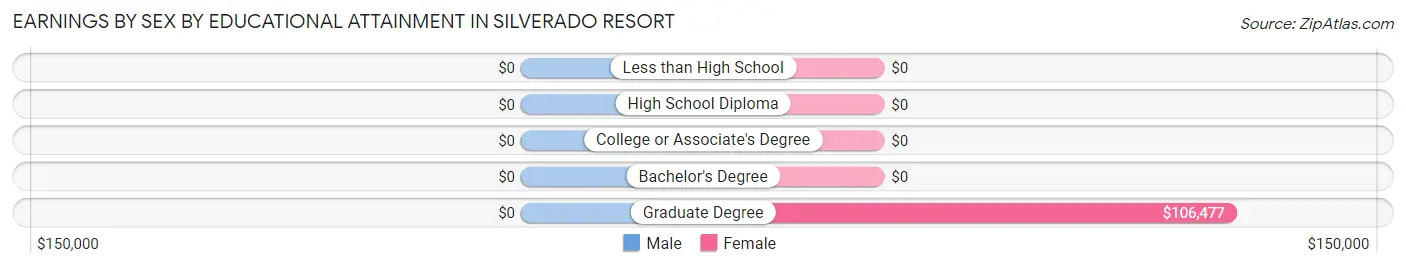
Earnings by Sex by Educational Attainment in Silverado Resort
| Educational Attainment | Male Income | Female Income |
| Less than High School | - | - |
| High School Diploma | - | - |
| College or Associate's Degree | - | - |
| Bachelor's Degree | - | - |
| Graduate Degree | - | - |
| Total | $87,188 | $0 |
Family Income in Silverado Resort
Family Income Brackets in Silverado Resort
According to the Silverado Resort family income data, there are 167 families falling into the $200,000+ income range, which is the most common income bracket and makes up 44.0% of all families.
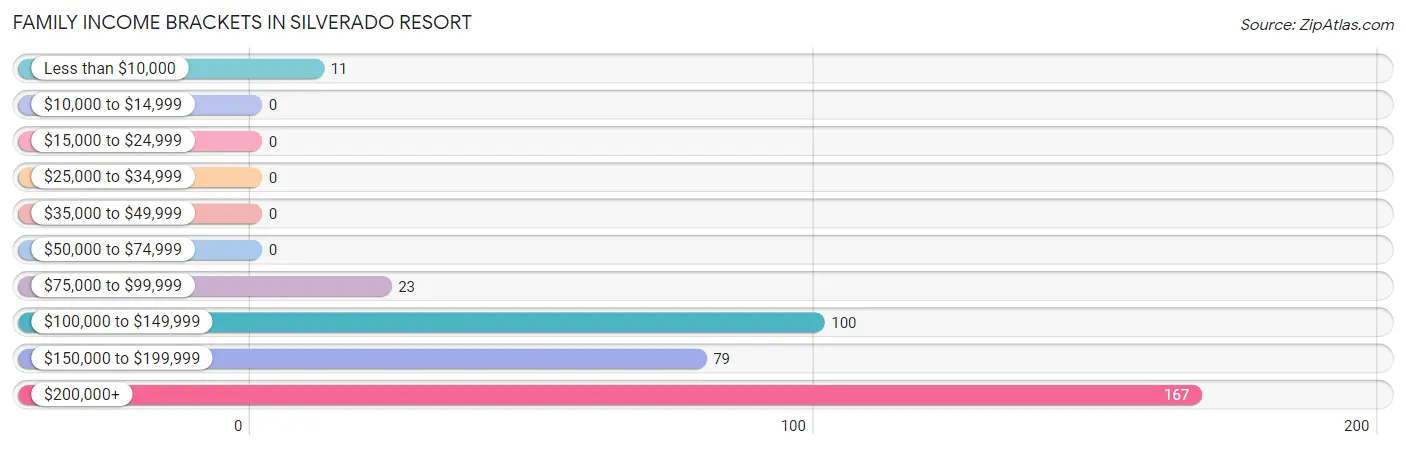
| Income Bracket | # Families | % Families |
| Less than $10,000 | 11 | 2.9% |
| $10,000 to $14,999 | 0 | 0.0% |
| $15,000 to $24,999 | 0 | 0.0% |
| $25,000 to $34,999 | 0 | 0.0% |
| $35,000 to $49,999 | 0 | 0.0% |
| $50,000 to $74,999 | 0 | 0.0% |
| $75,000 to $99,999 | 23 | 6.1% |
| $100,000 to $149,999 | 100 | 26.3% |
| $150,000 to $199,999 | 79 | 20.8% |
| $200,000+ | 167 | 43.9% |
Family Income by Famaliy Size in Silverado Resort
2-person families (333 | 87.6%) account for the highest median family income in Silverado Resort with $174,205 per family, while 2-person families (333 | 87.6%) have the highest median income of $87,102 per family member.
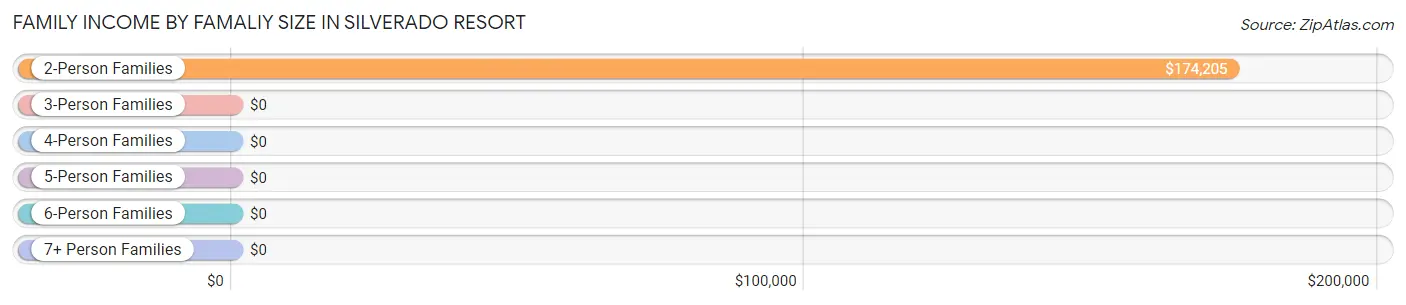
| Income Bracket | # Families | Median Income |
| 2-Person Families | 333 (87.6%) | $174,205 |
| 3-Person Families | 13 (3.4%) | $0 |
| 4-Person Families | 14 (3.7%) | $0 |
| 5-Person Families | 20 (5.3%) | $0 |
| 6-Person Families | 0 (0.0%) | $0 |
| 7+ Person Families | 0 (0.0%) | $0 |
| Total | 380 (100.0%) | $175,000 |
Family Income by Number of Earners in Silverado Resort
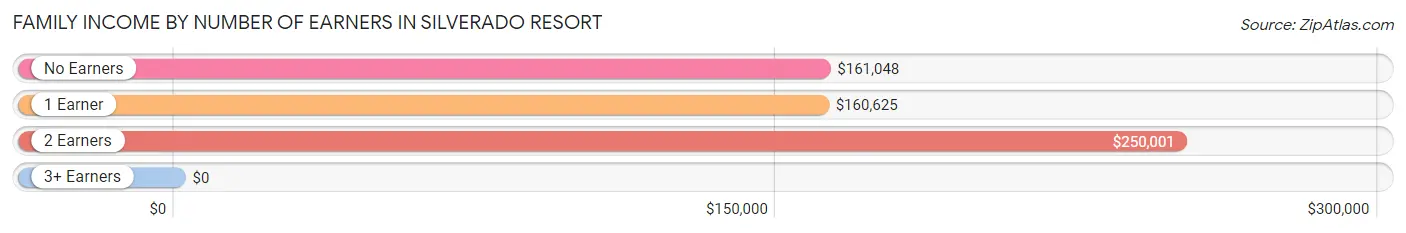
| Number of Earners | # Families | Median Income |
| No Earners | 168 (44.2%) | $161,048 |
| 1 Earner | 93 (24.5%) | $160,625 |
| 2 Earners | 99 (26.1%) | $250,001 |
| 3+ Earners | 20 (5.3%) | $0 |
| Total | 380 (100.0%) | $175,000 |
Household Income in Silverado Resort
Household Income Brackets in Silverado Resort
With 192 households falling in the category, the $200,000+ income range is the most frequent in Silverado Resort, accounting for 35.4% of all households.
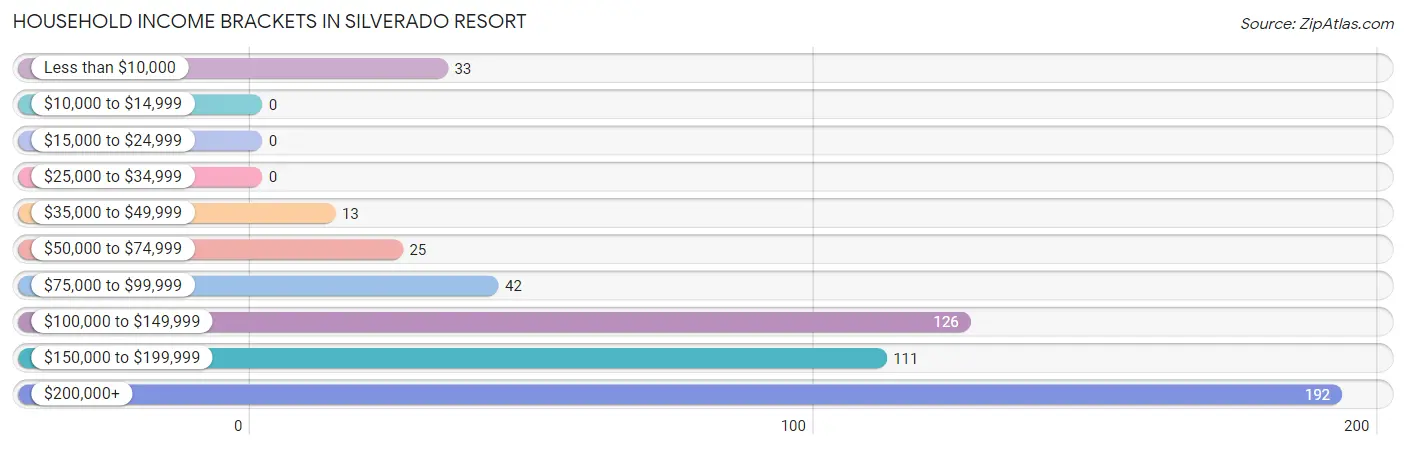
| Income Bracket | # Households | % Households |
| Less than $10,000 | 33 | 6.1% |
| $10,000 to $14,999 | 0 | 0.0% |
| $15,000 to $24,999 | 0 | 0.0% |
| $25,000 to $34,999 | 0 | 0.0% |
| $35,000 to $49,999 | 13 | 2.4% |
| $50,000 to $74,999 | 25 | 4.6% |
| $75,000 to $99,999 | 42 | 7.7% |
| $100,000 to $149,999 | 126 | 23.2% |
| $150,000 to $199,999 | 111 | 20.5% |
| $200,000+ | 192 | 35.4% |
Household Income by Householder Age in Silverado Resort
The median household income in Silverado Resort is $161,778, with the highest median household income of $174,226 found in the 45 to 64 years age bracket for the primary householder. A total of 131 households (24.2%) fall into this category.
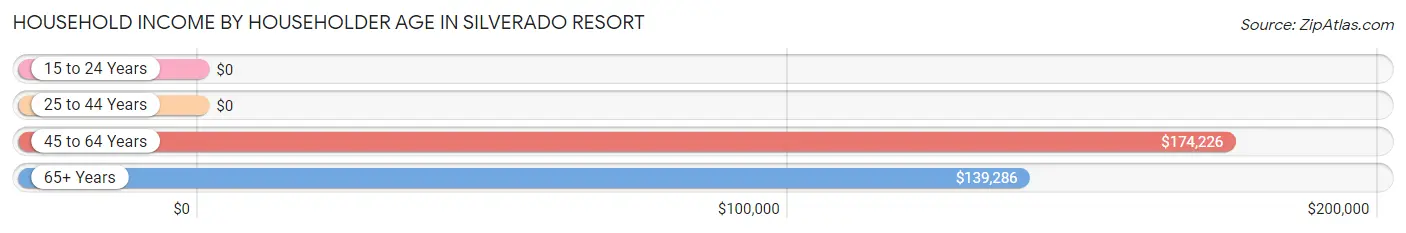
| Income Bracket | # Households | Median Income |
| 15 to 24 Years | 0 (0.0%) | $0 |
| 25 to 44 Years | 19 (3.5%) | $0 |
| 45 to 64 Years | 131 (24.2%) | $174,226 |
| 65+ Years | 392 (72.3%) | $139,286 |
| Total | 542 (100.0%) | $161,778 |
Poverty in Silverado Resort
Income Below Poverty by Sex and Age in Silverado Resort
With 4.0% poverty level for males and 9.0% for females among the residents of Silverado Resort, 55 to 64 year old males and 75 year old and over females are the most vulnerable to poverty, with 10 males (17.2%) and 44 females (34.6%) in their respective age groups living below the poverty level.
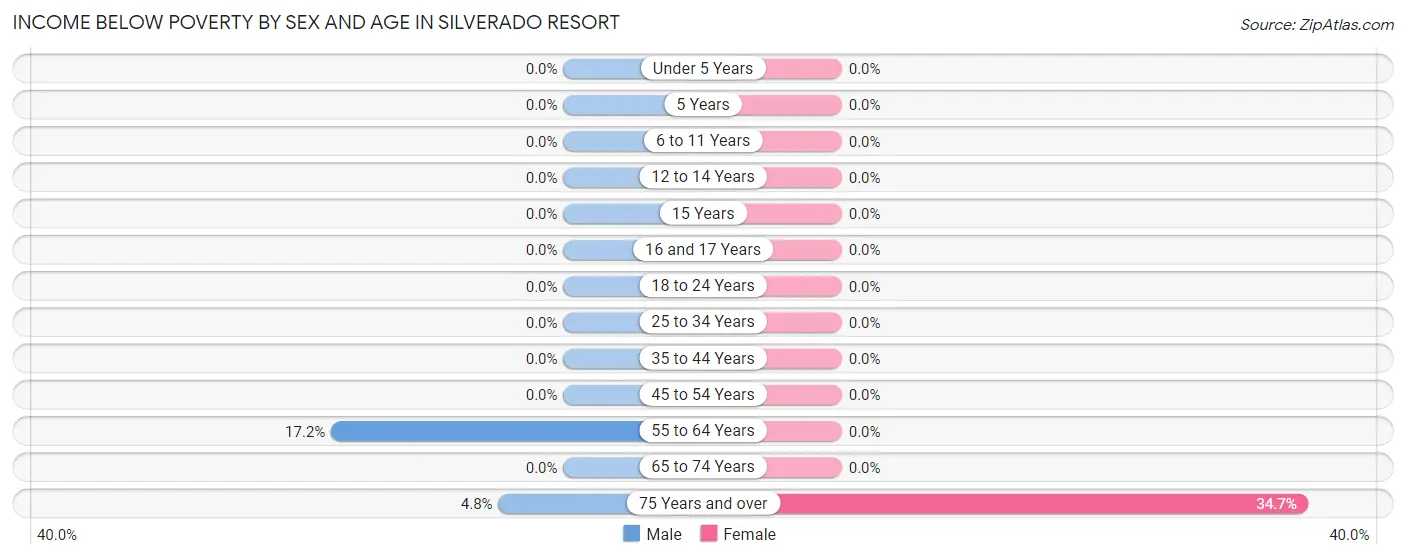
| Age Bracket | Male | Female |
| Under 5 Years | 0 (0.0%) | 0 (0.0%) |
| 5 Years | 0 (0.0%) | 0 (0.0%) |
| 6 to 11 Years | 0 (0.0%) | 0 (0.0%) |
| 12 to 14 Years | 0 (0.0%) | 0 (0.0%) |
| 15 Years | 0 (0.0%) | 0 (0.0%) |
| 16 and 17 Years | 0 (0.0%) | 0 (0.0%) |
| 18 to 24 Years | 0 (0.0%) | 0 (0.0%) |
| 25 to 34 Years | 0 (0.0%) | 0 (0.0%) |
| 35 to 44 Years | 0 (0.0%) | 0 (0.0%) |
| 45 to 54 Years | 0 (0.0%) | 0 (0.0%) |
| 55 to 64 Years | 10 (17.2%) | 0 (0.0%) |
| 65 to 74 Years | 0 (0.0%) | 0 (0.0%) |
| 75 Years and over | 11 (4.8%) | 44 (34.6%) |
| Total | 21 (4.0%) | 44 (9.0%) |
Income Above Poverty by Sex and Age in Silverado Resort
According to the poverty statistics in Silverado Resort, males aged 6 to 11 years and females aged 15 years are the age groups that are most secure financially, with 100.0% of males and 100.0% of females in these age groups living above the poverty line.
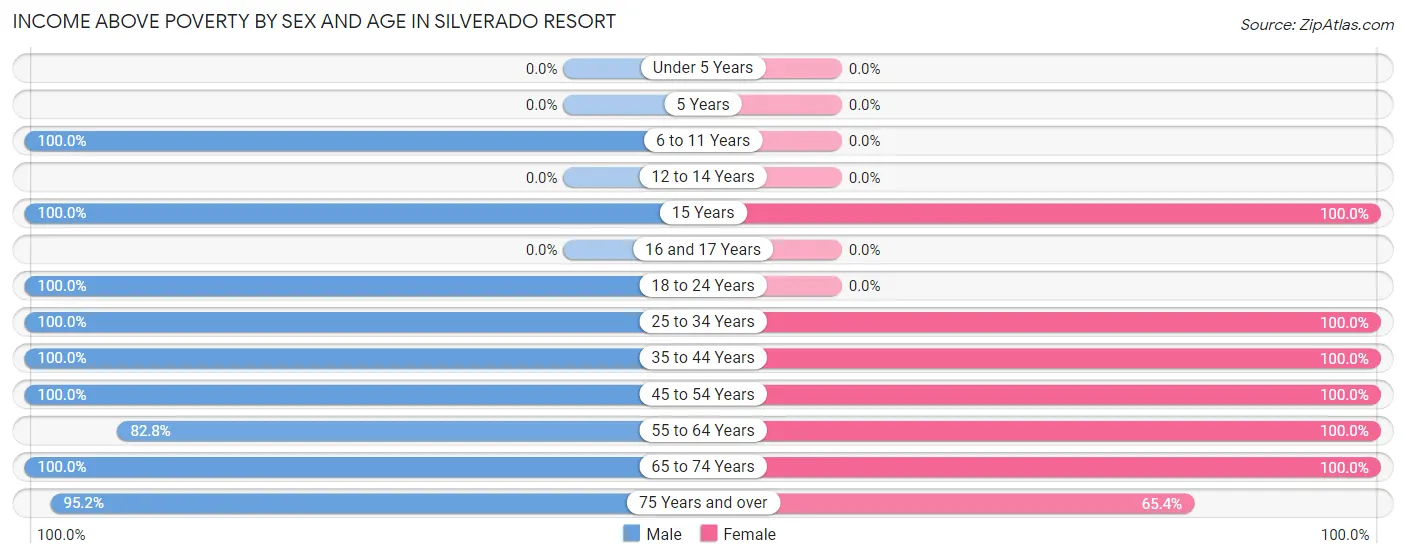
| Age Bracket | Male | Female |
| Under 5 Years | 0 (0.0%) | 0 (0.0%) |
| 5 Years | 0 (0.0%) | 0 (0.0%) |
| 6 to 11 Years | 13 (100.0%) | 0 (0.0%) |
| 12 to 14 Years | 0 (0.0%) | 0 (0.0%) |
| 15 Years | 13 (100.0%) | 13 (100.0%) |
| 16 and 17 Years | 0 (0.0%) | 0 (0.0%) |
| 18 to 24 Years | 18 (100.0%) | 0 (0.0%) |
| 25 to 34 Years | 15 (100.0%) | 28 (100.0%) |
| 35 to 44 Years | 20 (100.0%) | 13 (100.0%) |
| 45 to 54 Years | 16 (100.0%) | 62 (100.0%) |
| 55 to 64 Years | 48 (82.8%) | 126 (100.0%) |
| 65 to 74 Years | 142 (100.0%) | 120 (100.0%) |
| 75 Years and over | 217 (95.2%) | 83 (65.3%) |
| Total | 502 (96.0%) | 445 (91.0%) |
Income Below Poverty Among Married-Couple Families in Silverado Resort
The poverty statistics for married-couple families in Silverado Resort show that 3.0% or 11 of the total 364 families live below the poverty line. Families with no children have the highest poverty rate of 3.3%, comprising of 11 families. On the other hand, families with 1 or 2 children have the lowest poverty rate of 0.0%, which includes 0 families.
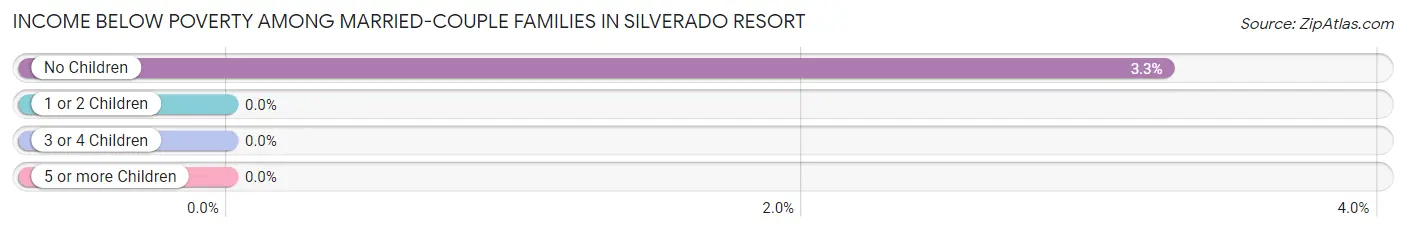
| Children | Above Poverty | Below Poverty |
| No Children | 326 (96.7%) | 11 (3.3%) |
| 1 or 2 Children | 27 (100.0%) | 0 (0.0%) |
| 3 or 4 Children | 0 (0.0%) | 0 (0.0%) |
| 5 or more Children | 0 (0.0%) | 0 (0.0%) |
| Total | 353 (97.0%) | 11 (3.0%) |
Income Below Poverty Among Single-Parent Households in Silverado Resort
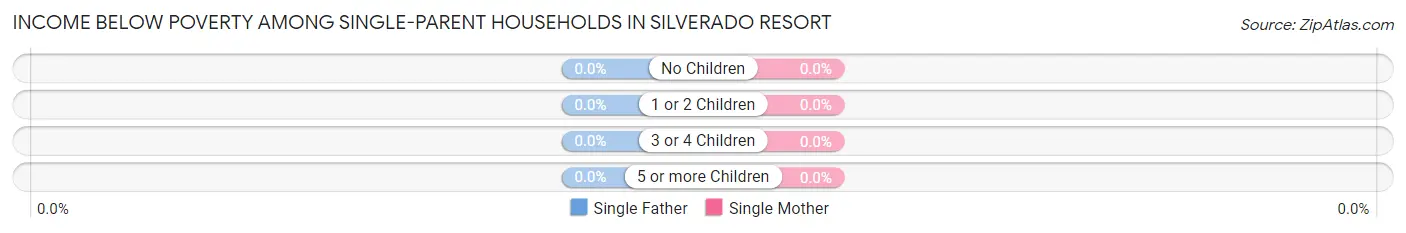
| Children | Single Father | Single Mother |
| No Children | 0 (0.0%) | 0 (0.0%) |
| 1 or 2 Children | 0 (0.0%) | 0 (0.0%) |
| 3 or 4 Children | 0 (0.0%) | 0 (0.0%) |
| 5 or more Children | 0 (0.0%) | 0 (0.0%) |
| Total | 0 (0.0%) | 0 (0.0%) |
Income Below Poverty Among Married-Couple vs Single-Parent Households in Silverado Resort
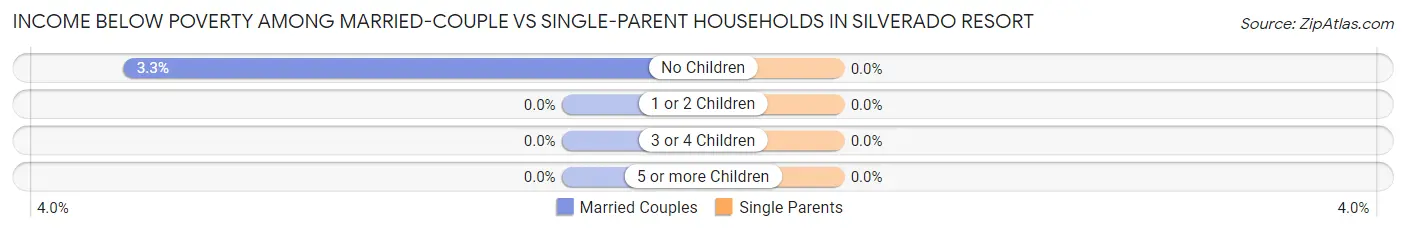
| Children | Married-Couple Families | Single-Parent Households |
| No Children | 11 (3.3%) | 0 (0.0%) |
| 1 or 2 Children | 0 (0.0%) | 0 (0.0%) |
| 3 or 4 Children | 0 (0.0%) | 0 (0.0%) |
| 5 or more Children | 0 (0.0%) | 0 (0.0%) |
| Total | 11 (3.0%) | 0 (0.0%) |
Race in Silverado Resort
The most populous races in Silverado Resort are White / Caucasian (769 | 76.0%), Two or more Races (177 | 17.5%), and Hispanic or Latino (150 | 14.8%).
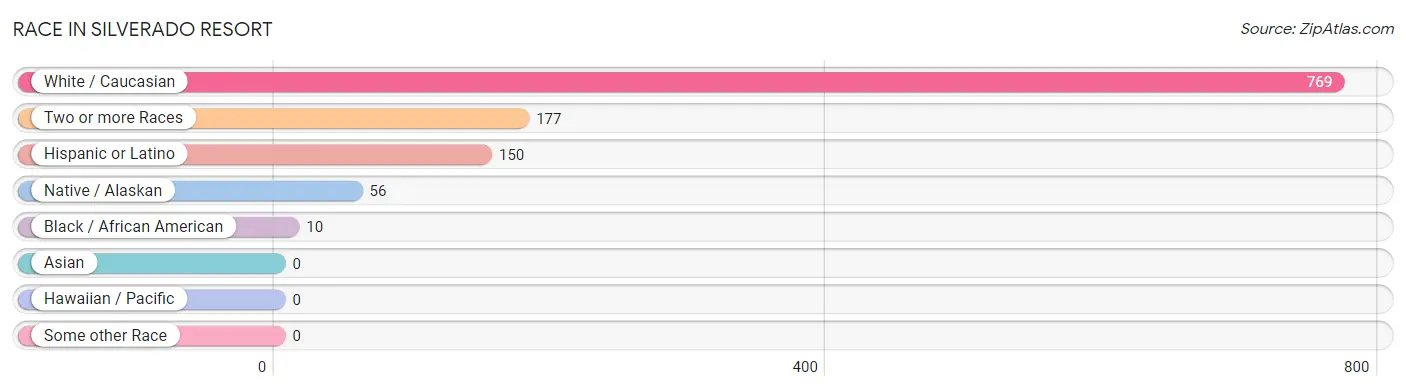
| Race | # Population | % Population |
| Asian | 0 | 0.0% |
| Black / African American | 10 | 1.0% |
| Hawaiian / Pacific | 0 | 0.0% |
| Hispanic or Latino | 150 | 14.8% |
| Native / Alaskan | 56 | 5.5% |
| White / Caucasian | 769 | 76.0% |
| Two or more Races | 177 | 17.5% |
| Some other Race | 0 | 0.0% |
| Total | 1,012 | 100.0% |
Ancestry in Silverado Resort
The most populous ancestries reported in Silverado Resort are English (190 | 18.8%), Irish (158 | 15.6%), Mexican (150 | 14.8%), Italian (135 | 13.3%), and German (123 | 12.1%), together accounting for 74.7% of all Silverado Resort residents.
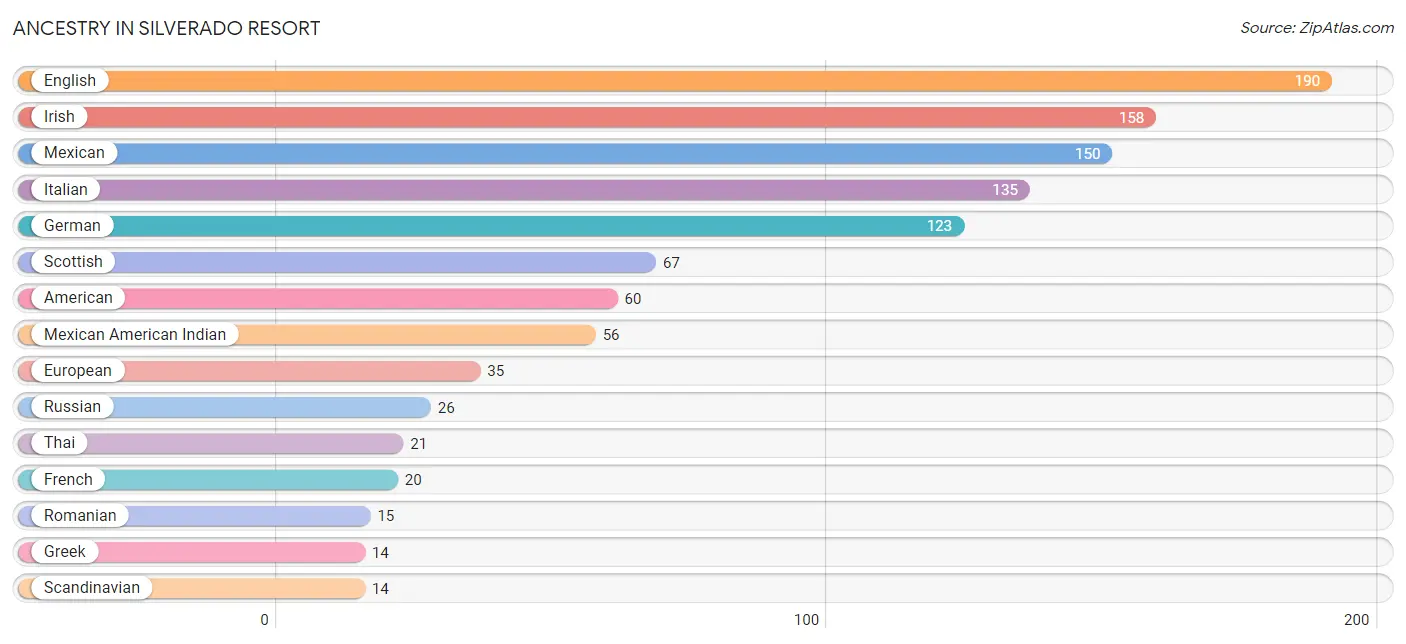
| Ancestry | # Population | % Population |
| American | 60 | 5.9% |
| Austrian | 10 | 1.0% |
| Canadian | 6 | 0.6% |
| Danish | 12 | 1.2% |
| Dutch | 11 | 1.1% |
| English | 190 | 18.8% |
| European | 35 | 3.5% |
| French | 20 | 2.0% |
| German | 123 | 12.1% |
| Greek | 14 | 1.4% |
| Irish | 158 | 15.6% |
| Italian | 135 | 13.3% |
| Mexican | 150 | 14.8% |
| Mexican American Indian | 56 | 5.5% |
| Portuguese | 11 | 1.1% |
| Romanian | 15 | 1.5% |
| Russian | 26 | 2.6% |
| Scandinavian | 14 | 1.4% |
| Scottish | 67 | 6.6% |
| Swedish | 9 | 0.9% |
| Thai | 21 | 2.1% |
| Welsh | 13 | 1.3% | View All 22 Rows |
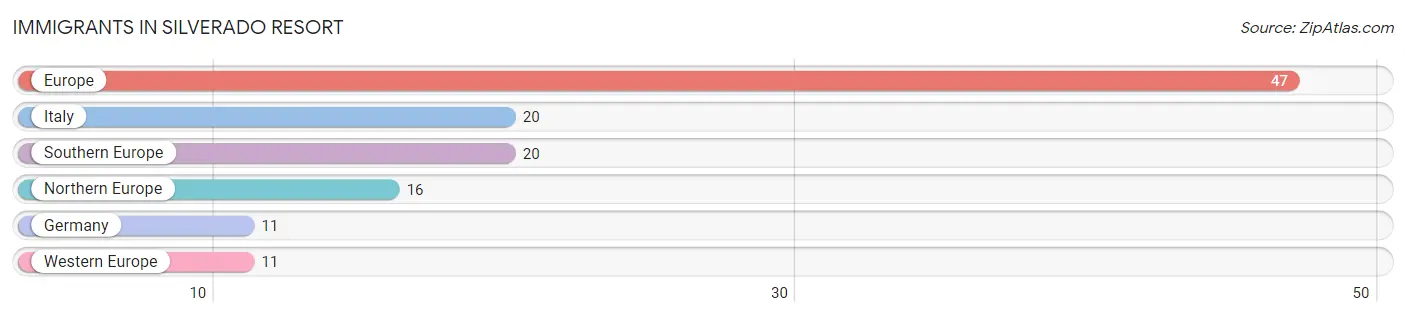
Immigrants in Silverado Resort
The most numerous immigrant groups reported in Silverado Resort came from Europe (47 | 4.6%), Italy (20 | 2.0%), Southern Europe (20 | 2.0%), Northern Europe (16 | 1.6%), and Germany (11 | 1.1%), together accounting for 11.3% of all Silverado Resort residents.
| Immigration Origin | # Population | % Population |
| Europe | 47 | 4.6% |
| Germany | 11 | 1.1% |
| Italy | 20 | 2.0% |
| Northern Europe | 16 | 1.6% |
| Southern Europe | 20 | 2.0% |
| Western Europe | 11 | 1.1% | View All 6 Rows |
Sex and Age in Silverado Resort
Sex and Age in Silverado Resort
The most populous age groups in Silverado Resort are 75 to 79 Years (108 | 20.6%) for men and 60 to 64 Years (100 | 20.4%) for women.
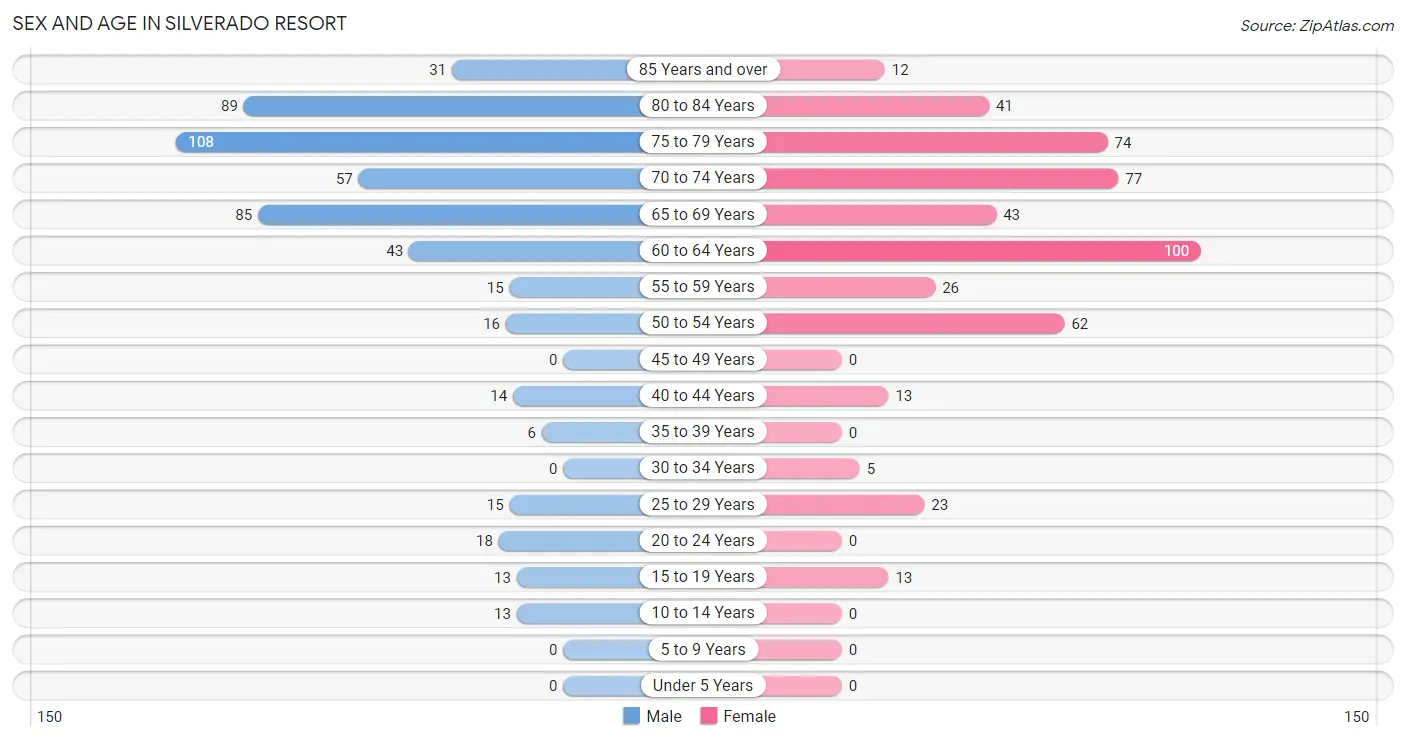
| Age Bracket | Male | Female |
| Under 5 Years | 0 (0.0%) | 0 (0.0%) |
| 5 to 9 Years | 0 (0.0%) | 0 (0.0%) |
| 10 to 14 Years | 13 (2.5%) | 0 (0.0%) |
| 15 to 19 Years | 13 (2.5%) | 13 (2.7%) |
| 20 to 24 Years | 18 (3.4%) | 0 (0.0%) |
| 25 to 29 Years | 15 (2.9%) | 23 (4.7%) |
| 30 to 34 Years | 0 (0.0%) | 5 (1.0%) |
| 35 to 39 Years | 6 (1.1%) | 0 (0.0%) |
| 40 to 44 Years | 14 (2.7%) | 13 (2.7%) |
| 45 to 49 Years | 0 (0.0%) | 0 (0.0%) |
| 50 to 54 Years | 16 (3.1%) | 62 (12.7%) |
| 55 to 59 Years | 15 (2.9%) | 26 (5.3%) |
| 60 to 64 Years | 43 (8.2%) | 100 (20.4%) |
| 65 to 69 Years | 85 (16.3%) | 43 (8.8%) |
| 70 to 74 Years | 57 (10.9%) | 77 (15.8%) |
| 75 to 79 Years | 108 (20.6%) | 74 (15.1%) |
| 80 to 84 Years | 89 (17.0%) | 41 (8.4%) |
| 85 Years and over | 31 (5.9%) | 12 (2.5%) |
| Total | 523 (100.0%) | 489 (100.0%) |
Families and Households in Silverado Resort
Median Family Size in Silverado Resort
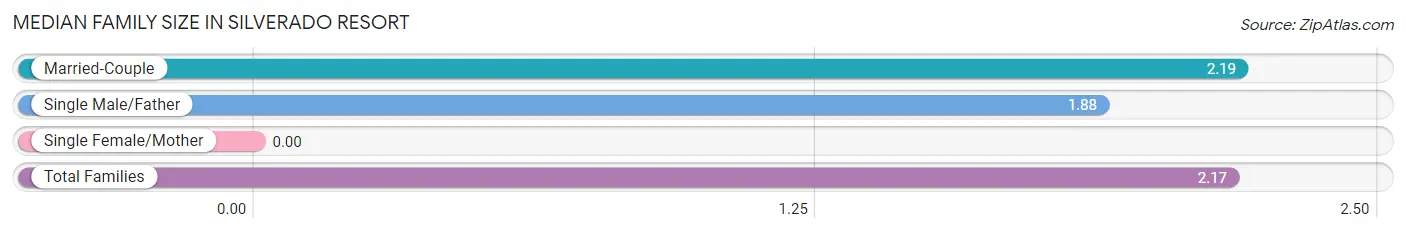
| Family Type | # Families | Family Size |
| Married-Couple | 364 (95.8%) | 2.19 |
| Single Male/Father | 16 (4.2%) | 1.88 |
| Single Female/Mother | 0 (0.0%) | - |
| Total Families | 380 (100.0%) | 2.17 |
Median Household Size in Silverado Resort
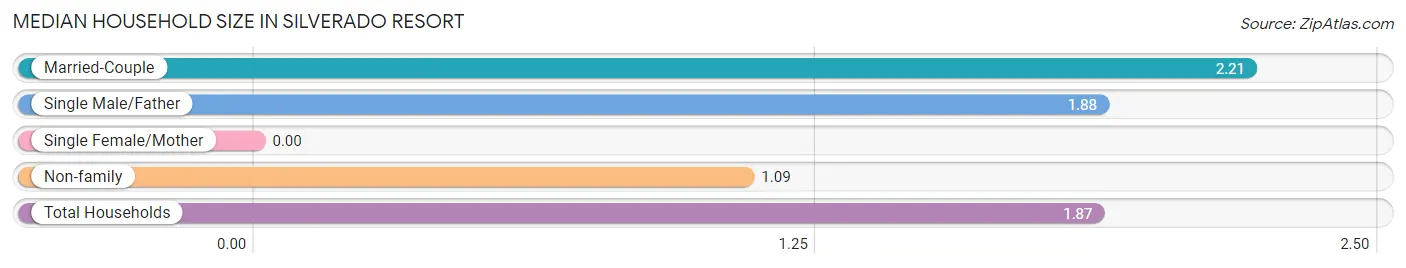
| Household Type | # Households | Household Size |
| Married-Couple | 364 (67.2%) | 2.21 |
| Single Male/Father | 16 (2.9%) | 1.88 |
| Single Female/Mother | 0 (0.0%) | - |
| Non-family | 162 (29.9%) | 1.09 |
| Total Households | 542 (100.0%) | 1.87 |
Household Size by Marriage Status in Silverado Resort
Out of a total of 542 households in Silverado Resort, 380 (70.1%) are family households, while 162 (29.9%) are nonfamily households. The most numerous type of family households are 2-person households, comprising 323, and the most common type of nonfamily households are 1-person households, comprising 149.
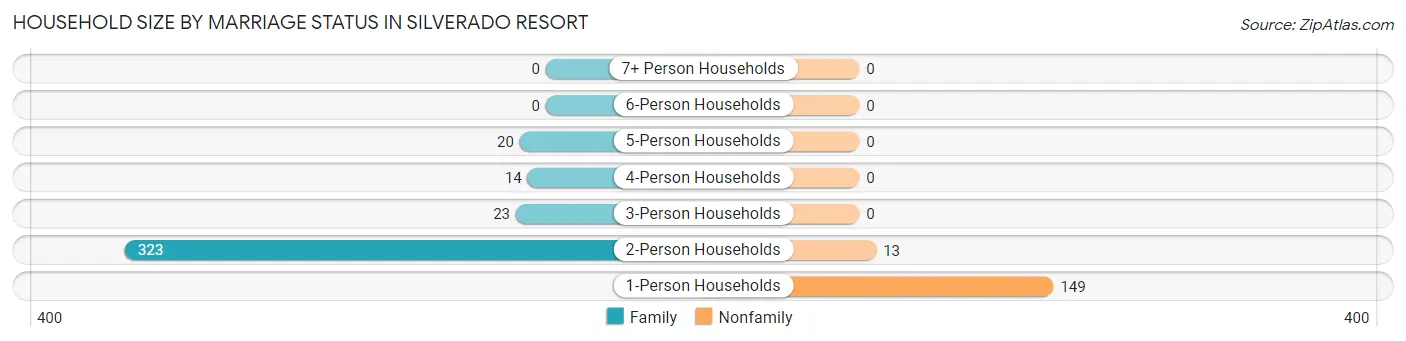
| Household Size | Family Households | Nonfamily Households |
| 1-Person Households | - | 149 (27.5%) |
| 2-Person Households | 323 (59.6%) | 13 (2.4%) |
| 3-Person Households | 23 (4.2%) | 0 (0.0%) |
| 4-Person Households | 14 (2.6%) | 0 (0.0%) |
| 5-Person Households | 20 (3.7%) | 0 (0.0%) |
| 6-Person Households | 0 (0.0%) | 0 (0.0%) |
| 7+ Person Households | 0 (0.0%) | 0 (0.0%) |
| Total | 380 (70.1%) | 162 (29.9%) |
Female Fertility in Silverado Resort
Fertility by Age in Silverado Resort
| Age Bracket | Women with Births | Births / 1,000 Women |
| 15 to 19 years | 0 (0.0%) | 0.0 |
| 20 to 34 years | 0 (0.0%) | 0.0 |
| 35 to 50 years | 0 (0.0%) | 0.0 |
| Total | 0 (0.0%) | 0.0 |
Fertility by Age by Marriage Status in Silverado Resort
| Age Bracket | Married | Unmarried |
| 15 to 19 years | 0 (0.0%) | 0 (0.0%) |
| 20 to 34 years | 0 (0.0%) | 0 (0.0%) |
| 35 to 50 years | 0 (0.0%) | 0 (0.0%) |
| Total | 0 (0.0%) | 0 (0.0%) |
Fertility by Education in Silverado Resort
| Educational Attainment | Women with Births | Births / 1,000 Women |
| Less than High School | 0 (0.0%) | 0.0 |
| High School Diploma | 0 (0.0%) | 0.0 |
| College or Associate's Degree | 0 (0.0%) | 0.0 |
| Bachelor's Degree | 0 (0.0%) | 0.0 |
| Graduate Degree | 0 (0.0%) | 0.0 |
| Total | 0 (0.0%) | 0.0 |
Fertility by Education by Marriage Status in Silverado Resort
| Educational Attainment | Married | Unmarried |
| Less than High School | 0 (0.0%) | 0 (0.0%) |
| High School Diploma | 0 (0.0%) | 0 (0.0%) |
| College or Associate's Degree | 0 (0.0%) | 0 (0.0%) |
| Bachelor's Degree | 0 (0.0%) | 0 (0.0%) |
| Graduate Degree | 0 (0.0%) | 0 (0.0%) |
| Total | 0 (0.0%) | 0 (0.0%) |
Employment Characteristics in Silverado Resort
Employment by Class of Employer in Silverado Resort
Among the 331 employed individuals in Silverado Resort, private company employees (138 | 41.7%), self-employed (not incorporated) (96 | 29.0%), and self-employed (incorporated) (41 | 12.4%) make up the most common classes of employment.
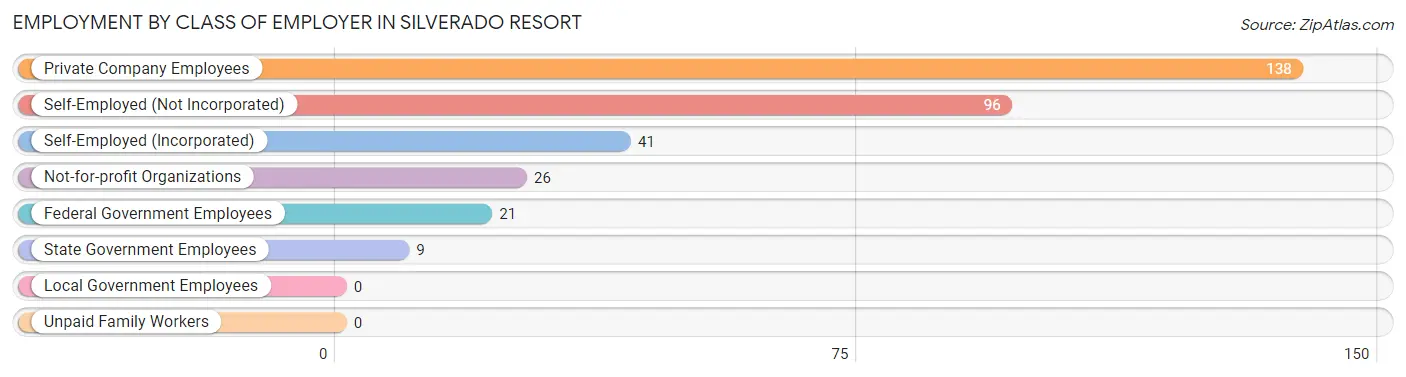
| Employer Class | # Employees | % Employees |
| Private Company Employees | 138 | 41.7% |
| Self-Employed (Incorporated) | 41 | 12.4% |
| Self-Employed (Not Incorporated) | 96 | 29.0% |
| Not-for-profit Organizations | 26 | 7.9% |
| Local Government Employees | 0 | 0.0% |
| State Government Employees | 9 | 2.7% |
| Federal Government Employees | 21 | 6.3% |
| Unpaid Family Workers | 0 | 0.0% |
| Total | 331 | 100.0% |
Employment Status by Age in Silverado Resort
According to the labor force statistics for Silverado Resort, out of the total population over 16 years of age (973), 35.9% or 349 individuals are in the labor force, with 5.2% or 18 of them unemployed. The age group with the highest labor force participation rate is 20 to 24 years, with 100.0% or 18 individuals in the labor force. Within the labor force, the 20 to 24 years age range has the highest percentage of unemployed individuals, with 100.0% or 18 of them being unemployed.
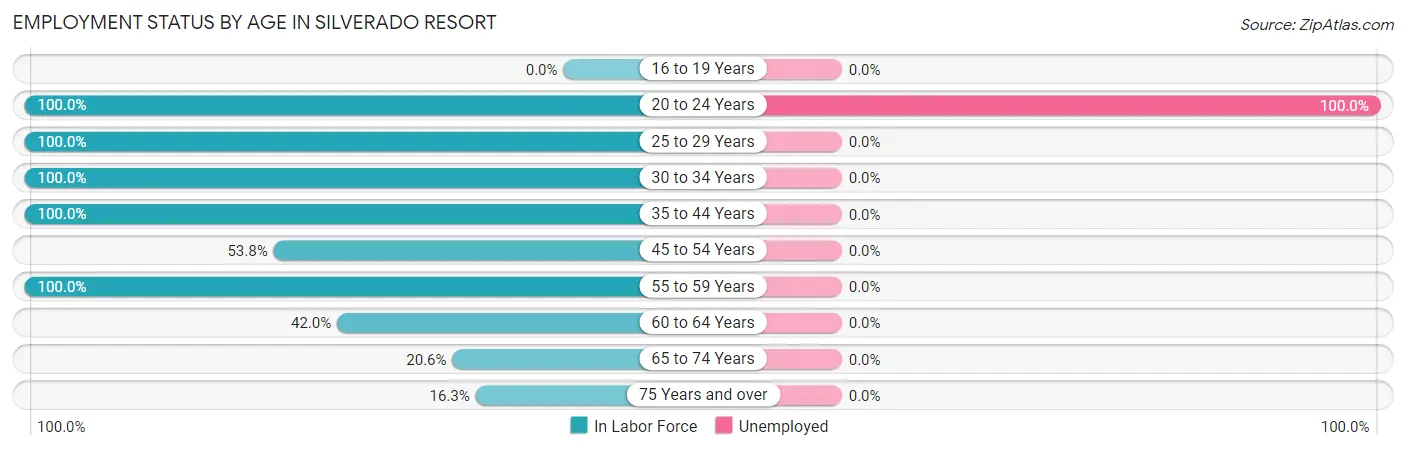
| Age Bracket | In Labor Force | Unemployed |
| 16 to 19 Years | 0 (0.0%) | 0 (0.0%) |
| 20 to 24 Years | 18 (100.0%) | 18 (100.0%) |
| 25 to 29 Years | 38 (100.0%) | 0 (0.0%) |
| 30 to 34 Years | 5 (100.0%) | 0 (0.0%) |
| 35 to 44 Years | 33 (100.0%) | 0 (0.0%) |
| 45 to 54 Years | 42 (53.8%) | 0 (0.0%) |
| 55 to 59 Years | 41 (100.0%) | 0 (0.0%) |
| 60 to 64 Years | 60 (42.0%) | 0 (0.0%) |
| 65 to 74 Years | 54 (20.6%) | 0 (0.0%) |
| 75 Years and over | 58 (16.3%) | 0 (0.0%) |
| Total | 349 (35.9%) | 18 (5.2%) |
Employment Status by Educational Attainment in Silverado Resort
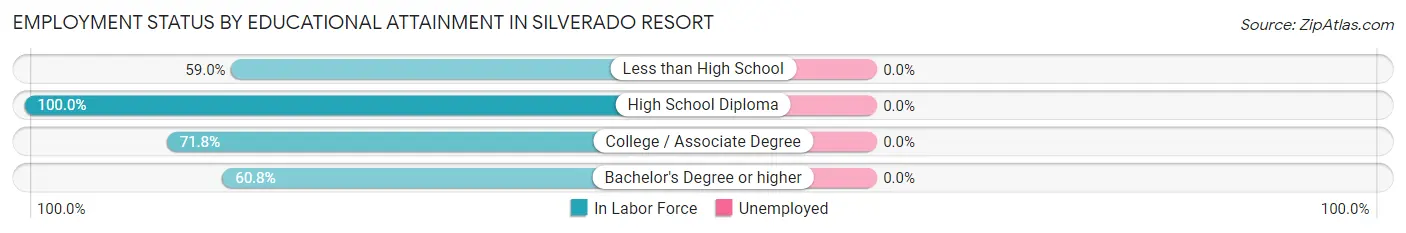
| Educational Attainment | In Labor Force | Unemployed |
| Less than High School | 23 (59.0%) | 0 (0.0%) |
| High School Diploma | 16 (100.0%) | 0 (0.0%) |
| College / Associate Degree | 51 (71.8%) | 0 (0.0%) |
| Bachelor's Degree or higher | 129 (60.8%) | 0 (0.0%) |
| Total | 219 (64.8%) | 0 (0.0%) |
Employment Occupations by Sex in Silverado Resort
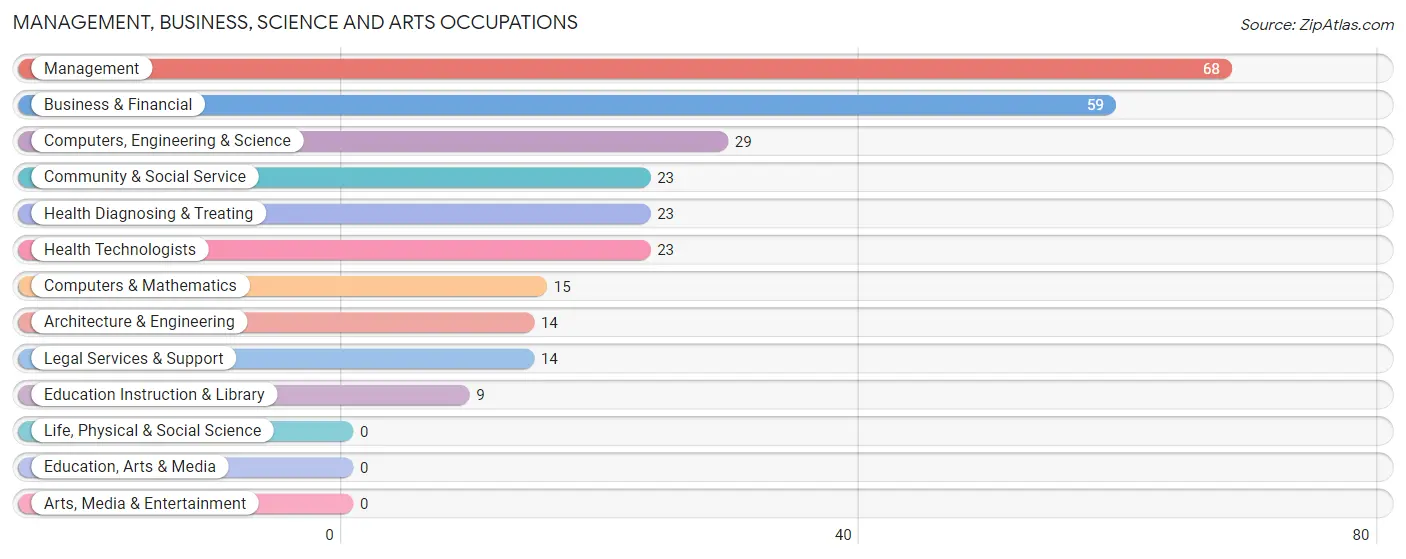
Management, Business, Science and Arts Occupations
The most common Management, Business, Science and Arts occupations in Silverado Resort are Management (68 | 20.5%), Business & Financial (59 | 17.8%), Computers, Engineering & Science (29 | 8.8%), Community & Social Service (23 | 7.0%), and Health Diagnosing & Treating (23 | 7.0%).
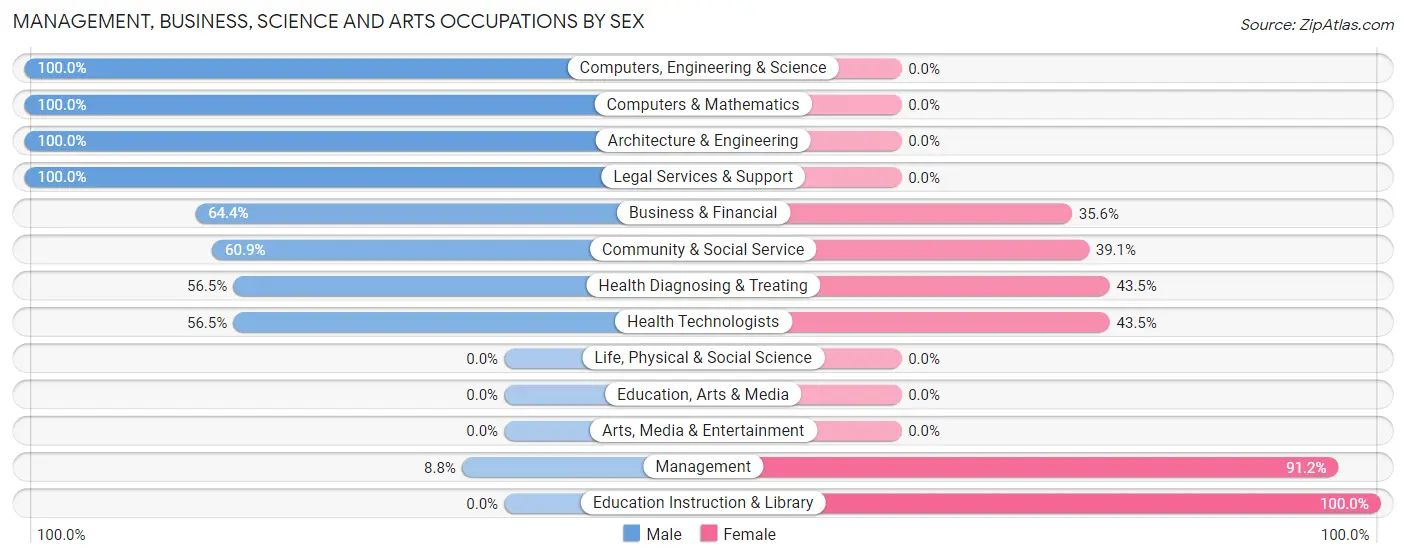
Management, Business, Science and Arts Occupations by Sex
Within the Management, Business, Science and Arts occupations in Silverado Resort, the most male-oriented occupations are Computers, Engineering & Science (100.0%), Computers & Mathematics (100.0%), and Architecture & Engineering (100.0%), while the most female-oriented occupations are Education Instruction & Library (100.0%), Management (91.2%), and Health Diagnosing & Treating (43.5%).
| Occupation | Male | Female |
| Management | 6 (8.8%) | 62 (91.2%) |
| Business & Financial | 38 (64.4%) | 21 (35.6%) |
| Computers, Engineering & Science | 29 (100.0%) | 0 (0.0%) |
| Computers & Mathematics | 15 (100.0%) | 0 (0.0%) |
| Architecture & Engineering | 14 (100.0%) | 0 (0.0%) |
| Life, Physical & Social Science | 0 (0.0%) | 0 (0.0%) |
| Community & Social Service | 14 (60.9%) | 9 (39.1%) |
| Education, Arts & Media | 0 (0.0%) | 0 (0.0%) |
| Legal Services & Support | 14 (100.0%) | 0 (0.0%) |
| Education Instruction & Library | 0 (0.0%) | 9 (100.0%) |
| Arts, Media & Entertainment | 0 (0.0%) | 0 (0.0%) |
| Health Diagnosing & Treating | 13 (56.5%) | 10 (43.5%) |
| Health Technologists | 13 (56.5%) | 10 (43.5%) |
| Total (Category) | 100 (49.5%) | 102 (50.5%) |
| Total (Overall) | 162 (48.9%) | 169 (51.1%) |
Services Occupations
Services Occupations by Sex
| Occupation | Male | Female |
| Healthcare Support | 0 (0.0%) | 0 (0.0%) |
| Security & Protection | 0 (0.0%) | 0 (0.0%) |
| Firefighting & Prevention | 0 (0.0%) | 0 (0.0%) |
| Law Enforcement | 0 (0.0%) | 0 (0.0%) |
| Food Preparation & Serving | 0 (0.0%) | 0 (0.0%) |
| Cleaning & Maintenance | 0 (0.0%) | 0 (0.0%) |
| Personal Care & Service | 0 (0.0%) | 0 (0.0%) |
| Total (Category) | 0 (0.0%) | 0 (0.0%) |
| Total (Overall) | 162 (48.9%) | 169 (51.1%) |
Sales and Office Occupations
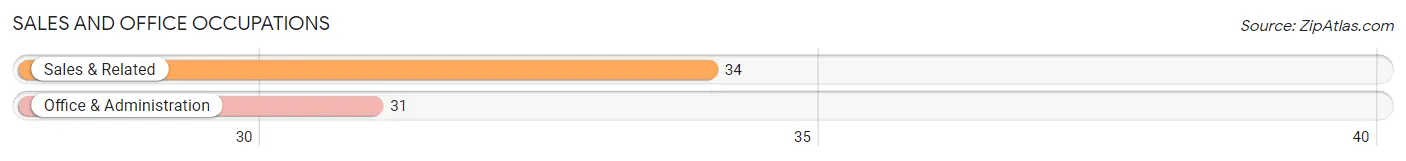
The most common Sales and Office occupations in Silverado Resort are Sales & Related (34 | 10.3%), and Office & Administration (31 | 9.4%).
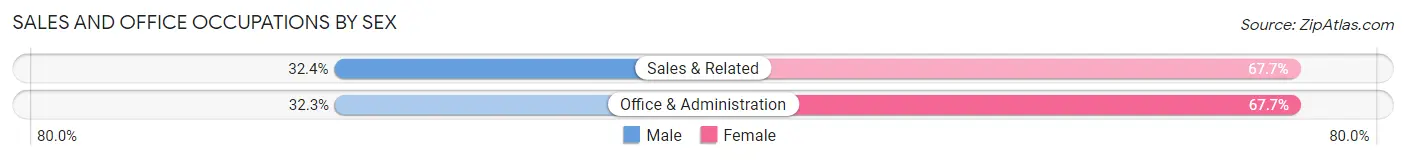
Sales and Office Occupations by Sex
| Occupation | Male | Female |
| Sales & Related | 11 (32.4%) | 23 (67.6%) |
| Office & Administration | 10 (32.3%) | 21 (67.7%) |
| Total (Category) | 21 (32.3%) | 44 (67.7%) |
| Total (Overall) | 162 (48.9%) | 169 (51.1%) |
Natural Resources, Construction and Maintenance Occupations
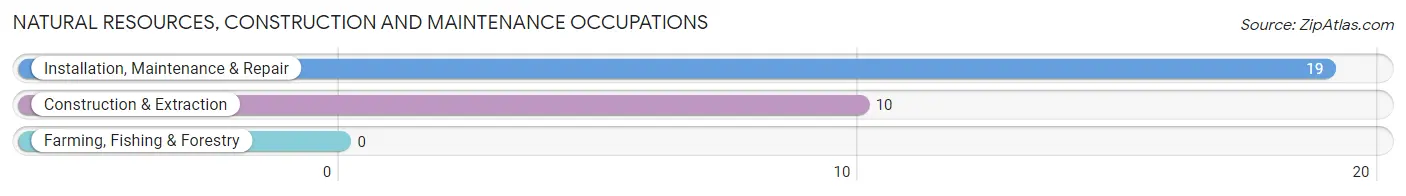
The most common Natural Resources, Construction and Maintenance occupations in Silverado Resort are Installation, Maintenance & Repair (19 | 5.7%), and Construction & Extraction (10 | 3.0%).
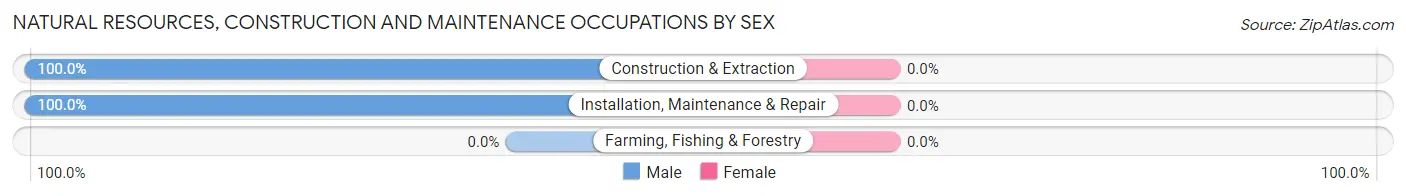
Natural Resources, Construction and Maintenance Occupations by Sex
| Occupation | Male | Female |
| Farming, Fishing & Forestry | 0 (0.0%) | 0 (0.0%) |
| Construction & Extraction | 10 (100.0%) | 0 (0.0%) |
| Installation, Maintenance & Repair | 19 (100.0%) | 0 (0.0%) |
| Total (Category) | 29 (100.0%) | 0 (0.0%) |
| Total (Overall) | 162 (48.9%) | 169 (51.1%) |
Production, Transportation and Moving Occupations
The most common Production, Transportation and Moving occupations in Silverado Resort are , and Production (35 | 10.6%).
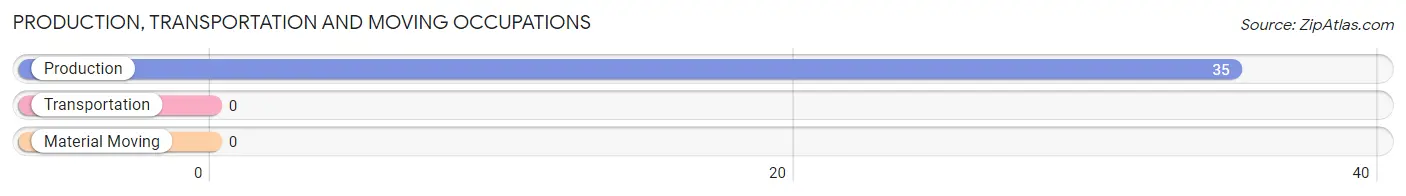
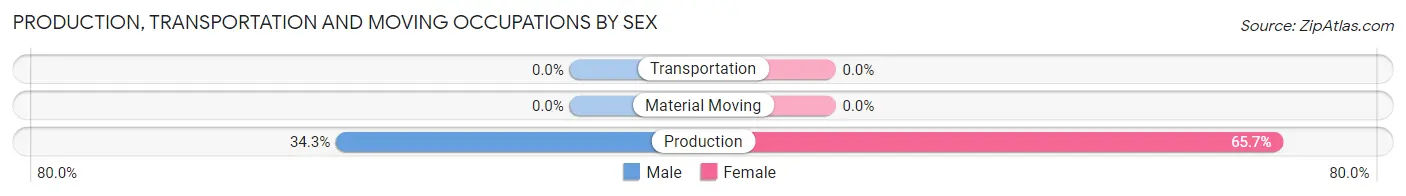
Production, Transportation and Moving Occupations by Sex
| Occupation | Male | Female |
| Production | 12 (34.3%) | 23 (65.7%) |
| Transportation | 0 (0.0%) | 0 (0.0%) |
| Material Moving | 0 (0.0%) | 0 (0.0%) |
| Total (Category) | 12 (34.3%) | 23 (65.7%) |
| Total (Overall) | 162 (48.9%) | 169 (51.1%) |
Employment Industries by Sex in Silverado Resort
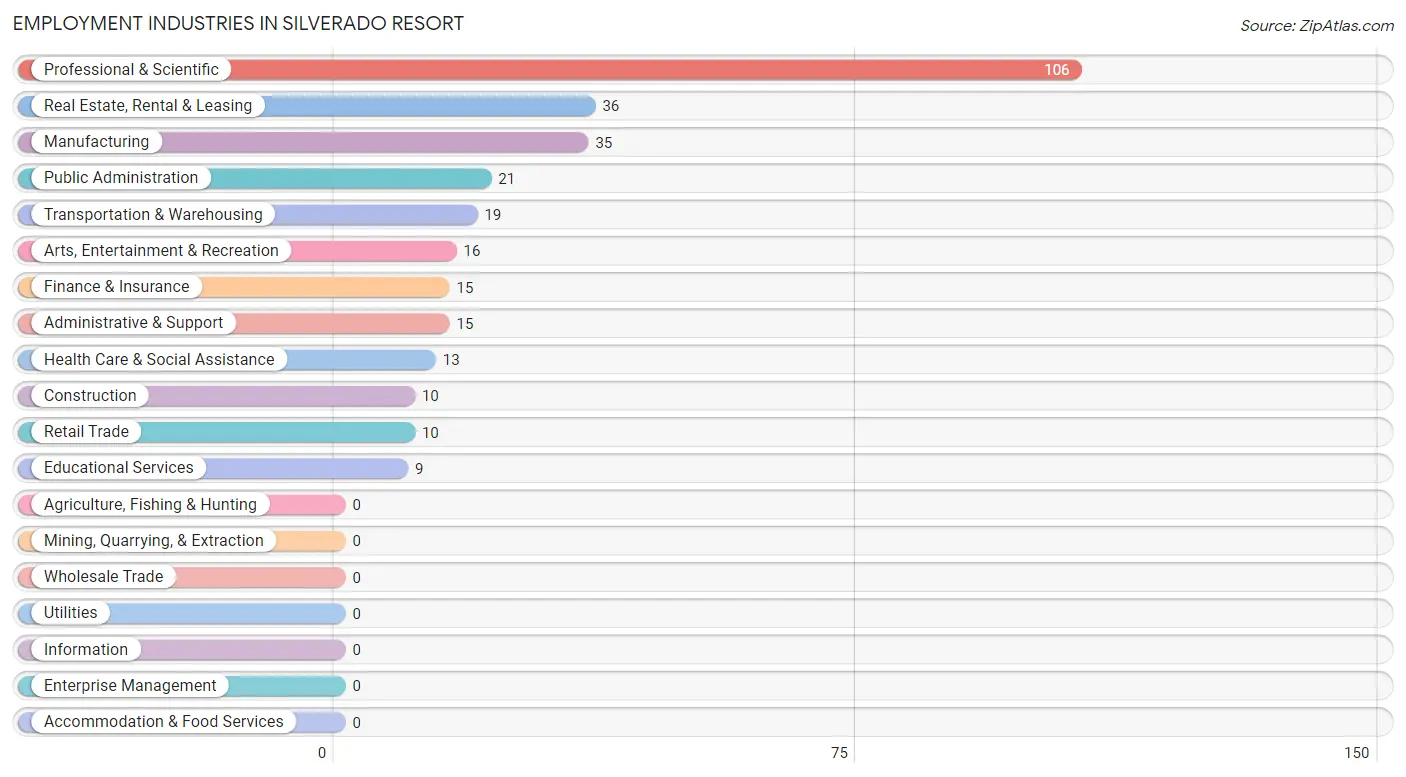
Employment Industries in Silverado Resort
The major employment industries in Silverado Resort include Professional & Scientific (106 | 32.0%), Real Estate, Rental & Leasing (36 | 10.9%), Manufacturing (35 | 10.6%), Public Administration (21 | 6.3%), and Transportation & Warehousing (19 | 5.7%).
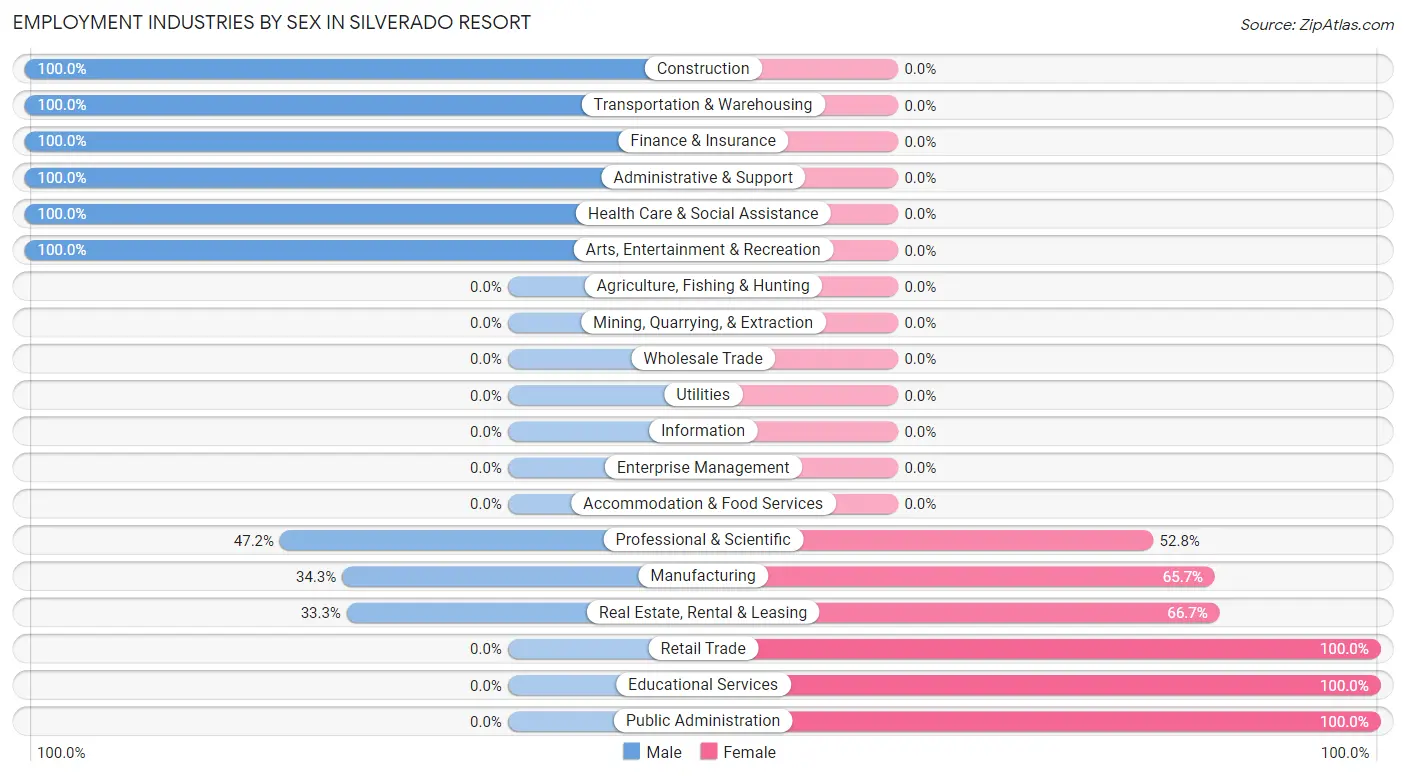
Employment Industries by Sex in Silverado Resort
The Silverado Resort industries that see more men than women are Construction (100.0%), Transportation & Warehousing (100.0%), and Finance & Insurance (100.0%), whereas the industries that tend to have a higher number of women are Retail Trade (100.0%), Educational Services (100.0%), and Public Administration (100.0%).
| Industry | Male | Female |
| Agriculture, Fishing & Hunting | 0 (0.0%) | 0 (0.0%) |
| Mining, Quarrying, & Extraction | 0 (0.0%) | 0 (0.0%) |
| Construction | 10 (100.0%) | 0 (0.0%) |
| Manufacturing | 12 (34.3%) | 23 (65.7%) |
| Wholesale Trade | 0 (0.0%) | 0 (0.0%) |
| Retail Trade | 0 (0.0%) | 10 (100.0%) |
| Transportation & Warehousing | 19 (100.0%) | 0 (0.0%) |
| Utilities | 0 (0.0%) | 0 (0.0%) |
| Information | 0 (0.0%) | 0 (0.0%) |
| Finance & Insurance | 15 (100.0%) | 0 (0.0%) |
| Real Estate, Rental & Leasing | 12 (33.3%) | 24 (66.7%) |
| Professional & Scientific | 50 (47.2%) | 56 (52.8%) |
| Enterprise Management | 0 (0.0%) | 0 (0.0%) |
| Administrative & Support | 15 (100.0%) | 0 (0.0%) |
| Educational Services | 0 (0.0%) | 9 (100.0%) |
| Health Care & Social Assistance | 13 (100.0%) | 0 (0.0%) |
| Arts, Entertainment & Recreation | 16 (100.0%) | 0 (0.0%) |
| Accommodation & Food Services | 0 (0.0%) | 0 (0.0%) |
| Public Administration | 0 (0.0%) | 21 (100.0%) |
| Total | 162 (48.9%) | 169 (51.1%) |
Education in Silverado Resort
School Enrollment in Silverado Resort
The most common levels of schooling among the 54 students in Silverado Resort are high school (26 | 48.1%), college / undergraduate (15 | 27.8%), and middle school (13 | 24.1%).
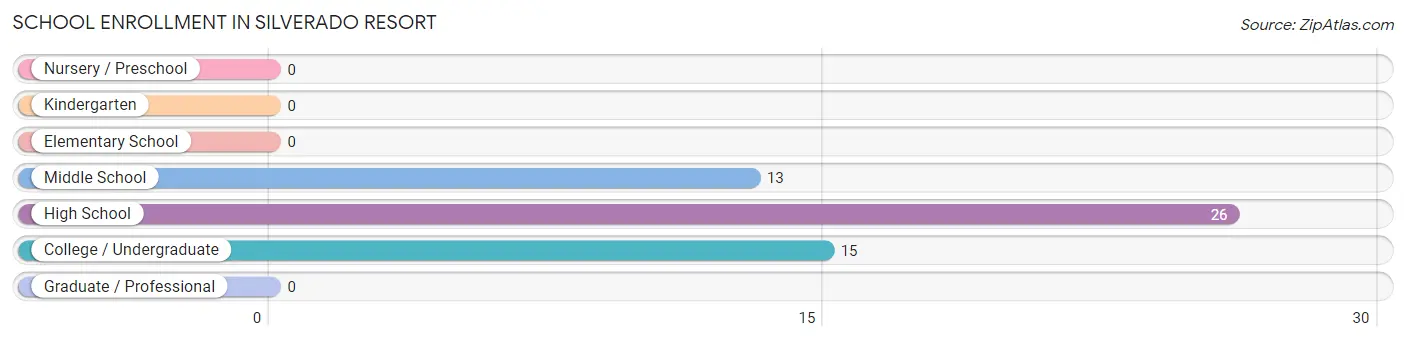
| School Level | # Students | % Students |
| Nursery / Preschool | 0 | 0.0% |
| Kindergarten | 0 | 0.0% |
| Elementary School | 0 | 0.0% |
| Middle School | 13 | 24.1% |
| High School | 26 | 48.1% |
| College / Undergraduate | 15 | 27.8% |
| Graduate / Professional | 0 | 0.0% |
| Total | 54 | 100.0% |
School Enrollment by Age by Funding Source in Silverado Resort
Out of a total of 54 students who are enrolled in schools in Silverado Resort, 26 (48.1%) attend a private institution, while the remaining 28 (51.9%) are enrolled in public schools. The age group of 10 to 14 year olds has the highest likelihood of being enrolled in private schools, with 13 (100.0% in the age bracket) enrolled. Conversely, the age group of 25 to 34 year olds has the lowest likelihood of being enrolled in a private school, with 15 (100.0% in the age bracket) attending a public institution.
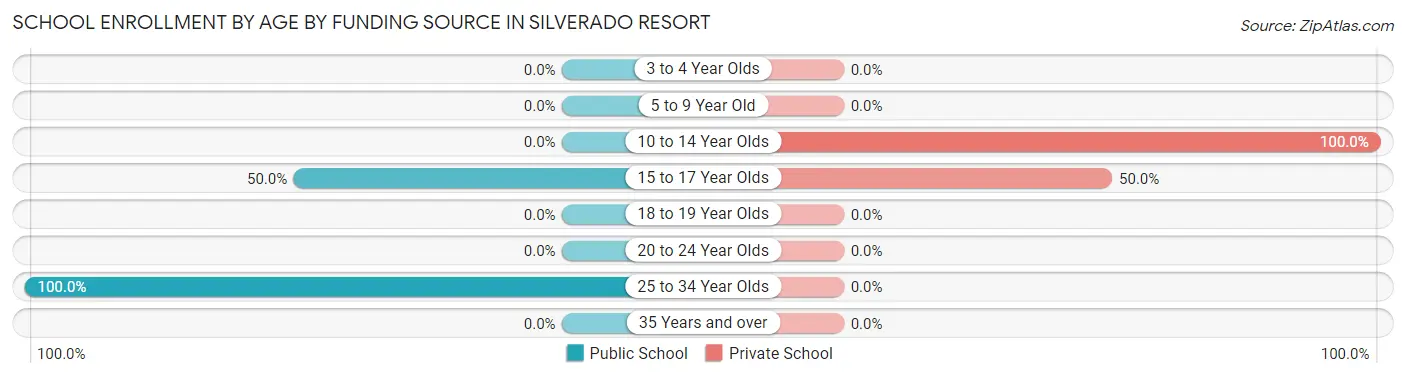
| Age Bracket | Public School | Private School |
| 3 to 4 Year Olds | 0 (0.0%) | 0 (0.0%) |
| 5 to 9 Year Old | 0 (0.0%) | 0 (0.0%) |
| 10 to 14 Year Olds | 0 (0.0%) | 13 (100.0%) |
| 15 to 17 Year Olds | 13 (50.0%) | 13 (50.0%) |
| 18 to 19 Year Olds | 0 (0.0%) | 0 (0.0%) |
| 20 to 24 Year Olds | 0 (0.0%) | 0 (0.0%) |
| 25 to 34 Year Olds | 15 (100.0%) | 0 (0.0%) |
| 35 Years and over | 0 (0.0%) | 0 (0.0%) |
| Total | 28 (51.9%) | 26 (48.1%) |
Educational Attainment by Field of Study in Silverado Resort
Social sciences (107 | 16.0%), education (105 | 15.7%), literature & languages (74 | 11.0%), engineering (66 | 9.9%), and liberal arts & history (51 | 7.6%) are the most common fields of study among 670 individuals in Silverado Resort who have obtained a bachelor's degree or higher.
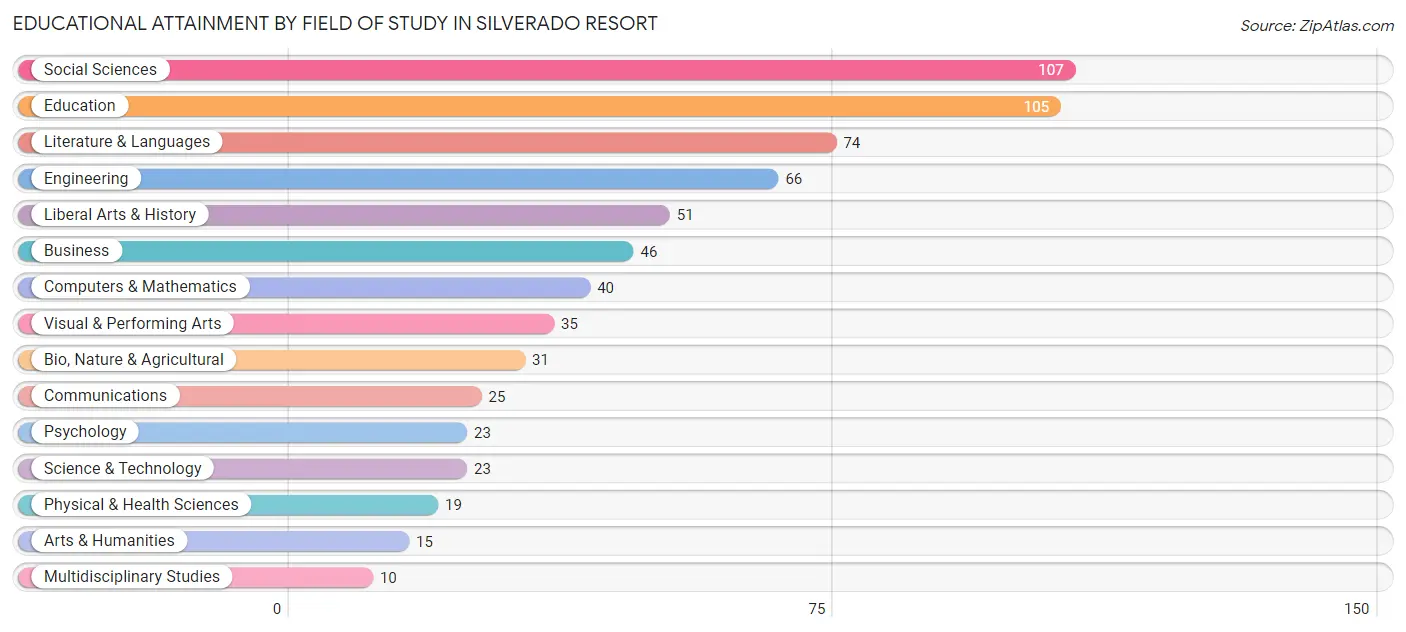
| Field of Study | # Graduates | % Graduates |
| Computers & Mathematics | 40 | 6.0% |
| Bio, Nature & Agricultural | 31 | 4.6% |
| Physical & Health Sciences | 19 | 2.8% |
| Psychology | 23 | 3.4% |
| Social Sciences | 107 | 16.0% |
| Engineering | 66 | 9.9% |
| Multidisciplinary Studies | 10 | 1.5% |
| Science & Technology | 23 | 3.4% |
| Business | 46 | 6.9% |
| Education | 105 | 15.7% |
| Literature & Languages | 74 | 11.0% |
| Liberal Arts & History | 51 | 7.6% |
| Visual & Performing Arts | 35 | 5.2% |
| Communications | 25 | 3.7% |
| Arts & Humanities | 15 | 2.2% |
| Total | 670 | 100.0% |
Transportation & Commute in Silverado Resort
Vehicle Availability by Sex in Silverado Resort
The most prevalent vehicle ownership categories in Silverado Resort are males with 2 vehicles (97, accounting for 59.9%) and females with 2 vehicles (44, making up 57.4%).
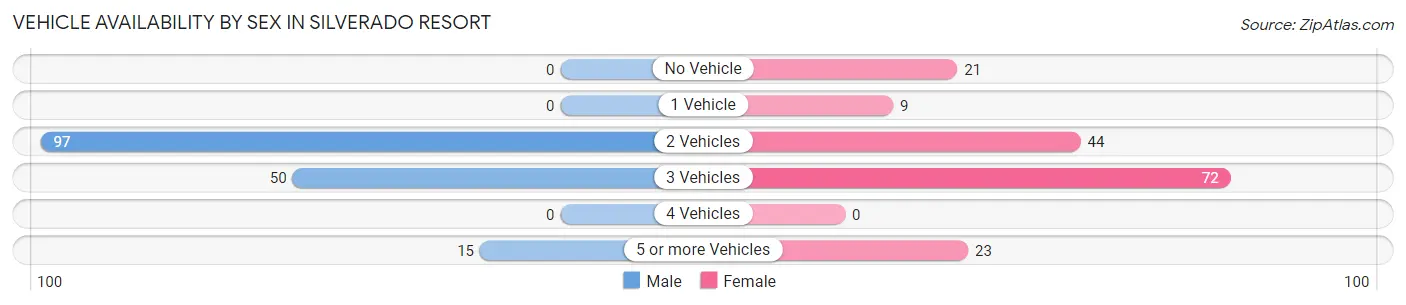
| Vehicles Available | Male | Female |
| No Vehicle | 0 (0.0%) | 21 (12.4%) |
| 1 Vehicle | 0 (0.0%) | 9 (5.3%) |
| 2 Vehicles | 97 (59.9%) | 44 (26.0%) |
| 3 Vehicles | 50 (30.9%) | 72 (42.6%) |
| 4 Vehicles | 0 (0.0%) | 0 (0.0%) |
| 5 or more Vehicles | 15 (9.3%) | 23 (13.6%) |
| Total | 162 (100.0%) | 169 (100.0%) |
Commute Time in Silverado Resort
The most frequently occuring commute durations in Silverado Resort are 90 or more minutes (33 commuters, 16.5%), 15 to 19 minutes (30 commuters, 15.0%), and 30 to 34 minutes (30 commuters, 15.0%).
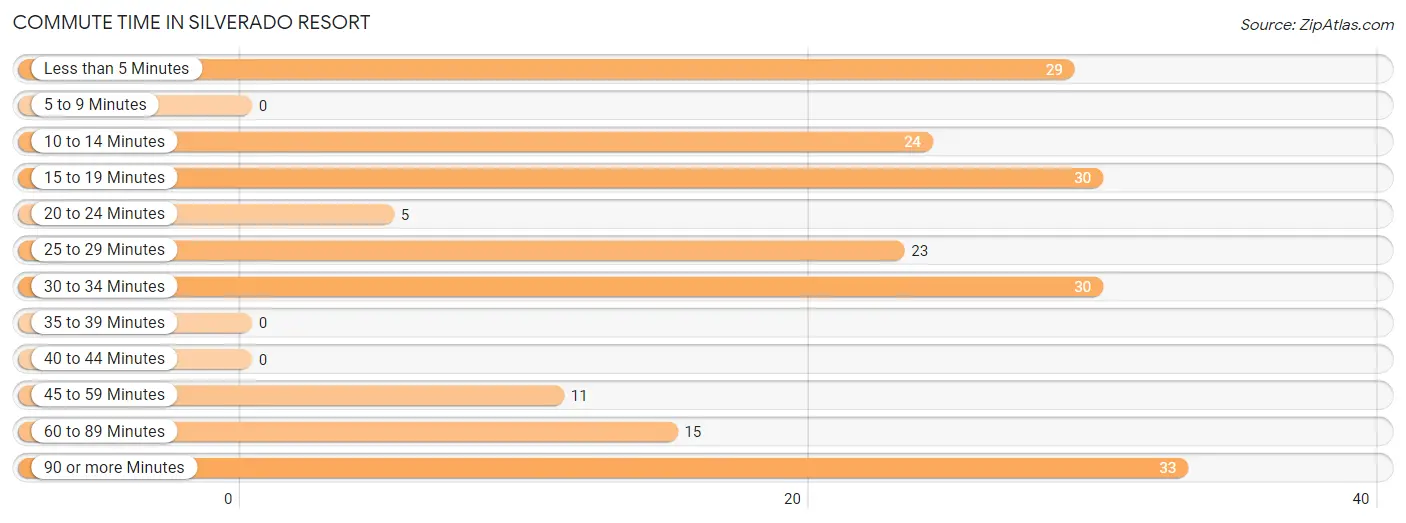
| Commute Time | # Commuters | % Commuters |
| Less than 5 Minutes | 29 | 14.5% |
| 5 to 9 Minutes | 0 | 0.0% |
| 10 to 14 Minutes | 24 | 12.0% |
| 15 to 19 Minutes | 30 | 15.0% |
| 20 to 24 Minutes | 5 | 2.5% |
| 25 to 29 Minutes | 23 | 11.5% |
| 30 to 34 Minutes | 30 | 15.0% |
| 35 to 39 Minutes | 0 | 0.0% |
| 40 to 44 Minutes | 0 | 0.0% |
| 45 to 59 Minutes | 11 | 5.5% |
| 60 to 89 Minutes | 15 | 7.5% |
| 90 or more Minutes | 33 | 16.5% |
Commute Time by Sex in Silverado Resort
The most common commute times in Silverado Resort are 10 to 14 minutes (24 commuters, 35.8%) for males and 30 to 34 minutes (30 commuters, 22.6%) for females.
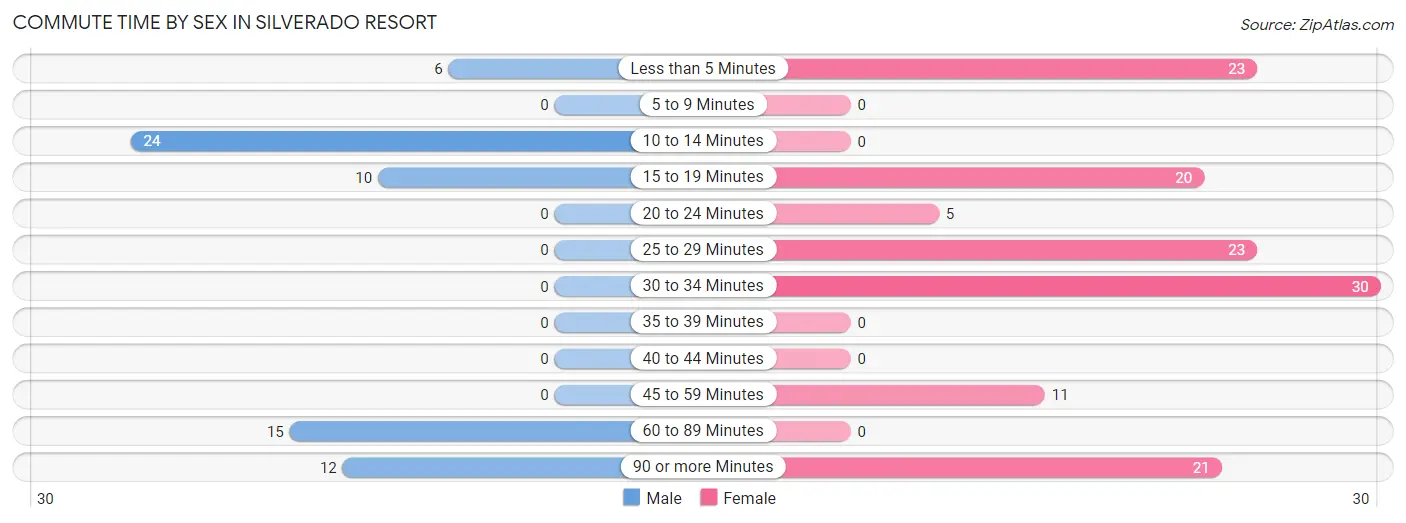
| Commute Time | Male | Female |
| Less than 5 Minutes | 6 (9.0%) | 23 (17.3%) |
| 5 to 9 Minutes | 0 (0.0%) | 0 (0.0%) |
| 10 to 14 Minutes | 24 (35.8%) | 0 (0.0%) |
| 15 to 19 Minutes | 10 (14.9%) | 20 (15.0%) |
| 20 to 24 Minutes | 0 (0.0%) | 5 (3.8%) |
| 25 to 29 Minutes | 0 (0.0%) | 23 (17.3%) |
| 30 to 34 Minutes | 0 (0.0%) | 30 (22.6%) |
| 35 to 39 Minutes | 0 (0.0%) | 0 (0.0%) |
| 40 to 44 Minutes | 0 (0.0%) | 0 (0.0%) |
| 45 to 59 Minutes | 0 (0.0%) | 11 (8.3%) |
| 60 to 89 Minutes | 15 (22.4%) | 0 (0.0%) |
| 90 or more Minutes | 12 (17.9%) | 21 (15.8%) |
Time of Departure to Work by Sex in Silverado Resort
The most frequent times of departure to work in Silverado Resort are 8:00 AM to 8:29 AM (30, 44.8%) for males and 9:00 AM to 9:59 AM (33, 24.8%) for females.
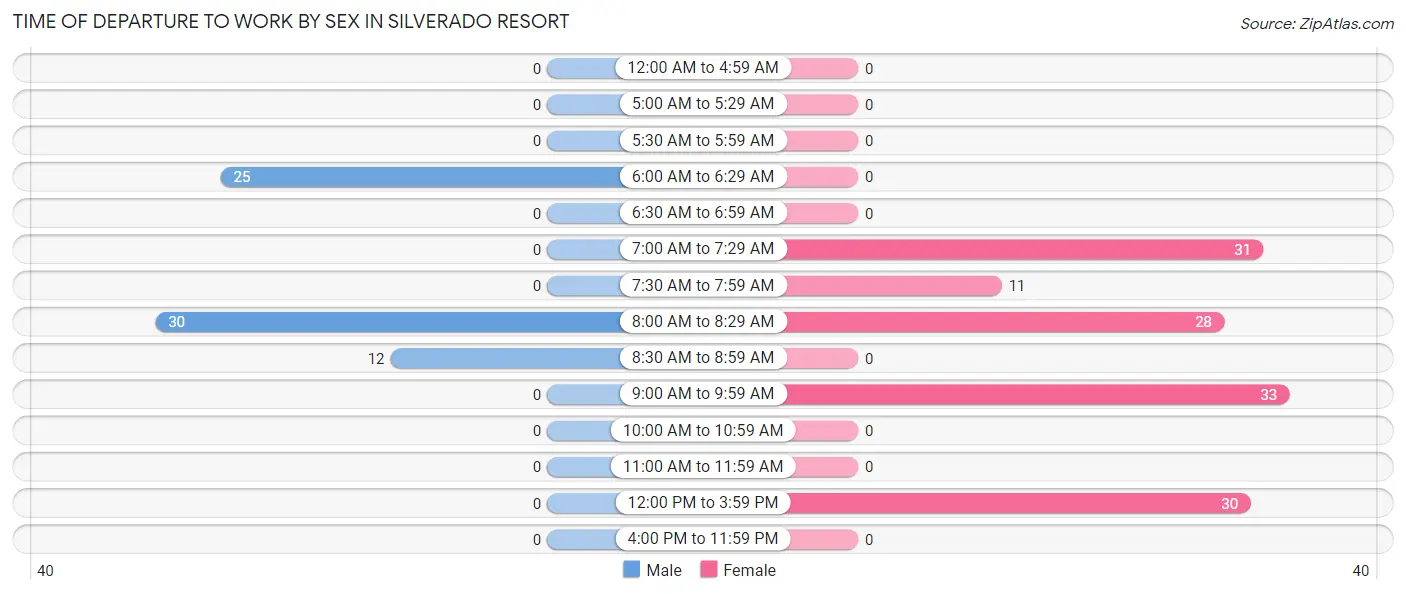
| Time of Departure | Male | Female |
| 12:00 AM to 4:59 AM | 0 (0.0%) | 0 (0.0%) |
| 5:00 AM to 5:29 AM | 0 (0.0%) | 0 (0.0%) |
| 5:30 AM to 5:59 AM | 0 (0.0%) | 0 (0.0%) |
| 6:00 AM to 6:29 AM | 25 (37.3%) | 0 (0.0%) |
| 6:30 AM to 6:59 AM | 0 (0.0%) | 0 (0.0%) |
| 7:00 AM to 7:29 AM | 0 (0.0%) | 31 (23.3%) |
| 7:30 AM to 7:59 AM | 0 (0.0%) | 11 (8.3%) |
| 8:00 AM to 8:29 AM | 30 (44.8%) | 28 (21.0%) |
| 8:30 AM to 8:59 AM | 12 (17.9%) | 0 (0.0%) |
| 9:00 AM to 9:59 AM | 0 (0.0%) | 33 (24.8%) |
| 10:00 AM to 10:59 AM | 0 (0.0%) | 0 (0.0%) |
| 11:00 AM to 11:59 AM | 0 (0.0%) | 0 (0.0%) |
| 12:00 PM to 3:59 PM | 0 (0.0%) | 30 (22.6%) |
| 4:00 PM to 11:59 PM | 0 (0.0%) | 0 (0.0%) |
| Total | 67 (100.0%) | 133 (100.0%) |
Housing Occupancy in Silverado Resort
Occupancy by Ownership in Silverado Resort
Of the total 542 dwellings in Silverado Resort, owner-occupied units account for 425 (78.4%), while renter-occupied units make up 117 (21.6%).
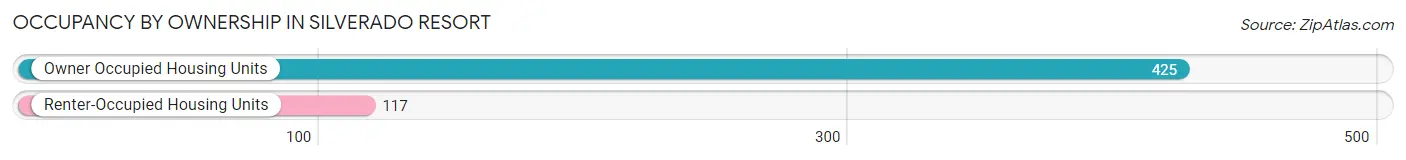
| Occupancy | # Housing Units | % Housing Units |
| Owner Occupied Housing Units | 425 | 78.4% |
| Renter-Occupied Housing Units | 117 | 21.6% |
| Total Occupied Housing Units | 542 | 100.0% |
Occupancy by Household Size in Silverado Resort
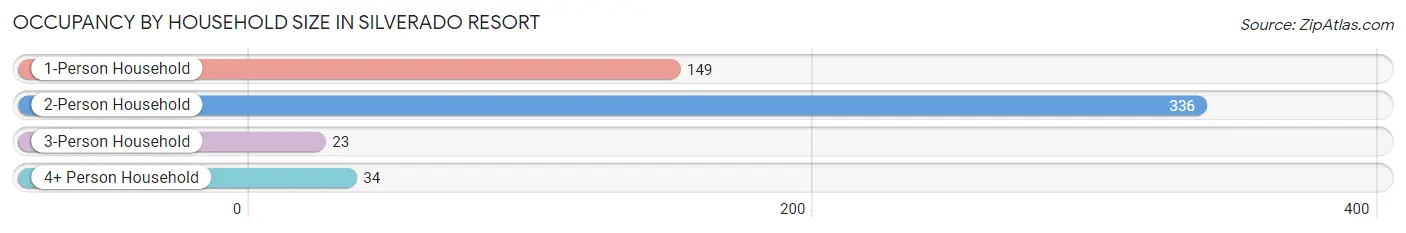
| Household Size | # Housing Units | % Housing Units |
| 1-Person Household | 149 | 27.5% |
| 2-Person Household | 336 | 62.0% |
| 3-Person Household | 23 | 4.2% |
| 4+ Person Household | 34 | 6.3% |
| Total Housing Units | 542 | 100.0% |
Occupancy by Ownership by Household Size in Silverado Resort
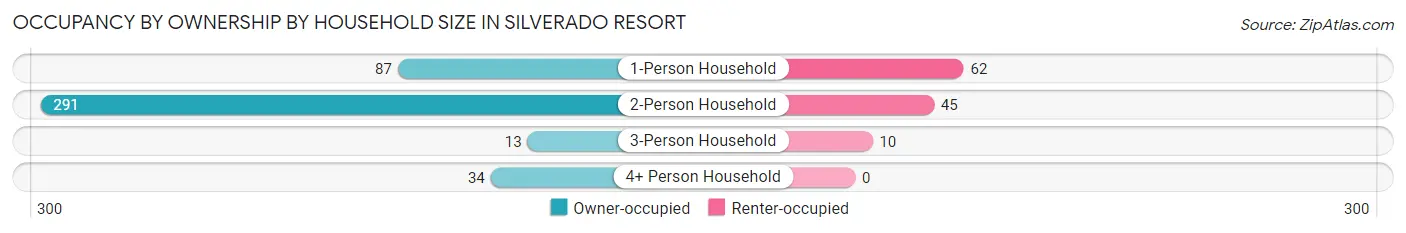
| Household Size | Owner-occupied | Renter-occupied |
| 1-Person Household | 87 (58.4%) | 62 (41.6%) |
| 2-Person Household | 291 (86.6%) | 45 (13.4%) |
| 3-Person Household | 13 (56.5%) | 10 (43.5%) |
| 4+ Person Household | 34 (100.0%) | 0 (0.0%) |
| Total Housing Units | 425 (78.4%) | 117 (21.6%) |
Occupancy by Educational Attainment in Silverado Resort
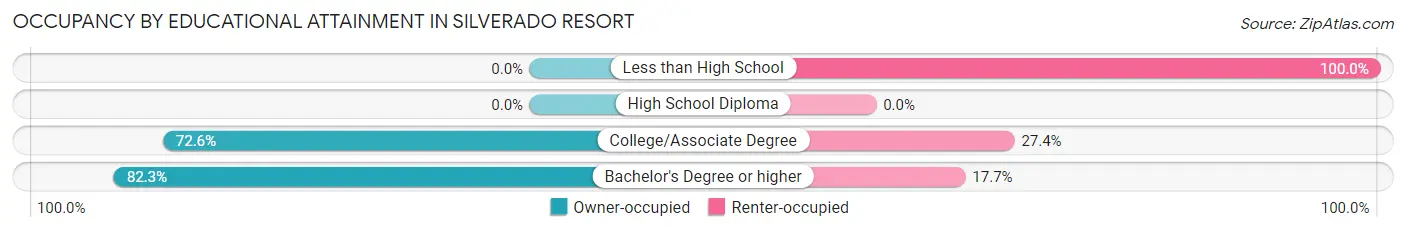
| Household Size | Owner-occupied | Renter-occupied |
| Less than High School | 0 (0.0%) | 11 (100.0%) |
| High School Diploma | 0 (0.0%) | 0 (0.0%) |
| College/Associate Degree | 90 (72.6%) | 34 (27.4%) |
| Bachelor's Degree or higher | 335 (82.3%) | 72 (17.7%) |
Occupancy by Age of Householder in Silverado Resort
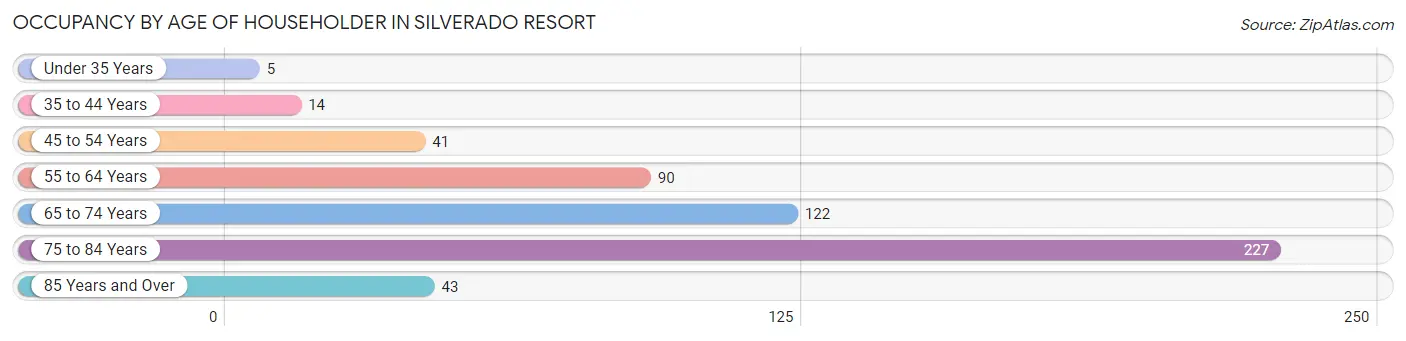
| Age Bracket | # Households | % Households |
| Under 35 Years | 5 | 0.9% |
| 35 to 44 Years | 14 | 2.6% |
| 45 to 54 Years | 41 | 7.6% |
| 55 to 64 Years | 90 | 16.6% |
| 65 to 74 Years | 122 | 22.5% |
| 75 to 84 Years | 227 | 41.9% |
| 85 Years and Over | 43 | 7.9% |
| Total | 542 | 100.0% |
Housing Finances in Silverado Resort
Median Income by Occupancy in Silverado Resort
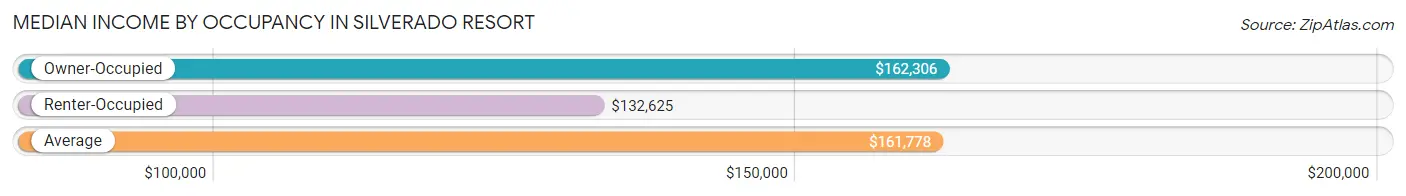
| Occupancy Type | # Households | Median Income |
| Owner-Occupied | 425 (78.4%) | $162,306 |
| Renter-Occupied | 117 (21.6%) | $132,625 |
| Average | 542 (100.0%) | $161,778 |
Occupancy by Householder Income Bracket in Silverado Resort
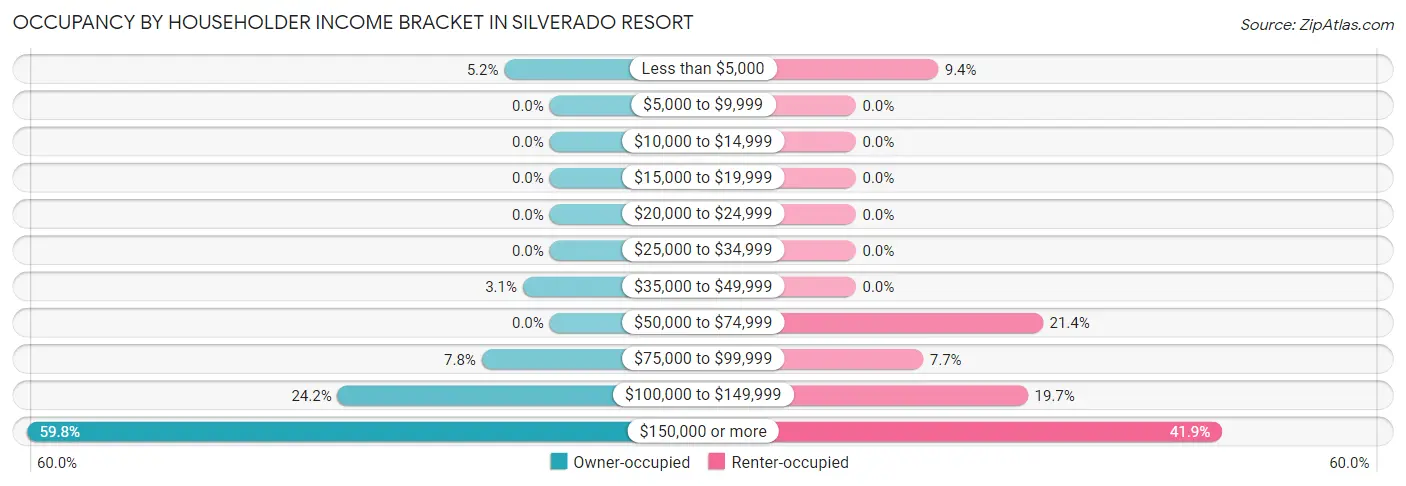
| Income Bracket | Owner-occupied | Renter-occupied |
| Less than $5,000 | 22 (5.2%) | 11 (9.4%) |
| $5,000 to $9,999 | 0 (0.0%) | 0 (0.0%) |
| $10,000 to $14,999 | 0 (0.0%) | 0 (0.0%) |
| $15,000 to $19,999 | 0 (0.0%) | 0 (0.0%) |
| $20,000 to $24,999 | 0 (0.0%) | 0 (0.0%) |
| $25,000 to $34,999 | 0 (0.0%) | 0 (0.0%) |
| $35,000 to $49,999 | 13 (3.1%) | 0 (0.0%) |
| $50,000 to $74,999 | 0 (0.0%) | 25 (21.4%) |
| $75,000 to $99,999 | 33 (7.8%) | 9 (7.7%) |
| $100,000 to $149,999 | 103 (24.2%) | 23 (19.7%) |
| $150,000 or more | 254 (59.8%) | 49 (41.9%) |
| Total | 425 (100.0%) | 117 (100.0%) |
Monthly Housing Cost Tiers in Silverado Resort
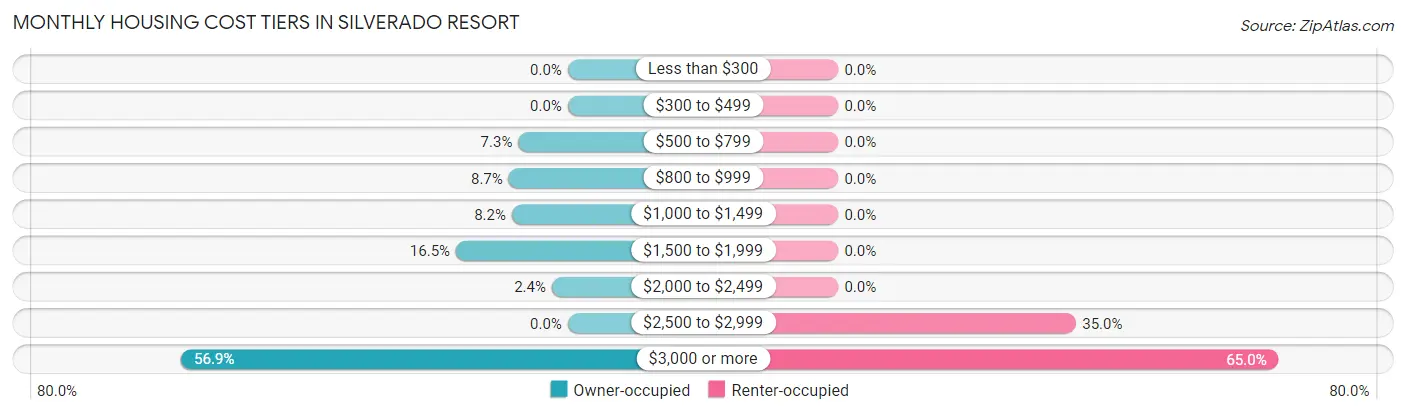
| Monthly Cost | Owner-occupied | Renter-occupied |
| Less than $300 | 0 (0.0%) | 0 (0.0%) |
| $300 to $499 | 0 (0.0%) | 0 (0.0%) |
| $500 to $799 | 31 (7.3%) | 0 (0.0%) |
| $800 to $999 | 37 (8.7%) | 0 (0.0%) |
| $1,000 to $1,499 | 35 (8.2%) | 0 (0.0%) |
| $1,500 to $1,999 | 70 (16.5%) | 0 (0.0%) |
| $2,000 to $2,499 | 10 (2.4%) | 0 (0.0%) |
| $2,500 to $2,999 | 0 (0.0%) | 41 (35.0%) |
| $3,000 or more | 242 (56.9%) | 76 (65.0%) |
| Total | 425 (100.0%) | 117 (100.0%) |
Physical Housing Characteristics in Silverado Resort
Housing Structures in Silverado Resort
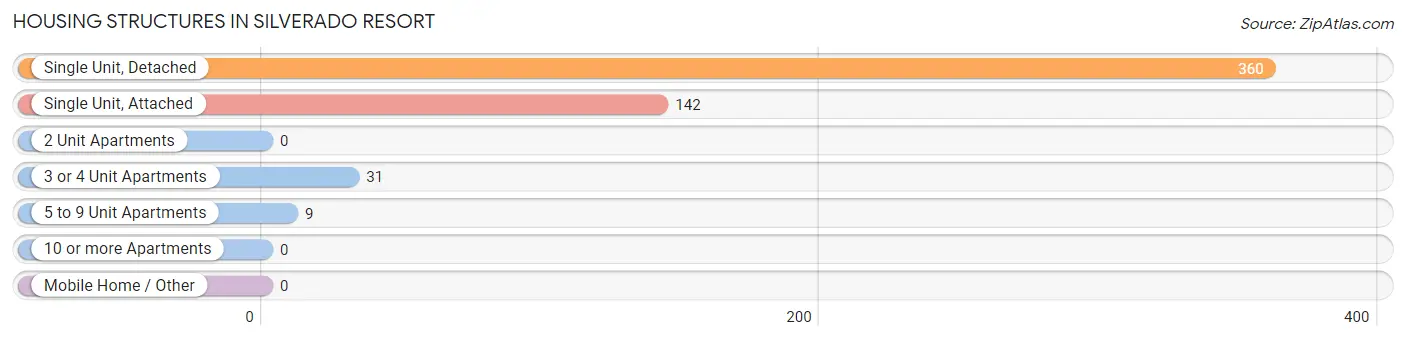
| Structure Type | # Housing Units | % Housing Units |
| Single Unit, Detached | 360 | 66.4% |
| Single Unit, Attached | 142 | 26.2% |
| 2 Unit Apartments | 0 | 0.0% |
| 3 or 4 Unit Apartments | 31 | 5.7% |
| 5 to 9 Unit Apartments | 9 | 1.7% |
| 10 or more Apartments | 0 | 0.0% |
| Mobile Home / Other | 0 | 0.0% |
| Total | 542 | 100.0% |
Housing Structures by Occupancy in Silverado Resort
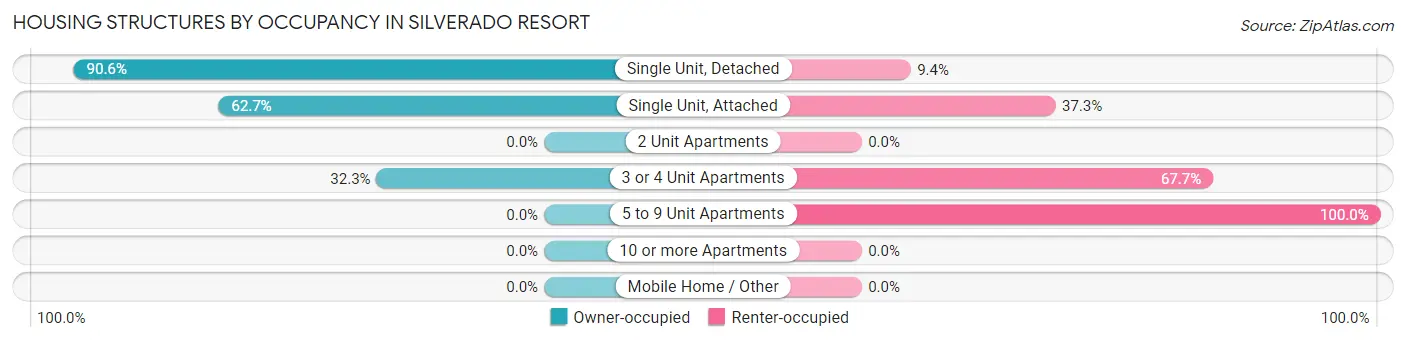
| Structure Type | Owner-occupied | Renter-occupied |
| Single Unit, Detached | 326 (90.6%) | 34 (9.4%) |
| Single Unit, Attached | 89 (62.7%) | 53 (37.3%) |
| 2 Unit Apartments | 0 (0.0%) | 0 (0.0%) |
| 3 or 4 Unit Apartments | 10 (32.3%) | 21 (67.7%) |
| 5 to 9 Unit Apartments | 0 (0.0%) | 9 (100.0%) |
| 10 or more Apartments | 0 (0.0%) | 0 (0.0%) |
| Mobile Home / Other | 0 (0.0%) | 0 (0.0%) |
| Total | 425 (78.4%) | 117 (21.6%) |
Housing Structures by Number of Rooms in Silverado Resort
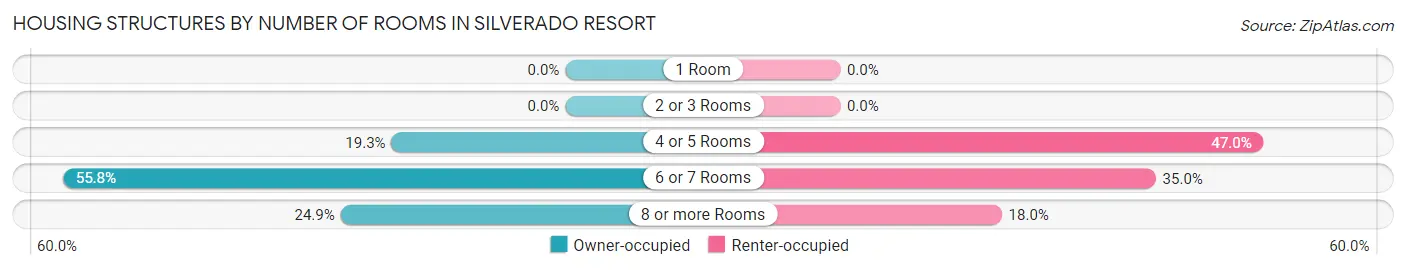
| Number of Rooms | Owner-occupied | Renter-occupied |
| 1 Room | 0 (0.0%) | 0 (0.0%) |
| 2 or 3 Rooms | 0 (0.0%) | 0 (0.0%) |
| 4 or 5 Rooms | 82 (19.3%) | 55 (47.0%) |
| 6 or 7 Rooms | 237 (55.8%) | 41 (35.0%) |
| 8 or more Rooms | 106 (24.9%) | 21 (17.9%) |
| Total | 425 (100.0%) | 117 (100.0%) |
Housing Structure by Heating Type in Silverado Resort
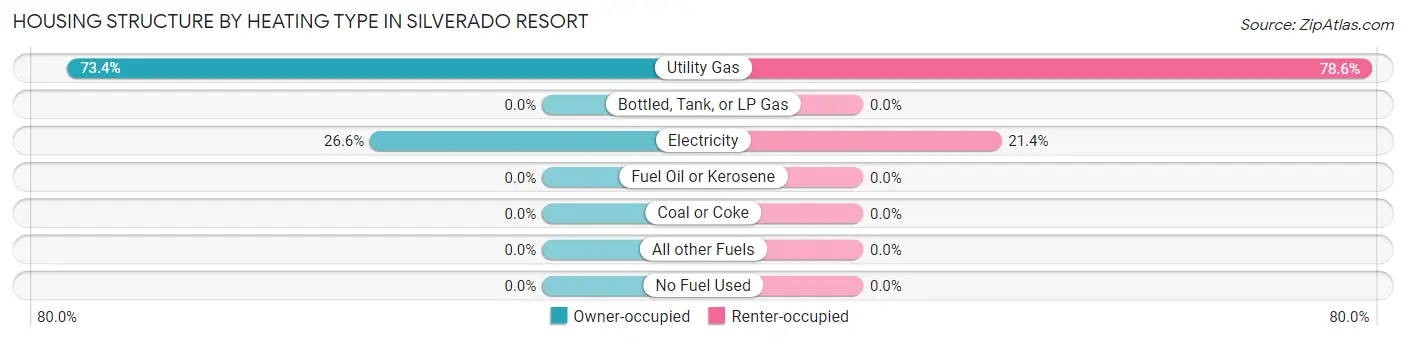
| Heating Type | Owner-occupied | Renter-occupied |
| Utility Gas | 312 (73.4%) | 92 (78.6%) |
| Bottled, Tank, or LP Gas | 0 (0.0%) | 0 (0.0%) |
| Electricity | 113 (26.6%) | 25 (21.4%) |
| Fuel Oil or Kerosene | 0 (0.0%) | 0 (0.0%) |
| Coal or Coke | 0 (0.0%) | 0 (0.0%) |
| All other Fuels | 0 (0.0%) | 0 (0.0%) |
| No Fuel Used | 0 (0.0%) | 0 (0.0%) |
| Total | 425 (100.0%) | 117 (100.0%) |
Household Vehicle Usage in Silverado Resort
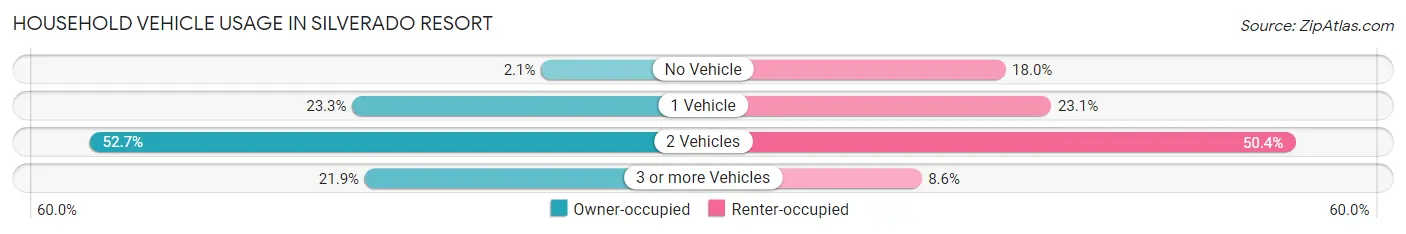
| Vehicles per Household | Owner-occupied | Renter-occupied |
| No Vehicle | 9 (2.1%) | 21 (17.9%) |
| 1 Vehicle | 99 (23.3%) | 27 (23.1%) |
| 2 Vehicles | 224 (52.7%) | 59 (50.4%) |
| 3 or more Vehicles | 93 (21.9%) | 10 (8.6%) |
| Total | 425 (100.0%) | 117 (100.0%) |
Real Estate & Mortgages in Silverado Resort
Real Estate and Mortgage Overview in Silverado Resort
| Characteristic | Without Mortgage | With Mortgage |
| Housing Units | 173 | 252 |
| Median Property Value | $1,077,200 | $1,577,800 |
| Median Household Income | $162,460 | $137 |
| Monthly Housing Costs | $1,365 | $242 |
| Real Estate Taxes | $8,162 | $0 |
Property Value by Mortgage Status in Silverado Resort
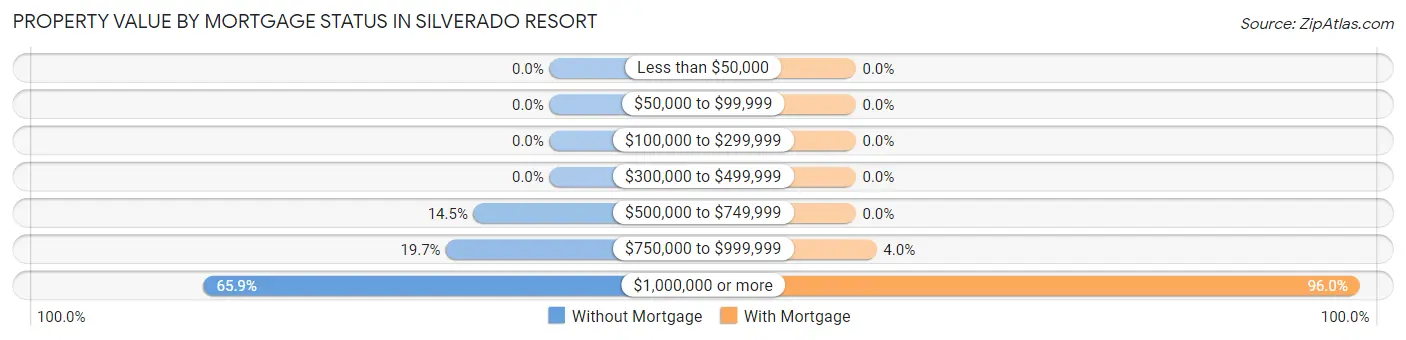
| Property Value | Without Mortgage | With Mortgage |
| Less than $50,000 | 0 (0.0%) | 0 (0.0%) |
| $50,000 to $99,999 | 0 (0.0%) | 0 (0.0%) |
| $100,000 to $299,999 | 0 (0.0%) | 0 (0.0%) |
| $300,000 to $499,999 | 0 (0.0%) | 0 (0.0%) |
| $500,000 to $749,999 | 25 (14.4%) | 0 (0.0%) |
| $750,000 to $999,999 | 34 (19.7%) | 10 (4.0%) |
| $1,000,000 or more | 114 (65.9%) | 242 (96.0%) |
| Total | 173 (100.0%) | 252 (100.0%) |
Household Income by Mortgage Status in Silverado Resort
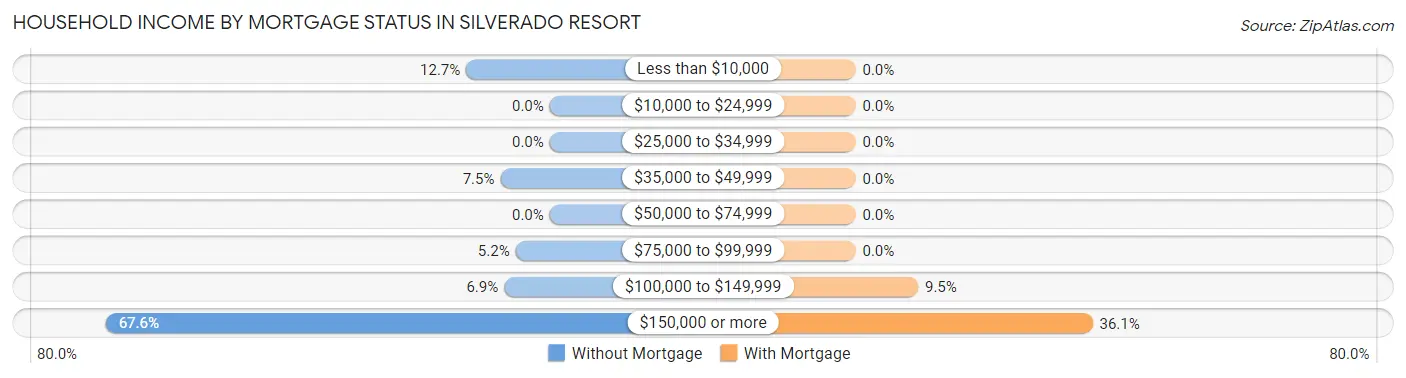
| Household Income | Without Mortgage | With Mortgage |
| Less than $10,000 | 22 (12.7%) | 0 (0.0%) |
| $10,000 to $24,999 | 0 (0.0%) | 0 (0.0%) |
| $25,000 to $34,999 | 0 (0.0%) | 0 (0.0%) |
| $35,000 to $49,999 | 13 (7.5%) | 0 (0.0%) |
| $50,000 to $74,999 | 0 (0.0%) | 0 (0.0%) |
| $75,000 to $99,999 | 9 (5.2%) | 0 (0.0%) |
| $100,000 to $149,999 | 12 (6.9%) | 24 (9.5%) |
| $150,000 or more | 117 (67.6%) | 91 (36.1%) |
| Total | 173 (100.0%) | 252 (100.0%) |
Property Value to Household Income Ratio in Silverado Resort
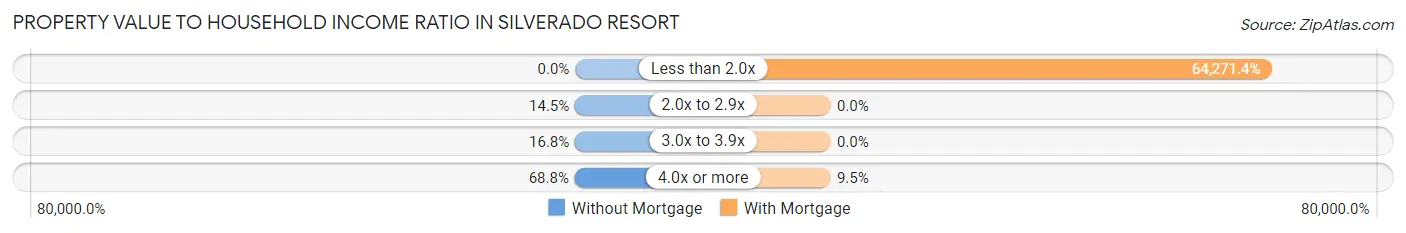
| Value-to-Income Ratio | Without Mortgage | With Mortgage |
| Less than 2.0x | 0 (0.0%) | 161,964 (64,271.4%) |
| 2.0x to 2.9x | 25 (14.4%) | 0 (0.0%) |
| 3.0x to 3.9x | 29 (16.8%) | 0 (0.0%) |
| 4.0x or more | 119 (68.8%) | 24 (9.5%) |
| Total | 173 (100.0%) | 252 (100.0%) |
Real Estate Taxes by Mortgage Status in Silverado Resort
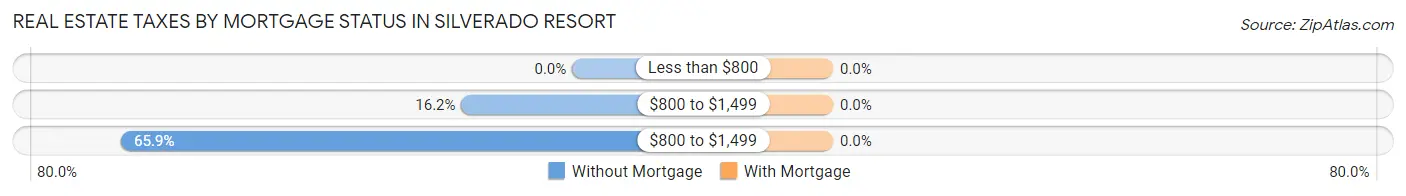
| Property Taxes | Without Mortgage | With Mortgage |
| Less than $800 | 0 (0.0%) | 0 (0.0%) |
| $800 to $1,499 | 28 (16.2%) | 0 (0.0%) |
| $800 to $1,499 | 114 (65.9%) | 0 (0.0%) |
| Total | 173 (100.0%) | 252 (100.0%) |
Health & Disability in Silverado Resort
Health Insurance Coverage by Age in Silverado Resort
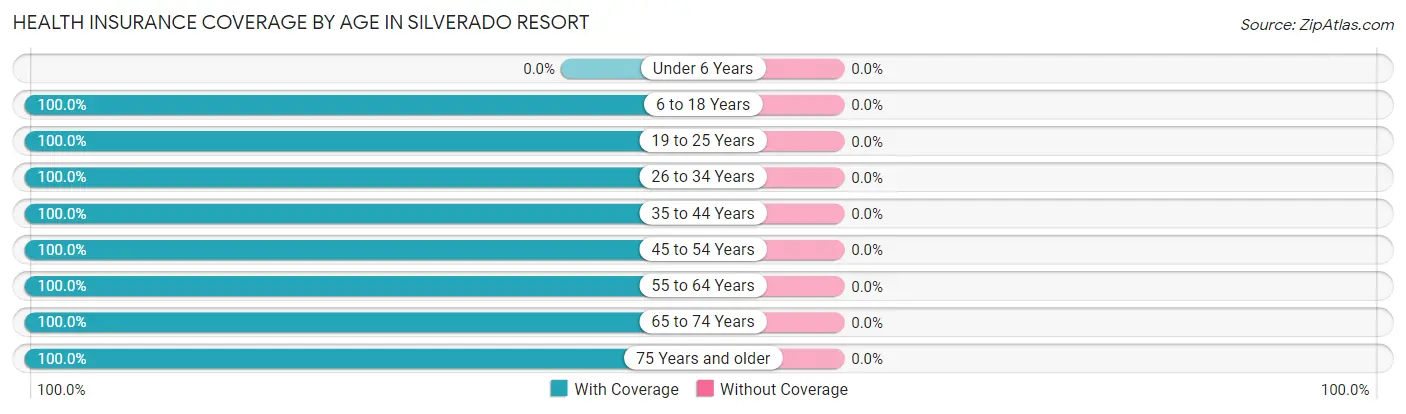
| Age Bracket | With Coverage | Without Coverage |
| Under 6 Years | 0 (0.0%) | 0 (0.0%) |
| 6 to 18 Years | 39 (100.0%) | 0 (0.0%) |
| 19 to 25 Years | 33 (100.0%) | 0 (0.0%) |
| 26 to 34 Years | 28 (100.0%) | 0 (0.0%) |
| 35 to 44 Years | 33 (100.0%) | 0 (0.0%) |
| 45 to 54 Years | 78 (100.0%) | 0 (0.0%) |
| 55 to 64 Years | 184 (100.0%) | 0 (0.0%) |
| 65 to 74 Years | 262 (100.0%) | 0 (0.0%) |
| 75 Years and older | 355 (100.0%) | 0 (0.0%) |
| Total | 1,012 (100.0%) | 0 (0.0%) |
Health Insurance Coverage by Citizenship Status in Silverado Resort
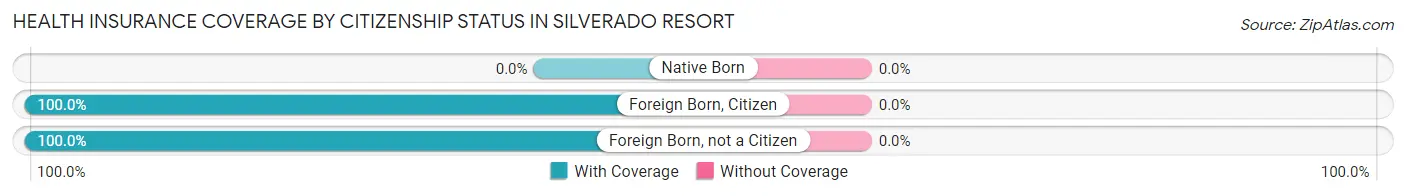
| Citizenship Status | With Coverage | Without Coverage |
| Native Born | 0 (0.0%) | 0 (0.0%) |
| Foreign Born, Citizen | 39 (100.0%) | 0 (0.0%) |
| Foreign Born, not a Citizen | 33 (100.0%) | 0 (0.0%) |
Health Insurance Coverage by Household Income in Silverado Resort
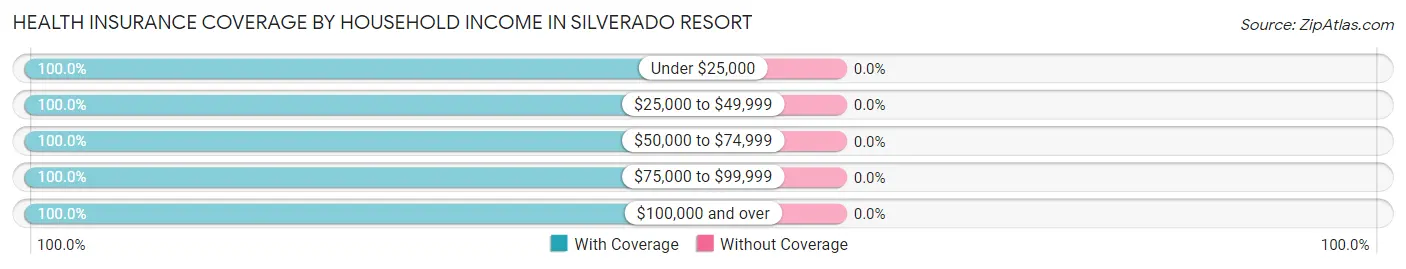
| Household Income | With Coverage | Without Coverage |
| Under $25,000 | 42 (100.0%) | 0 (0.0%) |
| $25,000 to $49,999 | 27 (100.0%) | 0 (0.0%) |
| $50,000 to $74,999 | 25 (100.0%) | 0 (0.0%) |
| $75,000 to $99,999 | 63 (100.0%) | 0 (0.0%) |
| $100,000 and over | 855 (100.0%) | 0 (0.0%) |
Public vs Private Health Insurance Coverage by Age in Silverado Resort
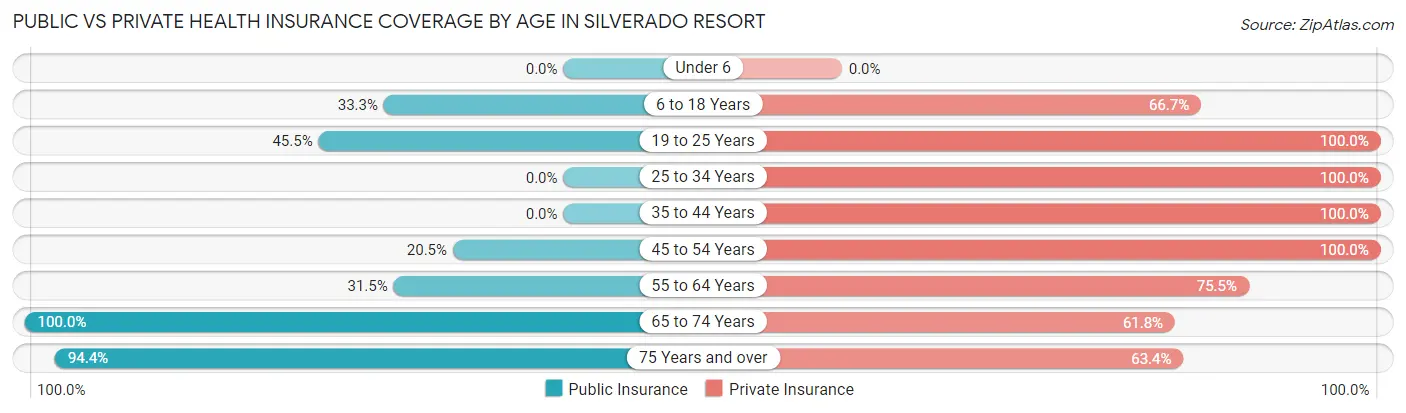
| Age Bracket | Public Insurance | Private Insurance |
| Under 6 | 0 (0.0%) | 0 (0.0%) |
| 6 to 18 Years | 13 (33.3%) | 26 (66.7%) |
| 19 to 25 Years | 15 (45.5%) | 33 (100.0%) |
| 25 to 34 Years | 0 (0.0%) | 28 (100.0%) |
| 35 to 44 Years | 0 (0.0%) | 33 (100.0%) |
| 45 to 54 Years | 16 (20.5%) | 78 (100.0%) |
| 55 to 64 Years | 58 (31.5%) | 139 (75.5%) |
| 65 to 74 Years | 262 (100.0%) | 162 (61.8%) |
| 75 Years and over | 335 (94.4%) | 225 (63.4%) |
| Total | 699 (69.1%) | 724 (71.5%) |
Disability Status by Sex by Age in Silverado Resort
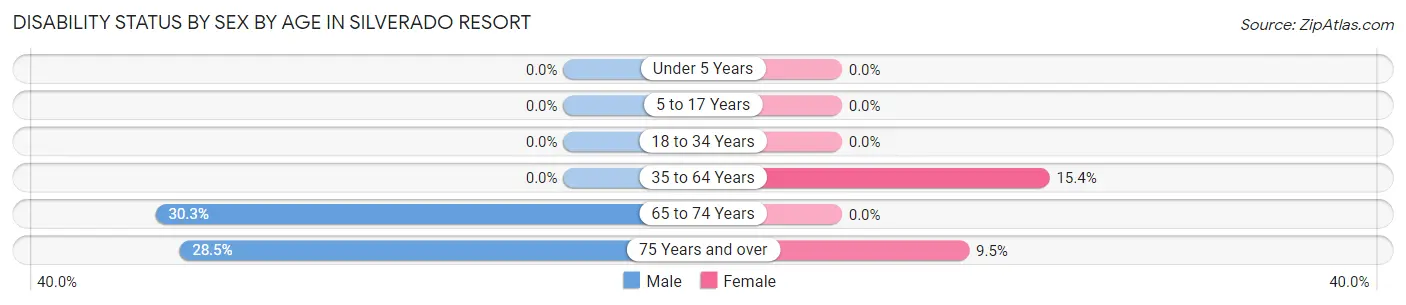
| Age Bracket | Male | Female |
| Under 5 Years | 0 (0.0%) | 0 (0.0%) |
| 5 to 17 Years | 0 (0.0%) | 0 (0.0%) |
| 18 to 34 Years | 0 (0.0%) | 0 (0.0%) |
| 35 to 64 Years | 0 (0.0%) | 31 (15.4%) |
| 65 to 74 Years | 43 (30.3%) | 0 (0.0%) |
| 75 Years and over | 65 (28.5%) | 12 (9.5%) |
Disability Class by Sex by Age in Silverado Resort
Disability Class: Hearing Difficulty
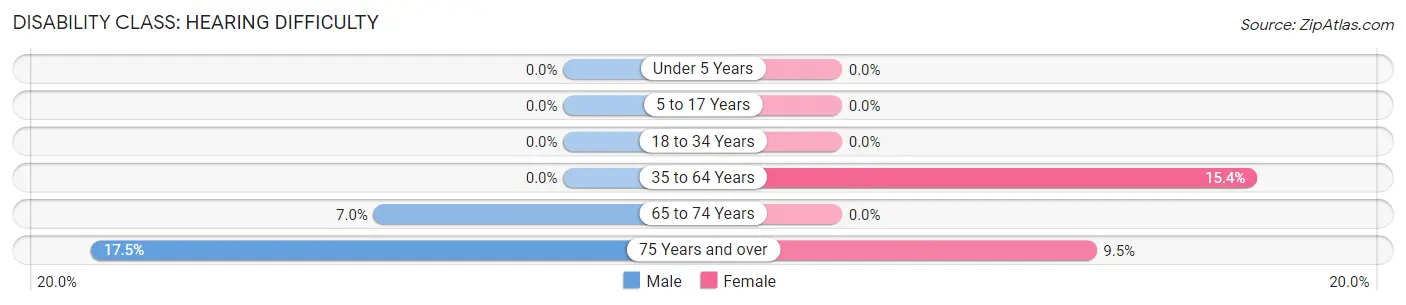
| Age Bracket | Male | Female |
| Under 5 Years | 0 (0.0%) | 0 (0.0%) |
| 5 to 17 Years | 0 (0.0%) | 0 (0.0%) |
| 18 to 34 Years | 0 (0.0%) | 0 (0.0%) |
| 35 to 64 Years | 0 (0.0%) | 31 (15.4%) |
| 65 to 74 Years | 10 (7.0%) | 0 (0.0%) |
| 75 Years and over | 40 (17.5%) | 12 (9.5%) |
Disability Class: Vision Difficulty
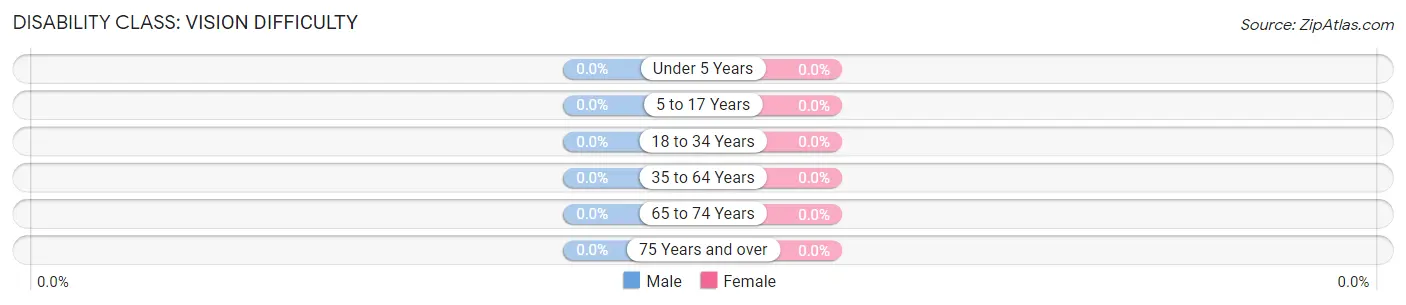
| Age Bracket | Male | Female |
| Under 5 Years | 0 (0.0%) | 0 (0.0%) |
| 5 to 17 Years | 0 (0.0%) | 0 (0.0%) |
| 18 to 34 Years | 0 (0.0%) | 0 (0.0%) |
| 35 to 64 Years | 0 (0.0%) | 0 (0.0%) |
| 65 to 74 Years | 0 (0.0%) | 0 (0.0%) |
| 75 Years and over | 0 (0.0%) | 0 (0.0%) |
Disability Class: Cognitive Difficulty
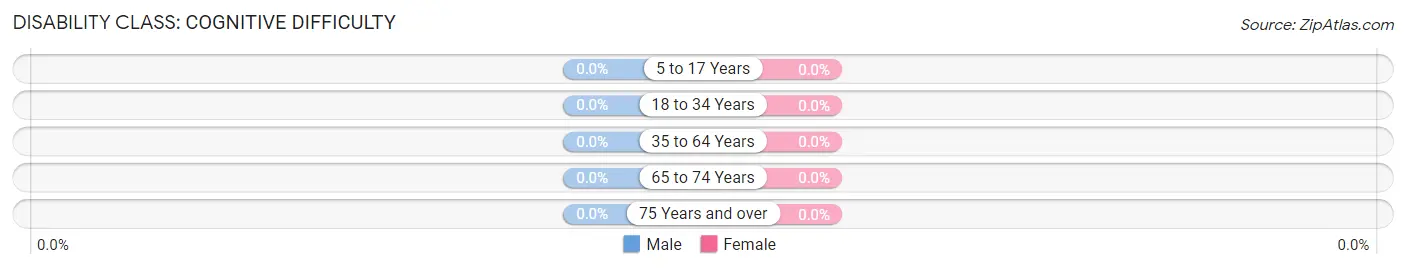
| Age Bracket | Male | Female |
| 5 to 17 Years | 0 (0.0%) | 0 (0.0%) |
| 18 to 34 Years | 0 (0.0%) | 0 (0.0%) |
| 35 to 64 Years | 0 (0.0%) | 0 (0.0%) |
| 65 to 74 Years | 0 (0.0%) | 0 (0.0%) |
| 75 Years and over | 0 (0.0%) | 0 (0.0%) |
Disability Class: Ambulatory Difficulty
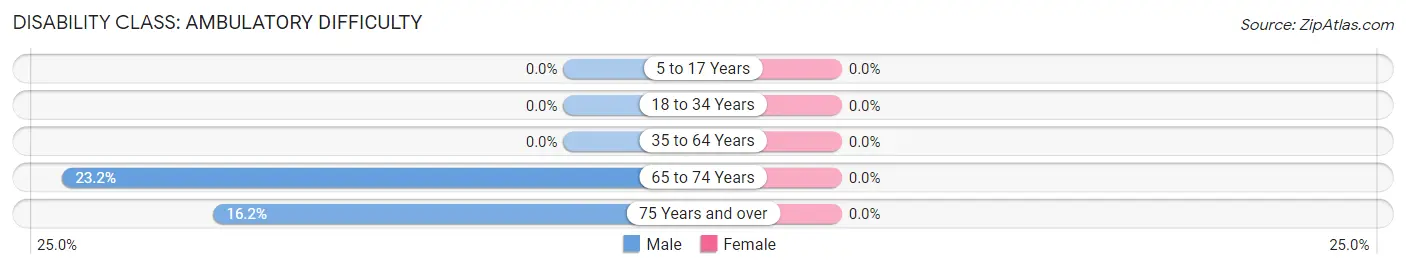
| Age Bracket | Male | Female |
| 5 to 17 Years | 0 (0.0%) | 0 (0.0%) |
| 18 to 34 Years | 0 (0.0%) | 0 (0.0%) |
| 35 to 64 Years | 0 (0.0%) | 0 (0.0%) |
| 65 to 74 Years | 33 (23.2%) | 0 (0.0%) |
| 75 Years and over | 37 (16.2%) | 0 (0.0%) |
Disability Class: Self-Care Difficulty
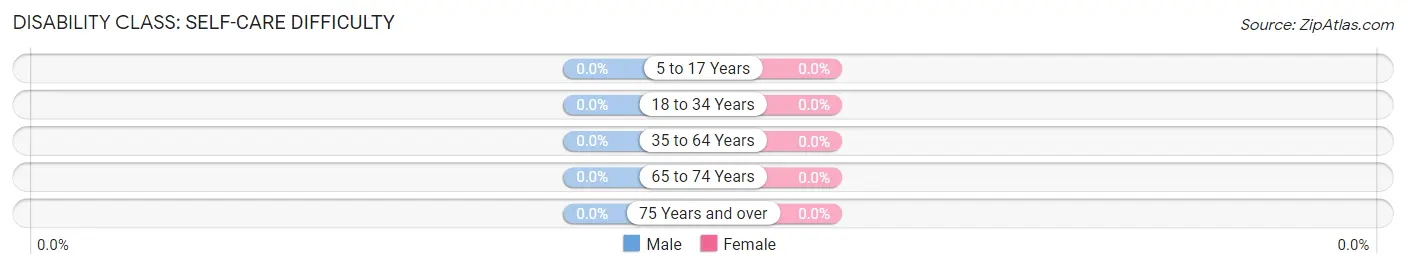
| Age Bracket | Male | Female |
| 5 to 17 Years | 0 (0.0%) | 0 (0.0%) |
| 18 to 34 Years | 0 (0.0%) | 0 (0.0%) |
| 35 to 64 Years | 0 (0.0%) | 0 (0.0%) |
| 65 to 74 Years | 0 (0.0%) | 0 (0.0%) |
| 75 Years and over | 0 (0.0%) | 0 (0.0%) |
Technology Access in Silverado Resort
Computing Device Access in Silverado Resort
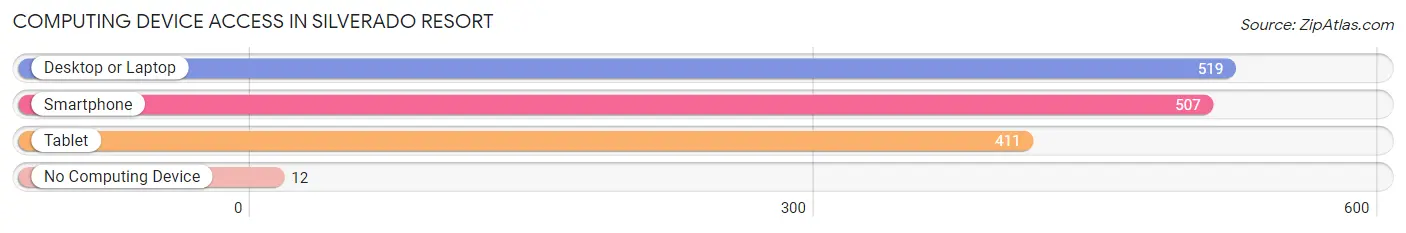
| Device Type | # Households | % Households |
| Desktop or Laptop | 519 | 95.8% |
| Smartphone | 507 | 93.5% |
| Tablet | 411 | 75.8% |
| No Computing Device | 12 | 2.2% |
| Total | 542 | 100.0% |
Internet Access in Silverado Resort
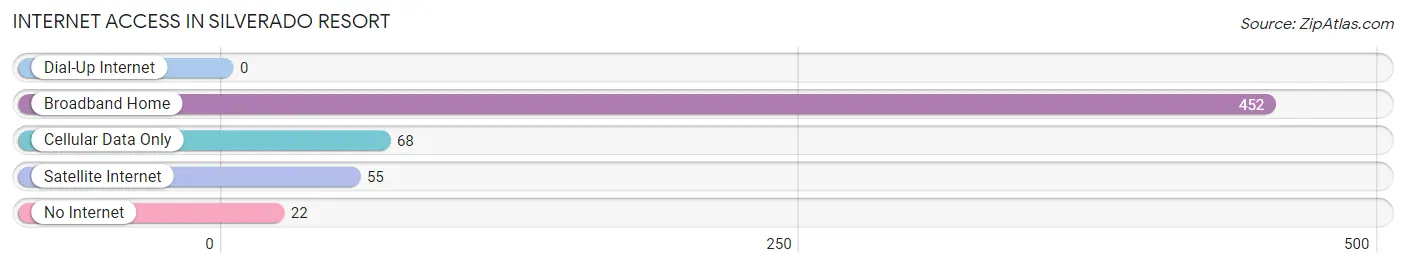
| Internet Type | # Households | % Households |
| Dial-Up Internet | 0 | 0.0% |
| Broadband Home | 452 | 83.4% |
| Cellular Data Only | 68 | 12.6% |
| Satellite Internet | 55 | 10.2% |
| No Internet | 22 | 4.1% |
| Total | 542 | 100.0% |
Silverado Resort Summary
The Silverado Resort is a luxury resort located in the heart of the Napa Valley in California. It is situated on a sprawling 1,200-acre estate and is surrounded by vineyards, rolling hills, and majestic redwood trees. The resort is a popular destination for golfers, wine enthusiasts, and those looking for a relaxing getaway.
History
The Silverado Resort was founded in 1885 by a group of miners who discovered silver ore in the area. The miners built a small hotel and a saloon to accommodate the influx of miners and travelers. The resort was originally known as the Silverado Mine and Hotel. In the early 1900s, the resort was purchased by a wealthy San Francisco businessman, who transformed it into a luxurious destination. He added a golf course, tennis courts, and a swimming pool. The resort was a popular destination for celebrities and dignitaries, including President Franklin D. Roosevelt, who visited in 1934.
In the 1950s, the resort was sold to a group of investors who renamed it the Silverado Country Club. The new owners added a spa, a restaurant, and a conference center. The resort continued to be a popular destination for celebrities and dignitaries, including President John F. Kennedy, who visited in 1962.
In the late 1990s, the resort was purchased by a group of investors who transformed it into a luxury resort. The new owners added a spa, a fitness center, and a conference center. The resort is now a popular destination for golfers, wine enthusiasts, and those looking for a relaxing getaway.
Geography
The Silverado Resort is located in the heart of the Napa Valley in California. It is situated on a sprawling 1,200-acre estate and is surrounded by vineyards, rolling hills, and majestic redwood trees. The resort is located just a few miles from the city of Napa and is easily accessible from the Bay Area and Sacramento.
The resort is located in the foothills of the Mayacamas Mountains, which provide a stunning backdrop for the resort. The resort is also located near several popular attractions, including the Napa Valley Wine Train, the Napa Valley Museum, and the Robert Mondavi Winery.
Economy
The Silverado Resort is a major economic driver in the Napa Valley. The resort employs over 500 people and generates millions of dollars in revenue each year. The resort is a popular destination for golfers, wine enthusiasts, and those looking for a relaxing getaway.
The resort also hosts a variety of events, including weddings, corporate retreats, and conferences. The resort is also home to several restaurants, bars, and shops. The resort is a major contributor to the local economy and helps to support the local businesses in the area.
Demographics
The Silverado Resort is a popular destination for tourists from all over the world. The resort attracts a diverse range of visitors, including golfers, wine enthusiasts, and those looking for a relaxing getaway. The resort is also popular with locals, who come to enjoy the resort’s amenities and take advantage of the nearby attractions.
The resort is also home to a diverse range of employees, including chefs, waiters, bartenders, and housekeepers. The resort is committed to providing a safe and welcoming environment for all of its guests and employees.
Common Questions
What is Per Capita Income in Silverado Resort?
Per Capita income in Silverado Resort is $114,032.
What is the Median Family Income in Silverado Resort?
Median Family Income in Silverado Resort is $175,000.
What is the Median Household income in Silverado Resort?
Median Household Income in Silverado Resort is $161,778.
What is Inequality or Gini Index in Silverado Resort?
Inequality or Gini Index in Silverado Resort is 0.42.
What is the Total Population of Silverado Resort?
Total Population of Silverado Resort is 1,012.
What is the Total Male Population of Silverado Resort?
Total Male Population of Silverado Resort is 523.
What is the Total Female Population of Silverado Resort?
Total Female Population of Silverado Resort is 489.
What is the Ratio of Males per 100 Females in Silverado Resort?
There are 106.95 Males per 100 Females in Silverado Resort.
What is the Ratio of Females per 100 Males in Silverado Resort?
There are 93.50 Females per 100 Males in Silverado Resort.
What is the Median Population Age in Silverado Resort?
Median Population Age in Silverado Resort is 69.4 Years.
What is the Average Family Size in Silverado Resort
Average Family Size in Silverado Resort is 2.2 People.
What is the Average Household Size in Silverado Resort
Average Household Size in Silverado Resort is 1.9 People.
How Large is the Labor Force in Silverado Resort?
There are 349 People in the Labor Forcein in Silverado Resort.
What is the Percentage of People in the Labor Force in Silverado Resort?
35.9% of People are in the Labor Force in Silverado Resort.
What is the Unemployment Rate in Silverado Resort?
Unemployment Rate in Silverado Resort is 5.2%.