Zip Codes with the Highest Percentage of Population Employed in Legal Services & Support in Los Angeles, CA
RELATED REPORTS & OPTIONS
Legal Services & Support
Los Angeles
Compare Zip Codes
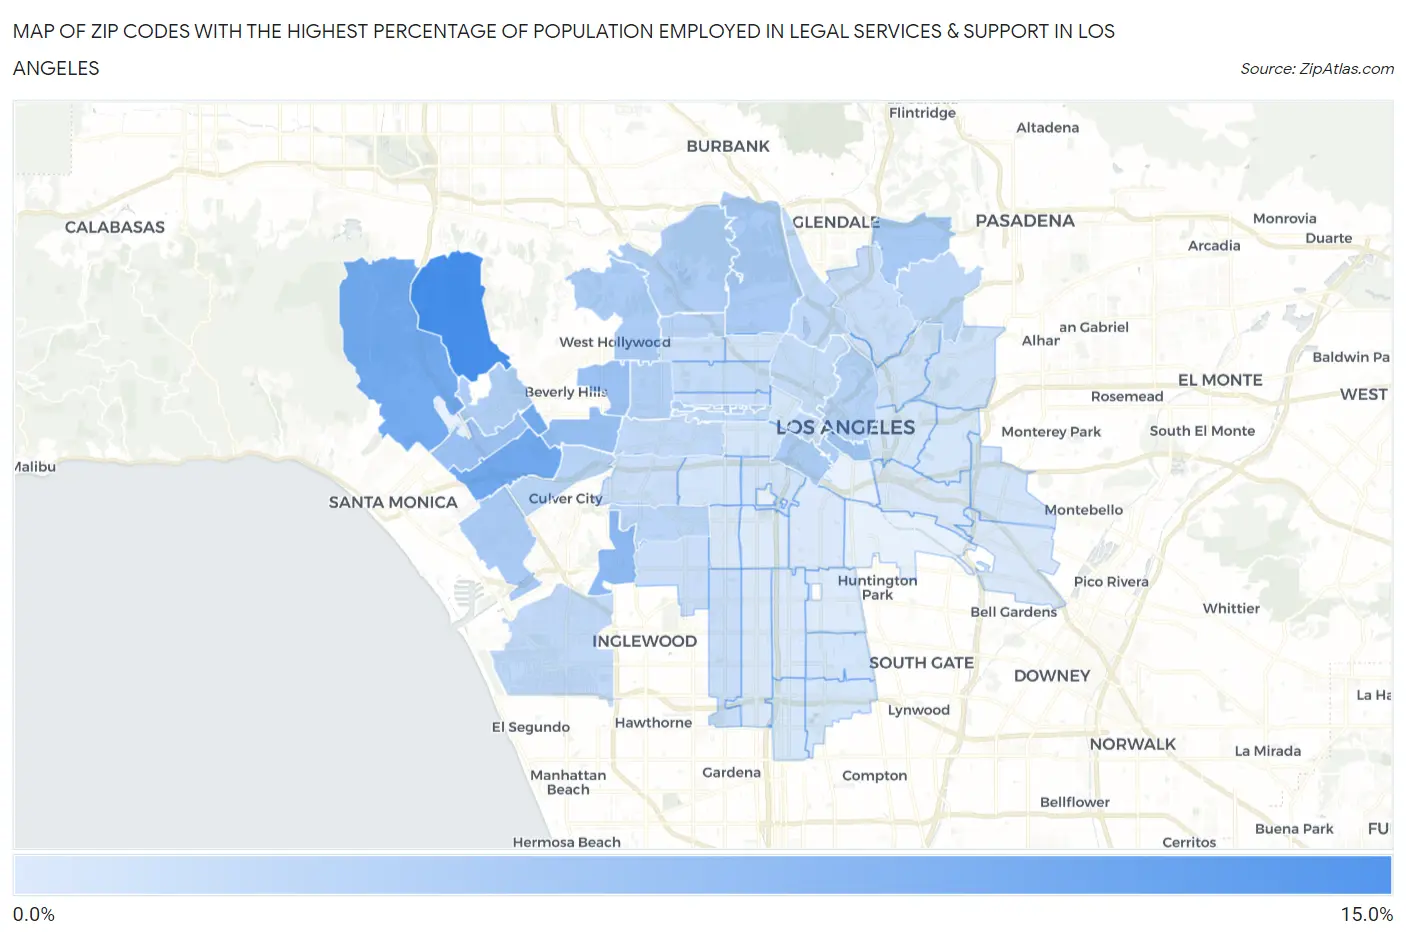
Map of Zip Codes with the Highest Percentage of Population Employed in Legal Services & Support in Los Angeles
0.14%
10.4%
Zip Codes with the Highest Percentage of Population Employed in Legal Services & Support in Los Angeles, CA
| Zip Code | % Employed | vs State | vs National | |
| 1. | 90077 | 10.4% | 1.3%(+9.09)#9 | 1.2%(+9.17)#148 |
| 2. | 90064 | 7.3% | 1.3%(+6.07)#20 | 1.2%(+6.15)#310 |
| 3. | 90049 | 7.1% | 1.3%(+5.87)#23 | 1.2%(+5.94)#334 |
| 4. | 90067 | 7.1% | 1.3%(+5.80)#26 | 1.2%(+5.87)#341 |
| 5. | 90056 | 5.4% | 1.3%(+4.12)#50 | 1.2%(+4.19)#627 |
| 6. | 90035 | 4.7% | 1.3%(+3.42)#68 | 1.2%(+3.50)#814 |
| 7. | 90025 | 4.6% | 1.3%(+3.31)#75 | 1.2%(+3.38)#873 |
| 8. | 90048 | 4.4% | 1.3%(+3.17)#81 | 1.2%(+3.24)#928 |
| 9. | 90013 | 4.2% | 1.3%(+2.93)#92 | 1.2%(+3.01)#1,025 |
| 10. | 90041 | 3.6% | 1.3%(+2.32)#123 | 1.2%(+2.39)#1,368 |
| 11. | 90015 | 3.5% | 1.3%(+2.22)#129 | 1.2%(+2.30)#1,450 |
| 12. | 90066 | 3.5% | 1.3%(+2.22)#130 | 1.2%(+2.30)#1,452 |
| 13. | 90027 | 3.5% | 1.3%(+2.20)#131 | 1.2%(+2.28)#1,461 |
| 14. | 90046 | 3.4% | 1.3%(+2.12)#136 | 1.2%(+2.19)#1,517 |
| 15. | 90068 | 3.2% | 1.3%(+1.98)#145 | 1.2%(+2.05)#1,617 |
| 16. | 90024 | 3.1% | 1.3%(+1.84)#158 | 1.2%(+1.91)#1,750 |
| 17. | 90014 | 3.0% | 1.3%(+1.79)#161 | 1.2%(+1.86)#1,803 |
| 18. | 90010 | 3.0% | 1.3%(+1.72)#170 | 1.2%(+1.79)#1,869 |
| 19. | 90036 | 2.9% | 1.3%(+1.65)#178 | 1.2%(+1.73)#1,952 |
| 20. | 90012 | 2.8% | 1.3%(+1.52)#189 | 1.2%(+1.59)#2,108 |
| 21. | 90028 | 2.6% | 1.3%(+1.32)#207 | 1.2%(+1.39)#2,388 |
| 22. | 90034 | 2.3% | 1.3%(+1.09)#239 | 1.2%(+1.16)#2,763 |
| 23. | 90042 | 2.3% | 1.3%(+1.03)#247 | 1.2%(+1.10)#2,863 |
| 24. | 90008 | 2.2% | 1.3%(+0.933)#264 | 1.2%(+1.01)#3,052 |
| 25. | 90039 | 2.2% | 1.3%(+0.902)#272 | 1.2%(+0.976)#3,118 |
| 26. | 90005 | 2.1% | 1.3%(+0.847)#279 | 1.2%(+0.921)#3,216 |
| 27. | 90019 | 2.0% | 1.3%(+0.692)#309 | 1.2%(+0.767)#3,596 |
| 28. | 90045 | 1.9% | 1.3%(+0.671)#315 | 1.2%(+0.746)#3,654 |
| 29. | 90017 | 1.9% | 1.3%(+0.637)#325 | 1.2%(+0.711)#3,744 |
| 30. | 90026 | 1.8% | 1.3%(+0.586)#333 | 1.2%(+0.660)#3,876 |
| 31. | 90004 | 1.6% | 1.3%(+0.361)#391 | 1.2%(+0.435)#4,611 |
| 32. | 90047 | 1.6% | 1.3%(+0.312)#408 | 1.2%(+0.386)#4,781 |
| 33. | 90065 | 1.5% | 1.3%(+0.225)#433 | 1.2%(+0.299)#5,114 |
| 34. | 90016 | 1.4% | 1.3%(+0.158)#453 | 1.2%(+0.232)#5,395 |
| 35. | 90038 | 1.4% | 1.3%(+0.145)#457 | 1.2%(+0.220)#5,456 |
| 36. | 90020 | 1.4% | 1.3%(+0.123)#463 | 1.2%(+0.197)#5,560 |
| 37. | 90043 | 1.3% | 1.3%(+0.020)#496 | 1.2%(+0.094)#6,045 |
| 38. | 90031 | 1.1% | 1.3%(-0.204)#613 | 1.2%(-0.129)#7,459 |
| 39. | 90032 | 1.0% | 1.3%(-0.209)#614 | 1.2%(-0.134)#7,488 |
| 40. | 90022 | 0.94% | 1.3%(-0.320)#666 | 1.2%(-0.246)#8,289 |
| 41. | 90007 | 0.87% | 1.3%(-0.386)#699 | 1.2%(-0.312)#8,843 |
| 42. | 90029 | 0.84% | 1.3%(-0.415)#720 | 1.2%(-0.340)#9,074 |
| 43. | 90018 | 0.70% | 1.3%(-0.563)#803 | 1.2%(-0.489)#10,457 |
| 44. | 90006 | 0.67% | 1.3%(-0.583)#819 | 1.2%(-0.509)#10,675 |
| 45. | 90002 | 0.67% | 1.3%(-0.588)#821 | 1.2%(-0.514)#10,727 |
| 46. | 90061 | 0.62% | 1.3%(-0.642)#857 | 1.2%(-0.567)#11,291 |
| 47. | 90057 | 0.60% | 1.3%(-0.662)#865 | 1.2%(-0.588)#11,504 |
| 48. | 90059 | 0.56% | 1.3%(-0.697)#884 | 1.2%(-0.623)#11,924 |
| 49. | 90063 | 0.55% | 1.3%(-0.705)#896 | 1.2%(-0.630)#12,019 |
| 50. | 90033 | 0.52% | 1.3%(-0.736)#915 | 1.2%(-0.662)#12,358 |
| 51. | 90044 | 0.42% | 1.3%(-0.834)#990 | 1.2%(-0.759)#13,560 |
| 52. | 90040 | 0.40% | 1.3%(-0.857)#1,005 | 1.2%(-0.783)#13,832 |
| 53. | 90062 | 0.39% | 1.3%(-0.867)#1,009 | 1.2%(-0.793)#13,937 |
| 54. | 90023 | 0.33% | 1.3%(-0.928)#1,050 | 1.2%(-0.854)#14,708 |
| 55. | 90003 | 0.30% | 1.3%(-0.953)#1,057 | 1.2%(-0.879)#14,978 |
| 56. | 90011 | 0.29% | 1.3%(-0.967)#1,065 | 1.2%(-0.893)#15,141 |
| 57. | 90001 | 0.15% | 1.3%(-1.10)#1,139 | 1.2%(-1.03)#16,652 |
| 58. | 90037 | 0.14% | 1.3%(-1.11)#1,147 | 1.2%(-1.04)#16,752 |
1
Common Questions
What are the Top 10 Zip Codes with the Highest Percentage of Population Employed in Legal Services & Support in Los Angeles, CA?
Top 10 Zip Codes with the Highest Percentage of Population Employed in Legal Services & Support in Los Angeles, CA are:
What zip code has the Highest Percentage of Population Employed in Legal Services & Support in Los Angeles, CA?
90077 has the Highest Percentage of Population Employed in Legal Services & Support in Los Angeles, CA with 10.4%.
What is the Percentage of Population Employed in Legal Services & Support in Los Angeles, CA?
Percentage of Population Employed in Legal Services & Support in Los Angeles is 1.9%.
What is the Percentage of Population Employed in Legal Services & Support in California?
Percentage of Population Employed in Legal Services & Support in California is 1.3%.
What is the Percentage of Population Employed in Legal Services & Support in the United States?
Percentage of Population Employed in Legal Services & Support in the United States is 1.2%.