Calabasas, CA Map & Demographics
Calabasas Map
Calabasas Overview
$98,625
PER CAPITA INCOME
$199,110
AVG FAMILY INCOME
$154,079
AVG HOUSEHOLD INCOME
36.6%
WAGE / INCOME GAP [ % ]
63.4¢/ $1
WAGE / INCOME GAP [ $ ]
0.56
INEQUALITY / GINI INDEX
23,106
TOTAL POPULATION
11,369
MALE POPULATION
11,737
FEMALE POPULATION
96.86
MALES / 100 FEMALES
103.24
FEMALES / 100 MALES
42.1
MEDIAN AGE
3.1
AVG FAMILY SIZE
2.6
AVG HOUSEHOLD SIZE
12,056
LABOR FORCE [ PEOPLE ]
64.5%
PERCENT IN LABOR FORCE
9.4%
UNEMPLOYMENT RATE
Calabasas Zip Codes
Income in Calabasas
Income Overview in Calabasas
Per Capita Income in Calabasas is $98,625, while median incomes of families and households are $199,110 and $154,079 respectively.
| Characteristic | Number | Measure |
| Per Capita Income | 23,106 | $98,625 |
| Median Family Income | 6,236 | $199,110 |
| Mean Family Income | 6,236 | $308,523 |
| Median Household Income | 8,819 | $154,079 |
| Mean Household Income | 8,819 | $257,894 |
| Income Deficit | 6,236 | $0 |
| Wage / Income Gap (%) | 23,106 | 36.60% |
| Wage / Income Gap ($) | 23,106 | 63.40¢ per $1 |
| Gini / Inequality Index | 23,106 | 0.56 |
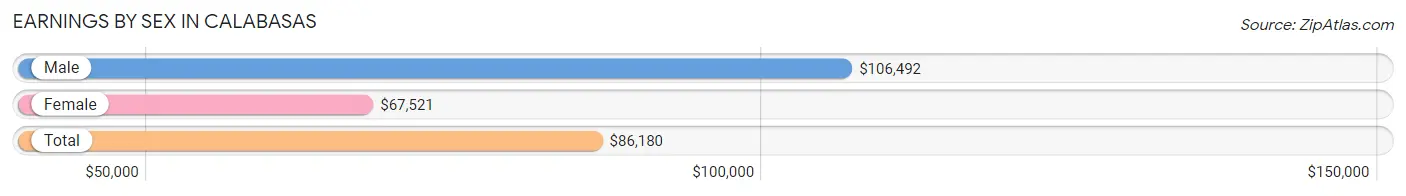
Earnings by Sex in Calabasas
Average Earnings in Calabasas are $86,180, $106,492 for men and $67,521 for women, a difference of 36.6%.
| Sex | Number | Average Earnings |
| Male | 6,702 (54.6%) | $106,492 |
| Female | 5,561 (45.4%) | $67,521 |
| Total | 12,263 (100.0%) | $86,180 |
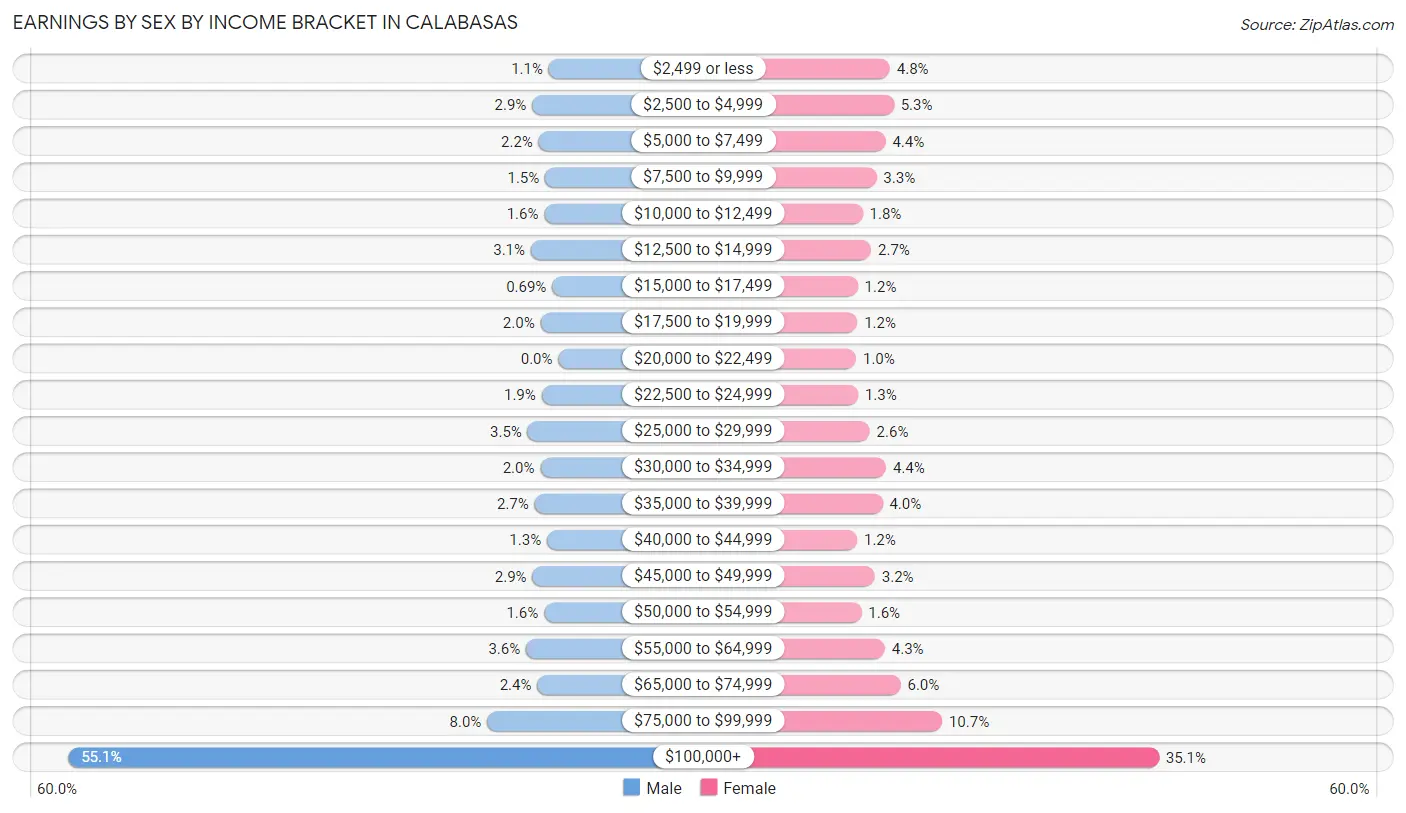
Earnings by Sex by Income Bracket in Calabasas
The most common earnings brackets in Calabasas are $100,000+ for men (3,692 | 55.1%) and $100,000+ for women (1,950 | 35.1%).
| Income | Male | Female |
| $2,499 or less | 72 (1.1%) | 269 (4.8%) |
| $2,500 to $4,999 | 197 (2.9%) | 293 (5.3%) |
| $5,000 to $7,499 | 148 (2.2%) | 242 (4.3%) |
| $7,500 to $9,999 | 100 (1.5%) | 185 (3.3%) |
| $10,000 to $12,499 | 106 (1.6%) | 99 (1.8%) |
| $12,500 to $14,999 | 207 (3.1%) | 152 (2.7%) |
| $15,000 to $17,499 | 46 (0.7%) | 68 (1.2%) |
| $17,500 to $19,999 | 135 (2.0%) | 65 (1.2%) |
| $20,000 to $22,499 | 0 (0.0%) | 58 (1.0%) |
| $22,500 to $24,999 | 126 (1.9%) | 70 (1.3%) |
| $25,000 to $29,999 | 231 (3.5%) | 143 (2.6%) |
| $30,000 to $34,999 | 136 (2.0%) | 245 (4.4%) |
| $35,000 to $39,999 | 179 (2.7%) | 223 (4.0%) |
| $40,000 to $44,999 | 86 (1.3%) | 64 (1.1%) |
| $45,000 to $49,999 | 195 (2.9%) | 175 (3.2%) |
| $50,000 to $54,999 | 108 (1.6%) | 91 (1.6%) |
| $55,000 to $64,999 | 243 (3.6%) | 238 (4.3%) |
| $65,000 to $74,999 | 159 (2.4%) | 336 (6.0%) |
| $75,000 to $99,999 | 536 (8.0%) | 595 (10.7%) |
| $100,000+ | 3,692 (55.1%) | 1,950 (35.1%) |
| Total | 6,702 (100.0%) | 5,561 (100.0%) |
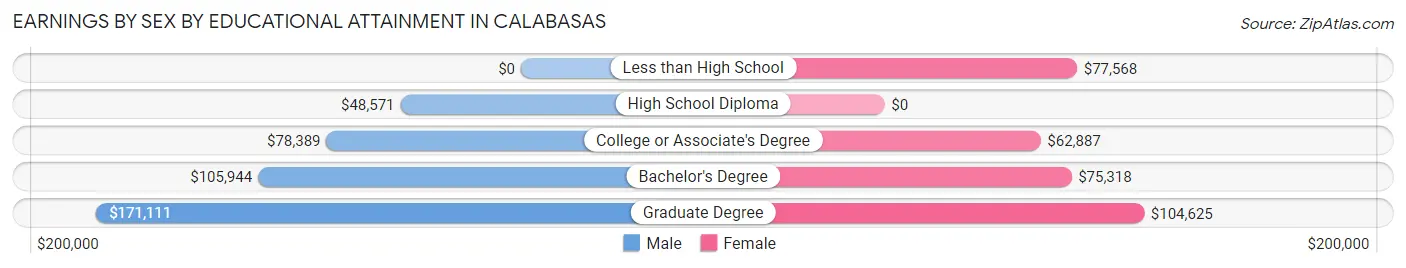
Earnings by Sex by Educational Attainment in Calabasas
Average earnings in Calabasas are $115,625 for men and $77,830 for women, a difference of 32.7%. Men with an educational attainment of graduate degree enjoy the highest average annual earnings of $171,111, while those with high school diploma education earn the least with $48,571. Women with an educational attainment of graduate degree earn the most with the average annual earnings of $104,625, while those with college or associate's degree education have the smallest earnings of $62,887.
| Educational Attainment | Male Income | Female Income |
| Less than High School | - | - |
| High School Diploma | $48,571 | $0 |
| College or Associate's Degree | $78,389 | $62,887 |
| Bachelor's Degree | $105,944 | $75,318 |
| Graduate Degree | $171,111 | $104,625 |
| Total | $115,625 | $77,830 |
Family Income in Calabasas
Family Income Brackets in Calabasas
According to the Calabasas family income data, there are 3,093 families falling into the $200,000+ income range, which is the most common income bracket and makes up 49.6% of all families. Conversely, the $10,000 to $14,999 income bracket is the least frequent group with only 19 families (0.3%) belonging to this category.
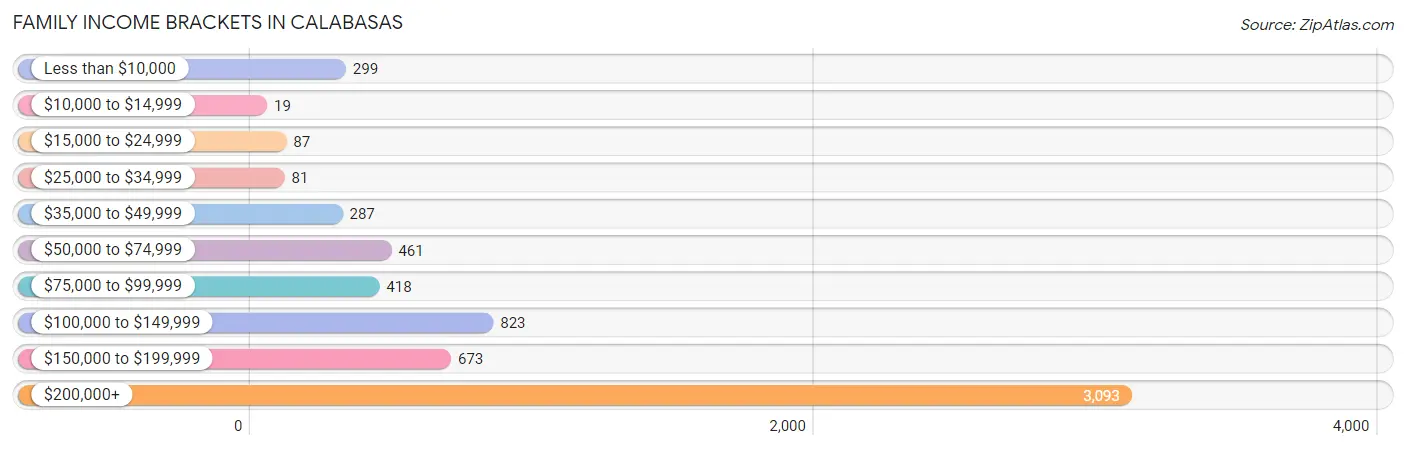
| Income Bracket | # Families | % Families |
| Less than $10,000 | 299 | 4.8% |
| $10,000 to $14,999 | 19 | 0.3% |
| $15,000 to $24,999 | 87 | 1.4% |
| $25,000 to $34,999 | 81 | 1.3% |
| $35,000 to $49,999 | 287 | 4.6% |
| $50,000 to $74,999 | 461 | 7.4% |
| $75,000 to $99,999 | 418 | 6.7% |
| $100,000 to $149,999 | 823 | 13.2% |
| $150,000 to $199,999 | 673 | 10.8% |
| $200,000+ | 3,093 | 49.6% |
Family Income by Famaliy Size in Calabasas
4-person families (1,590 | 25.5%) account for the highest median family income in Calabasas with $250,001 per family, while 2-person families (2,813 | 45.1%) have the highest median income of $81,458 per family member.
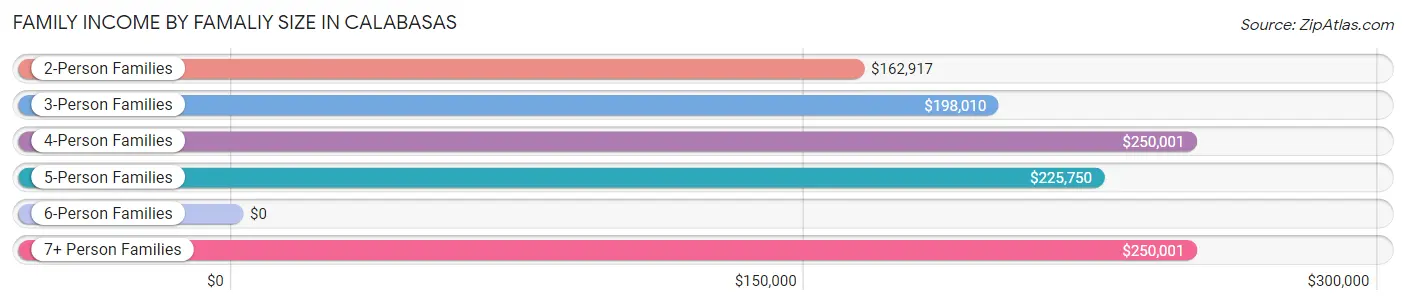
| Income Bracket | # Families | Median Income |
| 2-Person Families | 2,813 (45.1%) | $162,917 |
| 3-Person Families | 1,424 (22.8%) | $198,010 |
| 4-Person Families | 1,590 (25.5%) | $250,001 |
| 5-Person Families | 327 (5.2%) | $225,750 |
| 6-Person Families | 68 (1.1%) | $0 |
| 7+ Person Families | 14 (0.2%) | $250,001 |
| Total | 6,236 (100.0%) | $199,110 |
Family Income by Number of Earners in Calabasas
The median family income in Calabasas is $199,110, with families comprising 3+ earners (658) having the highest median family income of $250,001, while families with no earners (774) have the lowest median family income of $71,750, accounting for 10.5% and 12.4% of families, respectively.
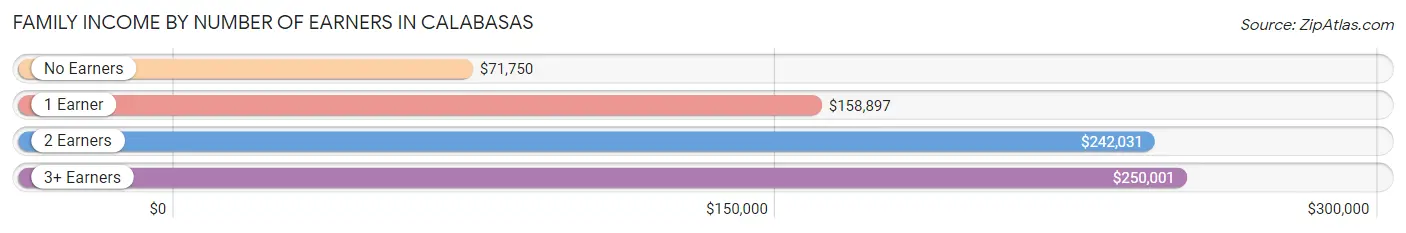
| Number of Earners | # Families | Median Income |
| No Earners | 774 (12.4%) | $71,750 |
| 1 Earner | 2,362 (37.9%) | $158,897 |
| 2 Earners | 2,442 (39.2%) | $242,031 |
| 3+ Earners | 658 (10.5%) | $250,001 |
| Total | 6,236 (100.0%) | $199,110 |
Household Income in Calabasas
Household Income Brackets in Calabasas
With 3,554 households falling in the category, the $200,000+ income range is the most frequent in Calabasas, accounting for 40.3% of all households. In contrast, only 115 households (1.3%) fall into the $10,000 to $14,999 income bracket, making it the least populous group.
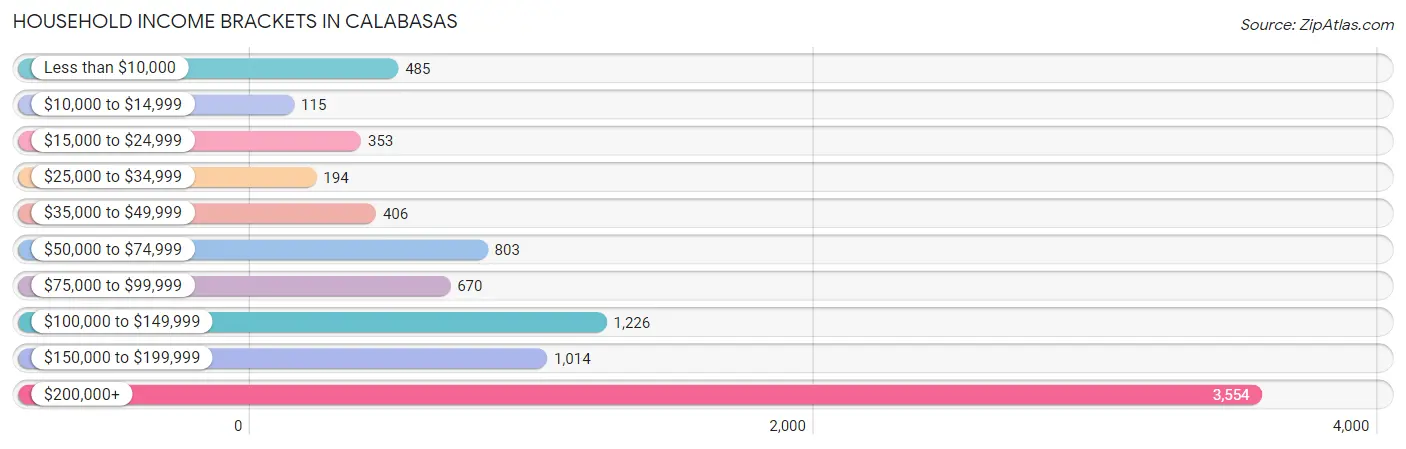
| Income Bracket | # Households | % Households |
| Less than $10,000 | 485 | 5.5% |
| $10,000 to $14,999 | 115 | 1.3% |
| $15,000 to $24,999 | 353 | 4.0% |
| $25,000 to $34,999 | 194 | 2.2% |
| $35,000 to $49,999 | 406 | 4.6% |
| $50,000 to $74,999 | 803 | 9.1% |
| $75,000 to $99,999 | 670 | 7.6% |
| $100,000 to $149,999 | 1,226 | 13.9% |
| $150,000 to $199,999 | 1,014 | 11.5% |
| $200,000+ | 3,554 | 40.3% |
Household Income by Householder Age in Calabasas
The median household income in Calabasas is $154,079, with the highest median household income of $177,938 found in the 25 to 44 years age bracket for the primary householder. A total of 2,308 households (26.2%) fall into this category. Meanwhile, the 15 to 24 years age bracket for the primary householder has the lowest median household income of $23,110, with 485 households (5.5%) in this group.
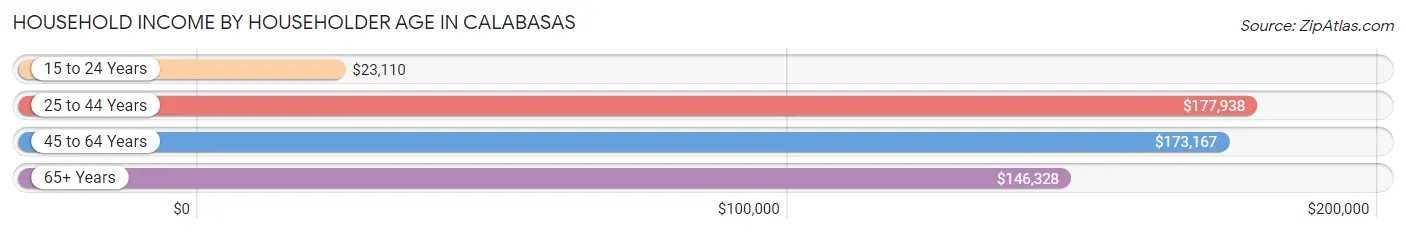
| Income Bracket | # Households | Median Income |
| 15 to 24 Years | 485 (5.5%) | $23,110 |
| 25 to 44 Years | 2,308 (26.2%) | $177,938 |
| 45 to 64 Years | 3,606 (40.9%) | $173,167 |
| 65+ Years | 2,420 (27.4%) | $146,328 |
| Total | 8,819 (100.0%) | $154,079 |
Poverty in Calabasas
Income Below Poverty by Sex and Age in Calabasas
With 9.0% poverty level for males and 9.1% for females among the residents of Calabasas, 15 year old males and 18 to 24 year old females are the most vulnerable to poverty, with 119 males (39.0%) and 448 females (50.2%) in their respective age groups living below the poverty level.
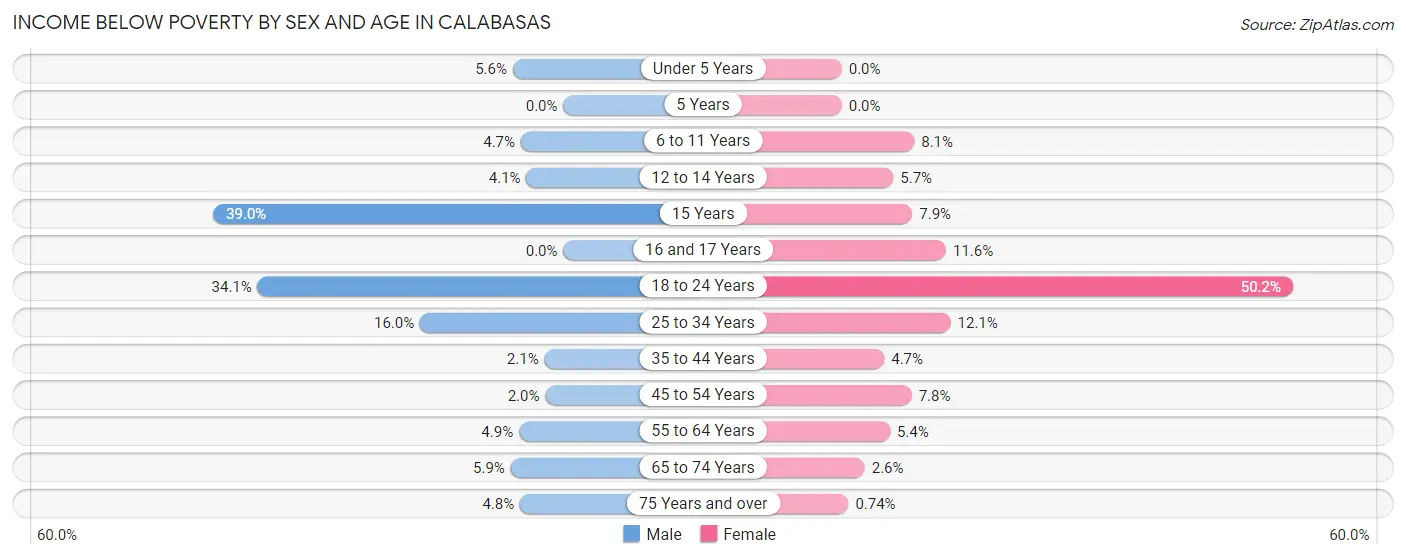
| Age Bracket | Male | Female |
| Under 5 Years | 28 (5.6%) | 0 (0.0%) |
| 5 Years | 0 (0.0%) | 0 (0.0%) |
| 6 to 11 Years | 39 (4.7%) | 63 (8.1%) |
| 12 to 14 Years | 22 (4.1%) | 35 (5.7%) |
| 15 Years | 119 (39.0%) | 11 (7.9%) |
| 16 and 17 Years | 0 (0.0%) | 36 (11.6%) |
| 18 to 24 Years | 350 (34.1%) | 448 (50.2%) |
| 25 to 34 Years | 210 (16.0%) | 126 (12.1%) |
| 35 to 44 Years | 29 (2.1%) | 78 (4.7%) |
| 45 to 54 Years | 30 (2.0%) | 130 (7.8%) |
| 55 to 64 Years | 86 (4.9%) | 100 (5.4%) |
| 65 to 74 Years | 69 (5.9%) | 35 (2.6%) |
| 75 Years and over | 38 (4.8%) | 6 (0.7%) |
| Total | 1,020 (9.0%) | 1,068 (9.1%) |
Income Above Poverty by Sex and Age in Calabasas
According to the poverty statistics in Calabasas, males aged 5 years and females aged under 5 years are the age groups that are most secure financially, with 100.0% of males and 100.0% of females in these age groups living above the poverty line.
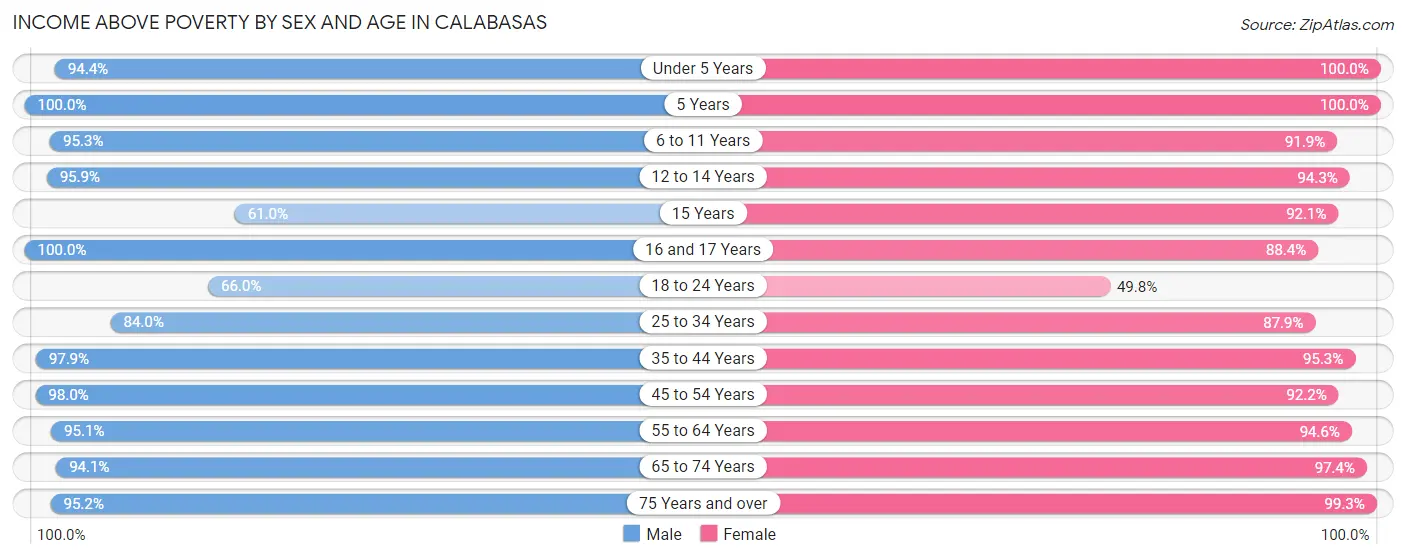
| Age Bracket | Male | Female |
| Under 5 Years | 469 (94.4%) | 515 (100.0%) |
| 5 Years | 109 (100.0%) | 92 (100.0%) |
| 6 to 11 Years | 785 (95.3%) | 718 (91.9%) |
| 12 to 14 Years | 513 (95.9%) | 575 (94.3%) |
| 15 Years | 186 (61.0%) | 129 (92.1%) |
| 16 and 17 Years | 168 (100.0%) | 274 (88.4%) |
| 18 to 24 Years | 678 (65.9%) | 444 (49.8%) |
| 25 to 34 Years | 1,106 (84.0%) | 914 (87.9%) |
| 35 to 44 Years | 1,349 (97.9%) | 1,571 (95.3%) |
| 45 to 54 Years | 1,462 (98.0%) | 1,538 (92.2%) |
| 55 to 64 Years | 1,654 (95.1%) | 1,766 (94.6%) |
| 65 to 74 Years | 1,107 (94.1%) | 1,331 (97.4%) |
| 75 Years and over | 751 (95.2%) | 802 (99.3%) |
| Total | 10,337 (91.0%) | 10,669 (90.9%) |
Income Below Poverty Among Married-Couple Families in Calabasas
The poverty statistics for married-couple families in Calabasas show that 2.3% or 114 of the total 4,962 families live below the poverty line. Families with no children have the highest poverty rate of 3.4%, comprising of 103 families. On the other hand, families with 3 or 4 children have the lowest poverty rate of 0.0%, which includes 0 families.
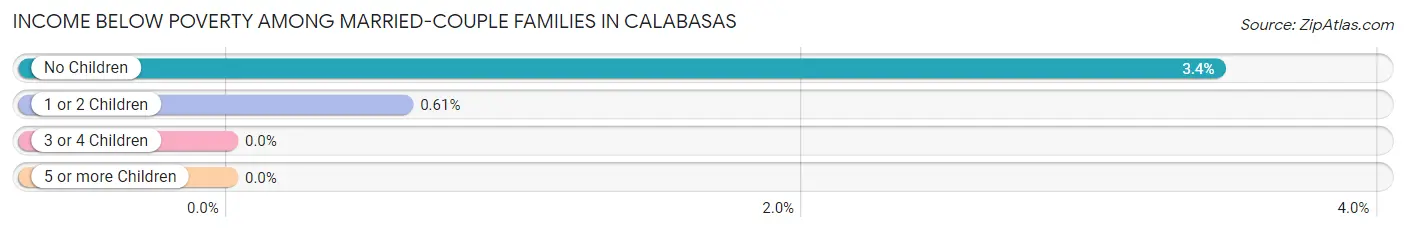
| Children | Above Poverty | Below Poverty |
| No Children | 2,891 (96.6%) | 103 (3.4%) |
| 1 or 2 Children | 1,801 (99.4%) | 11 (0.6%) |
| 3 or 4 Children | 156 (100.0%) | 0 (0.0%) |
| 5 or more Children | 0 (0.0%) | 0 (0.0%) |
| Total | 4,848 (97.7%) | 114 (2.3%) |
Income Below Poverty Among Single-Parent Households in Calabasas
According to the poverty data in Calabasas, 10.9% or 43 single-father households and 25.1% or 221 single-mother households are living below the poverty line. Among single-father households, those with no children have the highest poverty rate, with 43 households (19.7%) experiencing poverty. Likewise, among single-mother households, those with 3 or 4 children have the highest poverty rate, with 25 households (51.0%) falling below the poverty line.
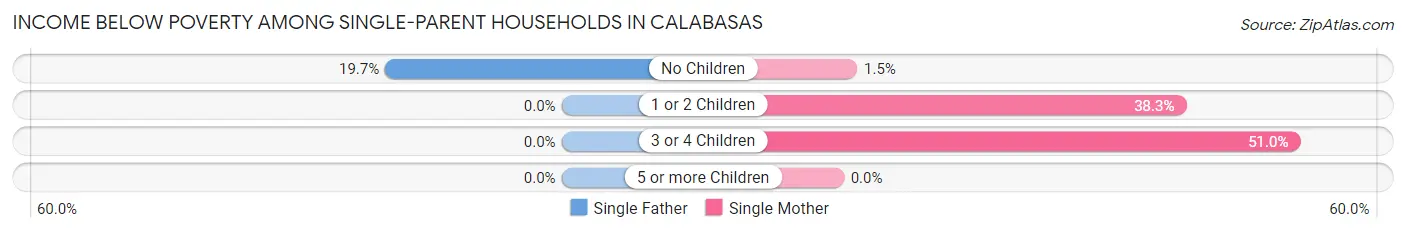
| Children | Single Father | Single Mother |
| No Children | 43 (19.7%) | 5 (1.5%) |
| 1 or 2 Children | 0 (0.0%) | 191 (38.3%) |
| 3 or 4 Children | 0 (0.0%) | 25 (51.0%) |
| 5 or more Children | 0 (0.0%) | 0 (0.0%) |
| Total | 43 (10.9%) | 221 (25.1%) |
Income Below Poverty Among Married-Couple vs Single-Parent Households in Calabasas
The poverty data for Calabasas shows that 114 of the married-couple family households (2.3%) and 264 of the single-parent households (20.7%) are living below the poverty level. Within the married-couple family households, those with no children have the highest poverty rate, with 103 households (3.4%) falling below the poverty line. Among the single-parent households, those with 1 or 2 children have the highest poverty rate, with 191 household (30.2%) living below poverty.
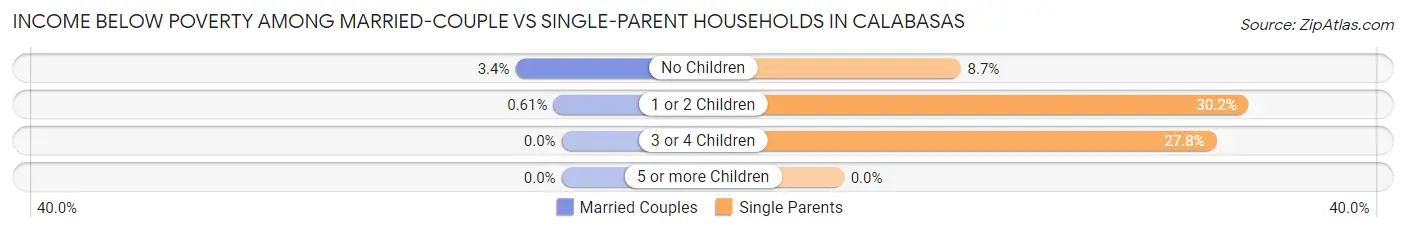
| Children | Married-Couple Families | Single-Parent Households |
| No Children | 103 (3.4%) | 48 (8.7%) |
| 1 or 2 Children | 11 (0.6%) | 191 (30.2%) |
| 3 or 4 Children | 0 (0.0%) | 25 (27.8%) |
| 5 or more Children | 0 (0.0%) | 0 (0.0%) |
| Total | 114 (2.3%) | 264 (20.7%) |
Race in Calabasas
The most populous races in Calabasas are White / Caucasian (17,187 | 74.4%), Asian (2,757 | 11.9%), and Hispanic or Latino (2,156 | 9.3%).
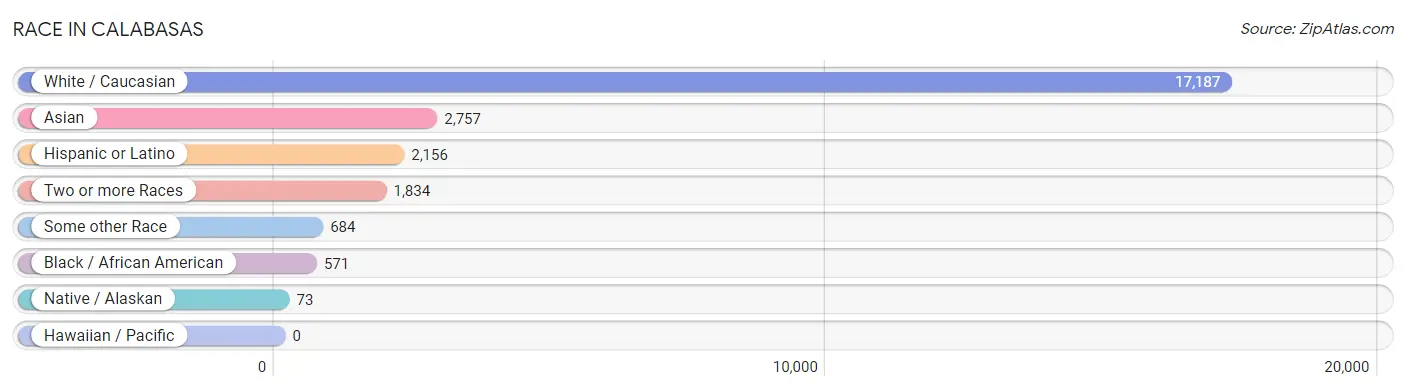
| Race | # Population | % Population |
| Asian | 2,757 | 11.9% |
| Black / African American | 571 | 2.5% |
| Hawaiian / Pacific | 0 | 0.0% |
| Hispanic or Latino | 2,156 | 9.3% |
| Native / Alaskan | 73 | 0.3% |
| White / Caucasian | 17,187 | 74.4% |
| Two or more Races | 1,834 | 7.9% |
| Some other Race | 684 | 3.0% |
| Total | 23,106 | 100.0% |
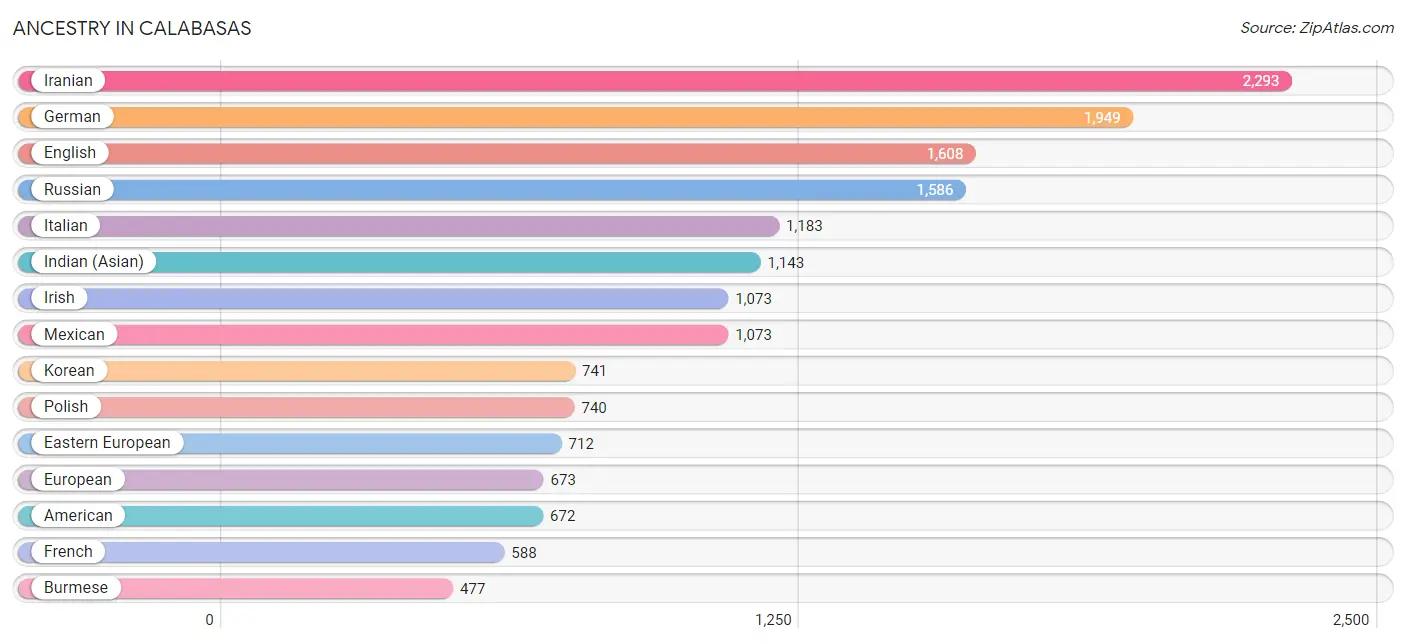
Ancestry in Calabasas
The most populous ancestries reported in Calabasas are Iranian (2,293 | 9.9%), German (1,949 | 8.4%), English (1,608 | 7.0%), Russian (1,586 | 6.9%), and Italian (1,183 | 5.1%), together accounting for 37.3% of all Calabasas residents.
| Ancestry | # Population | % Population |
| African | 48 | 0.2% |
| American | 672 | 2.9% |
| Arab | 359 | 1.5% |
| Argentinean | 10 | 0.0% |
| Armenian | 455 | 2.0% |
| Assyrian / Chaldean / Syriac | 41 | 0.2% |
| Australian | 39 | 0.2% |
| Austrian | 72 | 0.3% |
| Bhutanese | 158 | 0.7% |
| Brazilian | 136 | 0.6% |
| British | 278 | 1.2% |
| Bulgarian | 7 | 0.0% |
| Burmese | 477 | 2.1% |
| Canadian | 101 | 0.4% |
| Central American | 237 | 1.0% |
| Central American Indian | 27 | 0.1% |
| Cherokee | 66 | 0.3% |
| Chilean | 7 | 0.0% |
| Colombian | 228 | 1.0% |
| Croatian | 73 | 0.3% |
| Crow | 13 | 0.1% |
| Cuban | 142 | 0.6% |
| Czech | 112 | 0.5% |
| Czechoslovakian | 10 | 0.0% |
| Danish | 254 | 1.1% |
| Dutch | 135 | 0.6% |
| Eastern European | 712 | 3.1% |
| English | 1,608 | 7.0% |
| European | 673 | 2.9% |
| Filipino | 71 | 0.3% |
| French | 588 | 2.5% |
| French Canadian | 41 | 0.2% |
| German | 1,949 | 8.4% |
| Greek | 59 | 0.3% |
| Guatemalan | 66 | 0.3% |
| Honduran | 35 | 0.2% |
| Hungarian | 253 | 1.1% |
| Indian (Asian) | 1,143 | 5.0% |
| Iranian | 2,293 | 9.9% |
| Iraqi | 103 | 0.4% |
| Irish | 1,073 | 4.6% |
| Israeli | 130 | 0.6% |
| Italian | 1,183 | 5.1% |
| Jamaican | 21 | 0.1% |
| Japanese | 70 | 0.3% |
| Jordanian | 2 | 0.0% |
| Korean | 741 | 3.2% |
| Laotian | 66 | 0.3% |
| Lebanese | 126 | 0.5% |
| Lithuanian | 54 | 0.2% |
| Mexican | 1,073 | 4.6% |
| Mongolian | 7 | 0.0% |
| Moroccan | 40 | 0.2% |
| Native Hawaiian | 21 | 0.1% |
| Navajo | 41 | 0.2% |
| Northern European | 8 | 0.0% |
| Norwegian | 387 | 1.7% |
| Pakistani | 7 | 0.0% |
| Palestinian | 2 | 0.0% |
| Panamanian | 27 | 0.1% |
| Peruvian | 72 | 0.3% |
| Polish | 740 | 3.2% |
| Portuguese | 51 | 0.2% |
| Puerto Rican | 148 | 0.6% |
| Romanian | 121 | 0.5% |
| Russian | 1,586 | 6.9% |
| Salvadoran | 109 | 0.5% |
| Samoan | 41 | 0.2% |
| Scandinavian | 67 | 0.3% |
| Scotch-Irish | 91 | 0.4% |
| Scottish | 292 | 1.3% |
| Slavic | 104 | 0.4% |
| Slovak | 9 | 0.0% |
| Slovene | 62 | 0.3% |
| South African | 58 | 0.3% |
| South American | 339 | 1.5% |
| Spaniard | 115 | 0.5% |
| Spanish | 102 | 0.4% |
| Sri Lankan | 119 | 0.5% |
| Subsaharan African | 150 | 0.6% |
| Swedish | 137 | 0.6% |
| Swiss | 63 | 0.3% |
| Syrian | 9 | 0.0% |
| Thai | 469 | 2.0% |
| Tlingit-Haida | 13 | 0.1% |
| Turkish | 6 | 0.0% |
| Ukrainian | 326 | 1.4% |
| Venezuelan | 22 | 0.1% |
| Vietnamese | 5 | 0.0% |
| Yugoslavian | 37 | 0.2% | View All 90 Rows |
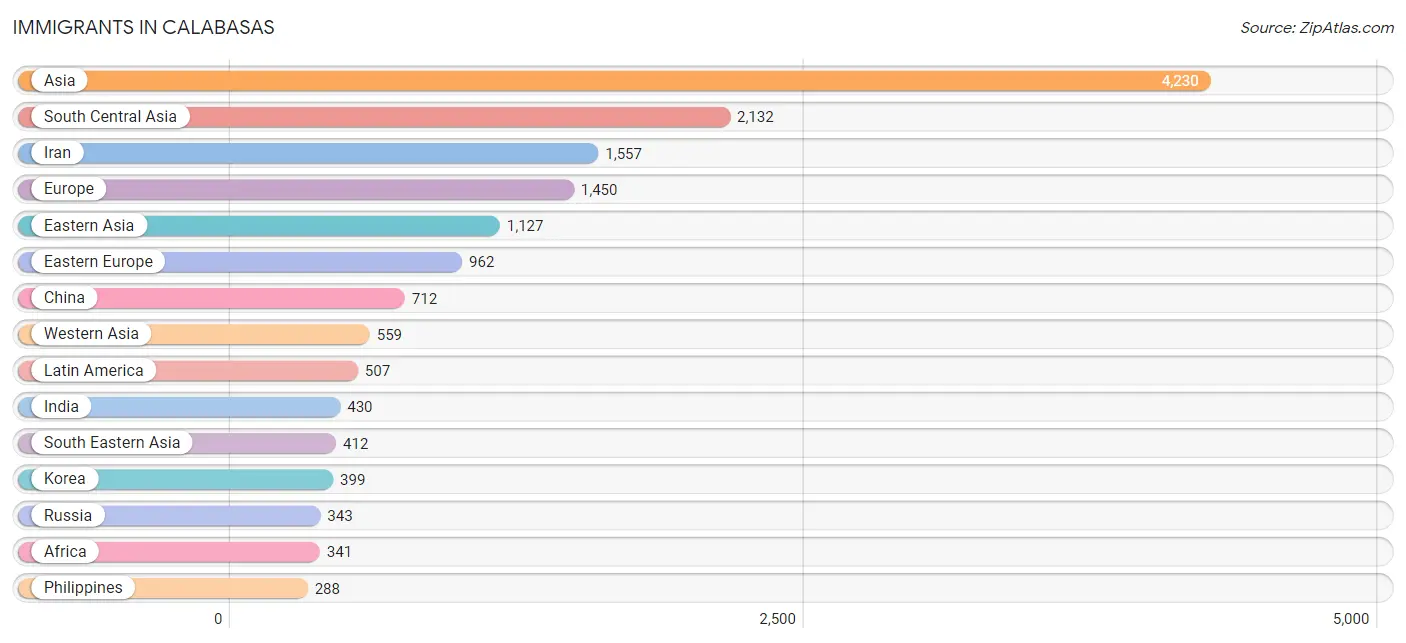
Immigrants in Calabasas
The most numerous immigrant groups reported in Calabasas came from Asia (4,230 | 18.3%), South Central Asia (2,132 | 9.2%), Iran (1,557 | 6.7%), Europe (1,450 | 6.3%), and Eastern Asia (1,127 | 4.9%), together accounting for 45.4% of all Calabasas residents.
| Immigration Origin | # Population | % Population |
| Afghanistan | 5 | 0.0% |
| Africa | 341 | 1.5% |
| Albania | 10 | 0.0% |
| Argentina | 19 | 0.1% |
| Armenia | 77 | 0.3% |
| Asia | 4,230 | 18.3% |
| Australia | 35 | 0.2% |
| Austria | 9 | 0.0% |
| Bangladesh | 5 | 0.0% |
| Belarus | 66 | 0.3% |
| Belgium | 10 | 0.0% |
| Brazil | 70 | 0.3% |
| Bulgaria | 7 | 0.0% |
| Canada | 180 | 0.8% |
| Caribbean | 31 | 0.1% |
| Central America | 254 | 1.1% |
| Chile | 7 | 0.0% |
| China | 712 | 3.1% |
| Colombia | 56 | 0.2% |
| Croatia | 15 | 0.1% |
| Cuba | 10 | 0.0% |
| Czechoslovakia | 58 | 0.3% |
| Eastern Africa | 47 | 0.2% |
| Eastern Asia | 1,127 | 4.9% |
| Eastern Europe | 962 | 4.2% |
| Egypt | 14 | 0.1% |
| El Salvador | 18 | 0.1% |
| England | 118 | 0.5% |
| Ethiopia | 28 | 0.1% |
| Europe | 1,450 | 6.3% |
| France | 42 | 0.2% |
| Germany | 171 | 0.7% |
| Guatemala | 41 | 0.2% |
| Honduras | 1 | 0.0% |
| Hong Kong | 141 | 0.6% |
| Hungary | 27 | 0.1% |
| India | 430 | 1.9% |
| Indonesia | 34 | 0.2% |
| Iran | 1,557 | 6.7% |
| Iraq | 95 | 0.4% |
| Ireland | 16 | 0.1% |
| Israel | 215 | 0.9% |
| Italy | 18 | 0.1% |
| Jamaica | 21 | 0.1% |
| Japan | 16 | 0.1% |
| Jordan | 2 | 0.0% |
| Kazakhstan | 20 | 0.1% |
| Korea | 399 | 1.7% |
| Kuwait | 58 | 0.3% |
| Latin America | 507 | 2.2% |
| Lebanon | 93 | 0.4% |
| Malaysia | 7 | 0.0% |
| Mexico | 194 | 0.8% |
| Morocco | 35 | 0.2% |
| Nepal | 7 | 0.0% |
| Netherlands | 27 | 0.1% |
| Northern Africa | 49 | 0.2% |
| Northern Europe | 200 | 0.9% |
| Oceania | 35 | 0.2% |
| Peru | 14 | 0.1% |
| Philippines | 288 | 1.3% |
| Romania | 116 | 0.5% |
| Russia | 343 | 1.5% |
| Scotland | 19 | 0.1% |
| Sierra Leone | 21 | 0.1% |
| Singapore | 22 | 0.1% |
| South Africa | 203 | 0.9% |
| South America | 222 | 1.0% |
| South Central Asia | 2,132 | 9.2% |
| South Eastern Asia | 412 | 1.8% |
| Southern Europe | 29 | 0.1% |
| Spain | 11 | 0.1% |
| Sweden | 30 | 0.1% |
| Syria | 8 | 0.0% |
| Taiwan | 38 | 0.2% |
| Thailand | 27 | 0.1% |
| Turkey | 11 | 0.1% |
| Ukraine | 228 | 1.0% |
| Uzbekistan | 12 | 0.1% |
| Venezuela | 56 | 0.2% |
| Vietnam | 29 | 0.1% |
| Western Africa | 21 | 0.1% |
| Western Asia | 559 | 2.4% |
| Western Europe | 259 | 1.1% |
| Zimbabwe | 11 | 0.1% | View All 85 Rows |
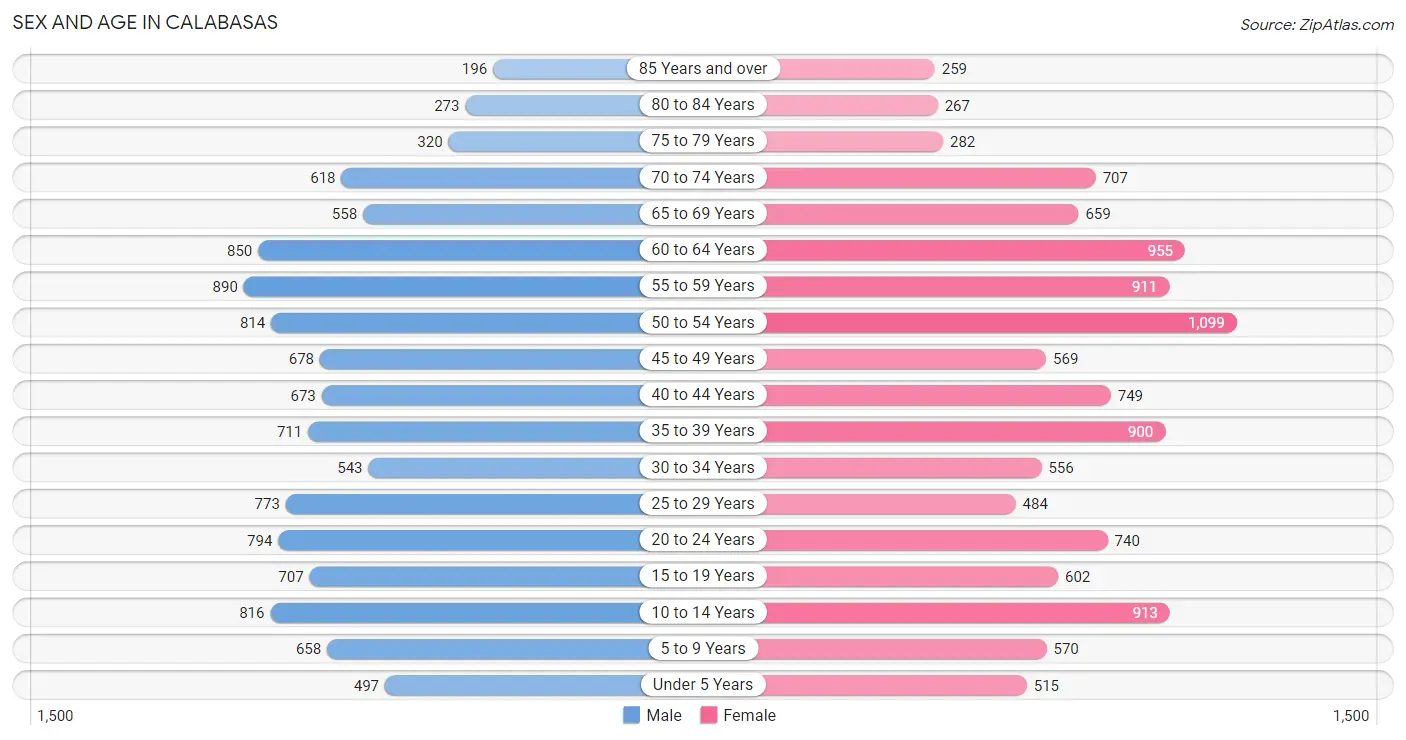
Sex and Age in Calabasas
Sex and Age in Calabasas
The most populous age groups in Calabasas are 55 to 59 Years (890 | 7.8%) for men and 50 to 54 Years (1,099 | 9.4%) for women.
| Age Bracket | Male | Female |
| Under 5 Years | 497 (4.4%) | 515 (4.4%) |
| 5 to 9 Years | 658 (5.8%) | 570 (4.9%) |
| 10 to 14 Years | 816 (7.2%) | 913 (7.8%) |
| 15 to 19 Years | 707 (6.2%) | 602 (5.1%) |
| 20 to 24 Years | 794 (7.0%) | 740 (6.3%) |
| 25 to 29 Years | 773 (6.8%) | 484 (4.1%) |
| 30 to 34 Years | 543 (4.8%) | 556 (4.7%) |
| 35 to 39 Years | 711 (6.2%) | 900 (7.7%) |
| 40 to 44 Years | 673 (5.9%) | 749 (6.4%) |
| 45 to 49 Years | 678 (6.0%) | 569 (4.9%) |
| 50 to 54 Years | 814 (7.2%) | 1,099 (9.4%) |
| 55 to 59 Years | 890 (7.8%) | 911 (7.8%) |
| 60 to 64 Years | 850 (7.5%) | 955 (8.1%) |
| 65 to 69 Years | 558 (4.9%) | 659 (5.6%) |
| 70 to 74 Years | 618 (5.4%) | 707 (6.0%) |
| 75 to 79 Years | 320 (2.8%) | 282 (2.4%) |
| 80 to 84 Years | 273 (2.4%) | 267 (2.3%) |
| 85 Years and over | 196 (1.7%) | 259 (2.2%) |
| Total | 11,369 (100.0%) | 11,737 (100.0%) |
Families and Households in Calabasas
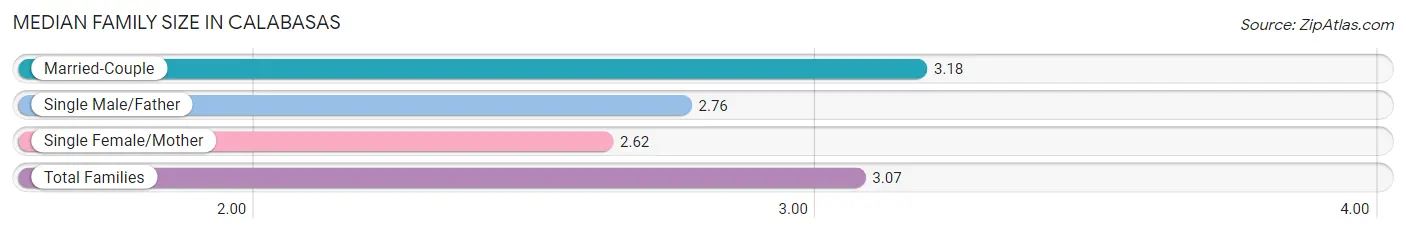
Median Family Size in Calabasas
The median family size in Calabasas is 3.07 persons per family, with married-couple families (4,962 | 79.6%) accounting for the largest median family size of 3.18 persons per family. On the other hand, single female/mother families (881 | 14.1%) represent the smallest median family size with 2.62 persons per family.
| Family Type | # Families | Family Size |
| Married-Couple | 4,962 (79.6%) | 3.18 |
| Single Male/Father | 393 (6.3%) | 2.76 |
| Single Female/Mother | 881 (14.1%) | 2.62 |
| Total Families | 6,236 (100.0%) | 3.07 |
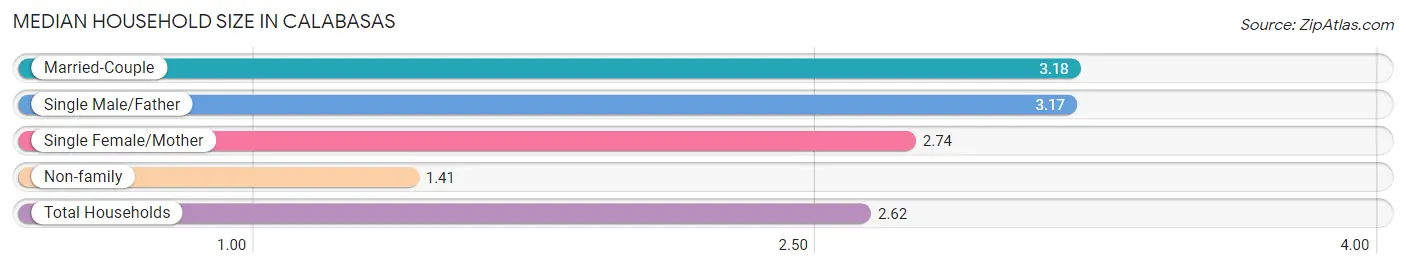
Median Household Size in Calabasas
The median household size in Calabasas is 2.62 persons per household, with married-couple households (4,962 | 56.3%) accounting for the largest median household size of 3.18 persons per household. non-family households (2,583 | 29.3%) represent the smallest median household size with 1.41 persons per household.
| Household Type | # Households | Household Size |
| Married-Couple | 4,962 (56.3%) | 3.18 |
| Single Male/Father | 393 (4.5%) | 3.17 |
| Single Female/Mother | 881 (10.0%) | 2.74 |
| Non-family | 2,583 (29.3%) | 1.41 |
| Total Households | 8,819 (100.0%) | 2.62 |
Household Size by Marriage Status in Calabasas
Out of a total of 8,819 households in Calabasas, 6,236 (70.7%) are family households, while 2,583 (29.3%) are nonfamily households. The most numerous type of family households are 2-person households, comprising 2,670, and the most common type of nonfamily households are 1-person households, comprising 1,709.
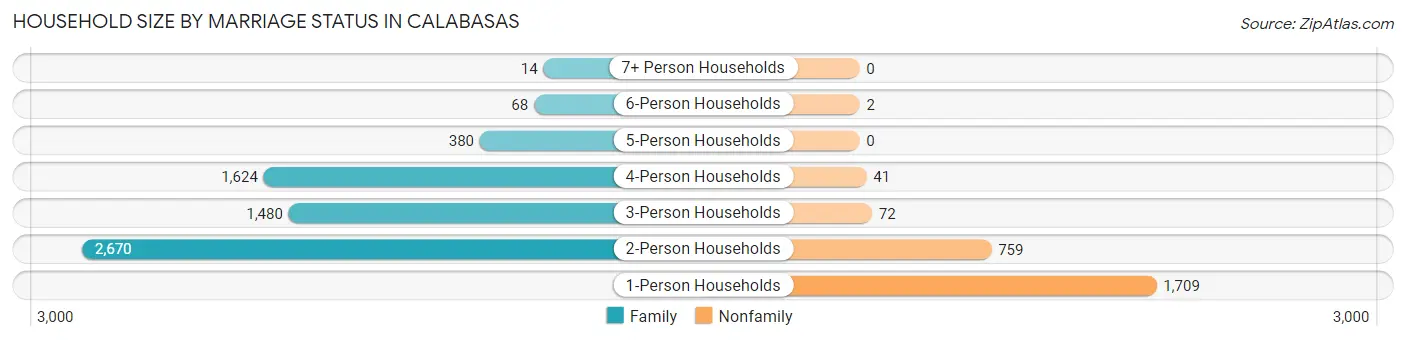
| Household Size | Family Households | Nonfamily Households |
| 1-Person Households | - | 1,709 (19.4%) |
| 2-Person Households | 2,670 (30.3%) | 759 (8.6%) |
| 3-Person Households | 1,480 (16.8%) | 72 (0.8%) |
| 4-Person Households | 1,624 (18.4%) | 41 (0.5%) |
| 5-Person Households | 380 (4.3%) | 0 (0.0%) |
| 6-Person Households | 68 (0.8%) | 2 (0.0%) |
| 7+ Person Households | 14 (0.2%) | 0 (0.0%) |
| Total | 6,236 (70.7%) | 2,583 (29.3%) |
Female Fertility in Calabasas
Fertility by Age in Calabasas
Average fertility rate in Calabasas is 26.0 births per 1,000 women. Women in the age bracket of 20 to 34 years have the highest fertility rate with 37.0 births per 1,000 women. Women in the age bracket of 20 to 34 years acount for 51.2% of all women with births.
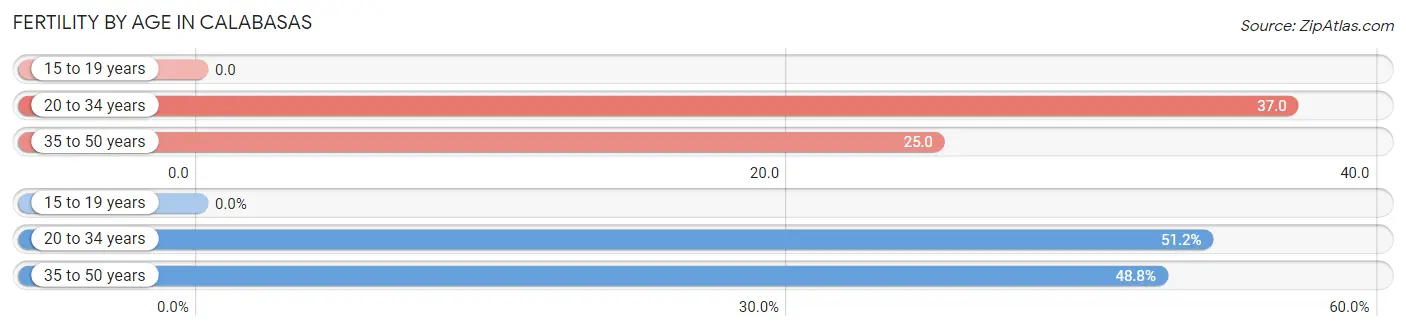
| Age Bracket | Women with Births | Births / 1,000 Women |
| 15 to 19 years | 0 (0.0%) | 0.0 |
| 20 to 34 years | 66 (51.2%) | 37.0 |
| 35 to 50 years | 63 (48.8%) | 25.0 |
| Total | 129 (100.0%) | 26.0 |
Fertility by Age by Marriage Status in Calabasas
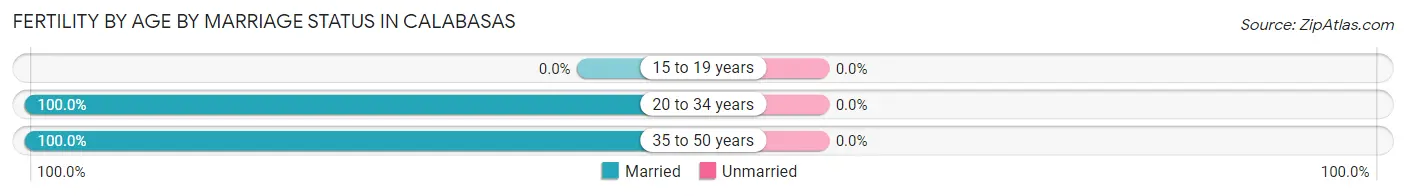
| Age Bracket | Married | Unmarried |
| 15 to 19 years | 0 (0.0%) | 0 (0.0%) |
| 20 to 34 years | 66 (100.0%) | 0 (0.0%) |
| 35 to 50 years | 63 (100.0%) | 0 (0.0%) |
| Total | 129 (100.0%) | 0 (0.0%) |
Fertility by Education in Calabasas
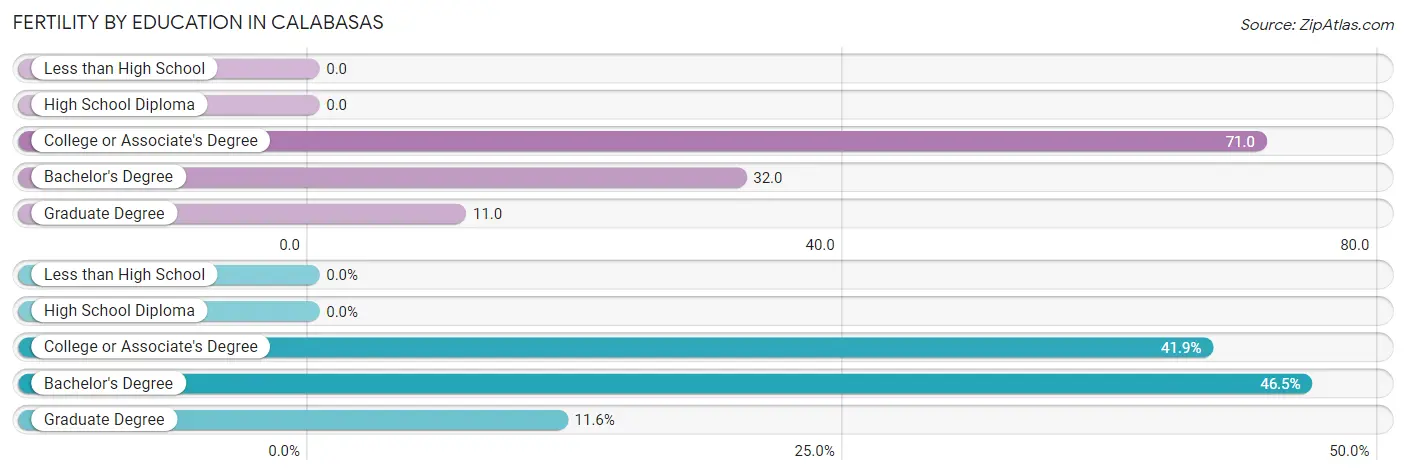
| Educational Attainment | Women with Births | Births / 1,000 Women |
| Less than High School | 0 (0.0%) | 0.0 |
| High School Diploma | 0 (0.0%) | 0.0 |
| College or Associate's Degree | 54 (41.9%) | 71.0 |
| Bachelor's Degree | 60 (46.5%) | 32.0 |
| Graduate Degree | 15 (11.6%) | 11.0 |
| Total | 129 (100.0%) | 26.0 |
Fertility by Education by Marriage Status in Calabasas
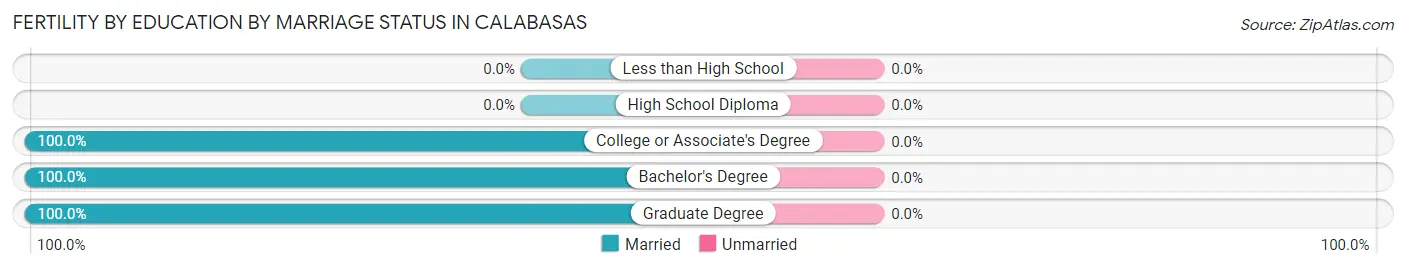
| Educational Attainment | Married | Unmarried |
| Less than High School | 0 (0.0%) | 0 (0.0%) |
| High School Diploma | 0 (0.0%) | 0 (0.0%) |
| College or Associate's Degree | 54 (100.0%) | 0 (0.0%) |
| Bachelor's Degree | 60 (100.0%) | 0 (0.0%) |
| Graduate Degree | 15 (100.0%) | 0 (0.0%) |
| Total | 129 (100.0%) | 0 (0.0%) |
Employment Characteristics in Calabasas
Employment by Class of Employer in Calabasas
Among the 10,684 employed individuals in Calabasas, private company employees (6,072 | 56.8%), self-employed (incorporated) (1,520 | 14.2%), and self-employed (not incorporated) (1,139 | 10.7%) make up the most common classes of employment.
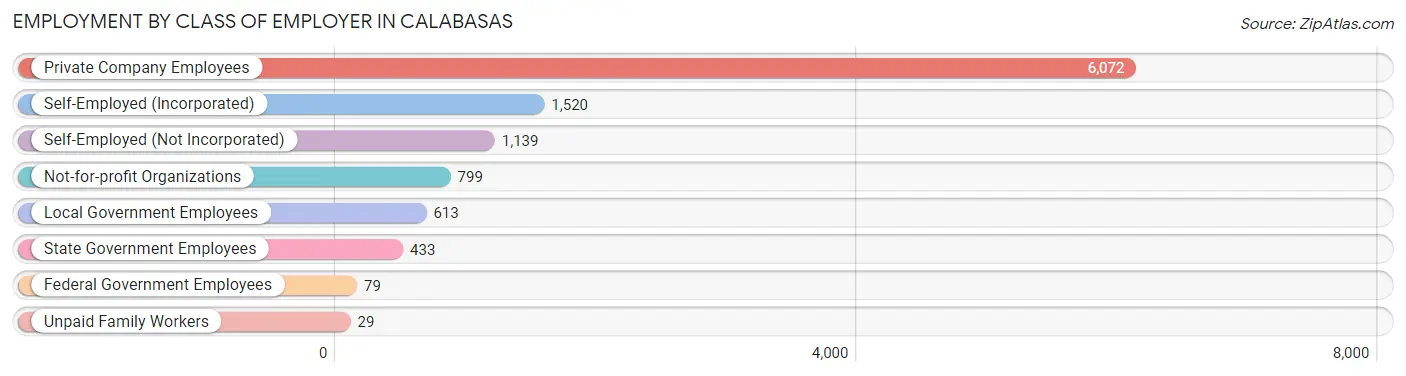
| Employer Class | # Employees | % Employees |
| Private Company Employees | 6,072 | 56.8% |
| Self-Employed (Incorporated) | 1,520 | 14.2% |
| Self-Employed (Not Incorporated) | 1,139 | 10.7% |
| Not-for-profit Organizations | 799 | 7.5% |
| Local Government Employees | 613 | 5.7% |
| State Government Employees | 433 | 4.1% |
| Federal Government Employees | 79 | 0.7% |
| Unpaid Family Workers | 29 | 0.3% |
| Total | 10,684 | 100.0% |
Employment Status by Age in Calabasas
According to the labor force statistics for Calabasas, out of the total population over 16 years of age (18,692), 64.5% or 12,056 individuals are in the labor force, with 9.4% or 1,133 of them unemployed. The age group with the highest labor force participation rate is 35 to 44 years, with 87.4% or 2,651 individuals in the labor force. Within the labor force, the 16 to 19 years age range has the highest percentage of unemployed individuals, with 46.8% or 133 of them being unemployed.
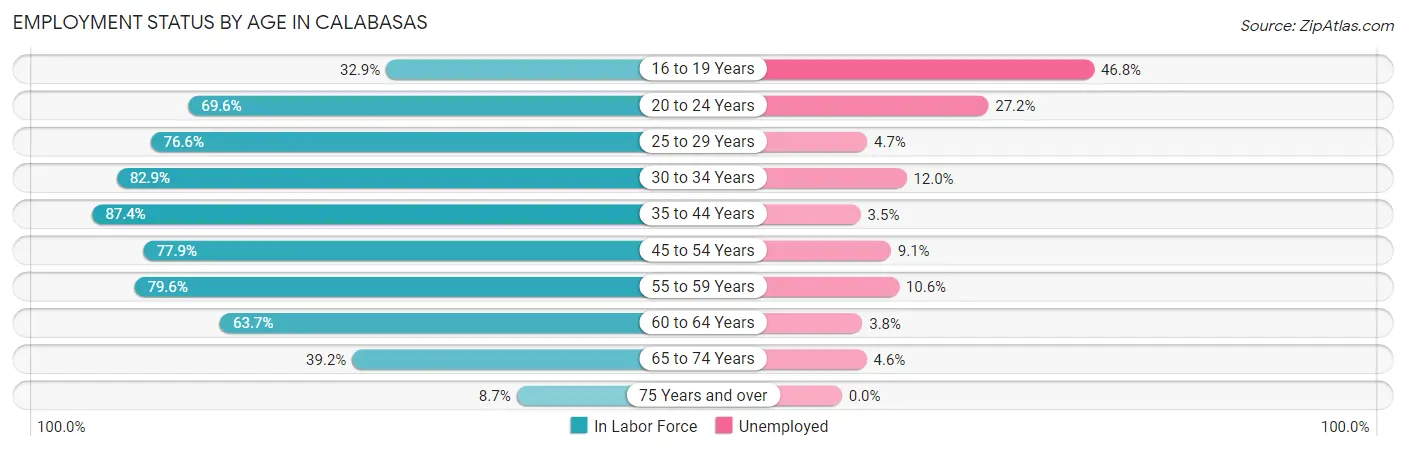
| Age Bracket | In Labor Force | Unemployed |
| 16 to 19 Years | 284 (32.9%) | 133 (46.8%) |
| 20 to 24 Years | 1,068 (69.6%) | 290 (27.2%) |
| 25 to 29 Years | 963 (76.6%) | 45 (4.7%) |
| 30 to 34 Years | 911 (82.9%) | 109 (12.0%) |
| 35 to 44 Years | 2,651 (87.4%) | 93 (3.5%) |
| 45 to 54 Years | 2,462 (77.9%) | 224 (9.1%) |
| 55 to 59 Years | 1,434 (79.6%) | 152 (10.6%) |
| 60 to 64 Years | 1,150 (63.7%) | 44 (3.8%) |
| 65 to 74 Years | 996 (39.2%) | 46 (4.6%) |
| 75 Years and over | 139 (8.7%) | 0 (0.0%) |
| Total | 12,056 (64.5%) | 1,133 (9.4%) |
Employment Status by Educational Attainment in Calabasas
According to labor force statistics for Calabasas, 78.7% of individuals (9,566) out of the total population between 25 and 64 years of age (12,155) are in the labor force, with 7.0% or 670 of them being unemployed. The group with the highest labor force participation rate are those with the educational attainment of bachelor's degree or higher, with 80.5% or 7,250 individuals in the labor force. Within the labor force, individuals with high school diploma education have the highest percentage of unemployment, with 28.9% or 166 of them being unemployed.
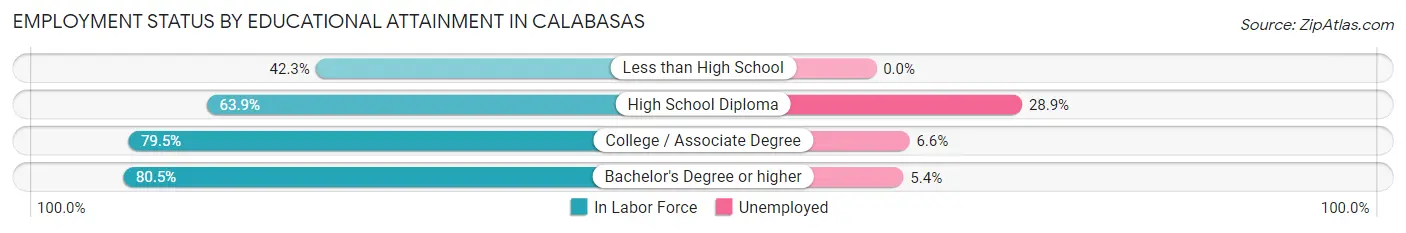
| Educational Attainment | In Labor Force | Unemployed |
| Less than High School | 47 (42.3%) | 0 (0.0%) |
| High School Diploma | 574 (63.9%) | 260 (28.9%) |
| College / Associate Degree | 1,701 (79.5%) | 141 (6.6%) |
| Bachelor's Degree or higher | 7,250 (80.5%) | 486 (5.4%) |
| Total | 9,566 (78.7%) | 851 (7.0%) |
Employment Occupations by Sex in Calabasas
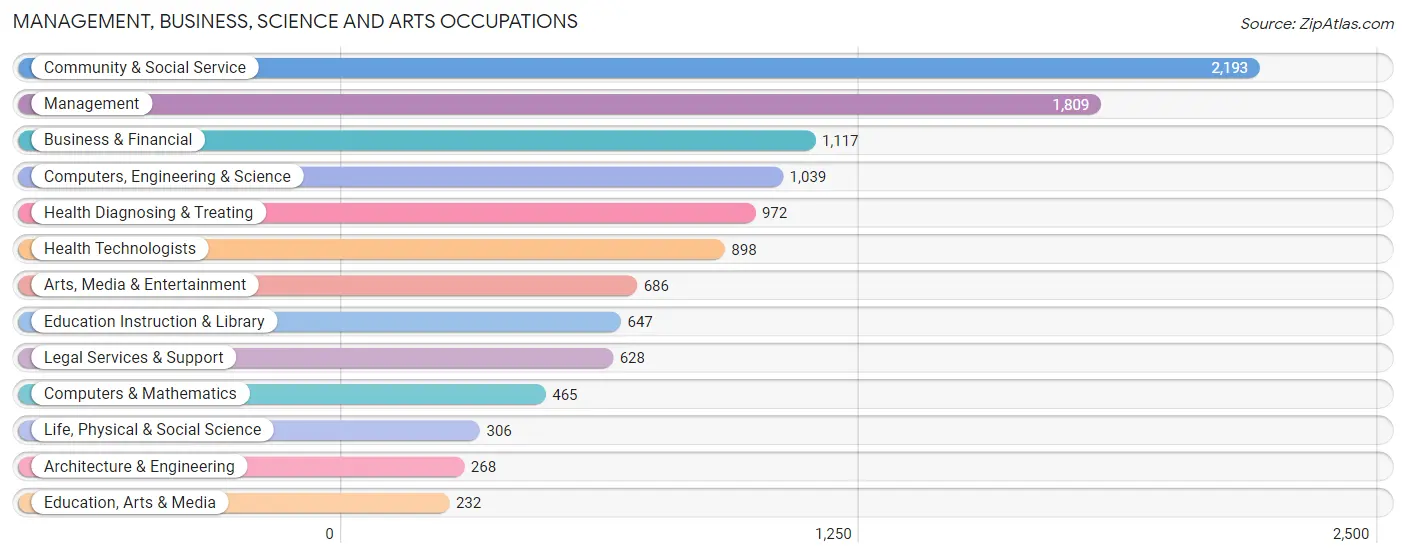
Management, Business, Science and Arts Occupations
The most common Management, Business, Science and Arts occupations in Calabasas are Community & Social Service (2,193 | 20.1%), Management (1,809 | 16.6%), Business & Financial (1,117 | 10.2%), Computers, Engineering & Science (1,039 | 9.5%), and Health Diagnosing & Treating (972 | 8.9%).
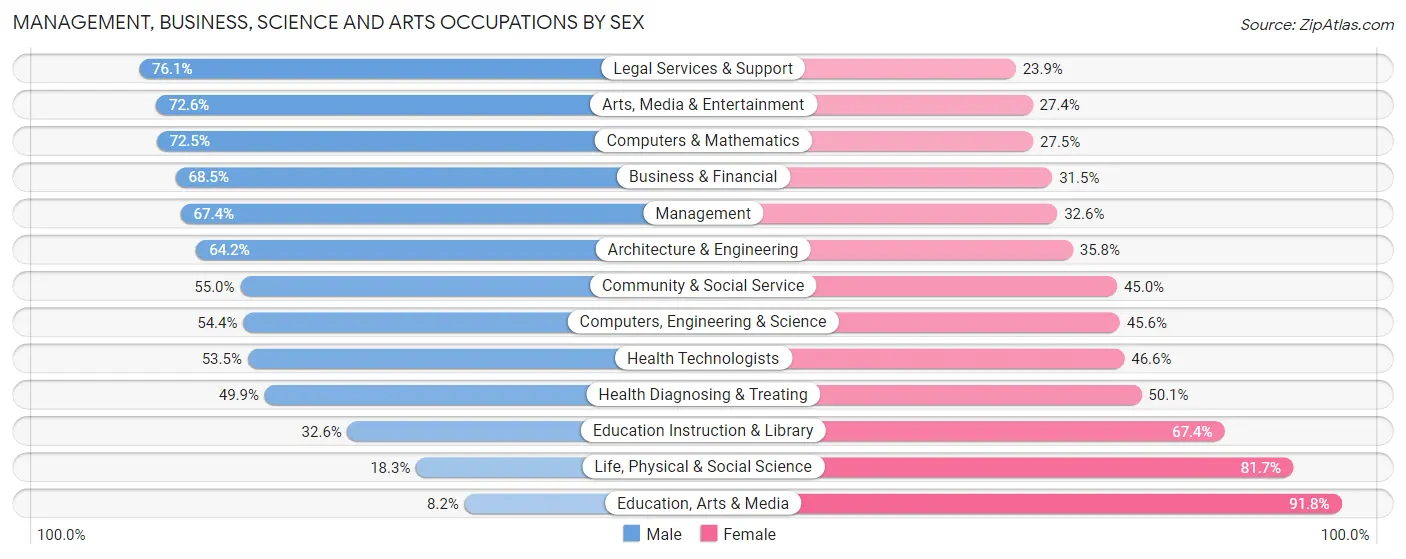
Management, Business, Science and Arts Occupations by Sex
Within the Management, Business, Science and Arts occupations in Calabasas, the most male-oriented occupations are Legal Services & Support (76.1%), Arts, Media & Entertainment (72.6%), and Computers & Mathematics (72.5%), while the most female-oriented occupations are Education, Arts & Media (91.8%), Life, Physical & Social Science (81.7%), and Education Instruction & Library (67.4%).
| Occupation | Male | Female |
| Management | 1,220 (67.4%) | 589 (32.6%) |
| Business & Financial | 765 (68.5%) | 352 (31.5%) |
| Computers, Engineering & Science | 565 (54.4%) | 474 (45.6%) |
| Computers & Mathematics | 337 (72.5%) | 128 (27.5%) |
| Architecture & Engineering | 172 (64.2%) | 96 (35.8%) |
| Life, Physical & Social Science | 56 (18.3%) | 250 (81.7%) |
| Community & Social Service | 1,206 (55.0%) | 987 (45.0%) |
| Education, Arts & Media | 19 (8.2%) | 213 (91.8%) |
| Legal Services & Support | 478 (76.1%) | 150 (23.9%) |
| Education Instruction & Library | 211 (32.6%) | 436 (67.4%) |
| Arts, Media & Entertainment | 498 (72.6%) | 188 (27.4%) |
| Health Diagnosing & Treating | 485 (49.9%) | 487 (50.1%) |
| Health Technologists | 480 (53.4%) | 418 (46.6%) |
| Total (Category) | 4,241 (59.5%) | 2,889 (40.5%) |
| Total (Overall) | 5,928 (54.4%) | 4,967 (45.6%) |
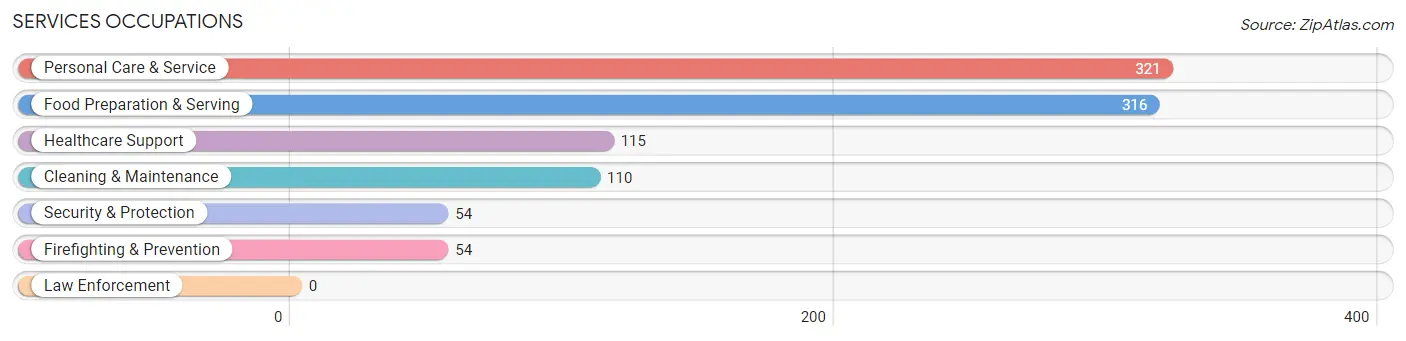
Services Occupations
The most common Services occupations in Calabasas are Personal Care & Service (321 | 2.9%), Food Preparation & Serving (316 | 2.9%), Healthcare Support (115 | 1.1%), Cleaning & Maintenance (110 | 1.0%), and Security & Protection (54 | 0.5%).
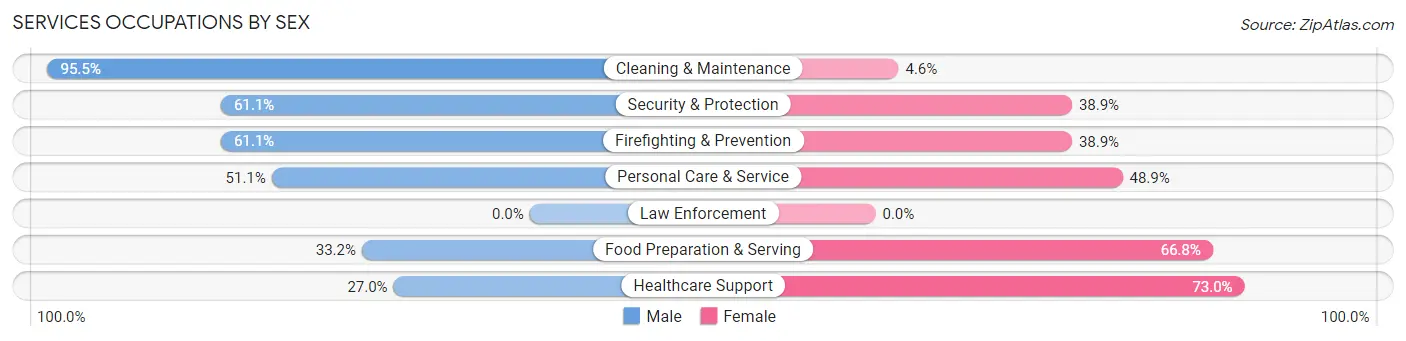
Services Occupations by Sex
Within the Services occupations in Calabasas, the most male-oriented occupations are Cleaning & Maintenance (95.5%), Security & Protection (61.1%), and Firefighting & Prevention (61.1%), while the most female-oriented occupations are Healthcare Support (73.0%), Food Preparation & Serving (66.8%), and Personal Care & Service (48.9%).
| Occupation | Male | Female |
| Healthcare Support | 31 (27.0%) | 84 (73.0%) |
| Security & Protection | 33 (61.1%) | 21 (38.9%) |
| Firefighting & Prevention | 33 (61.1%) | 21 (38.9%) |
| Law Enforcement | 0 (0.0%) | 0 (0.0%) |
| Food Preparation & Serving | 105 (33.2%) | 211 (66.8%) |
| Cleaning & Maintenance | 105 (95.5%) | 5 (4.5%) |
| Personal Care & Service | 164 (51.1%) | 157 (48.9%) |
| Total (Category) | 438 (47.8%) | 478 (52.2%) |
| Total (Overall) | 5,928 (54.4%) | 4,967 (45.6%) |
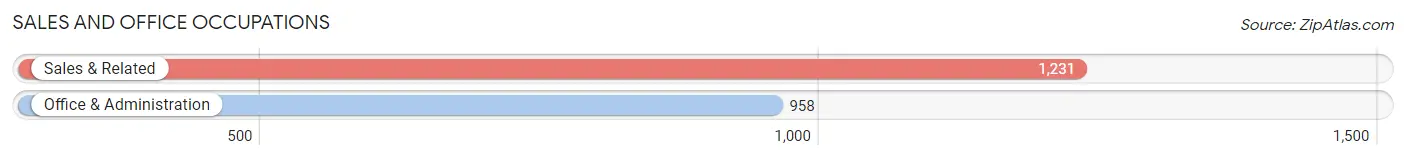
Sales and Office Occupations
The most common Sales and Office occupations in Calabasas are Sales & Related (1,231 | 11.3%), and Office & Administration (958 | 8.8%).
Sales and Office Occupations by Sex
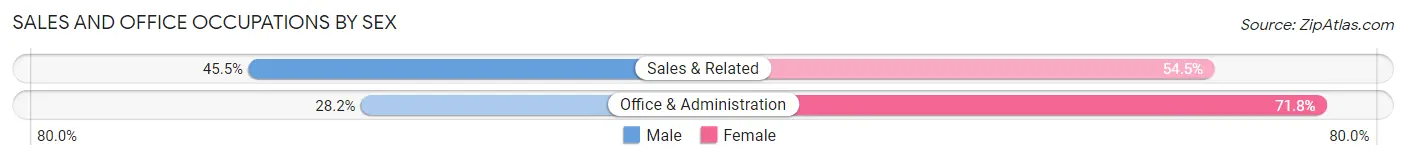
| Occupation | Male | Female |
| Sales & Related | 560 (45.5%) | 671 (54.5%) |
| Office & Administration | 270 (28.2%) | 688 (71.8%) |
| Total (Category) | 830 (37.9%) | 1,359 (62.1%) |
| Total (Overall) | 5,928 (54.4%) | 4,967 (45.6%) |
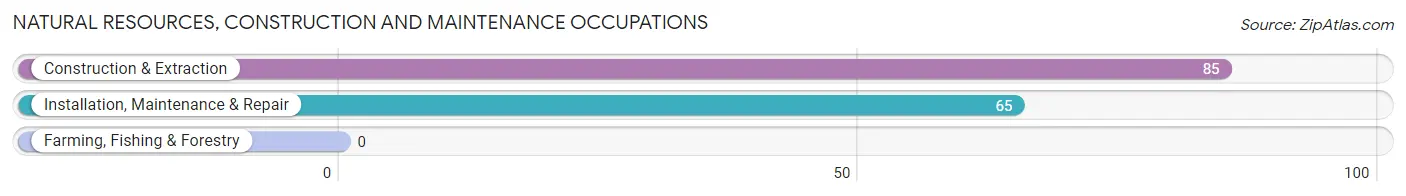
Natural Resources, Construction and Maintenance Occupations
The most common Natural Resources, Construction and Maintenance occupations in Calabasas are Construction & Extraction (85 | 0.8%), and Installation, Maintenance & Repair (65 | 0.6%).
Natural Resources, Construction and Maintenance Occupations by Sex
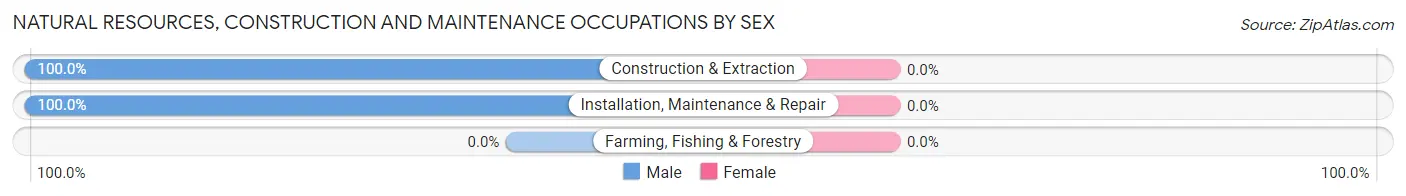
| Occupation | Male | Female |
| Farming, Fishing & Forestry | 0 (0.0%) | 0 (0.0%) |
| Construction & Extraction | 85 (100.0%) | 0 (0.0%) |
| Installation, Maintenance & Repair | 65 (100.0%) | 0 (0.0%) |
| Total (Category) | 150 (100.0%) | 0 (0.0%) |
| Total (Overall) | 5,928 (54.4%) | 4,967 (45.6%) |
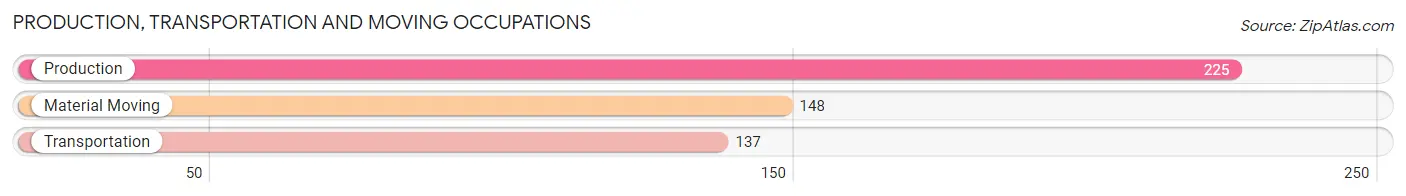
Production, Transportation and Moving Occupations
The most common Production, Transportation and Moving occupations in Calabasas are Production (225 | 2.1%), Material Moving (148 | 1.4%), and Transportation (137 | 1.3%).
Production, Transportation and Moving Occupations by Sex
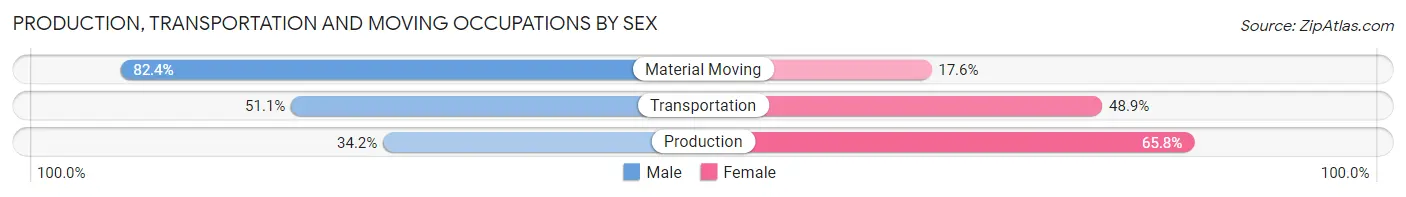
| Occupation | Male | Female |
| Production | 77 (34.2%) | 148 (65.8%) |
| Transportation | 70 (51.1%) | 67 (48.9%) |
| Material Moving | 122 (82.4%) | 26 (17.6%) |
| Total (Category) | 269 (52.7%) | 241 (47.2%) |
| Total (Overall) | 5,928 (54.4%) | 4,967 (45.6%) |
Employment Industries by Sex in Calabasas
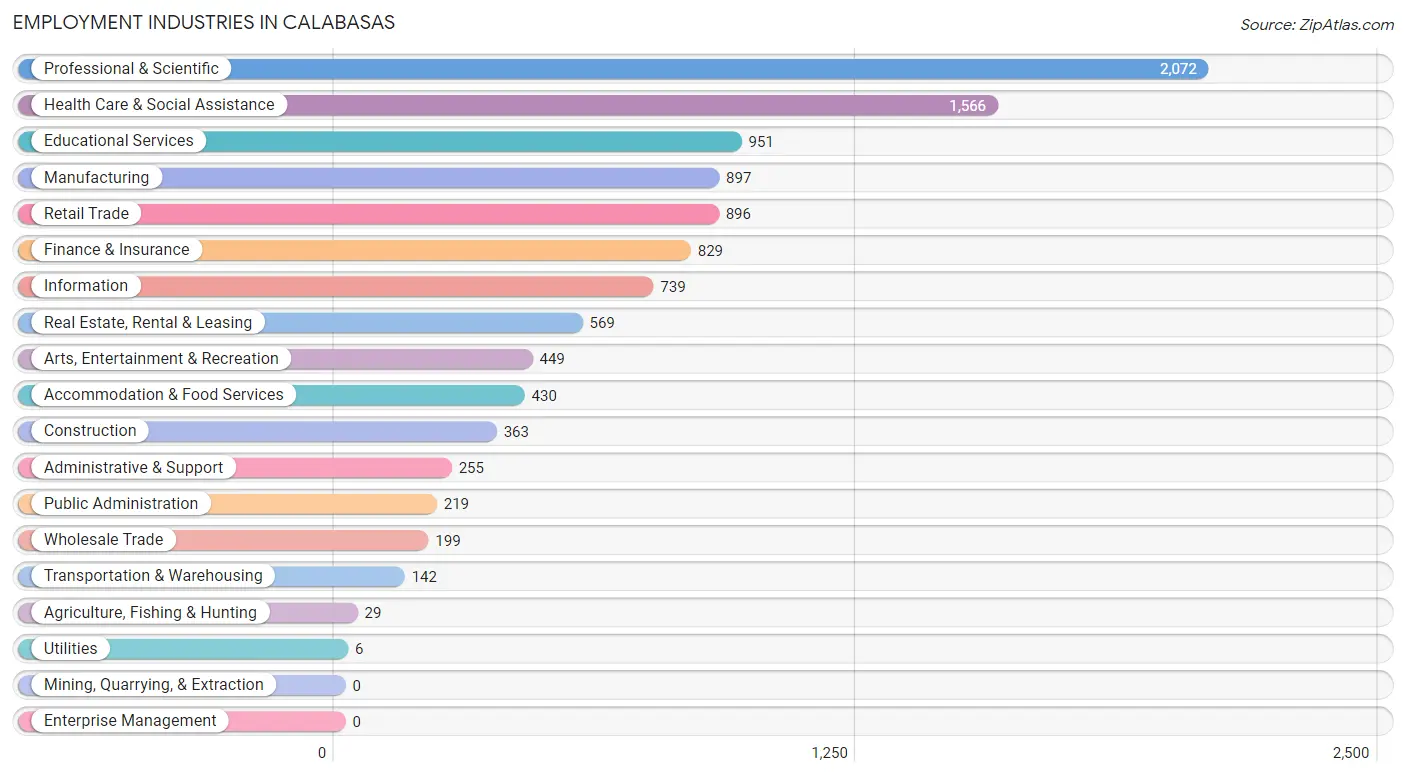
Employment Industries in Calabasas
The major employment industries in Calabasas include Professional & Scientific (2,072 | 19.0%), Health Care & Social Assistance (1,566 | 14.4%), Educational Services (951 | 8.7%), Manufacturing (897 | 8.2%), and Retail Trade (896 | 8.2%).
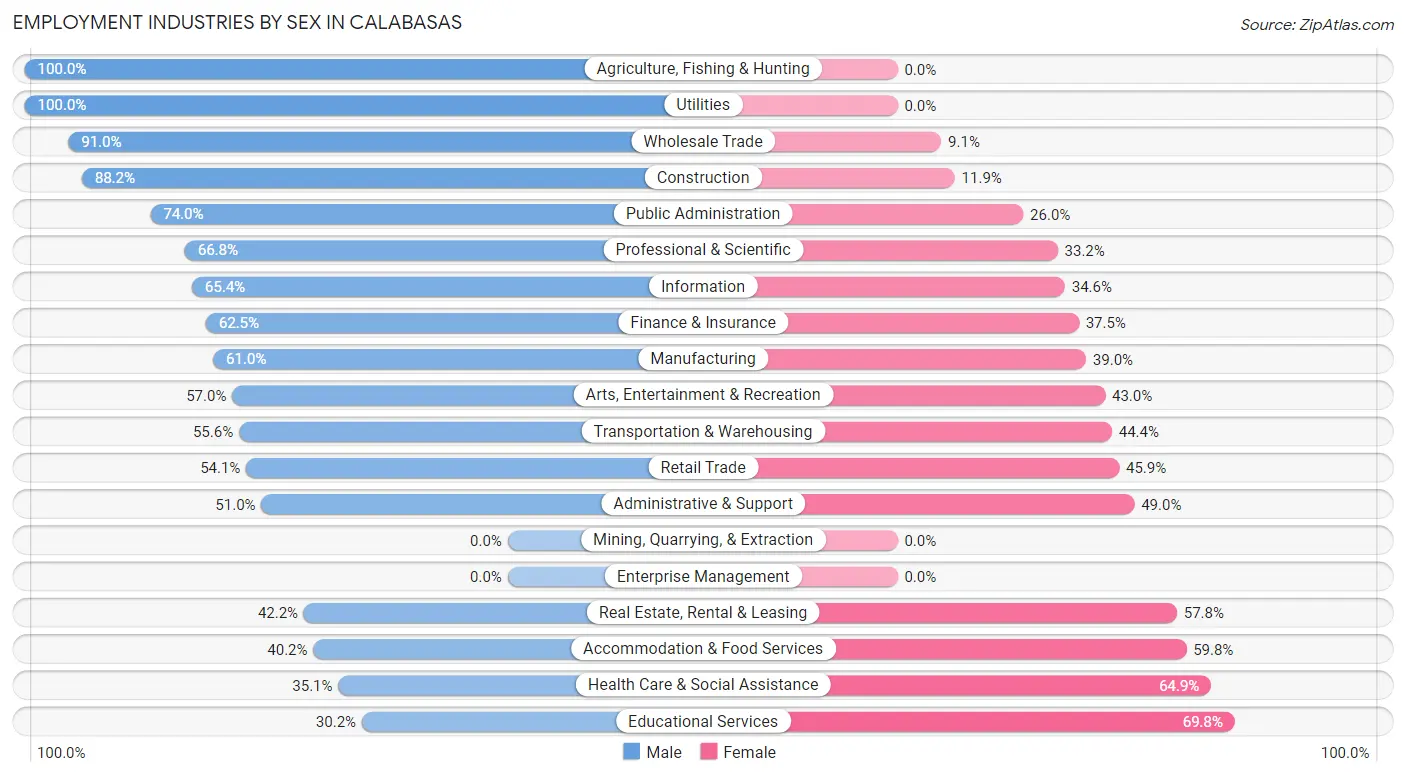
Employment Industries by Sex in Calabasas
The Calabasas industries that see more men than women are Agriculture, Fishing & Hunting (100.0%), Utilities (100.0%), and Wholesale Trade (90.9%), whereas the industries that tend to have a higher number of women are Educational Services (69.8%), Health Care & Social Assistance (64.9%), and Accommodation & Food Services (59.8%).
| Industry | Male | Female |
| Agriculture, Fishing & Hunting | 29 (100.0%) | 0 (0.0%) |
| Mining, Quarrying, & Extraction | 0 (0.0%) | 0 (0.0%) |
| Construction | 320 (88.1%) | 43 (11.8%) |
| Manufacturing | 547 (61.0%) | 350 (39.0%) |
| Wholesale Trade | 181 (90.9%) | 18 (9.0%) |
| Retail Trade | 485 (54.1%) | 411 (45.9%) |
| Transportation & Warehousing | 79 (55.6%) | 63 (44.4%) |
| Utilities | 6 (100.0%) | 0 (0.0%) |
| Information | 483 (65.4%) | 256 (34.6%) |
| Finance & Insurance | 518 (62.5%) | 311 (37.5%) |
| Real Estate, Rental & Leasing | 240 (42.2%) | 329 (57.8%) |
| Professional & Scientific | 1,385 (66.8%) | 687 (33.2%) |
| Enterprise Management | 0 (0.0%) | 0 (0.0%) |
| Administrative & Support | 130 (51.0%) | 125 (49.0%) |
| Educational Services | 287 (30.2%) | 664 (69.8%) |
| Health Care & Social Assistance | 549 (35.1%) | 1,017 (64.9%) |
| Arts, Entertainment & Recreation | 256 (57.0%) | 193 (43.0%) |
| Accommodation & Food Services | 173 (40.2%) | 257 (59.8%) |
| Public Administration | 162 (74.0%) | 57 (26.0%) |
| Total | 5,928 (54.4%) | 4,967 (45.6%) |
Education in Calabasas
School Enrollment in Calabasas
The most common levels of schooling among the 5,915 students in Calabasas are high school (1,280 | 21.6%), middle school (1,256 | 21.2%), and college / undergraduate (1,134 | 19.2%).
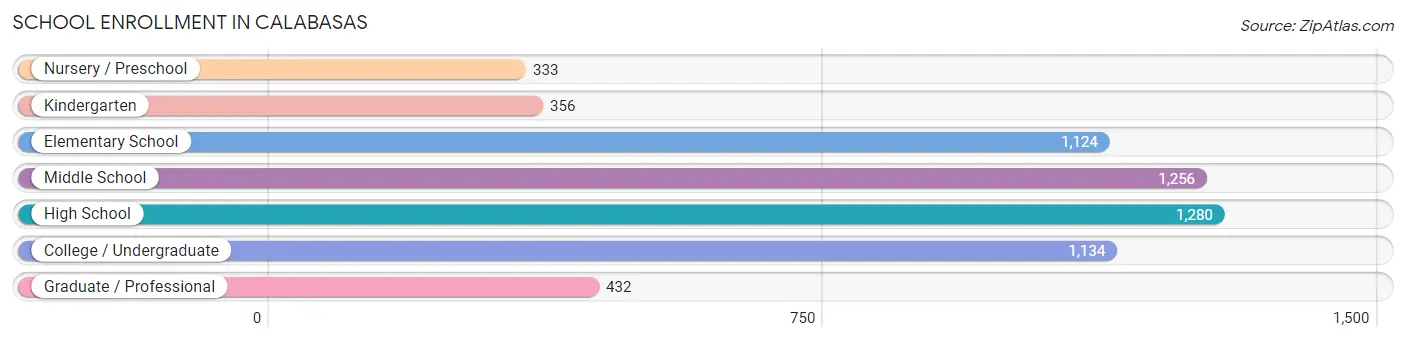
| School Level | # Students | % Students |
| Nursery / Preschool | 333 | 5.6% |
| Kindergarten | 356 | 6.0% |
| Elementary School | 1,124 | 19.0% |
| Middle School | 1,256 | 21.2% |
| High School | 1,280 | 21.6% |
| College / Undergraduate | 1,134 | 19.2% |
| Graduate / Professional | 432 | 7.3% |
| Total | 5,915 | 100.0% |
School Enrollment by Age by Funding Source in Calabasas
Out of a total of 5,915 students who are enrolled in schools in Calabasas, 1,638 (27.7%) attend a private institution, while the remaining 4,277 (72.3%) are enrolled in public schools. The age group of 3 to 4 year olds has the highest likelihood of being enrolled in private schools, with 217 (72.6% in the age bracket) enrolled. Conversely, the age group of 5 to 9 year old has the lowest likelihood of being enrolled in a private school, with 1,054 (89.0% in the age bracket) attending a public institution.
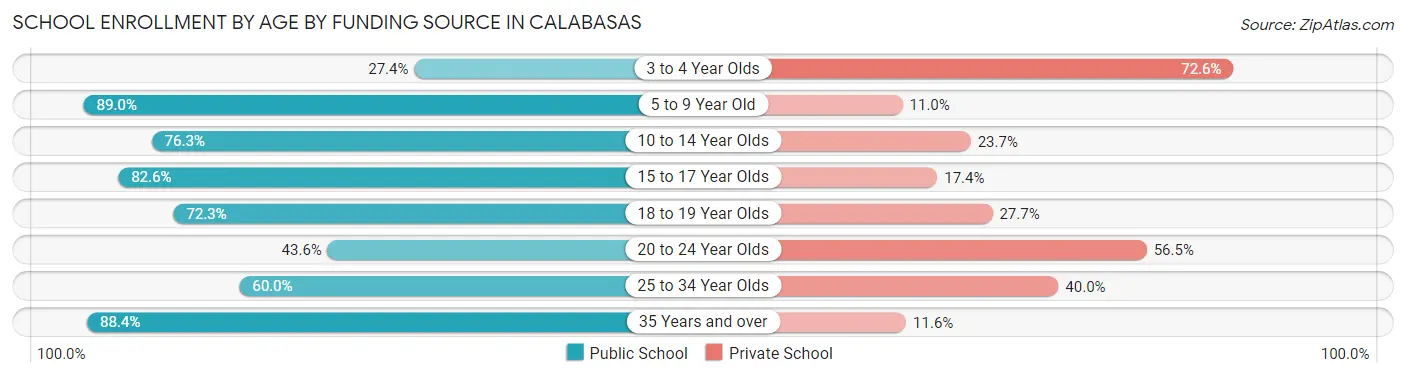
| Age Bracket | Public School | Private School |
| 3 to 4 Year Olds | 82 (27.4%) | 217 (72.6%) |
| 5 to 9 Year Old | 1,054 (89.0%) | 130 (11.0%) |
| 10 to 14 Year Olds | 1,303 (76.3%) | 404 (23.7%) |
| 15 to 17 Year Olds | 762 (82.6%) | 161 (17.4%) |
| 18 to 19 Year Olds | 266 (72.3%) | 102 (27.7%) |
| 20 to 24 Year Olds | 375 (43.5%) | 486 (56.5%) |
| 25 to 34 Year Olds | 153 (60.0%) | 102 (40.0%) |
| 35 Years and over | 281 (88.4%) | 37 (11.6%) |
| Total | 4,277 (72.3%) | 1,638 (27.7%) |
Educational Attainment by Field of Study in Calabasas
Business (2,136 | 17.3%), social sciences (2,081 | 16.8%), communications (996 | 8.1%), psychology (876 | 7.1%), and bio, nature & agricultural (796 | 6.4%) are the most common fields of study among 12,372 individuals in Calabasas who have obtained a bachelor's degree or higher.
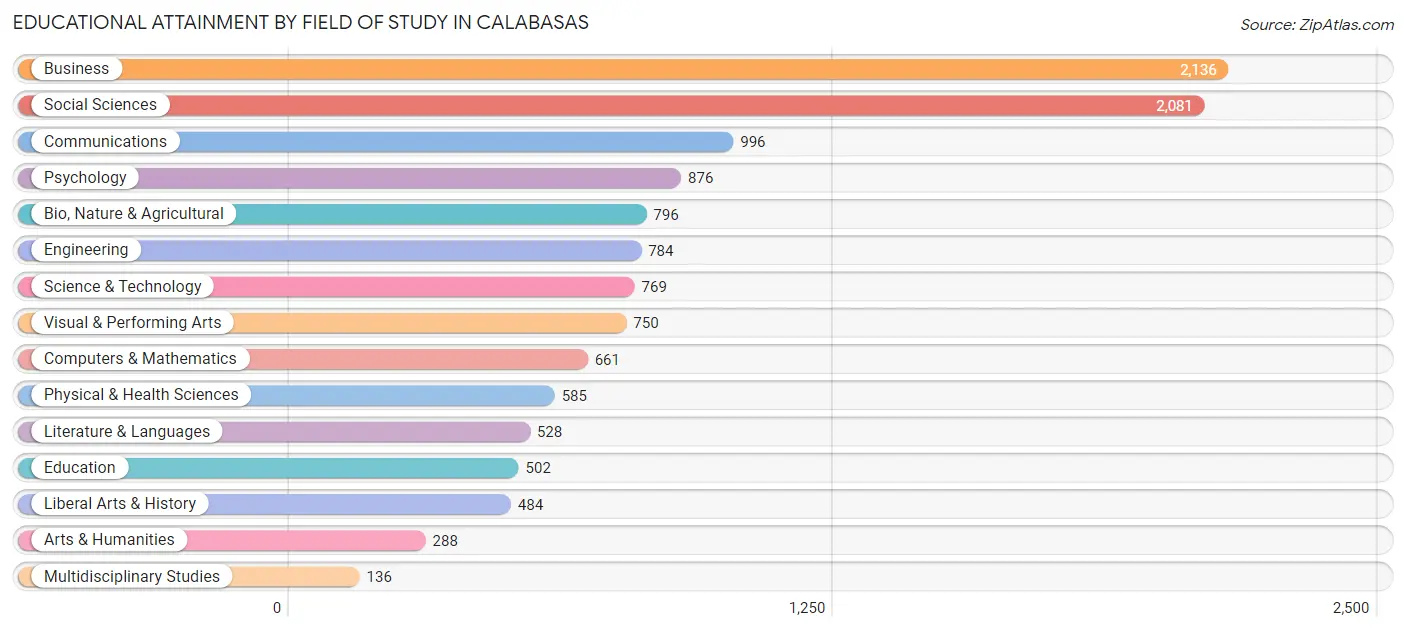
| Field of Study | # Graduates | % Graduates |
| Computers & Mathematics | 661 | 5.3% |
| Bio, Nature & Agricultural | 796 | 6.4% |
| Physical & Health Sciences | 585 | 4.7% |
| Psychology | 876 | 7.1% |
| Social Sciences | 2,081 | 16.8% |
| Engineering | 784 | 6.3% |
| Multidisciplinary Studies | 136 | 1.1% |
| Science & Technology | 769 | 6.2% |
| Business | 2,136 | 17.3% |
| Education | 502 | 4.1% |
| Literature & Languages | 528 | 4.3% |
| Liberal Arts & History | 484 | 3.9% |
| Visual & Performing Arts | 750 | 6.1% |
| Communications | 996 | 8.1% |
| Arts & Humanities | 288 | 2.3% |
| Total | 12,372 | 100.0% |
Transportation & Commute in Calabasas
Vehicle Availability by Sex in Calabasas
The most prevalent vehicle ownership categories in Calabasas are males with 2 vehicles (2,814, accounting for 48.0%) and females with 2 vehicles (1,998, making up 58.4%).
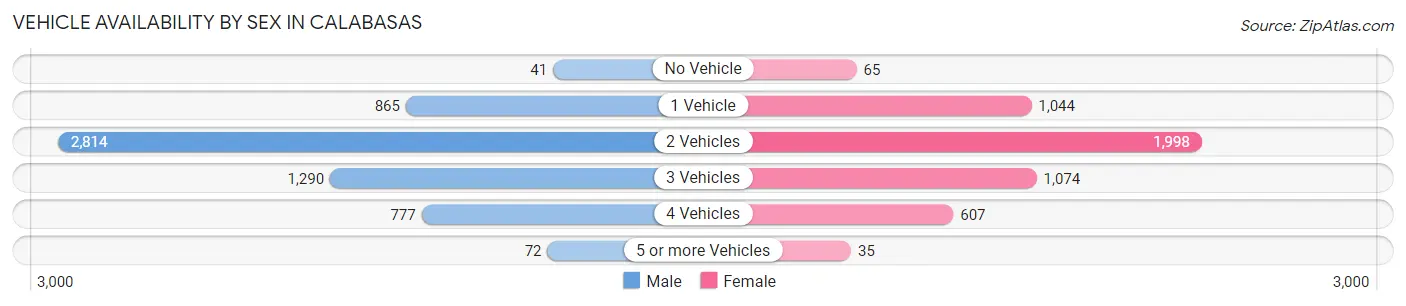
| Vehicles Available | Male | Female |
| No Vehicle | 41 (0.7%) | 65 (1.3%) |
| 1 Vehicle | 865 (14.8%) | 1,044 (21.6%) |
| 2 Vehicles | 2,814 (48.0%) | 1,998 (41.4%) |
| 3 Vehicles | 1,290 (22.0%) | 1,074 (22.3%) |
| 4 Vehicles | 777 (13.3%) | 607 (12.6%) |
| 5 or more Vehicles | 72 (1.2%) | 35 (0.7%) |
| Total | 5,859 (100.0%) | 4,823 (100.0%) |
Commute Time in Calabasas
The most frequently occuring commute durations in Calabasas are 20 to 24 minutes (1,252 commuters, 15.1%), 30 to 34 minutes (1,143 commuters, 13.8%), and 15 to 19 minutes (1,130 commuters, 13.7%).
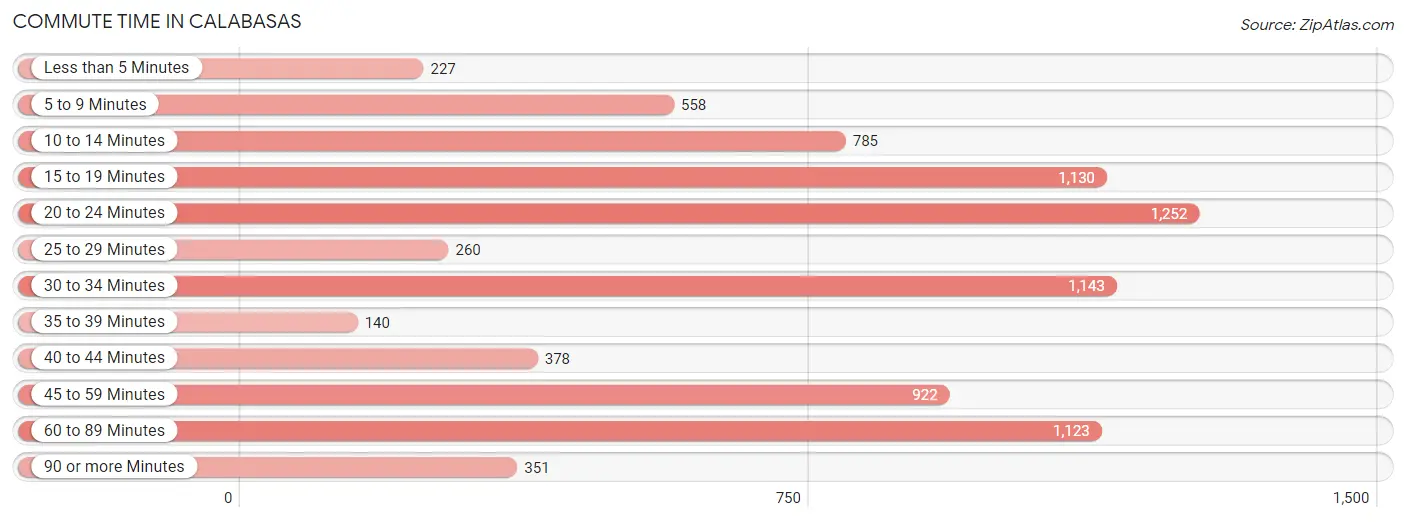
| Commute Time | # Commuters | % Commuters |
| Less than 5 Minutes | 227 | 2.8% |
| 5 to 9 Minutes | 558 | 6.8% |
| 10 to 14 Minutes | 785 | 9.5% |
| 15 to 19 Minutes | 1,130 | 13.7% |
| 20 to 24 Minutes | 1,252 | 15.1% |
| 25 to 29 Minutes | 260 | 3.1% |
| 30 to 34 Minutes | 1,143 | 13.8% |
| 35 to 39 Minutes | 140 | 1.7% |
| 40 to 44 Minutes | 378 | 4.6% |
| 45 to 59 Minutes | 922 | 11.2% |
| 60 to 89 Minutes | 1,123 | 13.6% |
| 90 or more Minutes | 351 | 4.2% |
Commute Time by Sex in Calabasas
The most common commute times in Calabasas are 15 to 19 minutes (716 commuters, 15.1%) for males and 20 to 24 minutes (612 commuters, 17.3%) for females.
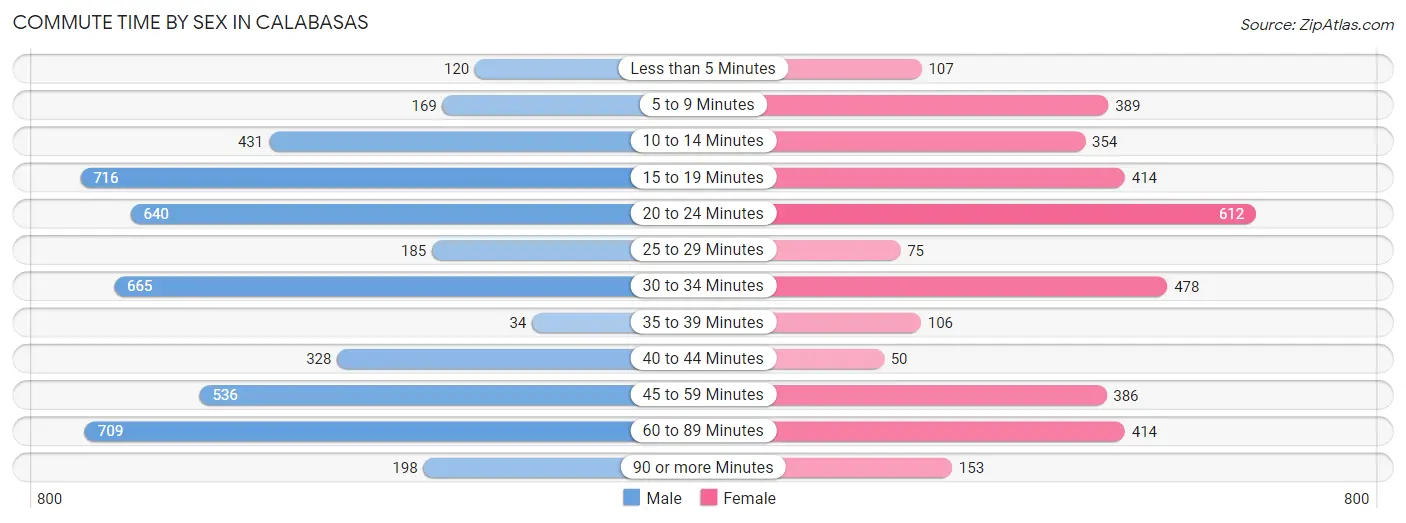
| Commute Time | Male | Female |
| Less than 5 Minutes | 120 (2.5%) | 107 (3.0%) |
| 5 to 9 Minutes | 169 (3.6%) | 389 (11.0%) |
| 10 to 14 Minutes | 431 (9.1%) | 354 (10.0%) |
| 15 to 19 Minutes | 716 (15.1%) | 414 (11.7%) |
| 20 to 24 Minutes | 640 (13.5%) | 612 (17.3%) |
| 25 to 29 Minutes | 185 (3.9%) | 75 (2.1%) |
| 30 to 34 Minutes | 665 (14.1%) | 478 (13.5%) |
| 35 to 39 Minutes | 34 (0.7%) | 106 (3.0%) |
| 40 to 44 Minutes | 328 (6.9%) | 50 (1.4%) |
| 45 to 59 Minutes | 536 (11.3%) | 386 (10.9%) |
| 60 to 89 Minutes | 709 (15.0%) | 414 (11.7%) |
| 90 or more Minutes | 198 (4.2%) | 153 (4.3%) |
Time of Departure to Work by Sex in Calabasas
The most frequent times of departure to work in Calabasas are 8:00 AM to 8:29 AM (964, 20.4%) for males and 8:00 AM to 8:29 AM (655, 18.5%) for females.
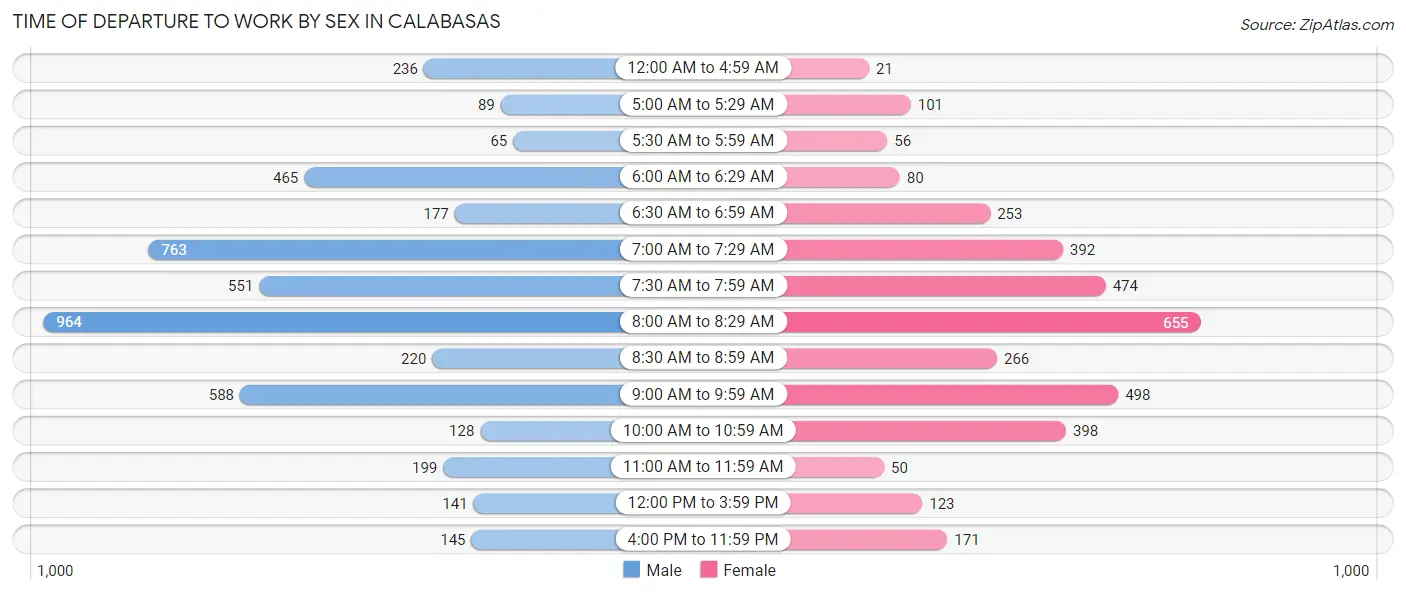
| Time of Departure | Male | Female |
| 12:00 AM to 4:59 AM | 236 (5.0%) | 21 (0.6%) |
| 5:00 AM to 5:29 AM | 89 (1.9%) | 101 (2.9%) |
| 5:30 AM to 5:59 AM | 65 (1.4%) | 56 (1.6%) |
| 6:00 AM to 6:29 AM | 465 (9.8%) | 80 (2.3%) |
| 6:30 AM to 6:59 AM | 177 (3.7%) | 253 (7.1%) |
| 7:00 AM to 7:29 AM | 763 (16.1%) | 392 (11.1%) |
| 7:30 AM to 7:59 AM | 551 (11.7%) | 474 (13.4%) |
| 8:00 AM to 8:29 AM | 964 (20.4%) | 655 (18.5%) |
| 8:30 AM to 8:59 AM | 220 (4.6%) | 266 (7.5%) |
| 9:00 AM to 9:59 AM | 588 (12.4%) | 498 (14.1%) |
| 10:00 AM to 10:59 AM | 128 (2.7%) | 398 (11.3%) |
| 11:00 AM to 11:59 AM | 199 (4.2%) | 50 (1.4%) |
| 12:00 PM to 3:59 PM | 141 (3.0%) | 123 (3.5%) |
| 4:00 PM to 11:59 PM | 145 (3.1%) | 171 (4.8%) |
| Total | 4,731 (100.0%) | 3,538 (100.0%) |
Housing Occupancy in Calabasas
Occupancy by Ownership in Calabasas
Of the total 8,819 dwellings in Calabasas, owner-occupied units account for 6,090 (69.1%), while renter-occupied units make up 2,729 (30.9%).
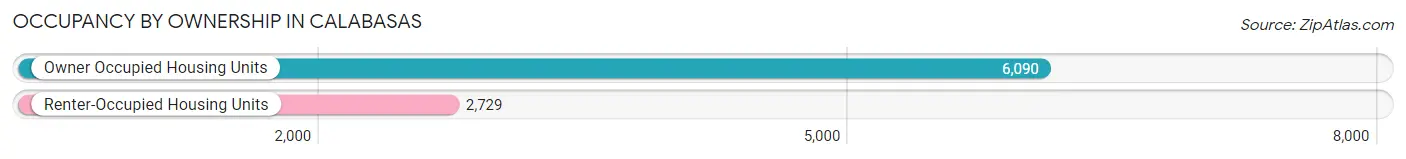
| Occupancy | # Housing Units | % Housing Units |
| Owner Occupied Housing Units | 6,090 | 69.1% |
| Renter-Occupied Housing Units | 2,729 | 30.9% |
| Total Occupied Housing Units | 8,819 | 100.0% |
Occupancy by Household Size in Calabasas
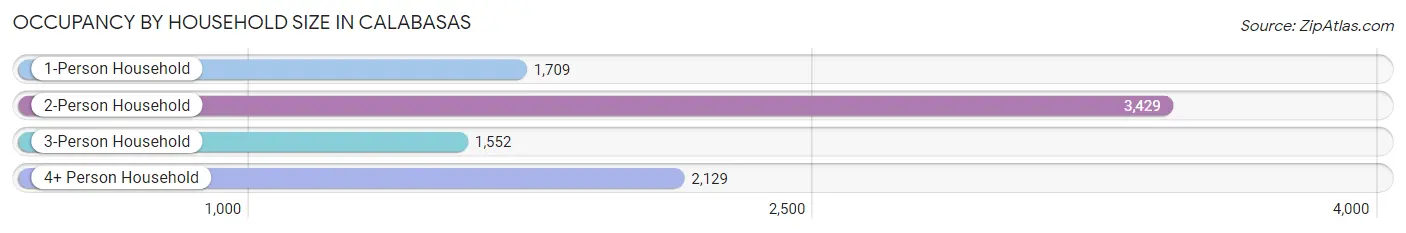
| Household Size | # Housing Units | % Housing Units |
| 1-Person Household | 1,709 | 19.4% |
| 2-Person Household | 3,429 | 38.9% |
| 3-Person Household | 1,552 | 17.6% |
| 4+ Person Household | 2,129 | 24.1% |
| Total Housing Units | 8,819 | 100.0% |
Occupancy by Ownership by Household Size in Calabasas
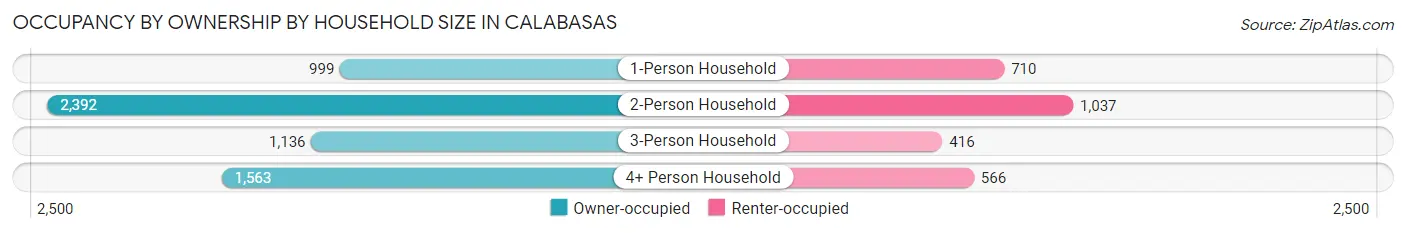
| Household Size | Owner-occupied | Renter-occupied |
| 1-Person Household | 999 (58.5%) | 710 (41.5%) |
| 2-Person Household | 2,392 (69.8%) | 1,037 (30.2%) |
| 3-Person Household | 1,136 (73.2%) | 416 (26.8%) |
| 4+ Person Household | 1,563 (73.4%) | 566 (26.6%) |
| Total Housing Units | 6,090 (69.1%) | 2,729 (30.9%) |
Occupancy by Educational Attainment in Calabasas
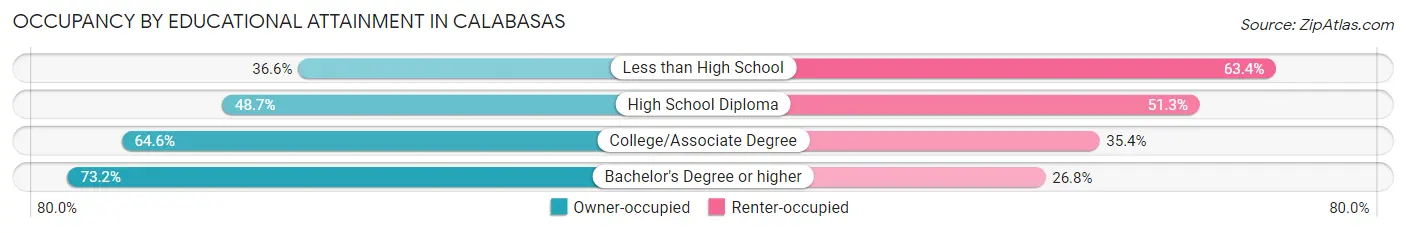
| Household Size | Owner-occupied | Renter-occupied |
| Less than High School | 15 (36.6%) | 26 (63.4%) |
| High School Diploma | 351 (48.7%) | 370 (51.3%) |
| College/Associate Degree | 1,292 (64.6%) | 708 (35.4%) |
| Bachelor's Degree or higher | 4,432 (73.2%) | 1,625 (26.8%) |
Occupancy by Age of Householder in Calabasas
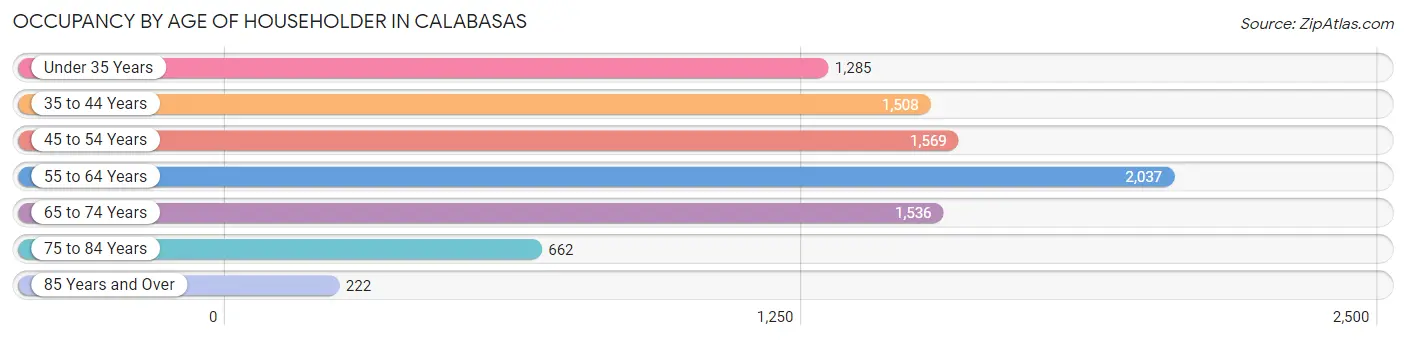
| Age Bracket | # Households | % Households |
| Under 35 Years | 1,285 | 14.6% |
| 35 to 44 Years | 1,508 | 17.1% |
| 45 to 54 Years | 1,569 | 17.8% |
| 55 to 64 Years | 2,037 | 23.1% |
| 65 to 74 Years | 1,536 | 17.4% |
| 75 to 84 Years | 662 | 7.5% |
| 85 Years and Over | 222 | 2.5% |
| Total | 8,819 | 100.0% |
Housing Finances in Calabasas
Median Income by Occupancy in Calabasas
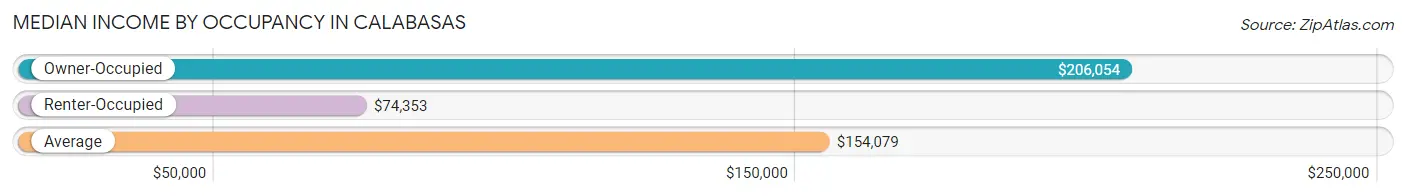
| Occupancy Type | # Households | Median Income |
| Owner-Occupied | 6,090 (69.1%) | $206,054 |
| Renter-Occupied | 2,729 (30.9%) | $74,353 |
| Average | 8,819 (100.0%) | $154,079 |
Occupancy by Householder Income Bracket in Calabasas
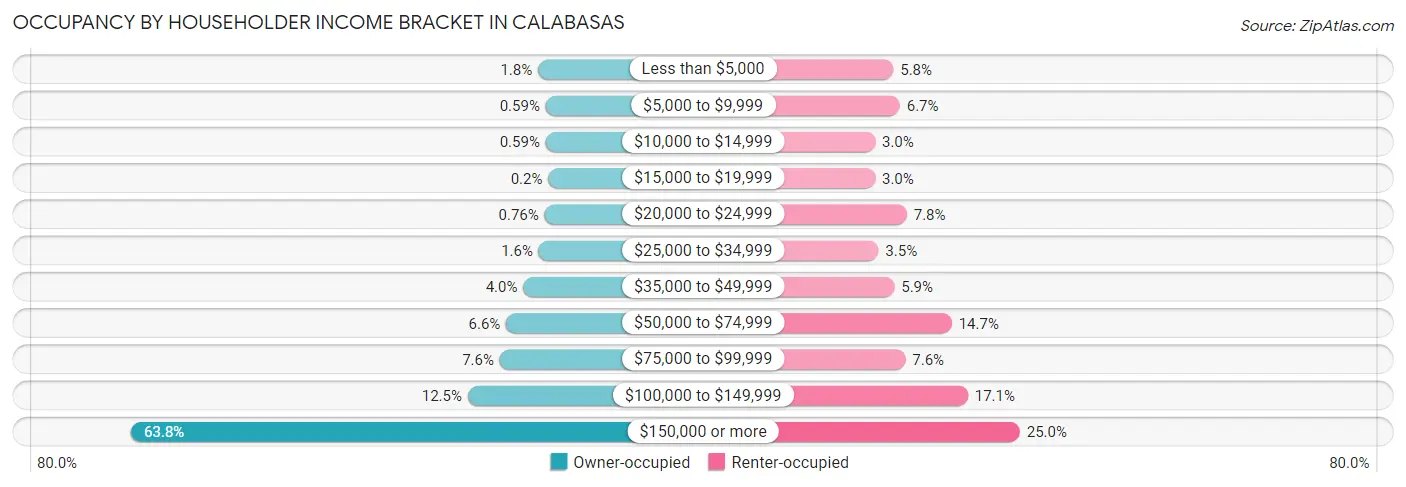
| Income Bracket | Owner-occupied | Renter-occupied |
| Less than $5,000 | 107 (1.8%) | 157 (5.8%) |
| $5,000 to $9,999 | 36 (0.6%) | 184 (6.7%) |
| $10,000 to $14,999 | 36 (0.6%) | 81 (3.0%) |
| $15,000 to $19,999 | 12 (0.2%) | 81 (3.0%) |
| $20,000 to $24,999 | 46 (0.8%) | 213 (7.8%) |
| $25,000 to $34,999 | 100 (1.6%) | 95 (3.5%) |
| $35,000 to $49,999 | 244 (4.0%) | 161 (5.9%) |
| $50,000 to $74,999 | 403 (6.6%) | 400 (14.7%) |
| $75,000 to $99,999 | 462 (7.6%) | 207 (7.6%) |
| $100,000 to $149,999 | 759 (12.5%) | 467 (17.1%) |
| $150,000 or more | 3,885 (63.8%) | 683 (25.0%) |
| Total | 6,090 (100.0%) | 2,729 (100.0%) |
Monthly Housing Cost Tiers in Calabasas
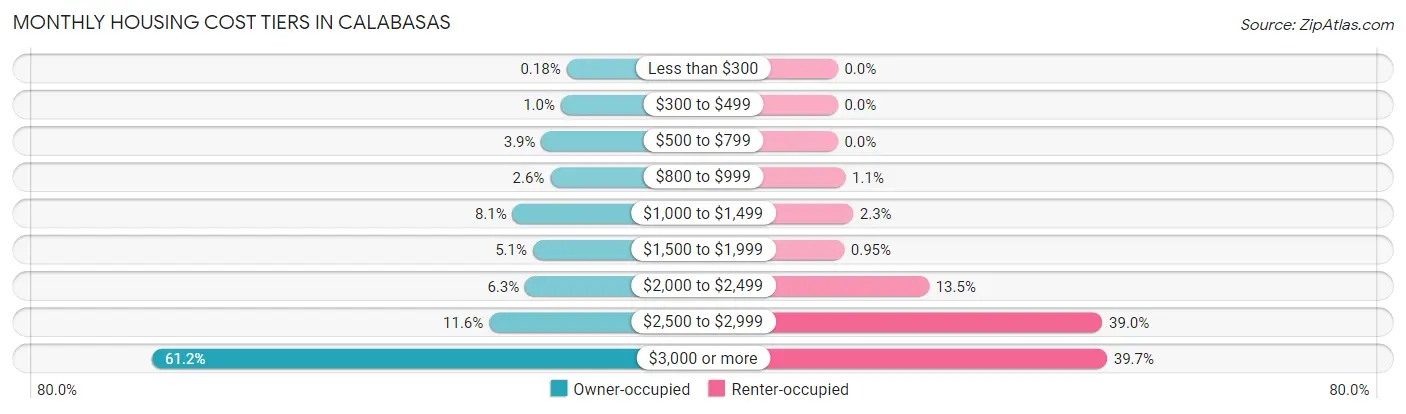
| Monthly Cost | Owner-occupied | Renter-occupied |
| Less than $300 | 11 (0.2%) | 0 (0.0%) |
| $300 to $499 | 62 (1.0%) | 0 (0.0%) |
| $500 to $799 | 236 (3.9%) | 0 (0.0%) |
| $800 to $999 | 157 (2.6%) | 31 (1.1%) |
| $1,000 to $1,499 | 495 (8.1%) | 62 (2.3%) |
| $1,500 to $1,999 | 313 (5.1%) | 26 (0.9%) |
| $2,000 to $2,499 | 383 (6.3%) | 367 (13.5%) |
| $2,500 to $2,999 | 705 (11.6%) | 1,064 (39.0%) |
| $3,000 or more | 3,728 (61.2%) | 1,083 (39.7%) |
| Total | 6,090 (100.0%) | 2,729 (100.0%) |
Physical Housing Characteristics in Calabasas
Housing Structures in Calabasas
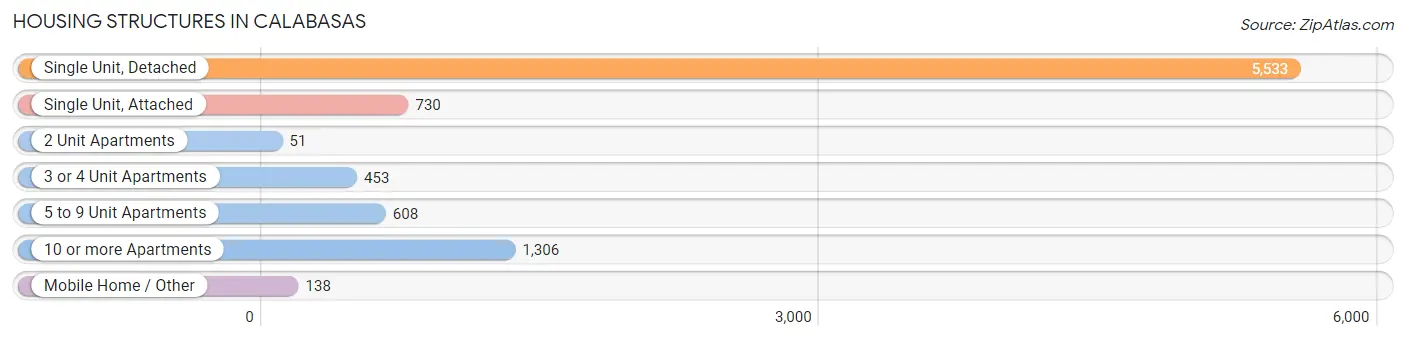
| Structure Type | # Housing Units | % Housing Units |
| Single Unit, Detached | 5,533 | 62.7% |
| Single Unit, Attached | 730 | 8.3% |
| 2 Unit Apartments | 51 | 0.6% |
| 3 or 4 Unit Apartments | 453 | 5.1% |
| 5 to 9 Unit Apartments | 608 | 6.9% |
| 10 or more Apartments | 1,306 | 14.8% |
| Mobile Home / Other | 138 | 1.6% |
| Total | 8,819 | 100.0% |
Housing Structures by Occupancy in Calabasas
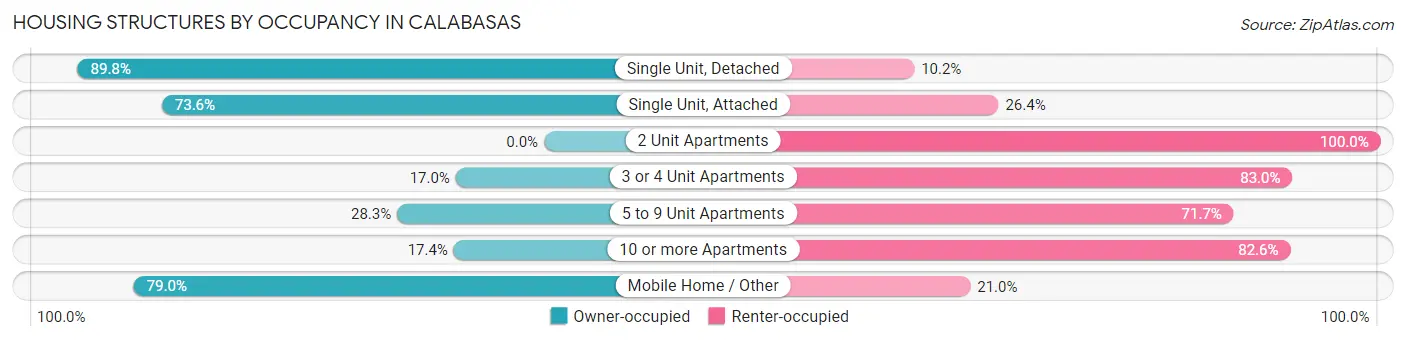
| Structure Type | Owner-occupied | Renter-occupied |
| Single Unit, Detached | 4,968 (89.8%) | 565 (10.2%) |
| Single Unit, Attached | 537 (73.6%) | 193 (26.4%) |
| 2 Unit Apartments | 0 (0.0%) | 51 (100.0%) |
| 3 or 4 Unit Apartments | 77 (17.0%) | 376 (83.0%) |
| 5 to 9 Unit Apartments | 172 (28.3%) | 436 (71.7%) |
| 10 or more Apartments | 227 (17.4%) | 1,079 (82.6%) |
| Mobile Home / Other | 109 (79.0%) | 29 (21.0%) |
| Total | 6,090 (69.1%) | 2,729 (30.9%) |
Housing Structures by Number of Rooms in Calabasas
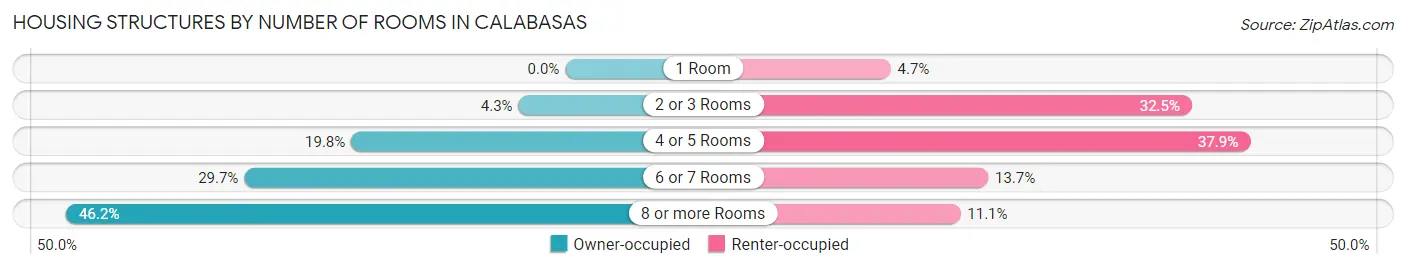
| Number of Rooms | Owner-occupied | Renter-occupied |
| 1 Room | 0 (0.0%) | 128 (4.7%) |
| 2 or 3 Rooms | 264 (4.3%) | 888 (32.5%) |
| 4 or 5 Rooms | 1,206 (19.8%) | 1,035 (37.9%) |
| 6 or 7 Rooms | 1,808 (29.7%) | 374 (13.7%) |
| 8 or more Rooms | 2,812 (46.2%) | 304 (11.1%) |
| Total | 6,090 (100.0%) | 2,729 (100.0%) |
Housing Structure by Heating Type in Calabasas
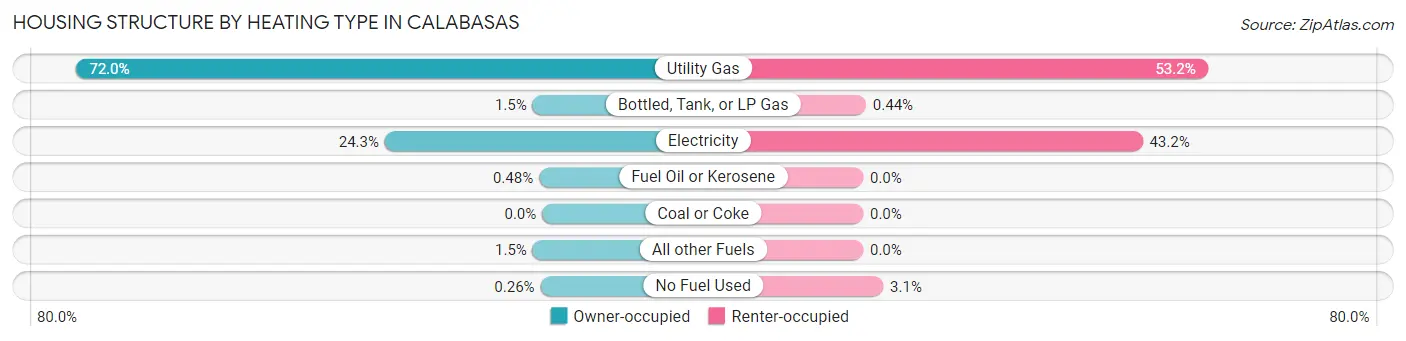
| Heating Type | Owner-occupied | Renter-occupied |
| Utility Gas | 4,385 (72.0%) | 1,453 (53.2%) |
| Bottled, Tank, or LP Gas | 90 (1.5%) | 12 (0.4%) |
| Electricity | 1,481 (24.3%) | 1,179 (43.2%) |
| Fuel Oil or Kerosene | 29 (0.5%) | 0 (0.0%) |
| Coal or Coke | 0 (0.0%) | 0 (0.0%) |
| All other Fuels | 89 (1.5%) | 0 (0.0%) |
| No Fuel Used | 16 (0.3%) | 85 (3.1%) |
| Total | 6,090 (100.0%) | 2,729 (100.0%) |
Household Vehicle Usage in Calabasas
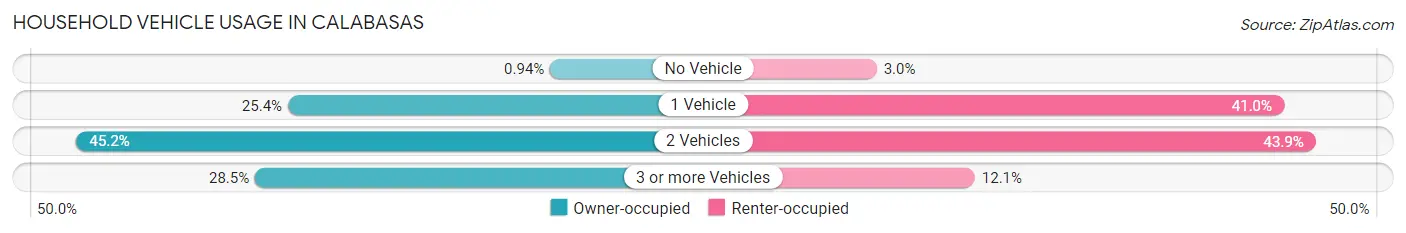
| Vehicles per Household | Owner-occupied | Renter-occupied |
| No Vehicle | 57 (0.9%) | 81 (3.0%) |
| 1 Vehicle | 1,548 (25.4%) | 1,118 (41.0%) |
| 2 Vehicles | 2,750 (45.2%) | 1,199 (43.9%) |
| 3 or more Vehicles | 1,735 (28.5%) | 331 (12.1%) |
| Total | 6,090 (100.0%) | 2,729 (100.0%) |
Real Estate & Mortgages in Calabasas
Real Estate and Mortgage Overview in Calabasas
| Characteristic | Without Mortgage | With Mortgage |
| Housing Units | 1,458 | 4,632 |
| Median Property Value | $1,192,700 | $1,361,100 |
| Median Household Income | $136,136 | $3,204 |
| Monthly Housing Costs | $1,417 | $3,493 |
| Real Estate Taxes | $9,441 | $20 |
Property Value by Mortgage Status in Calabasas
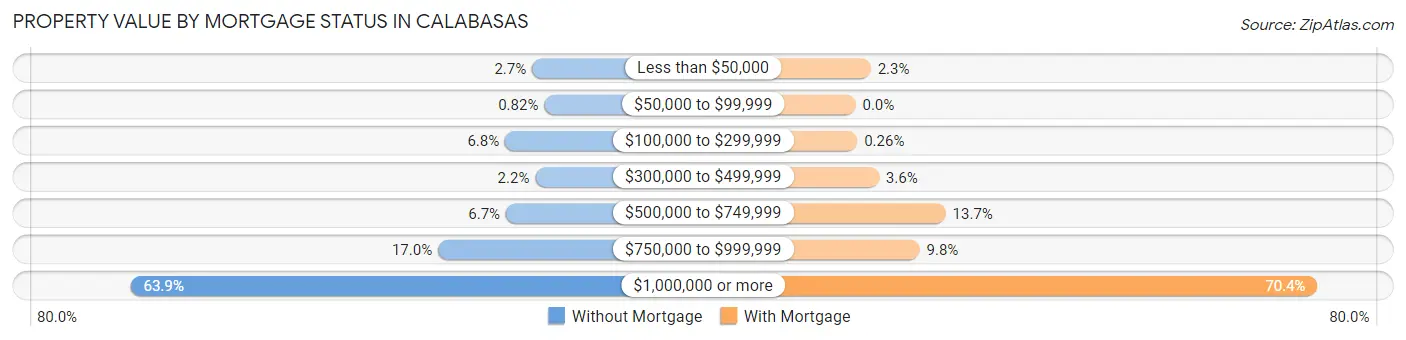
| Property Value | Without Mortgage | With Mortgage |
| Less than $50,000 | 39 (2.7%) | 107 (2.3%) |
| $50,000 to $99,999 | 12 (0.8%) | 0 (0.0%) |
| $100,000 to $299,999 | 99 (6.8%) | 12 (0.3%) |
| $300,000 to $499,999 | 32 (2.2%) | 165 (3.6%) |
| $500,000 to $749,999 | 97 (6.7%) | 636 (13.7%) |
| $750,000 to $999,999 | 248 (17.0%) | 452 (9.8%) |
| $1,000,000 or more | 931 (63.8%) | 3,260 (70.4%) |
| Total | 1,458 (100.0%) | 4,632 (100.0%) |
Household Income by Mortgage Status in Calabasas
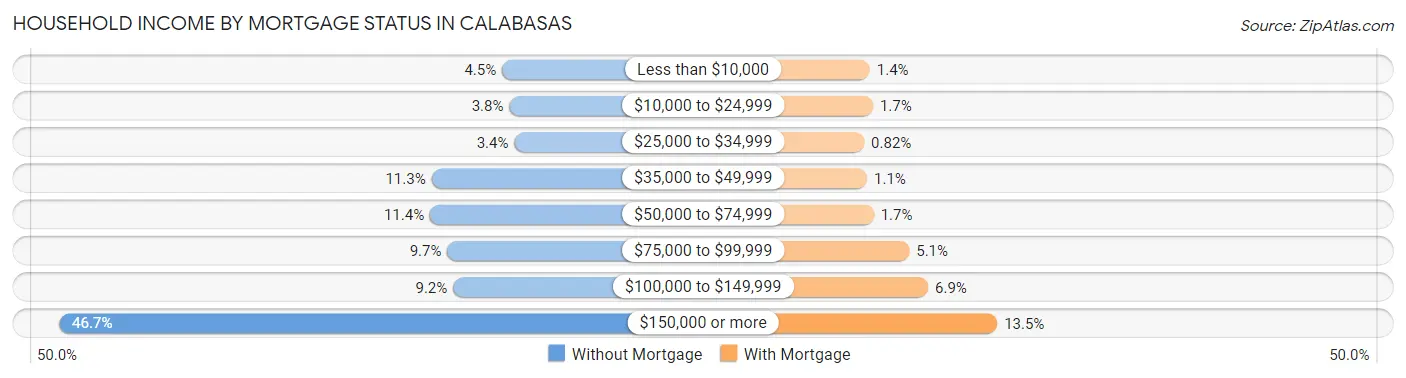
| Household Income | Without Mortgage | With Mortgage |
| Less than $10,000 | 66 (4.5%) | 63 (1.4%) |
| $10,000 to $24,999 | 56 (3.8%) | 77 (1.7%) |
| $25,000 to $34,999 | 49 (3.4%) | 38 (0.8%) |
| $35,000 to $49,999 | 164 (11.3%) | 51 (1.1%) |
| $50,000 to $74,999 | 166 (11.4%) | 80 (1.7%) |
| $75,000 to $99,999 | 142 (9.7%) | 237 (5.1%) |
| $100,000 to $149,999 | 134 (9.2%) | 320 (6.9%) |
| $150,000 or more | 681 (46.7%) | 625 (13.5%) |
| Total | 1,458 (100.0%) | 4,632 (100.0%) |
Property Value to Household Income Ratio in Calabasas
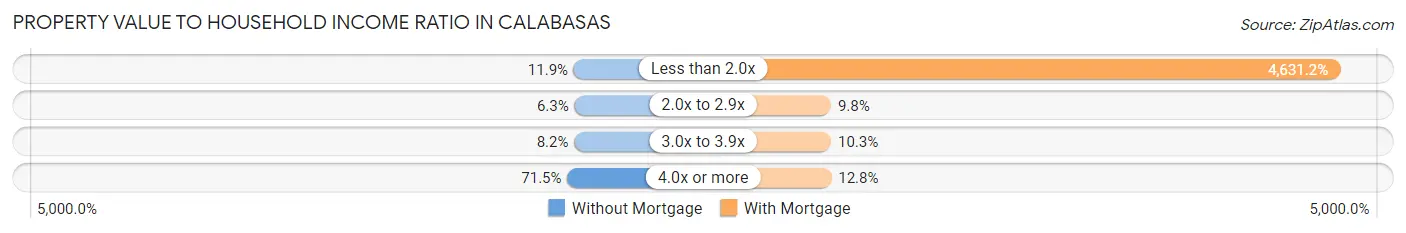
| Value-to-Income Ratio | Without Mortgage | With Mortgage |
| Less than 2.0x | 173 (11.9%) | 214,515 (4,631.2%) |
| 2.0x to 2.9x | 92 (6.3%) | 453 (9.8%) |
| 3.0x to 3.9x | 120 (8.2%) | 479 (10.3%) |
| 4.0x or more | 1,042 (71.5%) | 591 (12.8%) |
| Total | 1,458 (100.0%) | 4,632 (100.0%) |
Real Estate Taxes by Mortgage Status in Calabasas
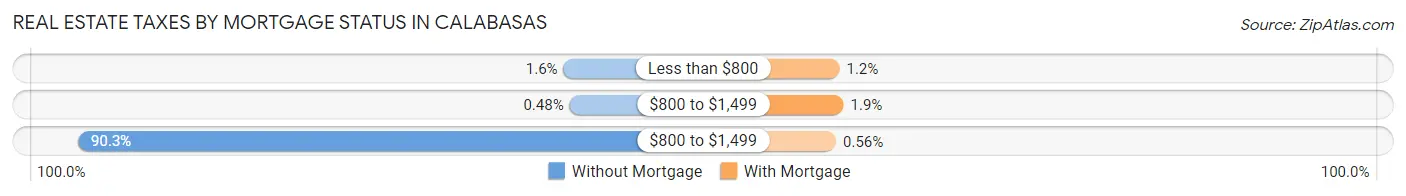
| Property Taxes | Without Mortgage | With Mortgage |
| Less than $800 | 23 (1.6%) | 55 (1.2%) |
| $800 to $1,499 | 7 (0.5%) | 89 (1.9%) |
| $800 to $1,499 | 1,316 (90.3%) | 26 (0.6%) |
| Total | 1,458 (100.0%) | 4,632 (100.0%) |
Health & Disability in Calabasas
Health Insurance Coverage by Age in Calabasas
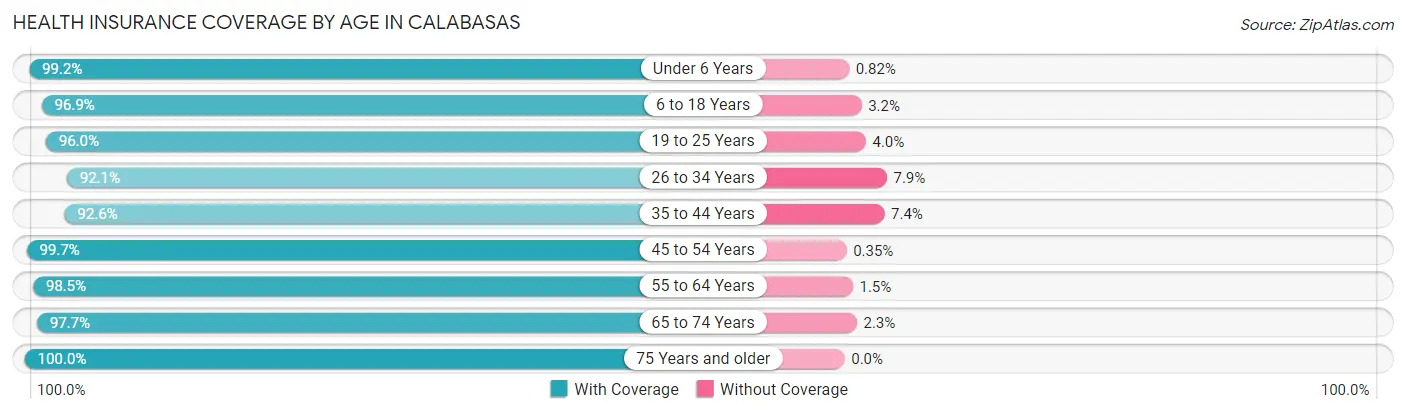
| Age Bracket | With Coverage | Without Coverage |
| Under 6 Years | 1,203 (99.2%) | 10 (0.8%) |
| 6 to 18 Years | 3,722 (96.9%) | 121 (3.2%) |
| 19 to 25 Years | 2,035 (96.0%) | 84 (4.0%) |
| 26 to 34 Years | 1,823 (92.1%) | 156 (7.9%) |
| 35 to 44 Years | 2,802 (92.6%) | 225 (7.4%) |
| 45 to 54 Years | 3,137 (99.7%) | 11 (0.4%) |
| 55 to 64 Years | 3,551 (98.5%) | 55 (1.5%) |
| 65 to 74 Years | 2,484 (97.7%) | 58 (2.3%) |
| 75 Years and older | 1,597 (100.0%) | 0 (0.0%) |
| Total | 22,354 (96.9%) | 720 (3.1%) |
Health Insurance Coverage by Citizenship Status in Calabasas
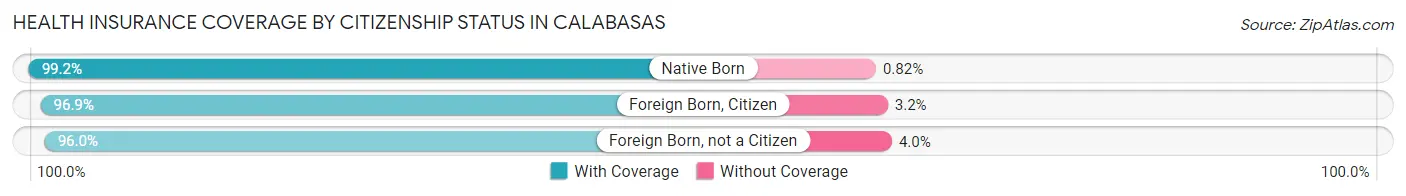
| Citizenship Status | With Coverage | Without Coverage |
| Native Born | 1,203 (99.2%) | 10 (0.8%) |
| Foreign Born, Citizen | 3,722 (96.9%) | 121 (3.2%) |
| Foreign Born, not a Citizen | 2,035 (96.0%) | 84 (4.0%) |
Health Insurance Coverage by Household Income in Calabasas
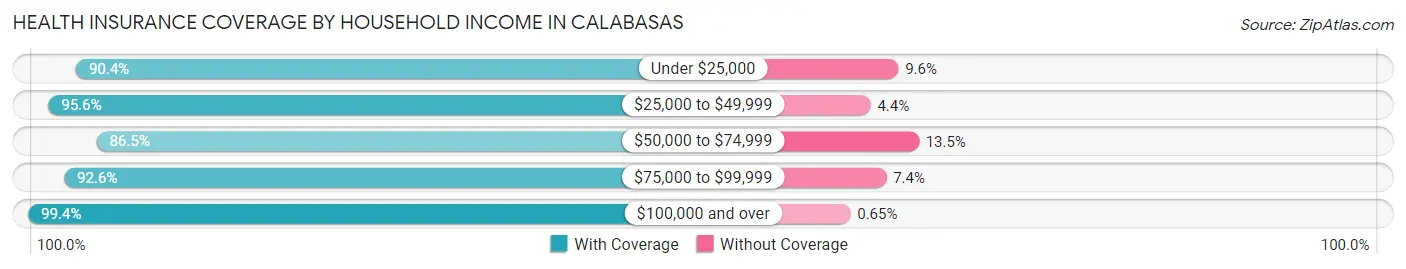
| Household Income | With Coverage | Without Coverage |
| Under $25,000 | 1,792 (90.4%) | 191 (9.6%) |
| $25,000 to $49,999 | 1,118 (95.6%) | 52 (4.4%) |
| $50,000 to $74,999 | 1,696 (86.5%) | 264 (13.5%) |
| $75,000 to $99,999 | 1,315 (92.6%) | 105 (7.4%) |
| $100,000 and over | 16,425 (99.4%) | 108 (0.6%) |
Public vs Private Health Insurance Coverage by Age in Calabasas
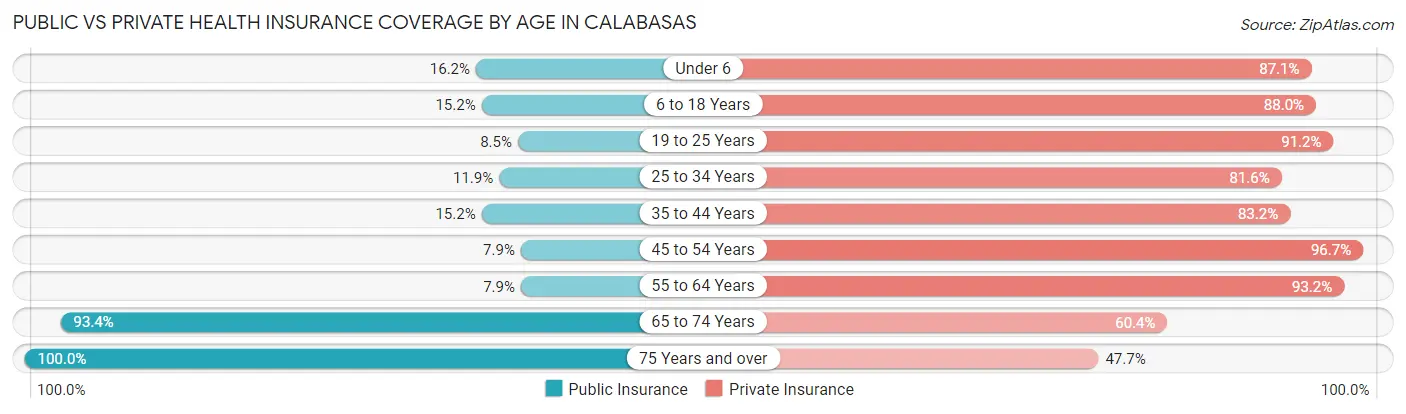
| Age Bracket | Public Insurance | Private Insurance |
| Under 6 | 197 (16.2%) | 1,057 (87.1%) |
| 6 to 18 Years | 584 (15.2%) | 3,382 (88.0%) |
| 19 to 25 Years | 179 (8.5%) | 1,933 (91.2%) |
| 25 to 34 Years | 236 (11.9%) | 1,615 (81.6%) |
| 35 to 44 Years | 460 (15.2%) | 2,518 (83.2%) |
| 45 to 54 Years | 249 (7.9%) | 3,045 (96.7%) |
| 55 to 64 Years | 285 (7.9%) | 3,361 (93.2%) |
| 65 to 74 Years | 2,373 (93.3%) | 1,536 (60.4%) |
| 75 Years and over | 1,597 (100.0%) | 761 (47.6%) |
| Total | 6,160 (26.7%) | 19,208 (83.3%) |
Disability Status by Sex by Age in Calabasas

| Age Bracket | Male | Female |
| Under 5 Years | 0 (0.0%) | 0 (0.0%) |
| 5 to 17 Years | 70 (3.6%) | 117 (6.0%) |
| 18 to 34 Years | 14 (0.6%) | 48 (2.5%) |
| 35 to 64 Years | 322 (7.0%) | 230 (4.4%) |
| 65 to 74 Years | 144 (12.2%) | 176 (12.9%) |
| 75 Years and over | 303 (38.4%) | 339 (42.0%) |
Disability Class by Sex by Age in Calabasas
Disability Class: Hearing Difficulty
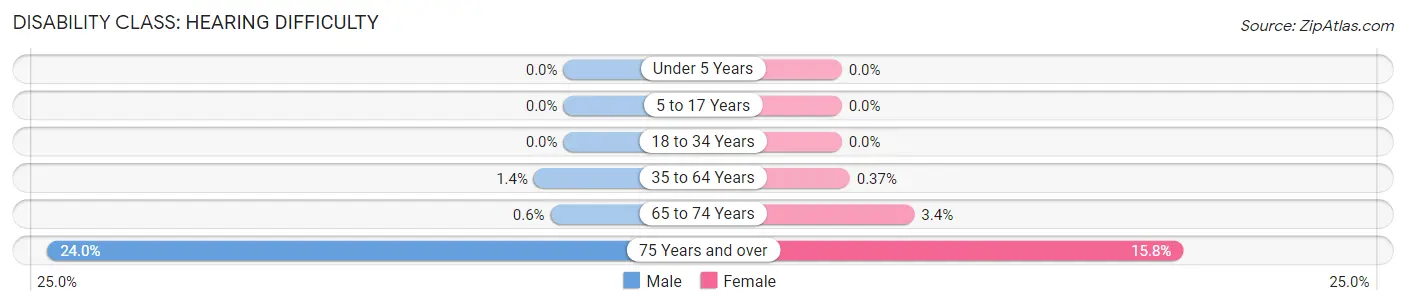
| Age Bracket | Male | Female |
| Under 5 Years | 0 (0.0%) | 0 (0.0%) |
| 5 to 17 Years | 0 (0.0%) | 0 (0.0%) |
| 18 to 34 Years | 0 (0.0%) | 0 (0.0%) |
| 35 to 64 Years | 63 (1.4%) | 19 (0.4%) |
| 65 to 74 Years | 7 (0.6%) | 46 (3.4%) |
| 75 Years and over | 189 (23.9%) | 128 (15.8%) |
Disability Class: Vision Difficulty
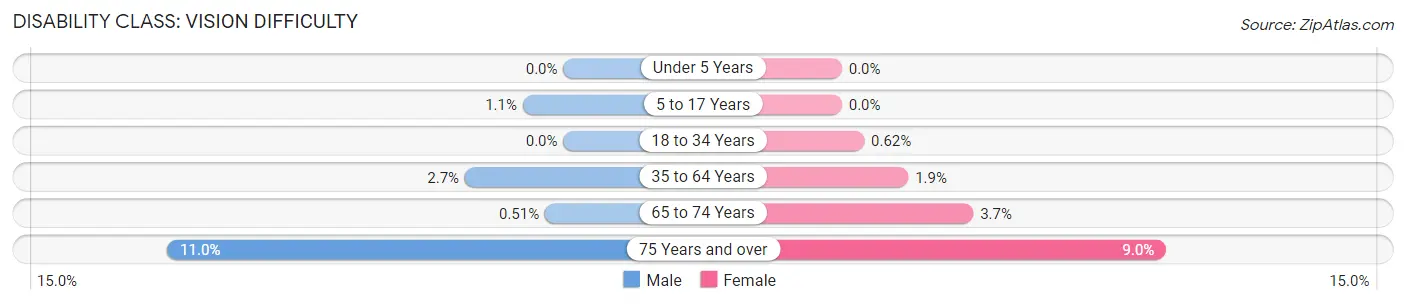
| Age Bracket | Male | Female |
| Under 5 Years | 0 (0.0%) | 0 (0.0%) |
| 5 to 17 Years | 22 (1.1%) | 0 (0.0%) |
| 18 to 34 Years | 0 (0.0%) | 12 (0.6%) |
| 35 to 64 Years | 126 (2.7%) | 96 (1.8%) |
| 65 to 74 Years | 6 (0.5%) | 50 (3.7%) |
| 75 Years and over | 87 (11.0%) | 73 (9.0%) |
Disability Class: Cognitive Difficulty
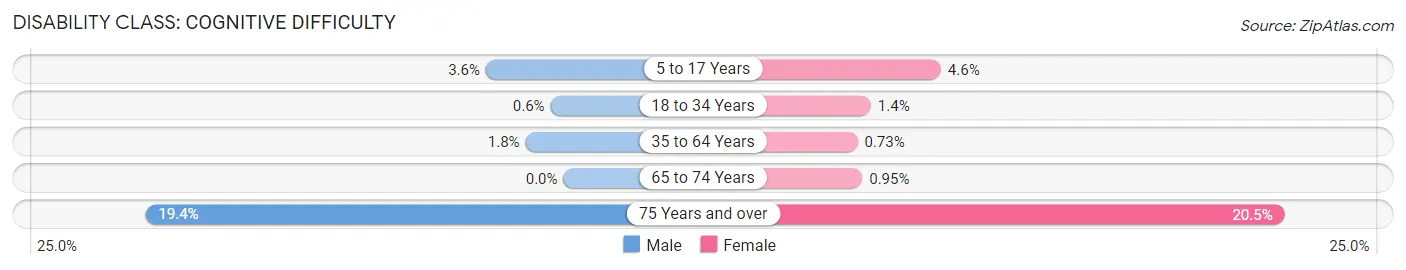
| Age Bracket | Male | Female |
| 5 to 17 Years | 70 (3.6%) | 89 (4.6%) |
| 18 to 34 Years | 14 (0.6%) | 26 (1.3%) |
| 35 to 64 Years | 81 (1.8%) | 38 (0.7%) |
| 65 to 74 Years | 0 (0.0%) | 13 (0.9%) |
| 75 Years and over | 153 (19.4%) | 166 (20.5%) |
Disability Class: Ambulatory Difficulty
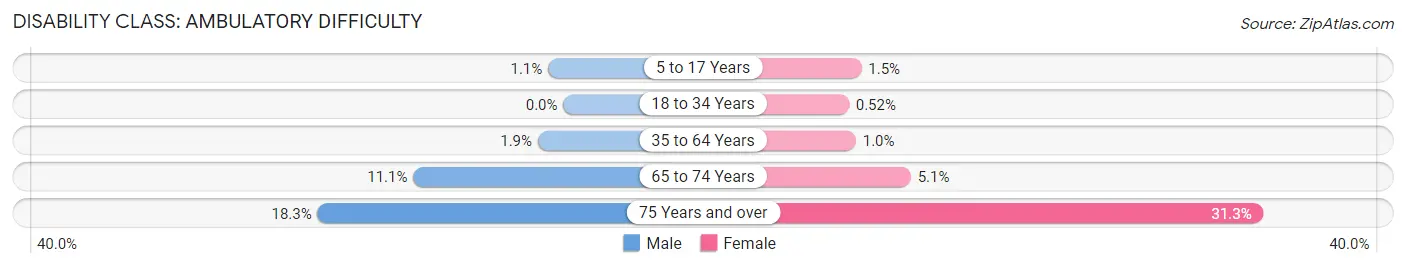
| Age Bracket | Male | Female |
| 5 to 17 Years | 22 (1.1%) | 28 (1.5%) |
| 18 to 34 Years | 0 (0.0%) | 10 (0.5%) |
| 35 to 64 Years | 87 (1.9%) | 54 (1.0%) |
| 65 to 74 Years | 131 (11.1%) | 70 (5.1%) |
| 75 Years and over | 144 (18.2%) | 253 (31.3%) |
Disability Class: Self-Care Difficulty
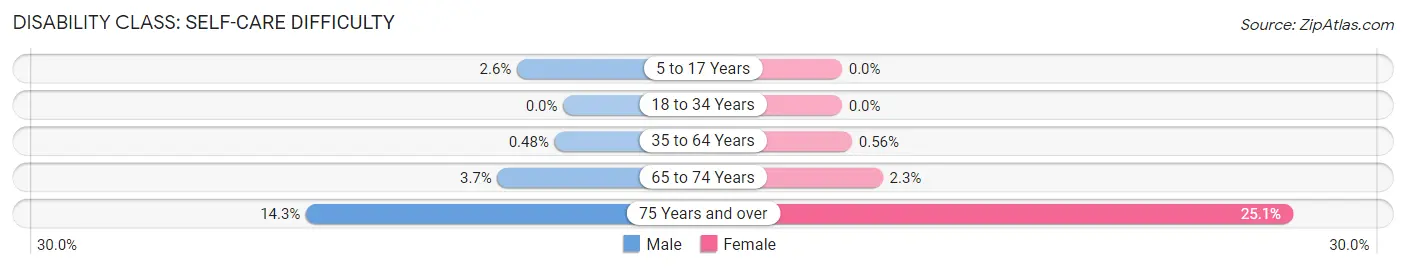
| Age Bracket | Male | Female |
| 5 to 17 Years | 50 (2.6%) | 0 (0.0%) |
| 18 to 34 Years | 0 (0.0%) | 0 (0.0%) |
| 35 to 64 Years | 22 (0.5%) | 29 (0.6%) |
| 65 to 74 Years | 43 (3.7%) | 31 (2.3%) |
| 75 Years and over | 113 (14.3%) | 203 (25.1%) |
Technology Access in Calabasas
Computing Device Access in Calabasas
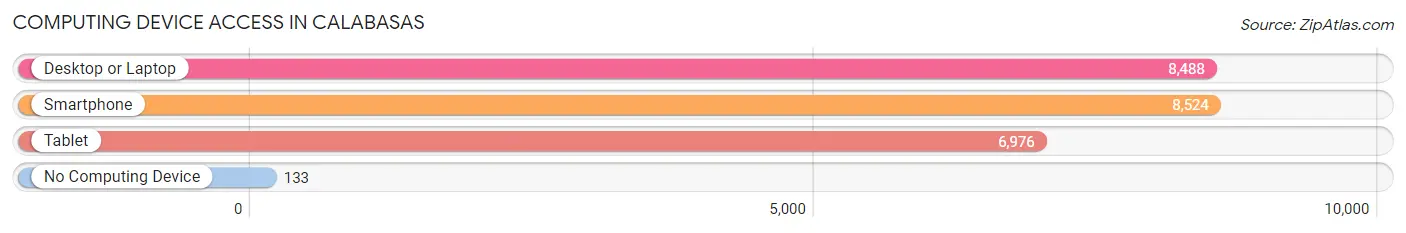
| Device Type | # Households | % Households |
| Desktop or Laptop | 8,488 | 96.3% |
| Smartphone | 8,524 | 96.7% |
| Tablet | 6,976 | 79.1% |
| No Computing Device | 133 | 1.5% |
| Total | 8,819 | 100.0% |
Internet Access in Calabasas
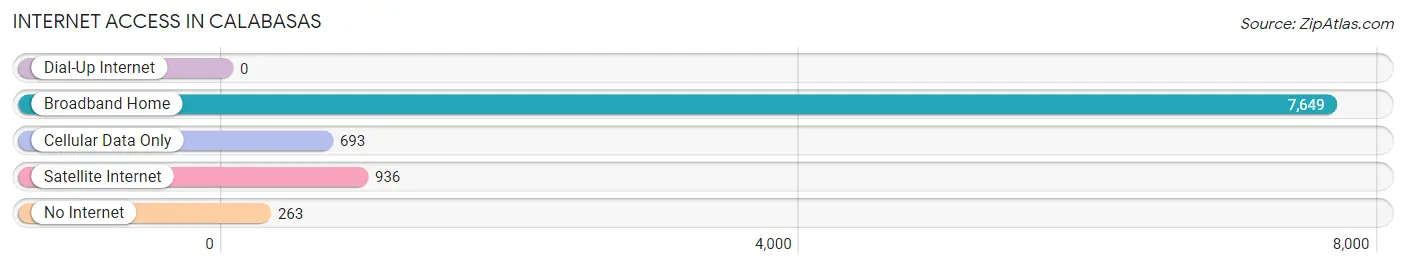
| Internet Type | # Households | % Households |
| Dial-Up Internet | 0 | 0.0% |
| Broadband Home | 7,649 | 86.7% |
| Cellular Data Only | 693 | 7.9% |
| Satellite Internet | 936 | 10.6% |
| No Internet | 263 | 3.0% |
| Total | 8,819 | 100.0% |
Calabasas Summary
Calabasas, California is a city located in the western part of Los Angeles County, California. It is situated in the foothills of the Santa Monica Mountains and is bordered by the cities of Agoura Hills, Hidden Hills, Malibu, and Westlake Village. The city has a population of approximately 24,000 people and is known for its affluent neighborhoods and high-end shopping centers.
History
The area that is now Calabasas was originally inhabited by the Chumash Native American tribe. The first Europeans to settle in the area were Spanish missionaries in the late 1700s. The area was later part of the Rancho Las Virgenes, a large Spanish land grant. In the mid-1800s, the area was divided into several smaller ranches and farms.
In the early 1900s, the area began to be developed as a residential community. The first subdivision was established in 1917 and the city was officially incorporated in 1991.
Geography
Calabasas is located in the western part of Los Angeles County, California. It is situated in the foothills of the Santa Monica Mountains and is bordered by the cities of Agoura Hills, Hidden Hills, Malibu, and Westlake Village. The city has a total area of 13.2 square miles, of which 12.9 square miles is land and 0.3 square miles is water.
The city is located in a Mediterranean climate zone, with hot, dry summers and mild, wet winters. The average annual temperature is 68°F and the average annual precipitation is 17.5 inches.
Economy
Calabasas is a wealthy city with a strong economy. The city’s largest employers are the Calabasas Unified School District, the City of Calabasas, and the Las Virgenes Unified School District. Other major employers include the Los Angeles County Sheriff’s Department, the Los Angeles County Fire Department, and the Los Angeles County Department of Public Works.
The city is also home to several large corporations, including Dole Food Company, Nestle USA, and the Cheesecake Factory. The city is also home to several shopping centers, including The Commons at Calabasas, The Promenade at Westlake, and The Village at Topanga.
Demographics
As of the 2010 census, the population of Calabasas was 23,058. The racial makeup of the city was 79.2% White, 8.2% Asian, 6.3% African American, 0.3% Native American, 0.1% Pacific Islander, and 5.9% from other races. The median household income was $118,871 and the median family income was $136,087.
The city is home to a large number of affluent residents, with over half of the population having a college degree or higher. The city also has a large Jewish population, with over 20% of the population identifying as Jewish.
Common Questions
What is Per Capita Income in Calabasas?
Per Capita income in Calabasas is $98,625.
What is the Median Family Income in Calabasas?
Median Family Income in Calabasas is $199,110.
What is the Median Household income in Calabasas?
Median Household Income in Calabasas is $154,079.
What is Income or Wage Gap in Calabasas?
Income or Wage Gap in Calabasas is 36.6%.
Women in Calabasas earn 63.4 cents for every dollar earned by a man.
What is Inequality or Gini Index in Calabasas?
Inequality or Gini Index in Calabasas is 0.56.
What is the Total Population of Calabasas?
Total Population of Calabasas is 23,106.
What is the Total Male Population of Calabasas?
Total Male Population of Calabasas is 11,369.
What is the Total Female Population of Calabasas?
Total Female Population of Calabasas is 11,737.
What is the Ratio of Males per 100 Females in Calabasas?
There are 96.86 Males per 100 Females in Calabasas.
What is the Ratio of Females per 100 Males in Calabasas?
There are 103.24 Females per 100 Males in Calabasas.
What is the Median Population Age in Calabasas?
Median Population Age in Calabasas is 42.1 Years.
What is the Average Family Size in Calabasas
Average Family Size in Calabasas is 3.1 People.
What is the Average Household Size in Calabasas
Average Household Size in Calabasas is 2.6 People.
How Large is the Labor Force in Calabasas?
There are 12,056 People in the Labor Forcein in Calabasas.
What is the Percentage of People in the Labor Force in Calabasas?
64.5% of People are in the Labor Force in Calabasas.
What is the Unemployment Rate in Calabasas?
Unemployment Rate in Calabasas is 9.4%.