Toro Canyon, CA Map & Demographics
Toro Canyon Map
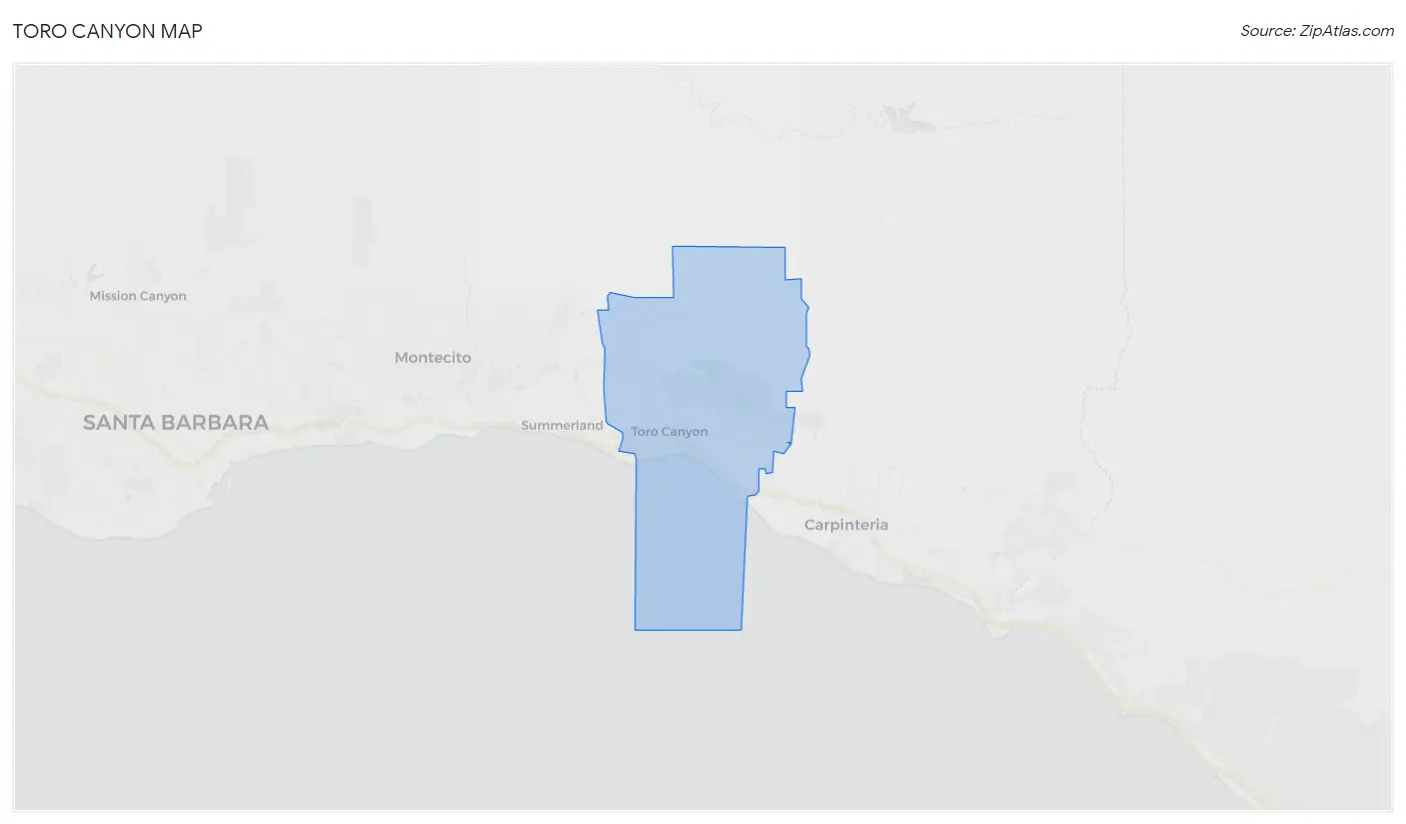
Toro Canyon Overview
$139,129
PER CAPITA INCOME
$174,821
AVG FAMILY INCOME
$174,929
AVG HOUSEHOLD INCOME
0.56
INEQUALITY / GINI INDEX
1,692
TOTAL POPULATION
793
MALE POPULATION
899
FEMALE POPULATION
88.21
MALES / 100 FEMALES
113.37
FEMALES / 100 MALES
65.9
MEDIAN AGE
2.7
AVG FAMILY SIZE
2.2
AVG HOUSEHOLD SIZE
753
LABOR FORCE [ PEOPLE ]
50.2%
PERCENT IN LABOR FORCE
7.7%
UNEMPLOYMENT RATE
Income in Toro Canyon
Income Overview in Toro Canyon
Per Capita Income in Toro Canyon is $139,129, while median incomes of families and households are $174,821 and $174,929 respectively.
| Characteristic | Number | Measure |
| Per Capita Income | 1,692 | $139,129 |
| Median Family Income | 489 | $174,821 |
| Mean Family Income | 489 | $337,444 |
| Median Household Income | 758 | $174,929 |
| Mean Household Income | 758 | $305,682 |
| Income Deficit | 489 | $0 |
| Wage / Income Gap (%) | 1,692 | 0.00% |
| Wage / Income Gap ($) | 1,692 | 100.00¢ per $1 |
| Gini / Inequality Index | 1,692 | 0.56 |
Earnings by Sex in Toro Canyon
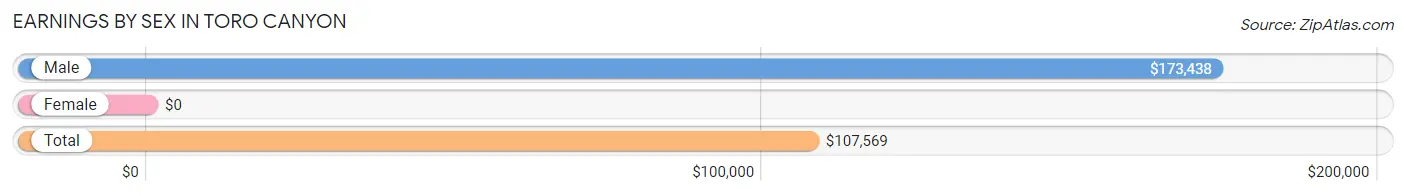
| Sex | Number | Average Earnings |
| Male | 415 (52.6%) | $173,438 |
| Female | 374 (47.4%) | $0 |
| Total | 789 (100.0%) | $107,569 |
Earnings by Sex by Income Bracket in Toro Canyon
The most common earnings brackets in Toro Canyon are $100,000+ for men (283 | 68.2%) and $100,000+ for women (112 | 29.9%).
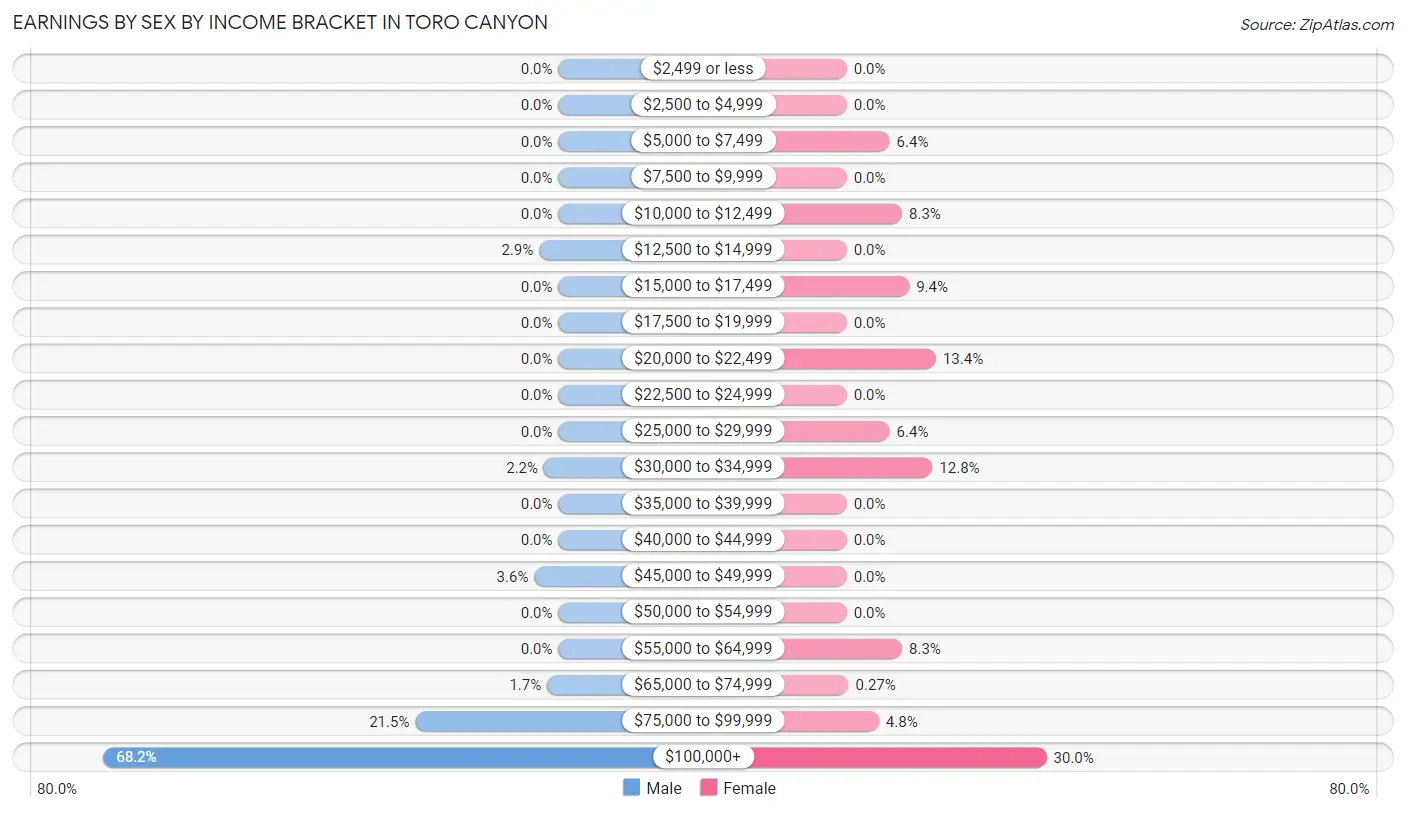
| Income | Male | Female |
| $2,499 or less | 0 (0.0%) | 0 (0.0%) |
| $2,500 to $4,999 | 0 (0.0%) | 0 (0.0%) |
| $5,000 to $7,499 | 0 (0.0%) | 24 (6.4%) |
| $7,500 to $9,999 | 0 (0.0%) | 0 (0.0%) |
| $10,000 to $12,499 | 0 (0.0%) | 31 (8.3%) |
| $12,500 to $14,999 | 12 (2.9%) | 0 (0.0%) |
| $15,000 to $17,499 | 0 (0.0%) | 35 (9.4%) |
| $17,500 to $19,999 | 0 (0.0%) | 0 (0.0%) |
| $20,000 to $22,499 | 0 (0.0%) | 50 (13.4%) |
| $22,500 to $24,999 | 0 (0.0%) | 0 (0.0%) |
| $25,000 to $29,999 | 0 (0.0%) | 24 (6.4%) |
| $30,000 to $34,999 | 9 (2.2%) | 48 (12.8%) |
| $35,000 to $39,999 | 0 (0.0%) | 0 (0.0%) |
| $40,000 to $44,999 | 0 (0.0%) | 0 (0.0%) |
| $45,000 to $49,999 | 15 (3.6%) | 0 (0.0%) |
| $50,000 to $54,999 | 0 (0.0%) | 0 (0.0%) |
| $55,000 to $64,999 | 0 (0.0%) | 31 (8.3%) |
| $65,000 to $74,999 | 7 (1.7%) | 1 (0.3%) |
| $75,000 to $99,999 | 89 (21.4%) | 18 (4.8%) |
| $100,000+ | 283 (68.2%) | 112 (29.9%) |
| Total | 415 (100.0%) | 374 (100.0%) |
Earnings by Sex by Educational Attainment in Toro Canyon
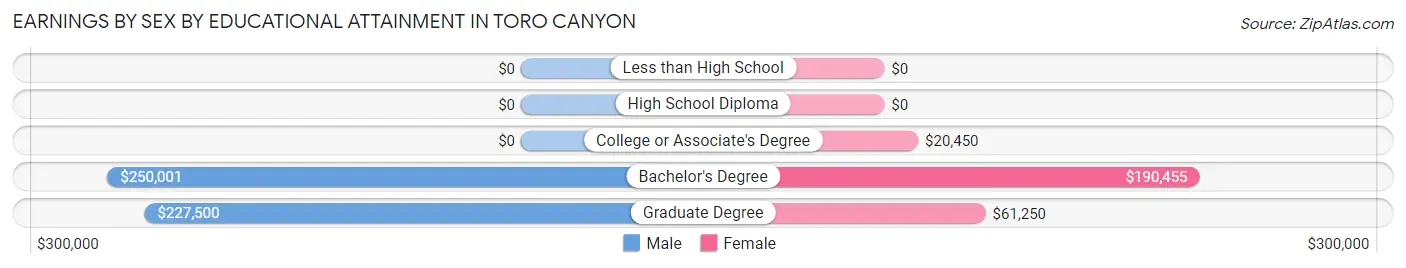
| Educational Attainment | Male Income | Female Income |
| Less than High School | - | - |
| High School Diploma | - | - |
| College or Associate's Degree | - | - |
| Bachelor's Degree | $250,001 | $190,455 |
| Graduate Degree | $227,500 | $61,250 |
| Total | $173,438 | $0 |
Family Income in Toro Canyon
Family Income Brackets in Toro Canyon
According to the Toro Canyon family income data, there are 224 families falling into the $200,000+ income range, which is the most common income bracket and makes up 45.8% of all families.
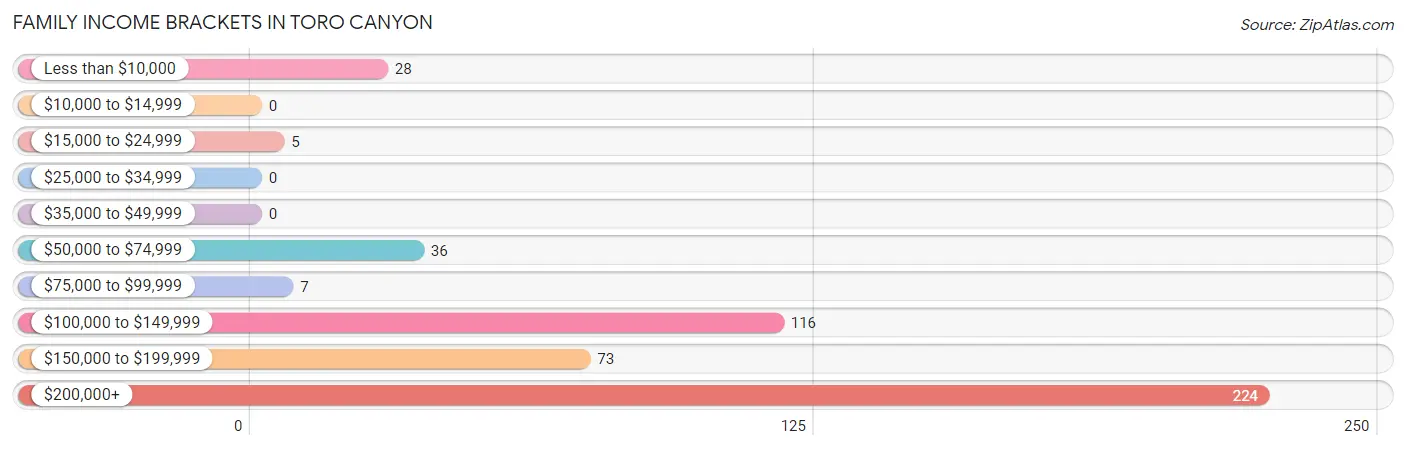
| Income Bracket | # Families | % Families |
| Less than $10,000 | 28 | 5.7% |
| $10,000 to $14,999 | 0 | 0.0% |
| $15,000 to $24,999 | 5 | 1.0% |
| $25,000 to $34,999 | 0 | 0.0% |
| $35,000 to $49,999 | 0 | 0.0% |
| $50,000 to $74,999 | 36 | 7.4% |
| $75,000 to $99,999 | 7 | 1.4% |
| $100,000 to $149,999 | 116 | 23.7% |
| $150,000 to $199,999 | 73 | 14.9% |
| $200,000+ | 224 | 45.8% |
Family Income by Famaliy Size in Toro Canyon
5-person families (55 | 11.3%) account for the highest median family income in Toro Canyon with $250,001 per family, while 3-person families (65 | 13.3%) have the highest median income of $72,750 per family member.
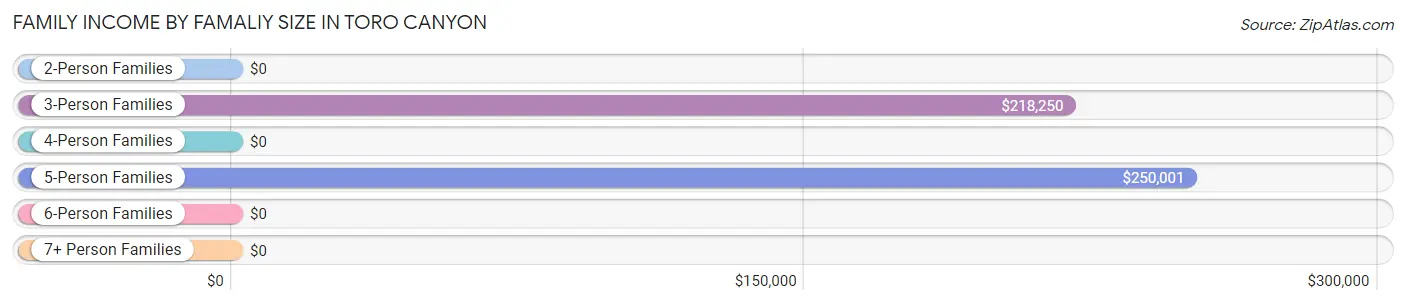
| Income Bracket | # Families | Median Income |
| 2-Person Families | 325 (66.5%) | $0 |
| 3-Person Families | 65 (13.3%) | $218,250 |
| 4-Person Families | 44 (9.0%) | $0 |
| 5-Person Families | 55 (11.3%) | $250,001 |
| 6-Person Families | 0 (0.0%) | $0 |
| 7+ Person Families | 0 (0.0%) | $0 |
| Total | 489 (100.0%) | $174,821 |
Family Income by Number of Earners in Toro Canyon
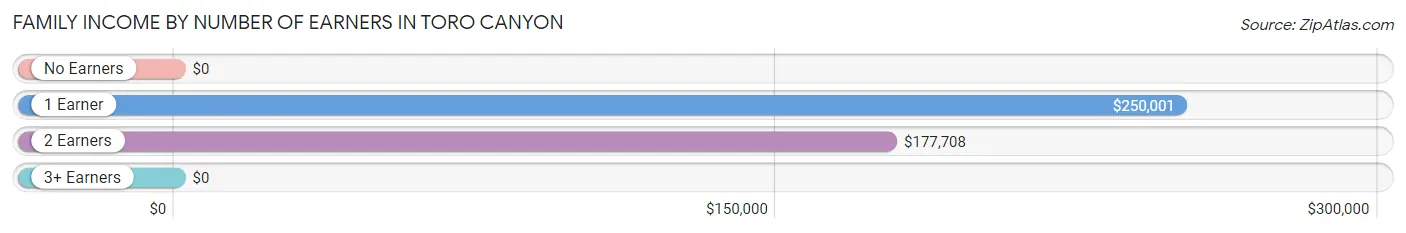
| Number of Earners | # Families | Median Income |
| No Earners | 120 (24.5%) | $0 |
| 1 Earner | 171 (35.0%) | $250,001 |
| 2 Earners | 167 (34.2%) | $177,708 |
| 3+ Earners | 31 (6.3%) | $0 |
| Total | 489 (100.0%) | $174,821 |
Household Income in Toro Canyon
Household Income Brackets in Toro Canyon
With 353 households falling in the category, the $200,000+ income range is the most frequent in Toro Canyon, accounting for 46.6% of all households.
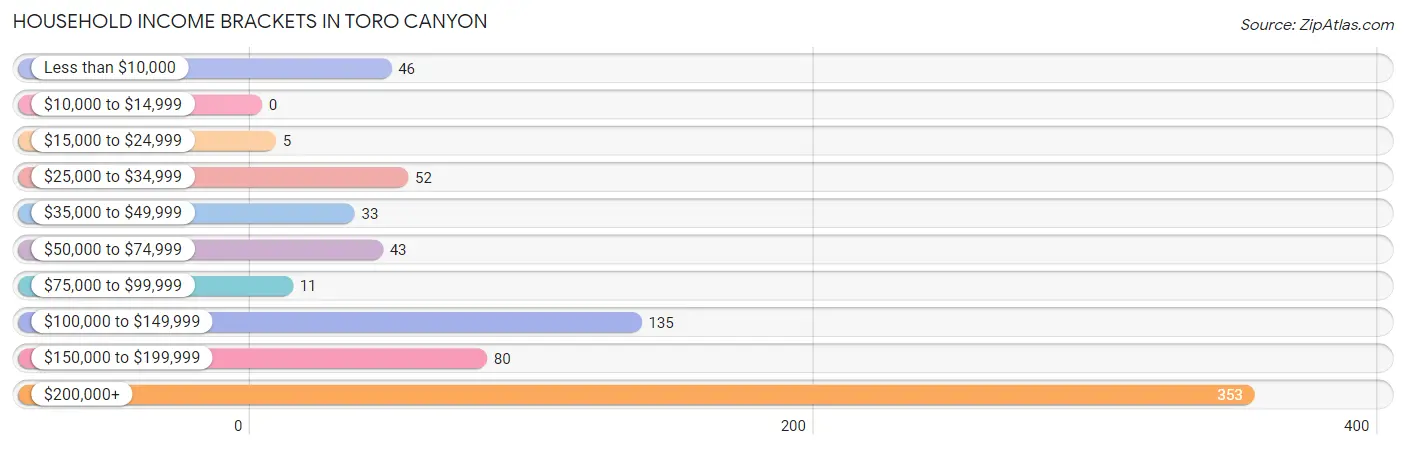
| Income Bracket | # Households | % Households |
| Less than $10,000 | 46 | 6.1% |
| $10,000 to $14,999 | 0 | 0.0% |
| $15,000 to $24,999 | 5 | 0.7% |
| $25,000 to $34,999 | 52 | 6.9% |
| $35,000 to $49,999 | 33 | 4.4% |
| $50,000 to $74,999 | 43 | 5.7% |
| $75,000 to $99,999 | 11 | 1.5% |
| $100,000 to $149,999 | 135 | 17.8% |
| $150,000 to $199,999 | 80 | 10.6% |
| $200,000+ | 353 | 46.6% |
Household Income by Householder Age in Toro Canyon
The median household income in Toro Canyon is $174,929, with the highest median household income of $221,500 found in the 45 to 64 years age bracket for the primary householder. A total of 170 households (22.4%) fall into this category.
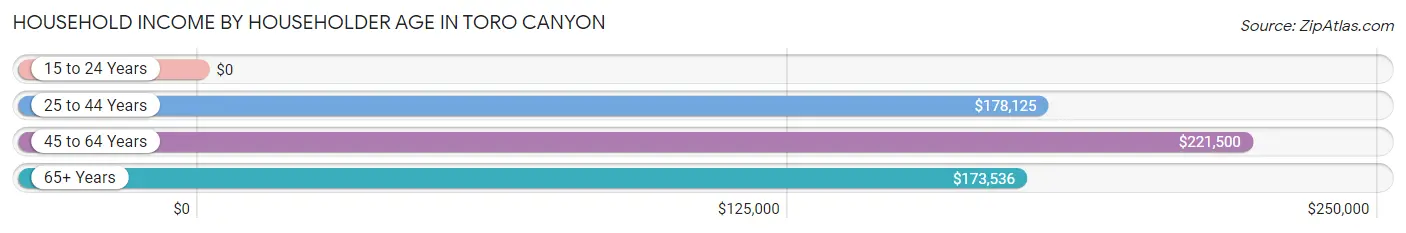
| Income Bracket | # Households | Median Income |
| 15 to 24 Years | 0 (0.0%) | $0 |
| 25 to 44 Years | 75 (9.9%) | $178,125 |
| 45 to 64 Years | 170 (22.4%) | $221,500 |
| 65+ Years | 513 (67.7%) | $173,536 |
| Total | 758 (100.0%) | $174,929 |
Poverty in Toro Canyon
Income Below Poverty by Sex and Age in Toro Canyon
With 5.0% poverty level for males and 5.3% for females among the residents of Toro Canyon, 55 to 64 year old males and 55 to 64 year old females are the most vulnerable to poverty, with 12 males (11.4%) and 39 females (22.4%) in their respective age groups living below the poverty level.
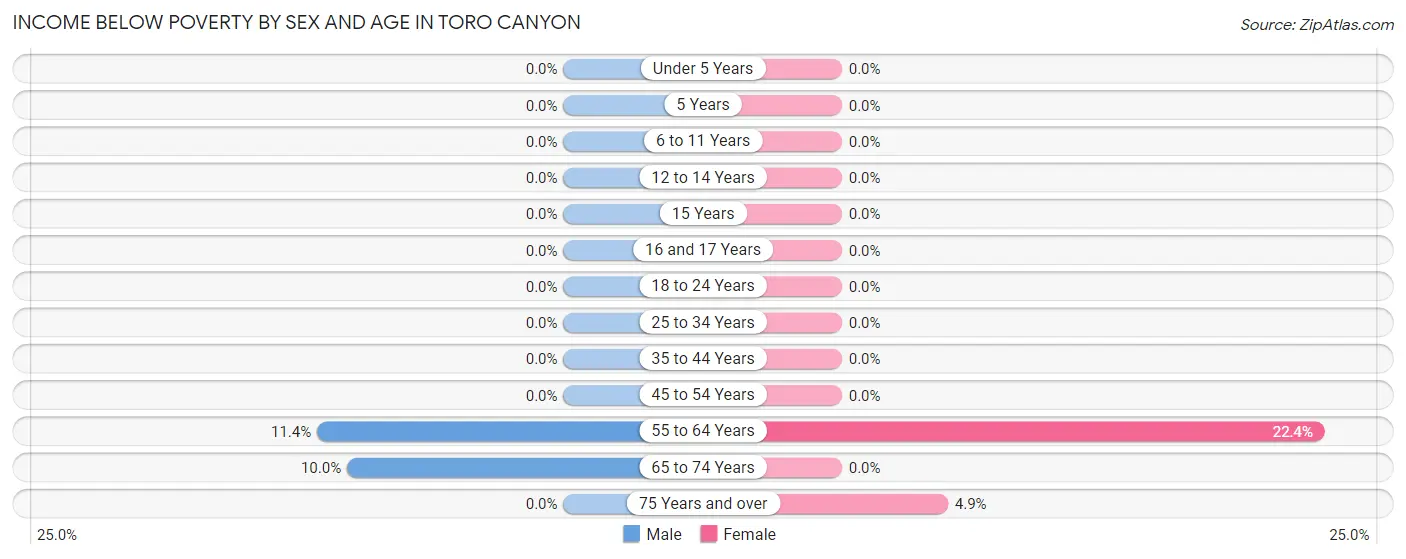
| Age Bracket | Male | Female |
| Under 5 Years | 0 (0.0%) | 0 (0.0%) |
| 5 Years | 0 (0.0%) | 0 (0.0%) |
| 6 to 11 Years | 0 (0.0%) | 0 (0.0%) |
| 12 to 14 Years | 0 (0.0%) | 0 (0.0%) |
| 15 Years | 0 (0.0%) | 0 (0.0%) |
| 16 and 17 Years | 0 (0.0%) | 0 (0.0%) |
| 18 to 24 Years | 0 (0.0%) | 0 (0.0%) |
| 25 to 34 Years | 0 (0.0%) | 0 (0.0%) |
| 35 to 44 Years | 0 (0.0%) | 0 (0.0%) |
| 45 to 54 Years | 0 (0.0%) | 0 (0.0%) |
| 55 to 64 Years | 12 (11.4%) | 39 (22.4%) |
| 65 to 74 Years | 28 (10.0%) | 0 (0.0%) |
| 75 Years and over | 0 (0.0%) | 9 (4.9%) |
| Total | 40 (5.0%) | 48 (5.3%) |
Income Above Poverty by Sex and Age in Toro Canyon
According to the poverty statistics in Toro Canyon, males aged under 5 years and females aged under 5 years are the age groups that are most secure financially, with 100.0% of males and 100.0% of females in these age groups living above the poverty line.
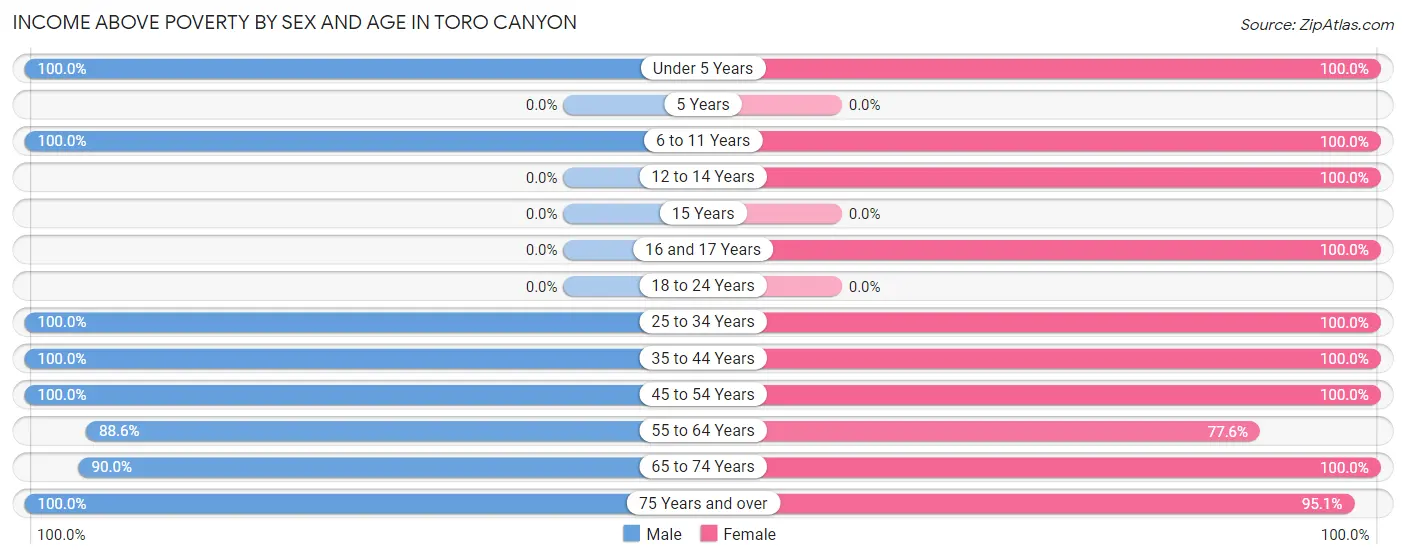
| Age Bracket | Male | Female |
| Under 5 Years | 50 (100.0%) | 40 (100.0%) |
| 5 Years | 0 (0.0%) | 0 (0.0%) |
| 6 to 11 Years | 33 (100.0%) | 45 (100.0%) |
| 12 to 14 Years | 0 (0.0%) | 22 (100.0%) |
| 15 Years | 0 (0.0%) | 0 (0.0%) |
| 16 and 17 Years | 0 (0.0%) | 19 (100.0%) |
| 18 to 24 Years | 0 (0.0%) | 0 (0.0%) |
| 25 to 34 Years | 18 (100.0%) | 84 (100.0%) |
| 35 to 44 Years | 95 (100.0%) | 97 (100.0%) |
| 45 to 54 Years | 34 (100.0%) | 15 (100.0%) |
| 55 to 64 Years | 93 (88.6%) | 135 (77.6%) |
| 65 to 74 Years | 251 (90.0%) | 218 (100.0%) |
| 75 Years and over | 179 (100.0%) | 174 (95.1%) |
| Total | 753 (95.0%) | 849 (94.7%) |
Income Below Poverty Among Married-Couple Families in Toro Canyon
The poverty statistics for married-couple families in Toro Canyon show that 5.8% or 28 of the total 482 families live below the poverty line. Families with no children have the highest poverty rate of 7.8%, comprising of 28 families. On the other hand, families with 1 or 2 children have the lowest poverty rate of 0.0%, which includes 0 families.
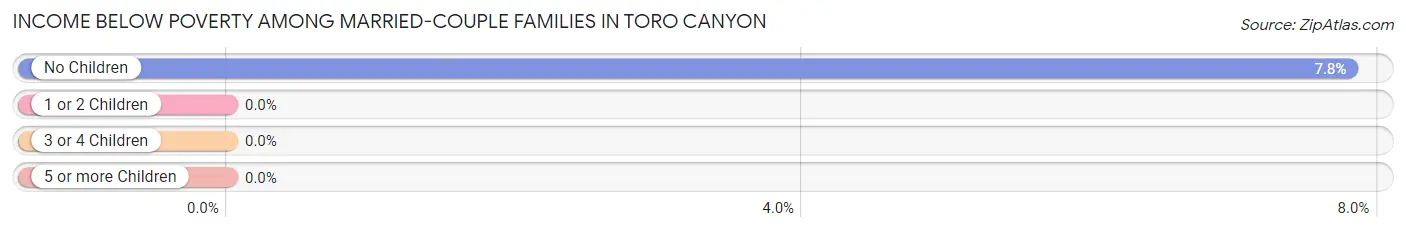
| Children | Above Poverty | Below Poverty |
| No Children | 331 (92.2%) | 28 (7.8%) |
| 1 or 2 Children | 105 (100.0%) | 0 (0.0%) |
| 3 or 4 Children | 18 (100.0%) | 0 (0.0%) |
| 5 or more Children | 0 (0.0%) | 0 (0.0%) |
| Total | 454 (94.2%) | 28 (5.8%) |
Income Below Poverty Among Single-Parent Households in Toro Canyon
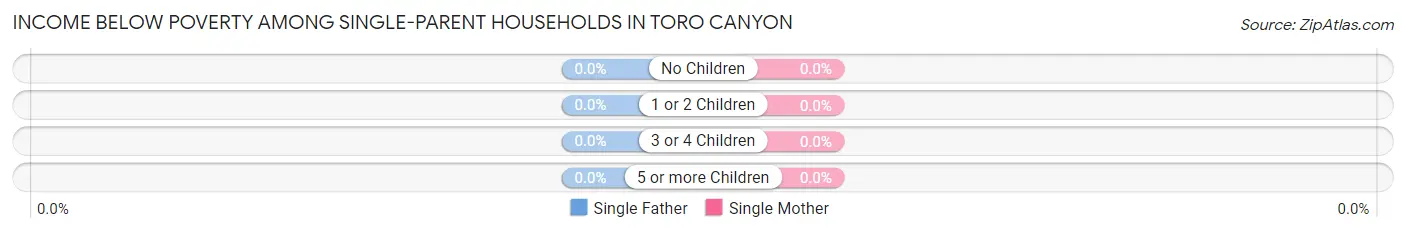
| Children | Single Father | Single Mother |
| No Children | 0 (0.0%) | 0 (0.0%) |
| 1 or 2 Children | 0 (0.0%) | 0 (0.0%) |
| 3 or 4 Children | 0 (0.0%) | 0 (0.0%) |
| 5 or more Children | 0 (0.0%) | 0 (0.0%) |
| Total | 0 (0.0%) | 0 (0.0%) |
Income Below Poverty Among Married-Couple vs Single-Parent Households in Toro Canyon
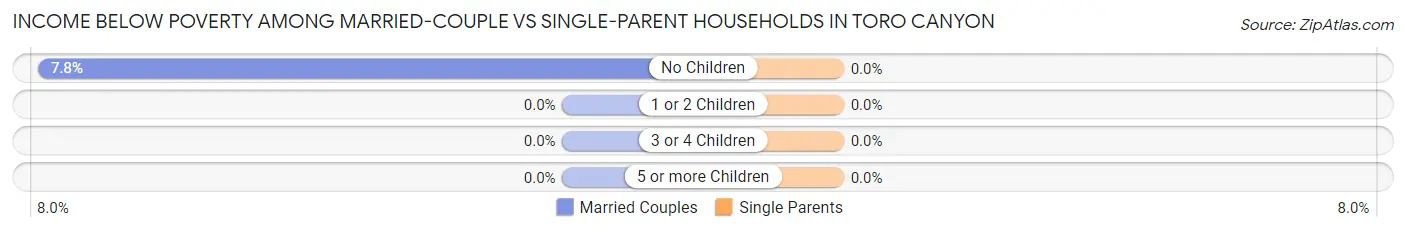
| Children | Married-Couple Families | Single-Parent Households |
| No Children | 28 (7.8%) | 0 (0.0%) |
| 1 or 2 Children | 0 (0.0%) | 0 (0.0%) |
| 3 or 4 Children | 0 (0.0%) | 0 (0.0%) |
| 5 or more Children | 0 (0.0%) | 0 (0.0%) |
| Total | 28 (5.8%) | 0 (0.0%) |
Race in Toro Canyon
The most populous races in Toro Canyon are White / Caucasian (1,311 | 77.5%), Hispanic or Latino (221 | 13.1%), and Some other Race (202 | 11.9%).
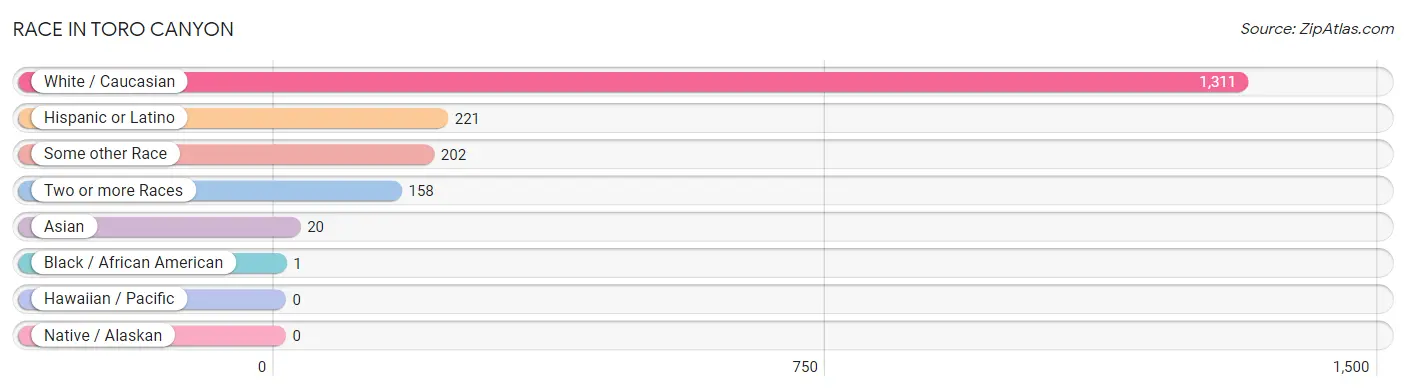
| Race | # Population | % Population |
| Asian | 20 | 1.2% |
| Black / African American | 1 | 0.1% |
| Hawaiian / Pacific | 0 | 0.0% |
| Hispanic or Latino | 221 | 13.1% |
| Native / Alaskan | 0 | 0.0% |
| White / Caucasian | 1,311 | 77.5% |
| Two or more Races | 158 | 9.3% |
| Some other Race | 202 | 11.9% |
| Total | 1,692 | 100.0% |
Ancestry in Toro Canyon
The most populous ancestries reported in Toro Canyon are English (186 | 11.0%), German (152 | 9.0%), Italian (152 | 9.0%), Dutch (123 | 7.3%), and Norwegian (114 | 6.7%), together accounting for 43.0% of all Toro Canyon residents.
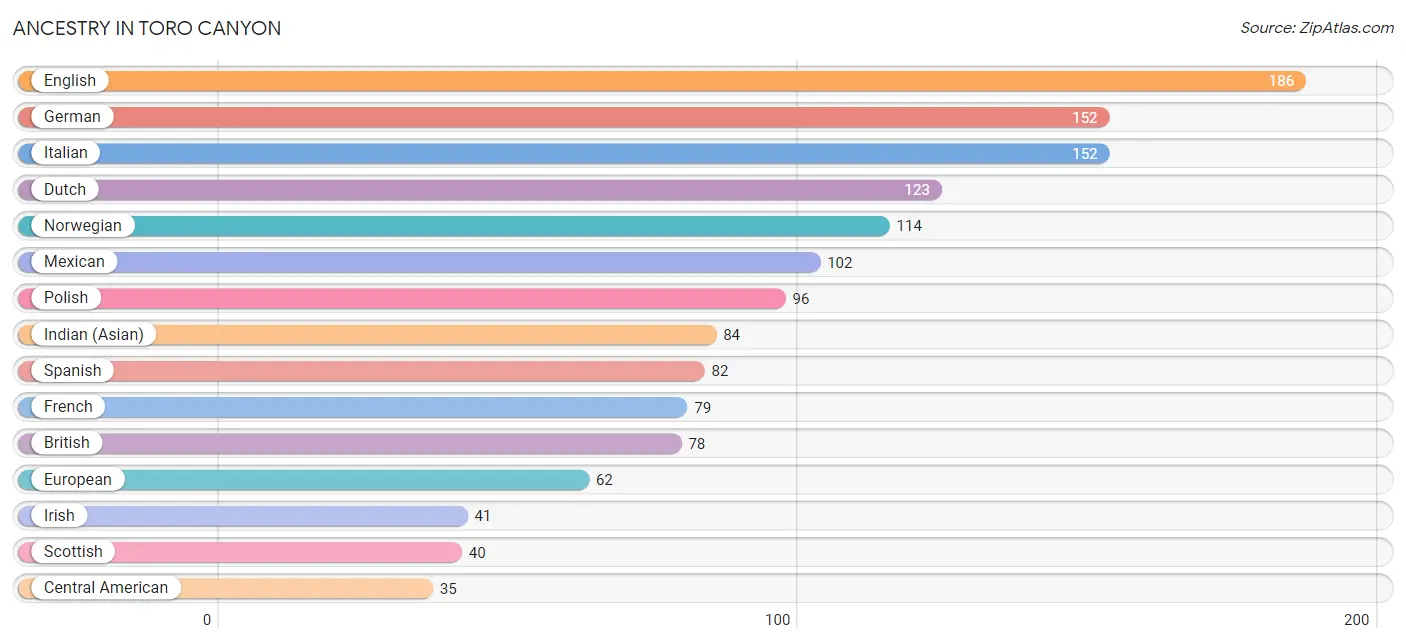
| Ancestry | # Population | % Population |
| American | 28 | 1.7% |
| Arab | 10 | 0.6% |
| Austrian | 21 | 1.2% |
| Belgian | 10 | 0.6% |
| British | 78 | 4.6% |
| Cambodian | 25 | 1.5% |
| Central American | 35 | 2.1% |
| Choctaw | 25 | 1.5% |
| Costa Rican | 29 | 1.7% |
| Croatian | 6 | 0.4% |
| Dutch | 123 | 7.3% |
| Egyptian | 10 | 0.6% |
| English | 186 | 11.0% |
| European | 62 | 3.7% |
| Finnish | 9 | 0.5% |
| French | 79 | 4.7% |
| German | 152 | 9.0% |
| Greek | 7 | 0.4% |
| Guatemalan | 6 | 0.4% |
| Indian (Asian) | 84 | 5.0% |
| Irish | 41 | 2.4% |
| Italian | 152 | 9.0% |
| Mexican | 102 | 6.0% |
| Norwegian | 114 | 6.7% |
| Polish | 96 | 5.7% |
| Portuguese | 10 | 0.6% |
| Russian | 32 | 1.9% |
| Scotch-Irish | 6 | 0.4% |
| Scottish | 40 | 2.4% |
| Spanish | 82 | 4.9% |
| Swedish | 16 | 0.9% |
| Swiss | 14 | 0.8% |
| Welsh | 13 | 0.8% | View All 33 Rows |
Immigrants in Toro Canyon
The most numerous immigrant groups reported in Toro Canyon came from Europe (145 | 8.6%), Western Europe (117 | 6.9%), Asia (93 | 5.5%), Netherlands (69 | 4.1%), and Iran (46 | 2.7%), together accounting for 27.8% of all Toro Canyon residents.
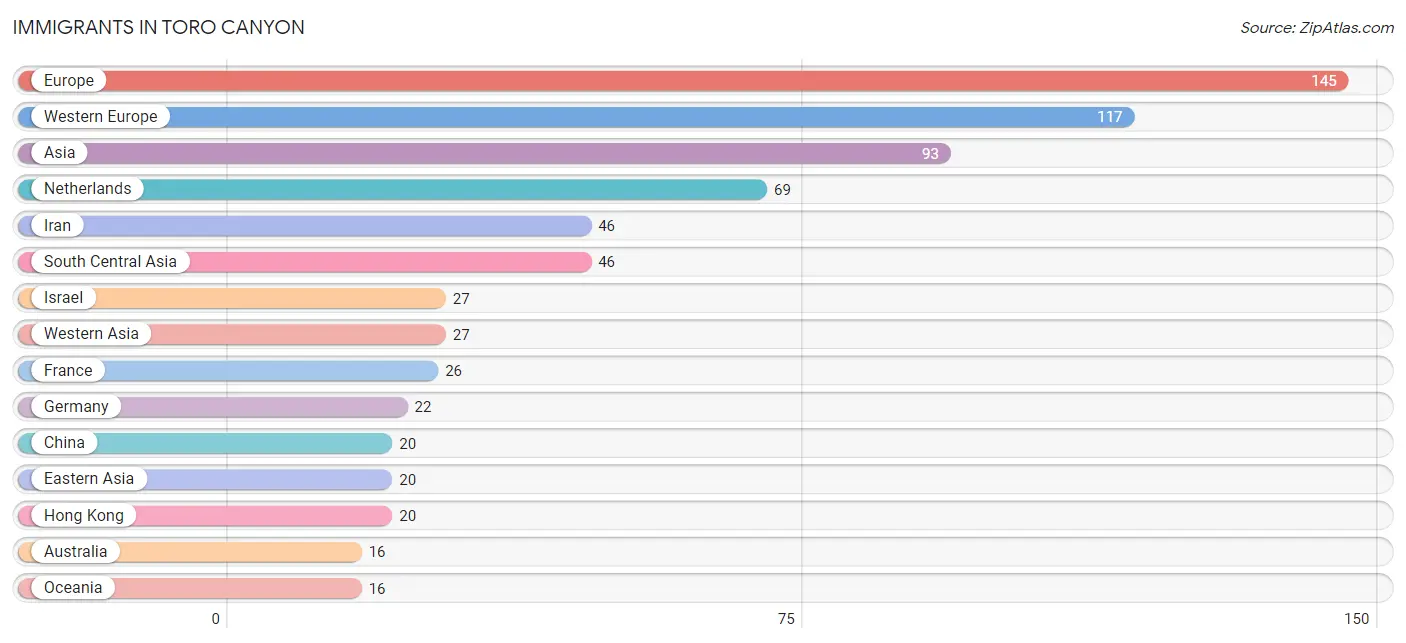
| Immigration Origin | # Population | % Population |
| Africa | 10 | 0.6% |
| Asia | 93 | 5.5% |
| Australia | 16 | 0.9% |
| Bolivia | 4 | 0.2% |
| Canada | 8 | 0.5% |
| Central America | 6 | 0.4% |
| China | 20 | 1.2% |
| Eastern Asia | 20 | 1.2% |
| Eastern Europe | 7 | 0.4% |
| Egypt | 10 | 0.6% |
| England | 12 | 0.7% |
| Europe | 145 | 8.6% |
| France | 26 | 1.5% |
| Germany | 22 | 1.3% |
| Guatemala | 6 | 0.4% |
| Hong Kong | 20 | 1.2% |
| Iran | 46 | 2.7% |
| Israel | 27 | 1.6% |
| Italy | 9 | 0.5% |
| Latin America | 10 | 0.6% |
| Netherlands | 69 | 4.1% |
| Northern Africa | 10 | 0.6% |
| Northern Europe | 12 | 0.7% |
| Oceania | 16 | 0.9% |
| Poland | 7 | 0.4% |
| South America | 4 | 0.2% |
| South Central Asia | 46 | 2.7% |
| Southern Europe | 9 | 0.5% |
| Western Asia | 27 | 1.6% |
| Western Europe | 117 | 6.9% | View All 30 Rows |
Sex and Age in Toro Canyon
Sex and Age in Toro Canyon
The most populous age groups in Toro Canyon are 70 to 74 Years (148 | 18.7%) for men and 65 to 69 Years (141 | 15.7%) for women.
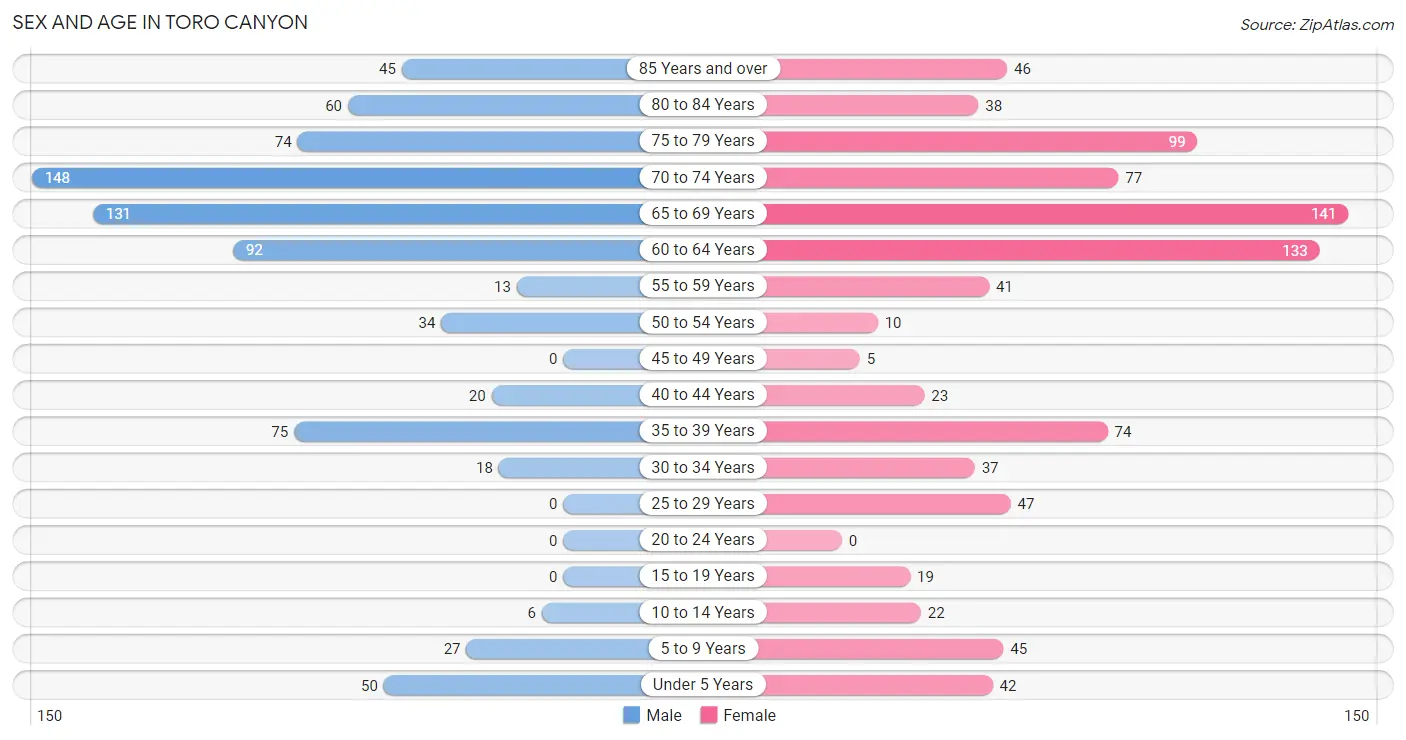
| Age Bracket | Male | Female |
| Under 5 Years | 50 (6.3%) | 42 (4.7%) |
| 5 to 9 Years | 27 (3.4%) | 45 (5.0%) |
| 10 to 14 Years | 6 (0.8%) | 22 (2.5%) |
| 15 to 19 Years | 0 (0.0%) | 19 (2.1%) |
| 20 to 24 Years | 0 (0.0%) | 0 (0.0%) |
| 25 to 29 Years | 0 (0.0%) | 47 (5.2%) |
| 30 to 34 Years | 18 (2.3%) | 37 (4.1%) |
| 35 to 39 Years | 75 (9.5%) | 74 (8.2%) |
| 40 to 44 Years | 20 (2.5%) | 23 (2.6%) |
| 45 to 49 Years | 0 (0.0%) | 5 (0.6%) |
| 50 to 54 Years | 34 (4.3%) | 10 (1.1%) |
| 55 to 59 Years | 13 (1.6%) | 41 (4.6%) |
| 60 to 64 Years | 92 (11.6%) | 133 (14.8%) |
| 65 to 69 Years | 131 (16.5%) | 141 (15.7%) |
| 70 to 74 Years | 148 (18.7%) | 77 (8.6%) |
| 75 to 79 Years | 74 (9.3%) | 99 (11.0%) |
| 80 to 84 Years | 60 (7.6%) | 38 (4.2%) |
| 85 Years and over | 45 (5.7%) | 46 (5.1%) |
| Total | 793 (100.0%) | 899 (100.0%) |
Families and Households in Toro Canyon
Median Family Size in Toro Canyon
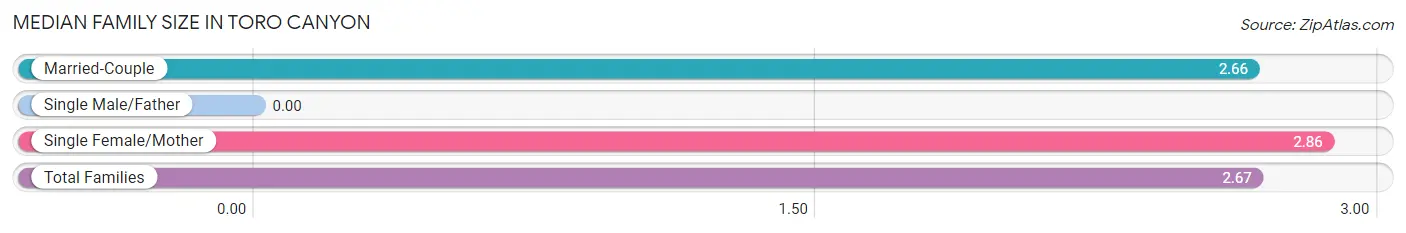
| Family Type | # Families | Family Size |
| Married-Couple | 482 (98.6%) | 2.66 |
| Single Male/Father | 0 (0.0%) | - |
| Single Female/Mother | 7 (1.4%) | 2.86 |
| Total Families | 489 (100.0%) | 2.67 |
Median Household Size in Toro Canyon
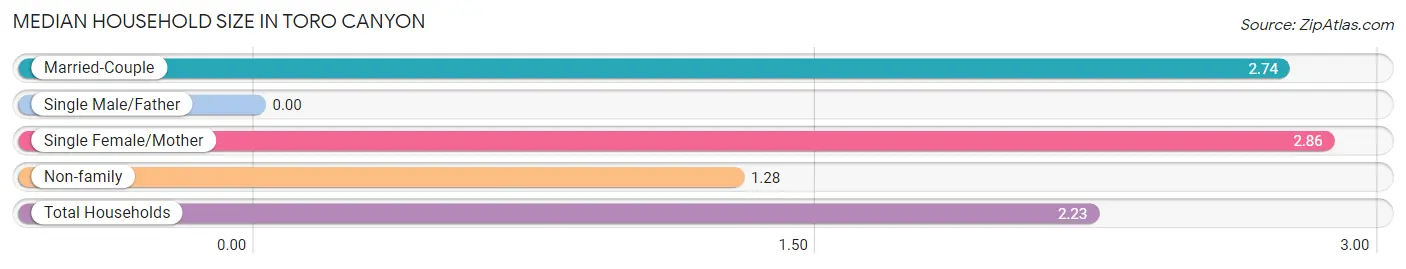
| Household Type | # Households | Household Size |
| Married-Couple | 482 (63.6%) | 2.74 |
| Single Male/Father | 0 (0.0%) | - |
| Single Female/Mother | 7 (0.9%) | 2.86 |
| Non-family | 269 (35.5%) | 1.28 |
| Total Households | 758 (100.0%) | 2.23 |
Household Size by Marriage Status in Toro Canyon
Out of a total of 758 households in Toro Canyon, 489 (64.5%) are family households, while 269 (35.5%) are nonfamily households. The most numerous type of family households are 2-person households, comprising 325, and the most common type of nonfamily households are 1-person households, comprising 197.
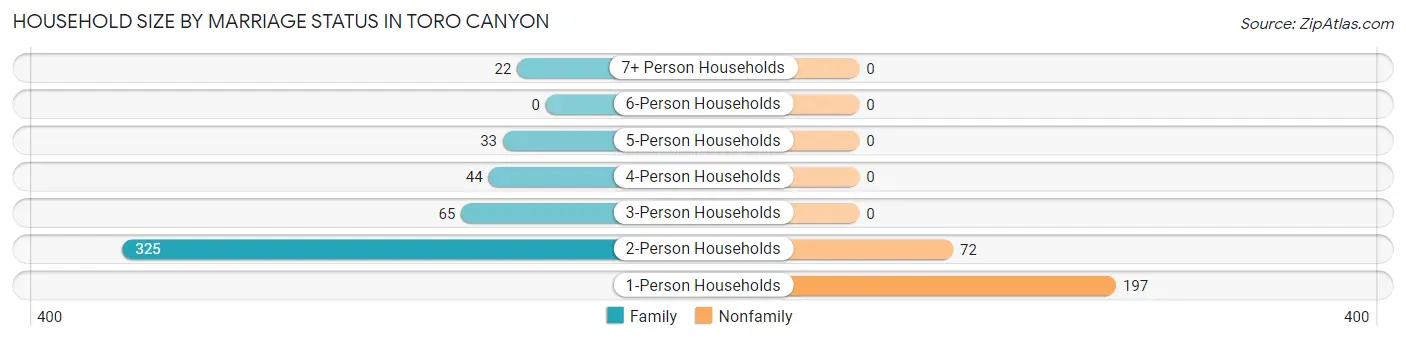
| Household Size | Family Households | Nonfamily Households |
| 1-Person Households | - | 197 (26.0%) |
| 2-Person Households | 325 (42.9%) | 72 (9.5%) |
| 3-Person Households | 65 (8.6%) | 0 (0.0%) |
| 4-Person Households | 44 (5.8%) | 0 (0.0%) |
| 5-Person Households | 33 (4.3%) | 0 (0.0%) |
| 6-Person Households | 0 (0.0%) | 0 (0.0%) |
| 7+ Person Households | 22 (2.9%) | 0 (0.0%) |
| Total | 489 (64.5%) | 269 (35.5%) |
Female Fertility in Toro Canyon
Fertility by Age in Toro Canyon
Average fertility rate in Toro Canyon is 205.0 births per 1,000 women. Women in the age bracket of 35 to 50 years have the highest fertility rate with 235.0 births per 1,000 women. Women in the age bracket of 35 to 50 years acount for 57.1% of all women with births.
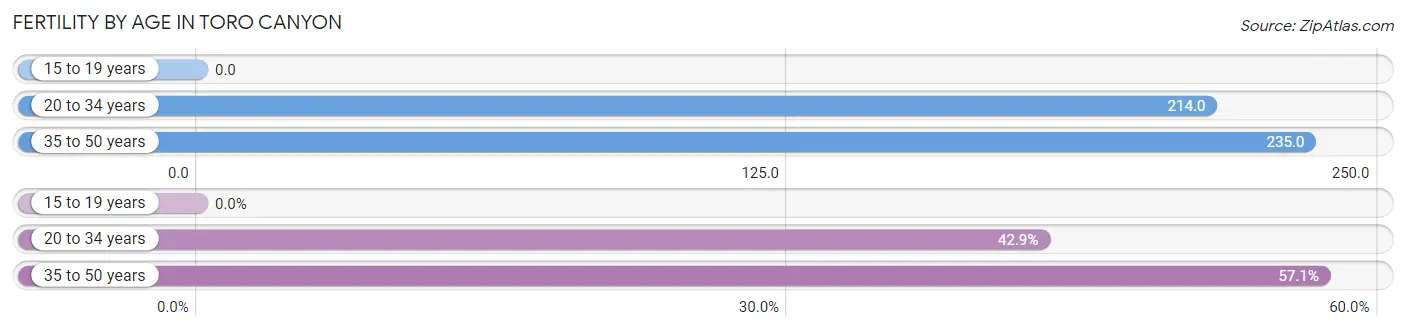
| Age Bracket | Women with Births | Births / 1,000 Women |
| 15 to 19 years | 0 (0.0%) | 0.0 |
| 20 to 34 years | 18 (42.9%) | 214.0 |
| 35 to 50 years | 24 (57.1%) | 235.0 |
| Total | 42 (100.0%) | 205.0 |
Fertility by Age by Marriage Status in Toro Canyon
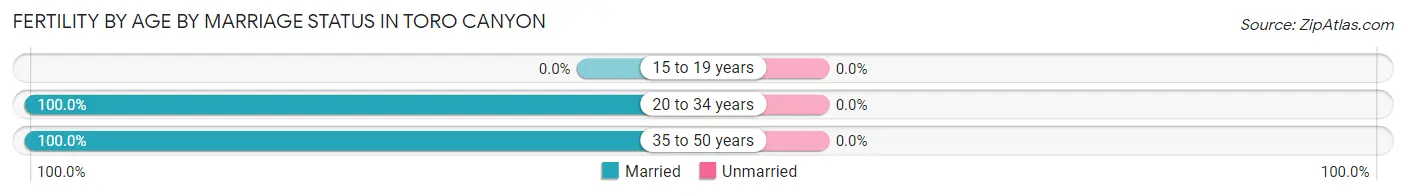
| Age Bracket | Married | Unmarried |
| 15 to 19 years | 0 (0.0%) | 0 (0.0%) |
| 20 to 34 years | 18 (100.0%) | 0 (0.0%) |
| 35 to 50 years | 24 (100.0%) | 0 (0.0%) |
| Total | 42 (100.0%) | 0 (0.0%) |
Fertility by Education in Toro Canyon
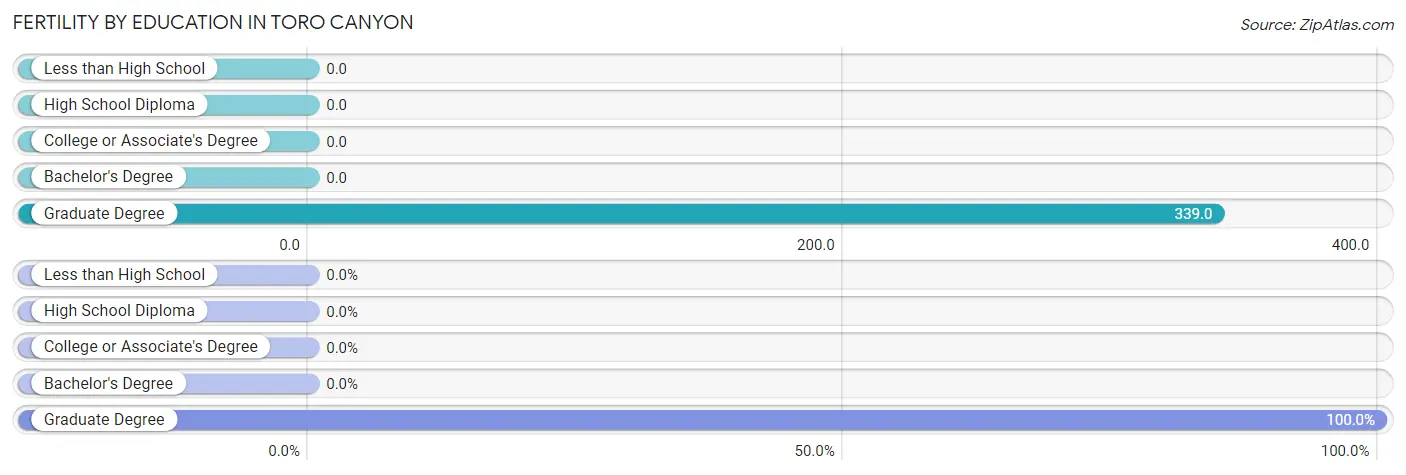
| Educational Attainment | Women with Births | Births / 1,000 Women |
| Less than High School | 0 (0.0%) | 0.0 |
| High School Diploma | 0 (0.0%) | 0.0 |
| College or Associate's Degree | 0 (0.0%) | 0.0 |
| Bachelor's Degree | 0 (0.0%) | 0.0 |
| Graduate Degree | 42 (100.0%) | 339.0 |
| Total | 42 (100.0%) | 205.0 |
Fertility by Education by Marriage Status in Toro Canyon
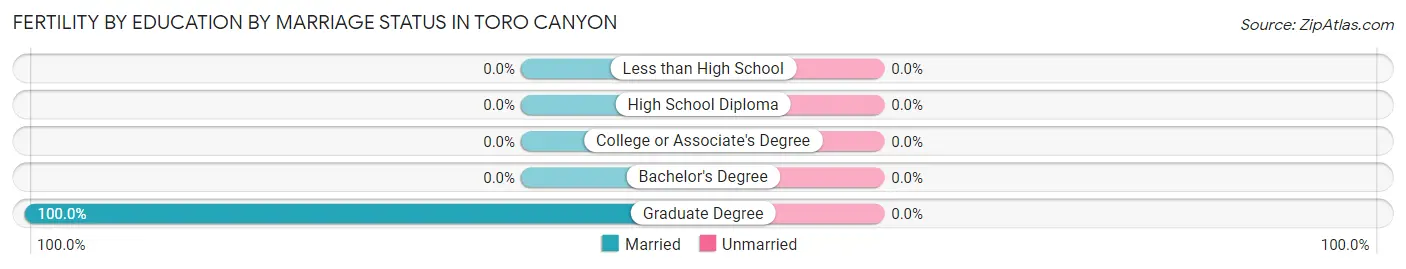
| Educational Attainment | Married | Unmarried |
| Less than High School | 0 (0.0%) | 0 (0.0%) |
| High School Diploma | 0 (0.0%) | 0 (0.0%) |
| College or Associate's Degree | 0 (0.0%) | 0 (0.0%) |
| Bachelor's Degree | 0 (0.0%) | 0 (0.0%) |
| Graduate Degree | 42 (100.0%) | 0 (0.0%) |
| Total | 42 (100.0%) | 0 (0.0%) |
Employment Characteristics in Toro Canyon
Employment by Class of Employer in Toro Canyon
Among the 608 employed individuals in Toro Canyon, private company employees (252 | 41.4%), self-employed (incorporated) (142 | 23.4%), and self-employed (not incorporated) (110 | 18.1%) make up the most common classes of employment.
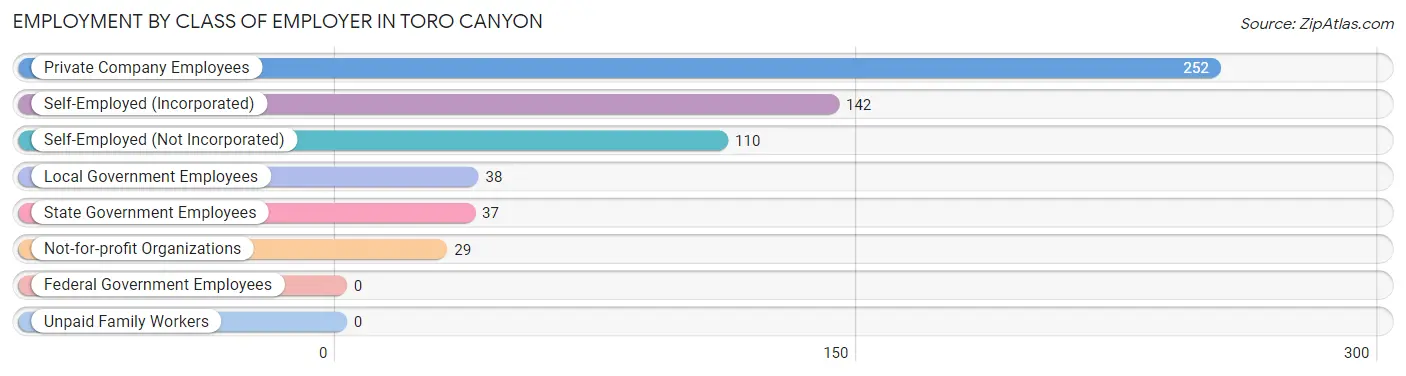
| Employer Class | # Employees | % Employees |
| Private Company Employees | 252 | 41.4% |
| Self-Employed (Incorporated) | 142 | 23.4% |
| Self-Employed (Not Incorporated) | 110 | 18.1% |
| Not-for-profit Organizations | 29 | 4.8% |
| Local Government Employees | 38 | 6.2% |
| State Government Employees | 37 | 6.1% |
| Federal Government Employees | 0 | 0.0% |
| Unpaid Family Workers | 0 | 0.0% |
| Total | 608 | 100.0% |
Employment Status by Age in Toro Canyon
According to the labor force statistics for Toro Canyon, out of the total population over 16 years of age (1,500), 50.2% or 753 individuals are in the labor force, with 7.7% or 58 of them unemployed. The age group with the highest labor force participation rate is 25 to 29 years, with 100.0% or 47 individuals in the labor force. Within the labor force, the 75 years and over age range has the highest percentage of unemployed individuals, with 43.9% or 25 of them being unemployed.
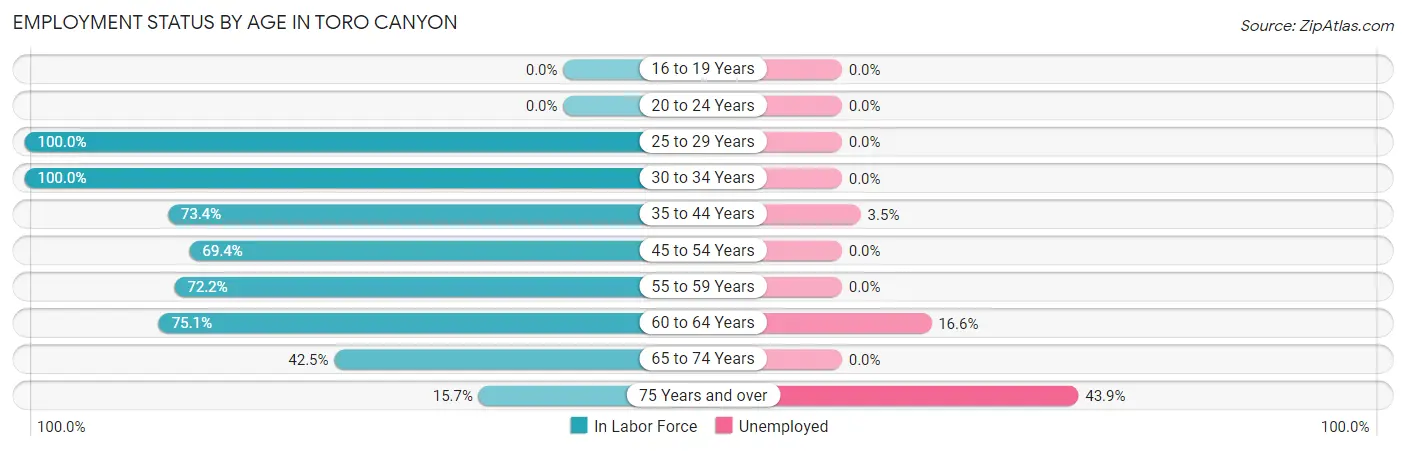
| Age Bracket | In Labor Force | Unemployed |
| 16 to 19 Years | 0 (0.0%) | 0 (0.0%) |
| 20 to 24 Years | 0 (0.0%) | 0 (0.0%) |
| 25 to 29 Years | 47 (100.0%) | 0 (0.0%) |
| 30 to 34 Years | 55 (100.0%) | 0 (0.0%) |
| 35 to 44 Years | 141 (73.4%) | 5 (3.5%) |
| 45 to 54 Years | 34 (69.4%) | 0 (0.0%) |
| 55 to 59 Years | 39 (72.2%) | 0 (0.0%) |
| 60 to 64 Years | 169 (75.1%) | 28 (16.6%) |
| 65 to 74 Years | 211 (42.5%) | 0 (0.0%) |
| 75 Years and over | 57 (15.7%) | 25 (43.9%) |
| Total | 753 (50.2%) | 58 (7.7%) |
Employment Status by Educational Attainment in Toro Canyon
According to labor force statistics for Toro Canyon, 78.0% of individuals (485) out of the total population between 25 and 64 years of age (622) are in the labor force, with 6.8% or 33 of them being unemployed. The group with the highest labor force participation rate are those with the educational attainment of college / associate degree, with 89.8% or 123 individuals in the labor force. Within the labor force, individuals with bachelor's degree or higher education have the highest percentage of unemployment, with 9.9% or 33 of them being unemployed.
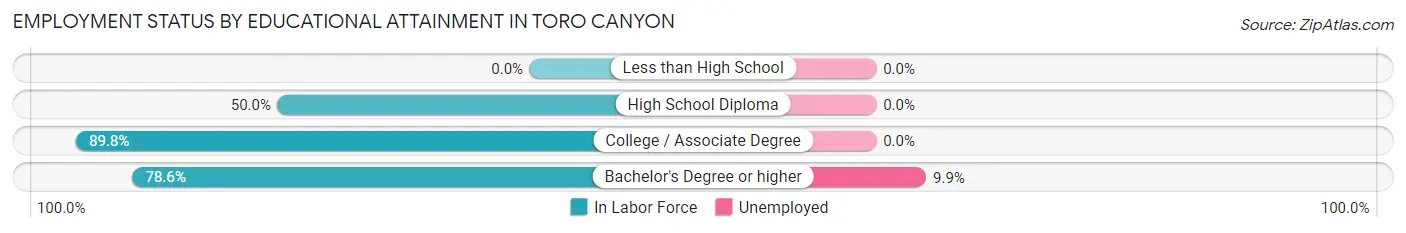
| Educational Attainment | In Labor Force | Unemployed |
| Less than High School | 0 (0.0%) | 0 (0.0%) |
| High School Diploma | 27 (50.0%) | 0 (0.0%) |
| College / Associate Degree | 123 (89.8%) | 0 (0.0%) |
| Bachelor's Degree or higher | 335 (78.6%) | 42 (9.9%) |
| Total | 485 (78.0%) | 42 (6.8%) |
Employment Occupations by Sex in Toro Canyon
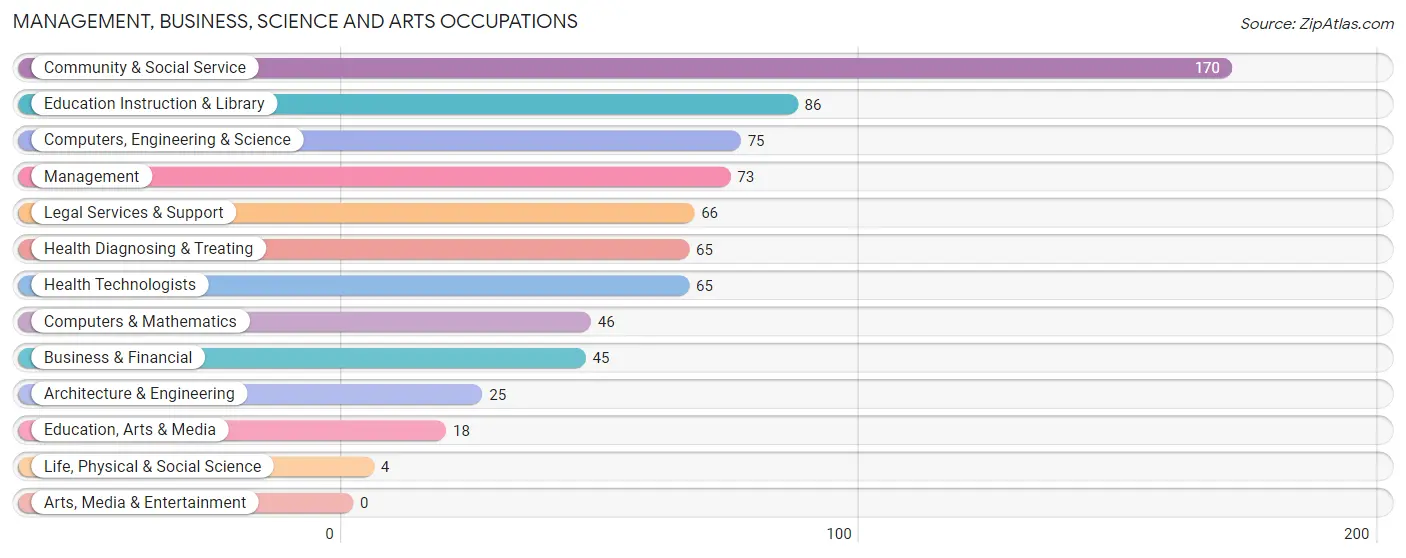
Management, Business, Science and Arts Occupations
The most common Management, Business, Science and Arts occupations in Toro Canyon are Community & Social Service (170 | 24.5%), Education Instruction & Library (86 | 12.4%), Computers, Engineering & Science (75 | 10.8%), Management (73 | 10.5%), and Legal Services & Support (66 | 9.5%).
Management, Business, Science and Arts Occupations by Sex
Within the Management, Business, Science and Arts occupations in Toro Canyon, the most male-oriented occupations are Architecture & Engineering (100.0%), Management (90.4%), and Computers, Engineering & Science (65.3%), while the most female-oriented occupations are Life, Physical & Social Science (100.0%), Education, Arts & Media (100.0%), and Health Diagnosing & Treating (81.5%).
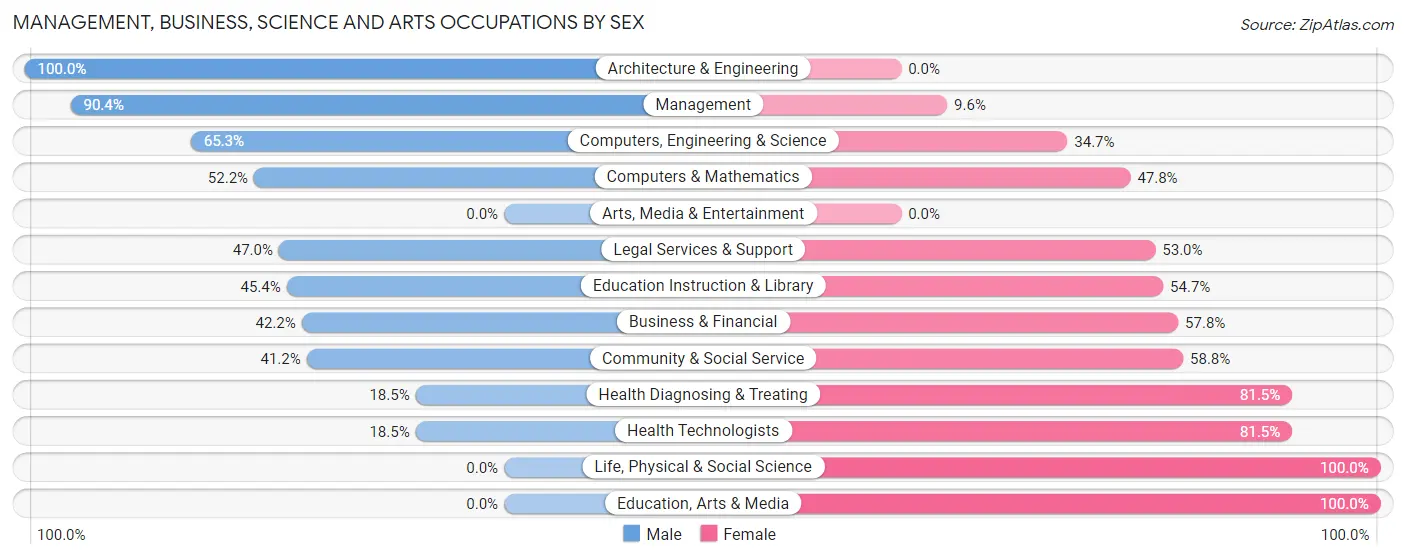
| Occupation | Male | Female |
| Management | 66 (90.4%) | 7 (9.6%) |
| Business & Financial | 19 (42.2%) | 26 (57.8%) |
| Computers, Engineering & Science | 49 (65.3%) | 26 (34.7%) |
| Computers & Mathematics | 24 (52.2%) | 22 (47.8%) |
| Architecture & Engineering | 25 (100.0%) | 0 (0.0%) |
| Life, Physical & Social Science | 0 (0.0%) | 4 (100.0%) |
| Community & Social Service | 70 (41.2%) | 100 (58.8%) |
| Education, Arts & Media | 0 (0.0%) | 18 (100.0%) |
| Legal Services & Support | 31 (47.0%) | 35 (53.0%) |
| Education Instruction & Library | 39 (45.4%) | 47 (54.6%) |
| Arts, Media & Entertainment | 0 (0.0%) | 0 (0.0%) |
| Health Diagnosing & Treating | 12 (18.5%) | 53 (81.5%) |
| Health Technologists | 12 (18.5%) | 53 (81.5%) |
| Total (Category) | 216 (50.5%) | 212 (49.5%) |
| Total (Overall) | 359 (51.6%) | 336 (48.3%) |
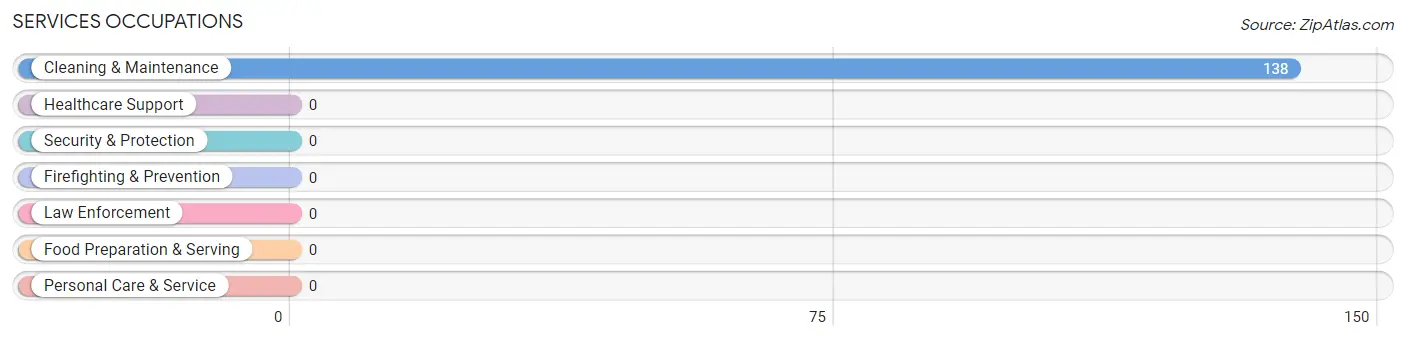
Services Occupations
The most common Services occupations in Toro Canyon are , and Cleaning & Maintenance (138 | 19.9%).
Services Occupations by Sex
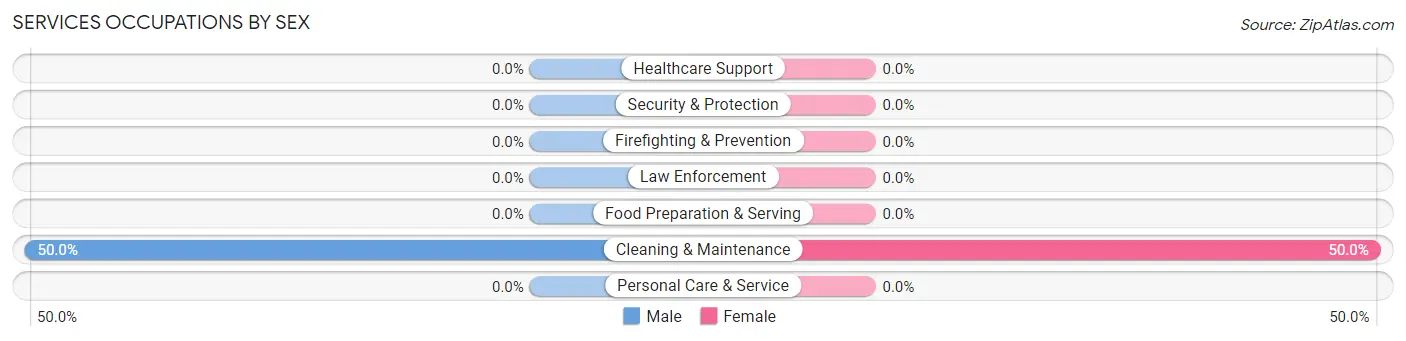
| Occupation | Male | Female |
| Healthcare Support | 0 (0.0%) | 0 (0.0%) |
| Security & Protection | 0 (0.0%) | 0 (0.0%) |
| Firefighting & Prevention | 0 (0.0%) | 0 (0.0%) |
| Law Enforcement | 0 (0.0%) | 0 (0.0%) |
| Food Preparation & Serving | 0 (0.0%) | 0 (0.0%) |
| Cleaning & Maintenance | 69 (50.0%) | 69 (50.0%) |
| Personal Care & Service | 0 (0.0%) | 0 (0.0%) |
| Total (Category) | 69 (50.0%) | 69 (50.0%) |
| Total (Overall) | 359 (51.6%) | 336 (48.3%) |
Sales and Office Occupations
The most common Sales and Office occupations in Toro Canyon are Office & Administration (42 | 6.0%), and Sales & Related (20 | 2.9%).
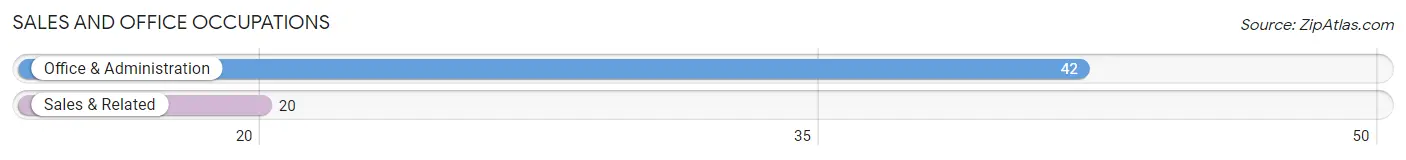
Sales and Office Occupations by Sex
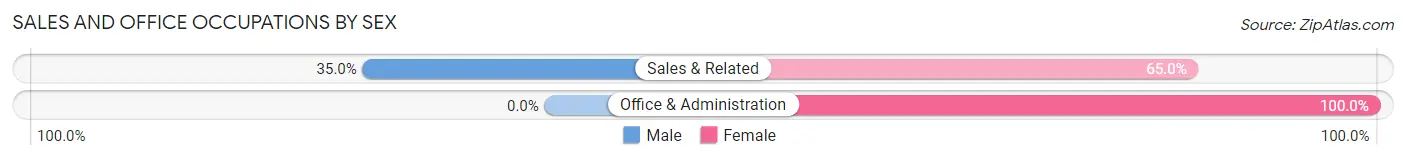
| Occupation | Male | Female |
| Sales & Related | 7 (35.0%) | 13 (65.0%) |
| Office & Administration | 0 (0.0%) | 42 (100.0%) |
| Total (Category) | 7 (11.3%) | 55 (88.7%) |
| Total (Overall) | 359 (51.6%) | 336 (48.3%) |
Natural Resources, Construction and Maintenance Occupations
The most common Natural Resources, Construction and Maintenance occupations in Toro Canyon are Installation, Maintenance & Repair (27 | 3.9%), Construction & Extraction (22 | 3.2%), and Farming, Fishing & Forestry (18 | 2.6%).
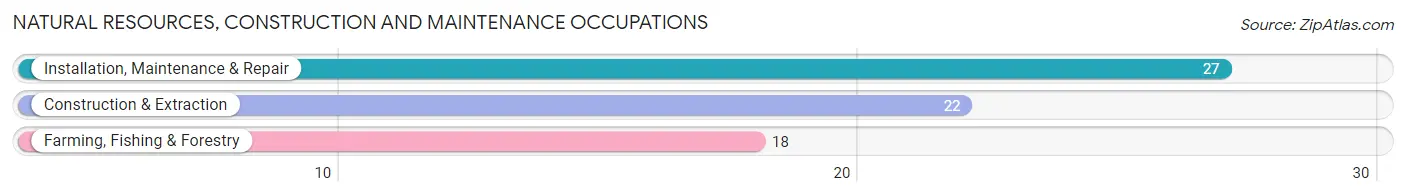
Natural Resources, Construction and Maintenance Occupations by Sex
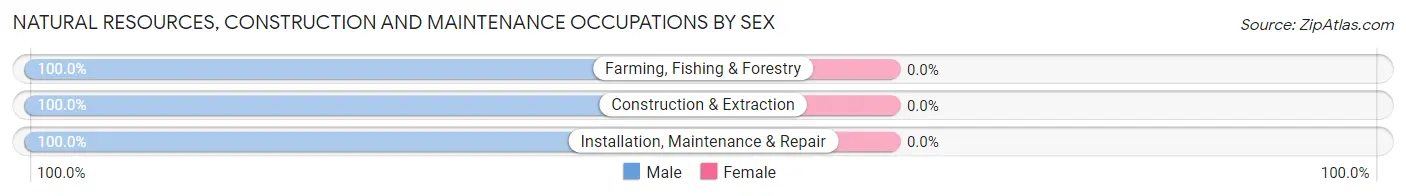
| Occupation | Male | Female |
| Farming, Fishing & Forestry | 18 (100.0%) | 0 (0.0%) |
| Construction & Extraction | 22 (100.0%) | 0 (0.0%) |
| Installation, Maintenance & Repair | 27 (100.0%) | 0 (0.0%) |
| Total (Category) | 67 (100.0%) | 0 (0.0%) |
| Total (Overall) | 359 (51.6%) | 336 (48.3%) |
Production, Transportation and Moving Occupations
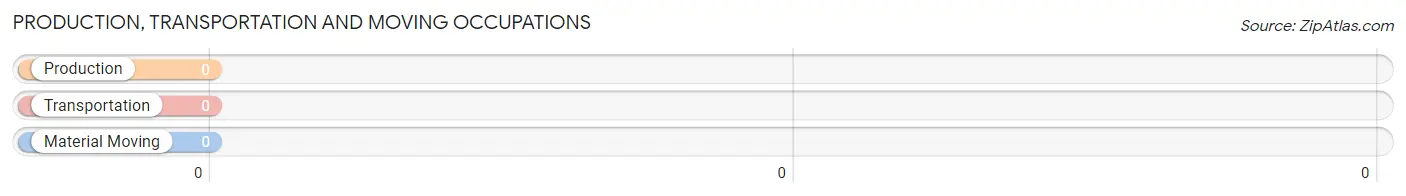
Production, Transportation and Moving Occupations by Sex
| Occupation | Male | Female |
| Production | 0 (0.0%) | 0 (0.0%) |
| Transportation | 0 (0.0%) | 0 (0.0%) |
| Material Moving | 0 (0.0%) | 0 (0.0%) |
| Total (Category) | 0 (0.0%) | 0 (0.0%) |
| Total (Overall) | 359 (51.6%) | 336 (48.3%) |
Employment Industries by Sex in Toro Canyon
Employment Industries in Toro Canyon
The major employment industries in Toro Canyon include Professional & Scientific (145 | 20.9%), Wholesale Trade (144 | 20.7%), Educational Services (109 | 15.7%), Health Care & Social Assistance (65 | 9.3%), and Real Estate, Rental & Leasing (46 | 6.6%).
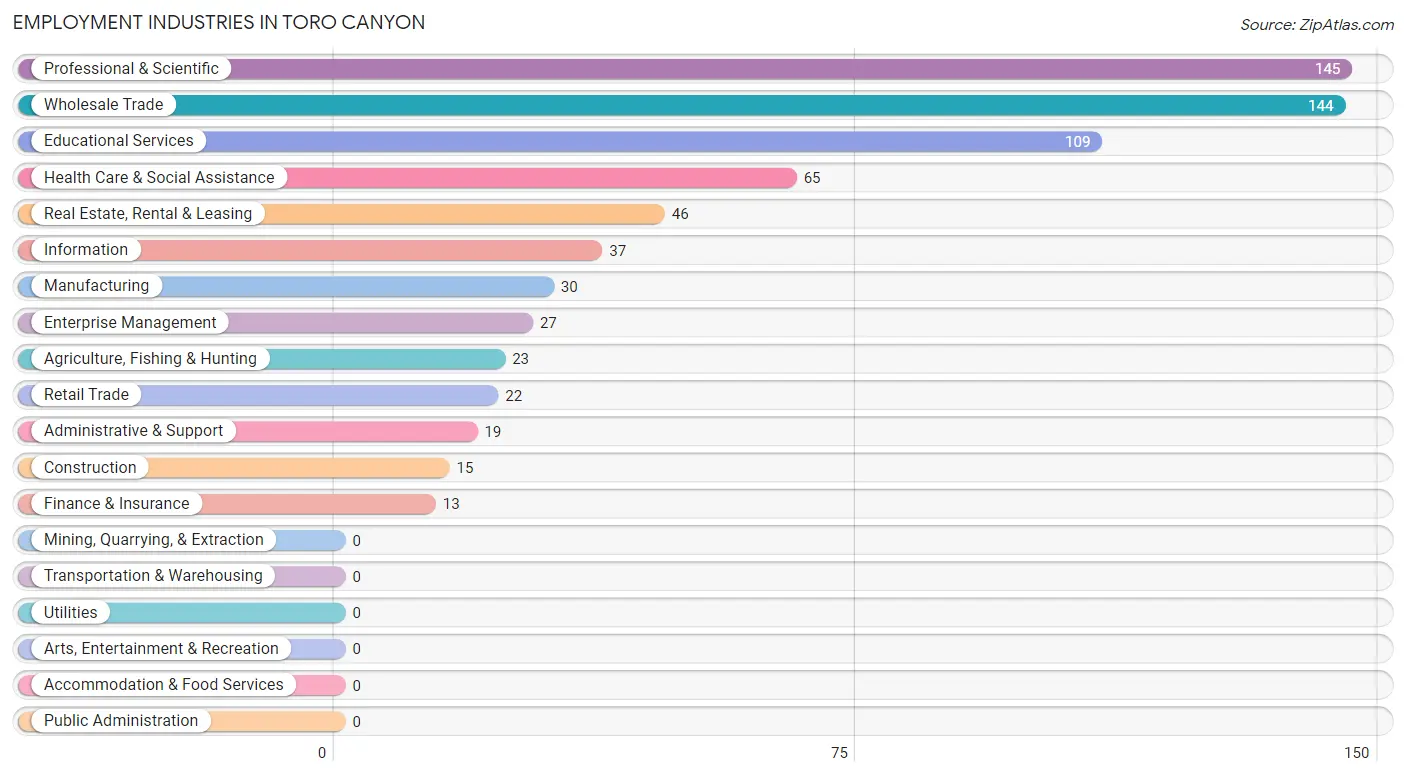
Employment Industries by Sex in Toro Canyon
The Toro Canyon industries that see more men than women are Agriculture, Fishing & Hunting (100.0%), Construction (100.0%), and Finance & Insurance (100.0%), whereas the industries that tend to have a higher number of women are Retail Trade (100.0%), Administrative & Support (100.0%), and Health Care & Social Assistance (81.5%).
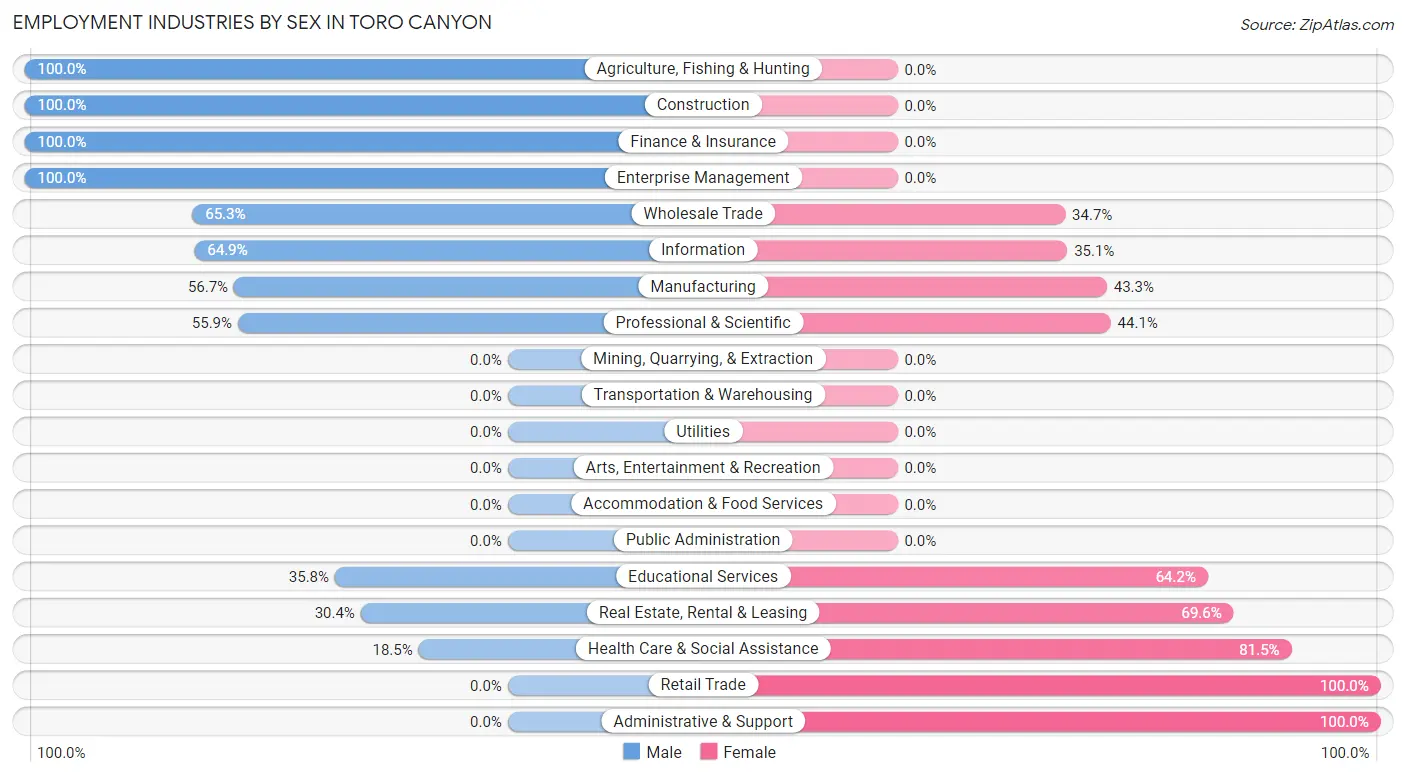
| Industry | Male | Female |
| Agriculture, Fishing & Hunting | 23 (100.0%) | 0 (0.0%) |
| Mining, Quarrying, & Extraction | 0 (0.0%) | 0 (0.0%) |
| Construction | 15 (100.0%) | 0 (0.0%) |
| Manufacturing | 17 (56.7%) | 13 (43.3%) |
| Wholesale Trade | 94 (65.3%) | 50 (34.7%) |
| Retail Trade | 0 (0.0%) | 22 (100.0%) |
| Transportation & Warehousing | 0 (0.0%) | 0 (0.0%) |
| Utilities | 0 (0.0%) | 0 (0.0%) |
| Information | 24 (64.9%) | 13 (35.1%) |
| Finance & Insurance | 13 (100.0%) | 0 (0.0%) |
| Real Estate, Rental & Leasing | 14 (30.4%) | 32 (69.6%) |
| Professional & Scientific | 81 (55.9%) | 64 (44.1%) |
| Enterprise Management | 27 (100.0%) | 0 (0.0%) |
| Administrative & Support | 0 (0.0%) | 19 (100.0%) |
| Educational Services | 39 (35.8%) | 70 (64.2%) |
| Health Care & Social Assistance | 12 (18.5%) | 53 (81.5%) |
| Arts, Entertainment & Recreation | 0 (0.0%) | 0 (0.0%) |
| Accommodation & Food Services | 0 (0.0%) | 0 (0.0%) |
| Public Administration | 0 (0.0%) | 0 (0.0%) |
| Total | 359 (51.6%) | 336 (48.3%) |
Education in Toro Canyon
School Enrollment in Toro Canyon
The most common levels of schooling among the 222 students in Toro Canyon are elementary school (72 | 32.4%), college / undergraduate (53 | 23.9%), and middle school (28 | 12.6%).
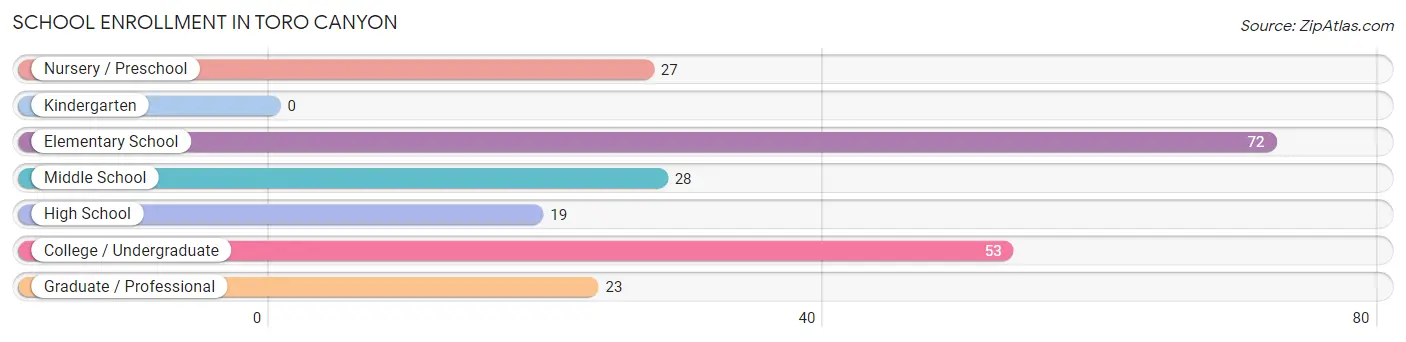
| School Level | # Students | % Students |
| Nursery / Preschool | 27 | 12.2% |
| Kindergarten | 0 | 0.0% |
| Elementary School | 72 | 32.4% |
| Middle School | 28 | 12.6% |
| High School | 19 | 8.6% |
| College / Undergraduate | 53 | 23.9% |
| Graduate / Professional | 23 | 10.4% |
| Total | 222 | 100.0% |
School Enrollment by Age by Funding Source in Toro Canyon
Out of a total of 222 students who are enrolled in schools in Toro Canyon, 61 (27.5%) attend a private institution, while the remaining 161 (72.5%) are enrolled in public schools. The age group of 3 to 4 year olds has the highest likelihood of being enrolled in private schools, with 27 (100.0% in the age bracket) enrolled. Conversely, the age group of 10 to 14 year olds has the lowest likelihood of being enrolled in a private school, with 28 (100.0% in the age bracket) attending a public institution.
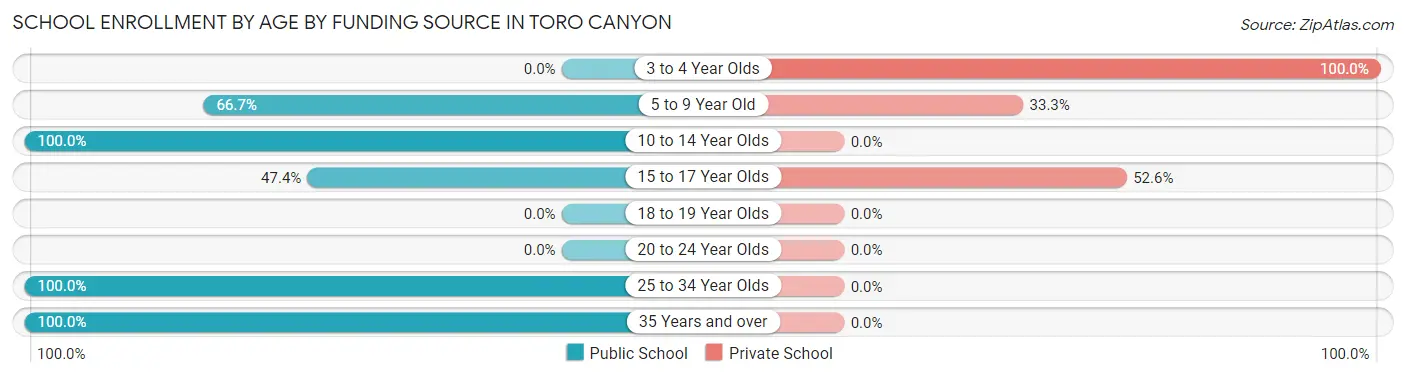
| Age Bracket | Public School | Private School |
| 3 to 4 Year Olds | 0 (0.0%) | 27 (100.0%) |
| 5 to 9 Year Old | 48 (66.7%) | 24 (33.3%) |
| 10 to 14 Year Olds | 28 (100.0%) | 0 (0.0%) |
| 15 to 17 Year Olds | 9 (47.4%) | 10 (52.6%) |
| 18 to 19 Year Olds | 0 (0.0%) | 0 (0.0%) |
| 20 to 24 Year Olds | 0 (0.0%) | 0 (0.0%) |
| 25 to 34 Year Olds | 52 (100.0%) | 0 (0.0%) |
| 35 Years and over | 24 (100.0%) | 0 (0.0%) |
| Total | 161 (72.5%) | 61 (27.5%) |
Educational Attainment by Field of Study in Toro Canyon
Social sciences (244 | 21.9%), engineering (152 | 13.6%), visual & performing arts (109 | 9.8%), education (96 | 8.6%), and psychology (89 | 8.0%) are the most common fields of study among 1,114 individuals in Toro Canyon who have obtained a bachelor's degree or higher.
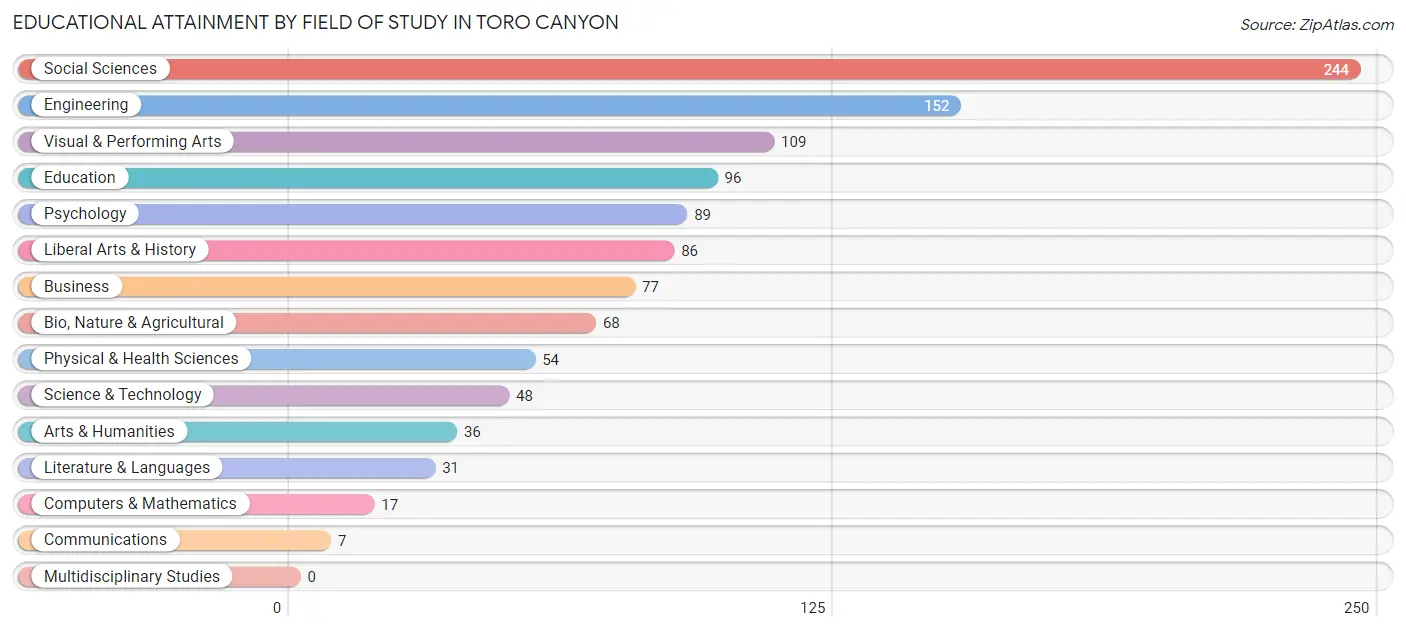
| Field of Study | # Graduates | % Graduates |
| Computers & Mathematics | 17 | 1.5% |
| Bio, Nature & Agricultural | 68 | 6.1% |
| Physical & Health Sciences | 54 | 4.9% |
| Psychology | 89 | 8.0% |
| Social Sciences | 244 | 21.9% |
| Engineering | 152 | 13.6% |
| Multidisciplinary Studies | 0 | 0.0% |
| Science & Technology | 48 | 4.3% |
| Business | 77 | 6.9% |
| Education | 96 | 8.6% |
| Literature & Languages | 31 | 2.8% |
| Liberal Arts & History | 86 | 7.7% |
| Visual & Performing Arts | 109 | 9.8% |
| Communications | 7 | 0.6% |
| Arts & Humanities | 36 | 3.2% |
| Total | 1,114 | 100.0% |
Transportation & Commute in Toro Canyon
Vehicle Availability by Sex in Toro Canyon
The most prevalent vehicle ownership categories in Toro Canyon are males with 2 vehicles (116, accounting for 42.6%) and females with 2 vehicles (53, making up 34.6%).
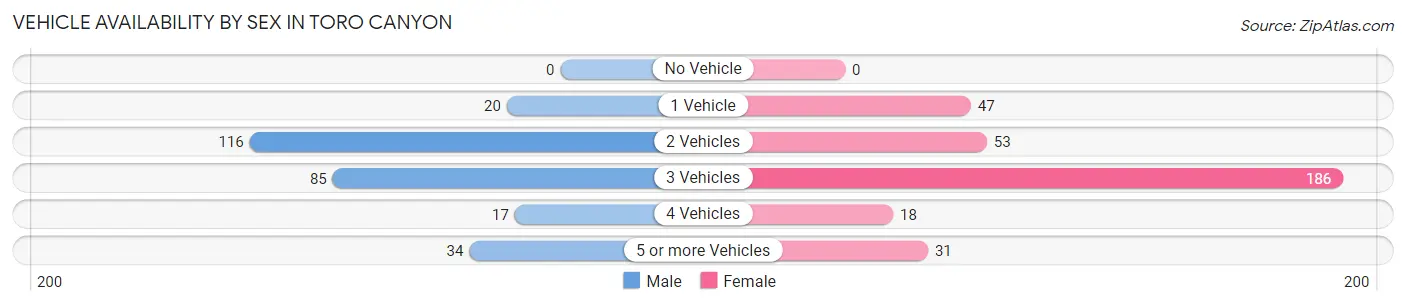
| Vehicles Available | Male | Female |
| No Vehicle | 0 (0.0%) | 0 (0.0%) |
| 1 Vehicle | 20 (7.3%) | 47 (14.0%) |
| 2 Vehicles | 116 (42.6%) | 53 (15.8%) |
| 3 Vehicles | 85 (31.2%) | 186 (55.5%) |
| 4 Vehicles | 17 (6.2%) | 18 (5.4%) |
| 5 or more Vehicles | 34 (12.5%) | 31 (9.2%) |
| Total | 272 (100.0%) | 335 (100.0%) |
Commute Time in Toro Canyon
The most frequently occuring commute durations in Toro Canyon are 5 to 9 minutes (123 commuters, 27.3%), 60 to 89 minutes (101 commuters, 22.4%), and 10 to 14 minutes (89 commuters, 19.8%).
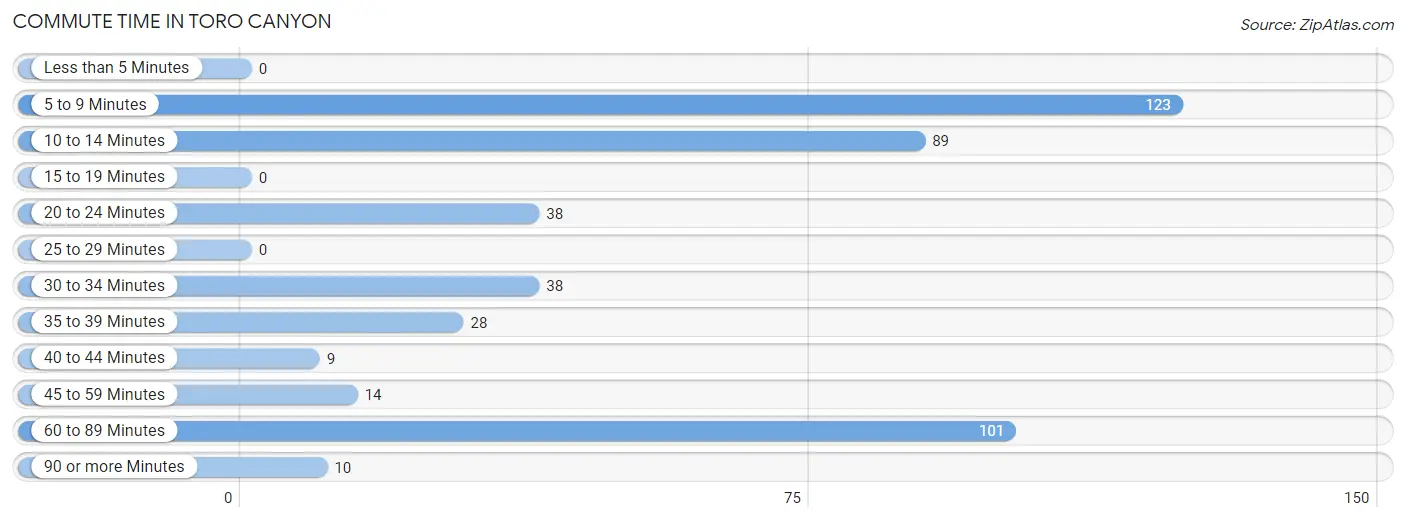
| Commute Time | # Commuters | % Commuters |
| Less than 5 Minutes | 0 | 0.0% |
| 5 to 9 Minutes | 123 | 27.3% |
| 10 to 14 Minutes | 89 | 19.8% |
| 15 to 19 Minutes | 0 | 0.0% |
| 20 to 24 Minutes | 38 | 8.4% |
| 25 to 29 Minutes | 0 | 0.0% |
| 30 to 34 Minutes | 38 | 8.4% |
| 35 to 39 Minutes | 28 | 6.2% |
| 40 to 44 Minutes | 9 | 2.0% |
| 45 to 59 Minutes | 14 | 3.1% |
| 60 to 89 Minutes | 101 | 22.4% |
| 90 or more Minutes | 10 | 2.2% |
Commute Time by Sex in Toro Canyon
The most common commute times in Toro Canyon are 10 to 14 minutes (46 commuters, 23.0%) for males and 5 to 9 minutes (81 commuters, 32.4%) for females.
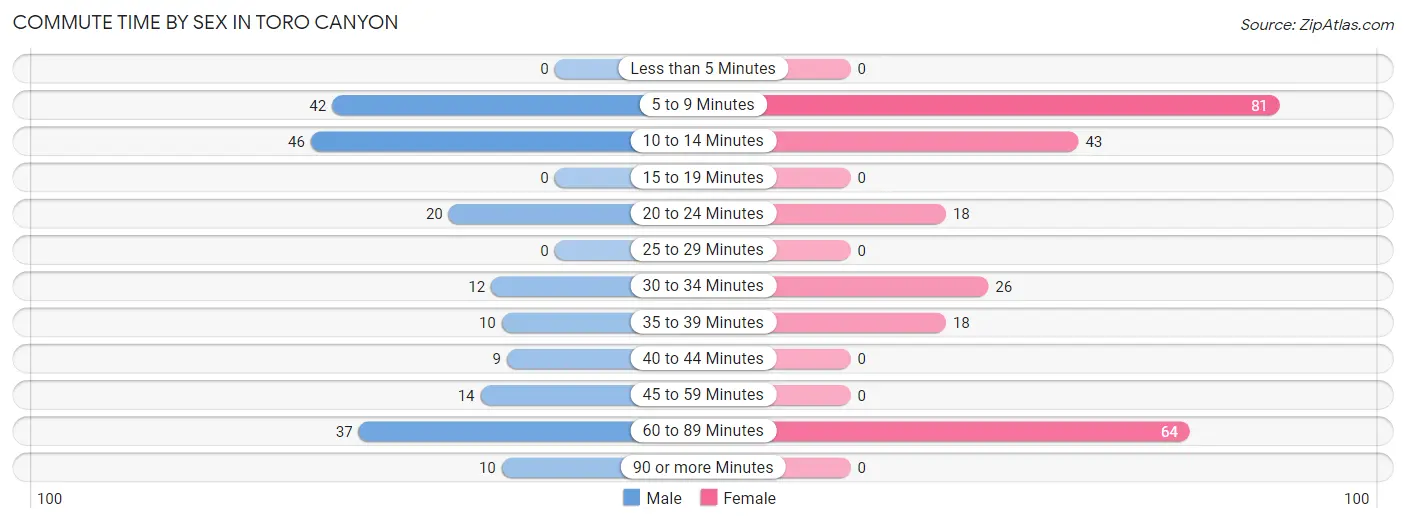
| Commute Time | Male | Female |
| Less than 5 Minutes | 0 (0.0%) | 0 (0.0%) |
| 5 to 9 Minutes | 42 (21.0%) | 81 (32.4%) |
| 10 to 14 Minutes | 46 (23.0%) | 43 (17.2%) |
| 15 to 19 Minutes | 0 (0.0%) | 0 (0.0%) |
| 20 to 24 Minutes | 20 (10.0%) | 18 (7.2%) |
| 25 to 29 Minutes | 0 (0.0%) | 0 (0.0%) |
| 30 to 34 Minutes | 12 (6.0%) | 26 (10.4%) |
| 35 to 39 Minutes | 10 (5.0%) | 18 (7.2%) |
| 40 to 44 Minutes | 9 (4.5%) | 0 (0.0%) |
| 45 to 59 Minutes | 14 (7.0%) | 0 (0.0%) |
| 60 to 89 Minutes | 37 (18.5%) | 64 (25.6%) |
| 90 or more Minutes | 10 (5.0%) | 0 (0.0%) |
Time of Departure to Work by Sex in Toro Canyon
The most frequent times of departure to work in Toro Canyon are 7:30 AM to 7:59 AM (68, 34.0%) for males and 7:00 AM to 7:29 AM (79, 31.6%) for females.
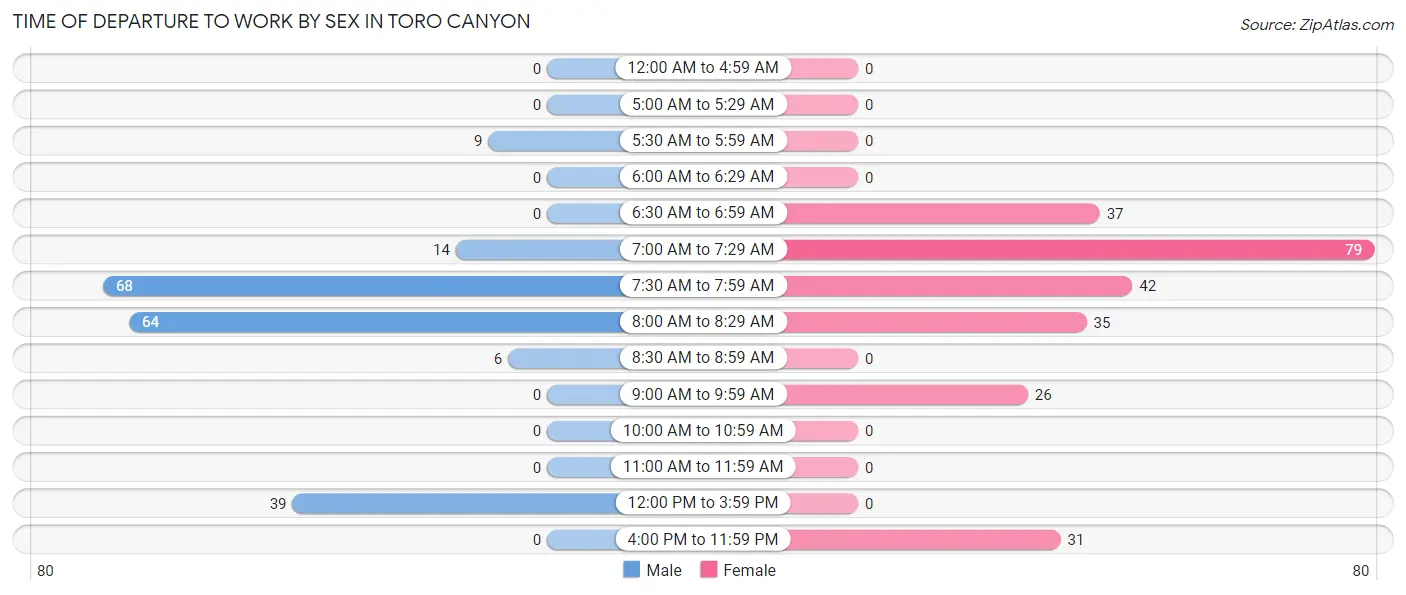
| Time of Departure | Male | Female |
| 12:00 AM to 4:59 AM | 0 (0.0%) | 0 (0.0%) |
| 5:00 AM to 5:29 AM | 0 (0.0%) | 0 (0.0%) |
| 5:30 AM to 5:59 AM | 9 (4.5%) | 0 (0.0%) |
| 6:00 AM to 6:29 AM | 0 (0.0%) | 0 (0.0%) |
| 6:30 AM to 6:59 AM | 0 (0.0%) | 37 (14.8%) |
| 7:00 AM to 7:29 AM | 14 (7.0%) | 79 (31.6%) |
| 7:30 AM to 7:59 AM | 68 (34.0%) | 42 (16.8%) |
| 8:00 AM to 8:29 AM | 64 (32.0%) | 35 (14.0%) |
| 8:30 AM to 8:59 AM | 6 (3.0%) | 0 (0.0%) |
| 9:00 AM to 9:59 AM | 0 (0.0%) | 26 (10.4%) |
| 10:00 AM to 10:59 AM | 0 (0.0%) | 0 (0.0%) |
| 11:00 AM to 11:59 AM | 0 (0.0%) | 0 (0.0%) |
| 12:00 PM to 3:59 PM | 39 (19.5%) | 0 (0.0%) |
| 4:00 PM to 11:59 PM | 0 (0.0%) | 31 (12.4%) |
| Total | 200 (100.0%) | 250 (100.0%) |
Housing Occupancy in Toro Canyon
Occupancy by Ownership in Toro Canyon
Of the total 758 dwellings in Toro Canyon, owner-occupied units account for 677 (89.3%), while renter-occupied units make up 81 (10.7%).
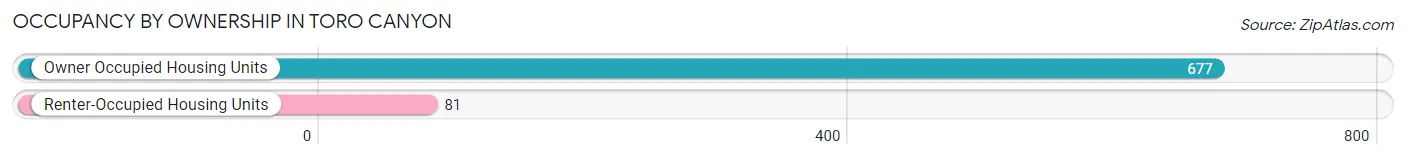
| Occupancy | # Housing Units | % Housing Units |
| Owner Occupied Housing Units | 677 | 89.3% |
| Renter-Occupied Housing Units | 81 | 10.7% |
| Total Occupied Housing Units | 758 | 100.0% |
Occupancy by Household Size in Toro Canyon
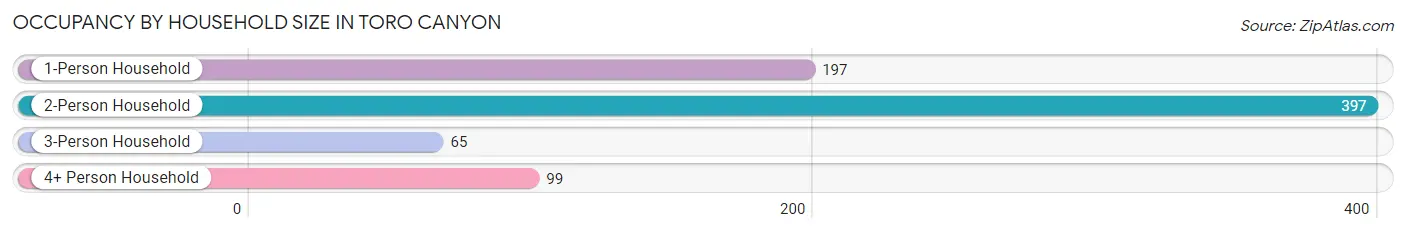
| Household Size | # Housing Units | % Housing Units |
| 1-Person Household | 197 | 26.0% |
| 2-Person Household | 397 | 52.4% |
| 3-Person Household | 65 | 8.6% |
| 4+ Person Household | 99 | 13.1% |
| Total Housing Units | 758 | 100.0% |
Occupancy by Ownership by Household Size in Toro Canyon
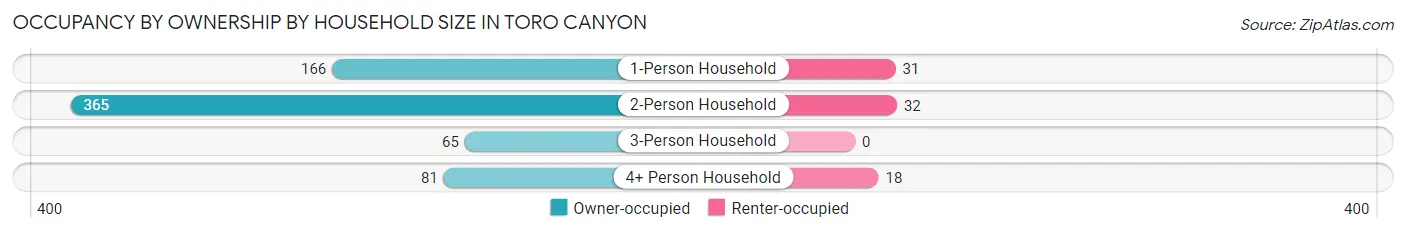
| Household Size | Owner-occupied | Renter-occupied |
| 1-Person Household | 166 (84.3%) | 31 (15.7%) |
| 2-Person Household | 365 (91.9%) | 32 (8.1%) |
| 3-Person Household | 65 (100.0%) | 0 (0.0%) |
| 4+ Person Household | 81 (81.8%) | 18 (18.2%) |
| Total Housing Units | 677 (89.3%) | 81 (10.7%) |
Occupancy by Educational Attainment in Toro Canyon
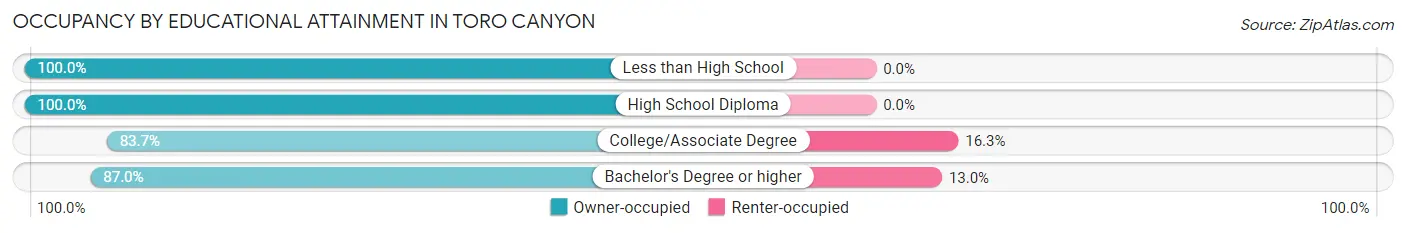
| Household Size | Owner-occupied | Renter-occupied |
| Less than High School | 78 (100.0%) | 0 (0.0%) |
| High School Diploma | 80 (100.0%) | 0 (0.0%) |
| College/Associate Degree | 72 (83.7%) | 14 (16.3%) |
| Bachelor's Degree or higher | 447 (87.0%) | 67 (13.0%) |
Occupancy by Age of Householder in Toro Canyon
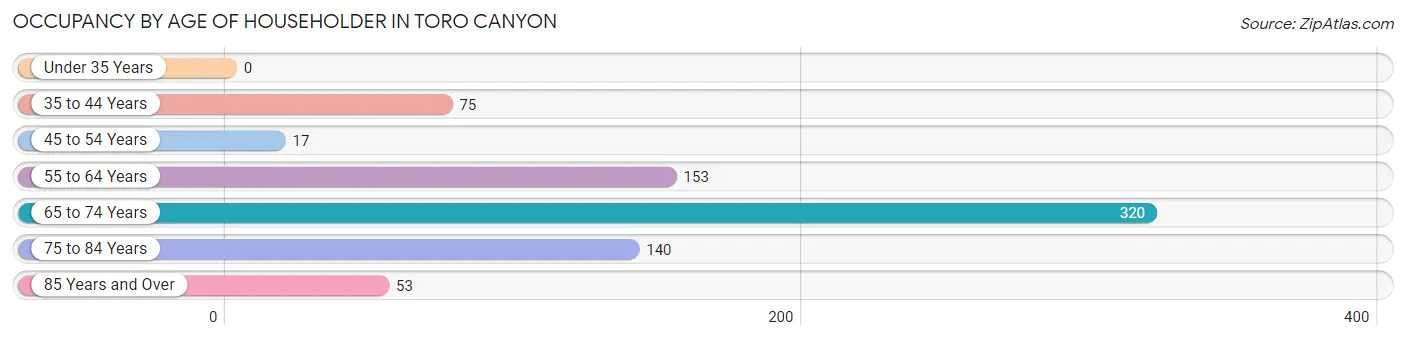
| Age Bracket | # Households | % Households |
| Under 35 Years | 0 | 0.0% |
| 35 to 44 Years | 75 | 9.9% |
| 45 to 54 Years | 17 | 2.2% |
| 55 to 64 Years | 153 | 20.2% |
| 65 to 74 Years | 320 | 42.2% |
| 75 to 84 Years | 140 | 18.5% |
| 85 Years and Over | 53 | 7.0% |
| Total | 758 | 100.0% |
Housing Finances in Toro Canyon
Median Income by Occupancy in Toro Canyon
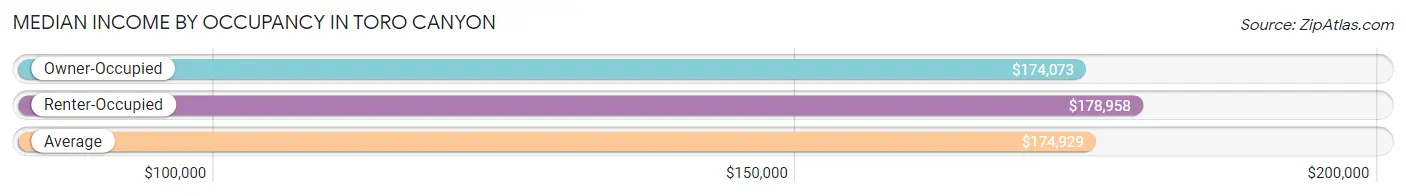
| Occupancy Type | # Households | Median Income |
| Owner-Occupied | 677 (89.3%) | $174,073 |
| Renter-Occupied | 81 (10.7%) | $178,958 |
| Average | 758 (100.0%) | $174,929 |
Occupancy by Householder Income Bracket in Toro Canyon
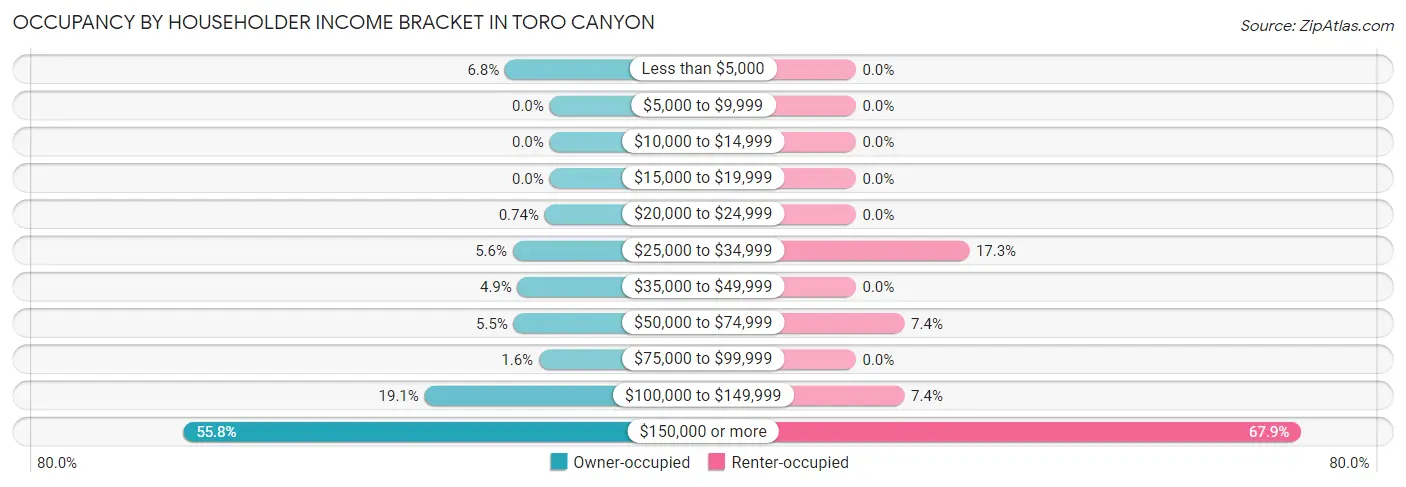
| Income Bracket | Owner-occupied | Renter-occupied |
| Less than $5,000 | 46 (6.8%) | 0 (0.0%) |
| $5,000 to $9,999 | 0 (0.0%) | 0 (0.0%) |
| $10,000 to $14,999 | 0 (0.0%) | 0 (0.0%) |
| $15,000 to $19,999 | 0 (0.0%) | 0 (0.0%) |
| $20,000 to $24,999 | 5 (0.7%) | 0 (0.0%) |
| $25,000 to $34,999 | 38 (5.6%) | 14 (17.3%) |
| $35,000 to $49,999 | 33 (4.9%) | 0 (0.0%) |
| $50,000 to $74,999 | 37 (5.5%) | 6 (7.4%) |
| $75,000 to $99,999 | 11 (1.6%) | 0 (0.0%) |
| $100,000 to $149,999 | 129 (19.1%) | 6 (7.4%) |
| $150,000 or more | 378 (55.8%) | 55 (67.9%) |
| Total | 677 (100.0%) | 81 (100.0%) |
Monthly Housing Cost Tiers in Toro Canyon
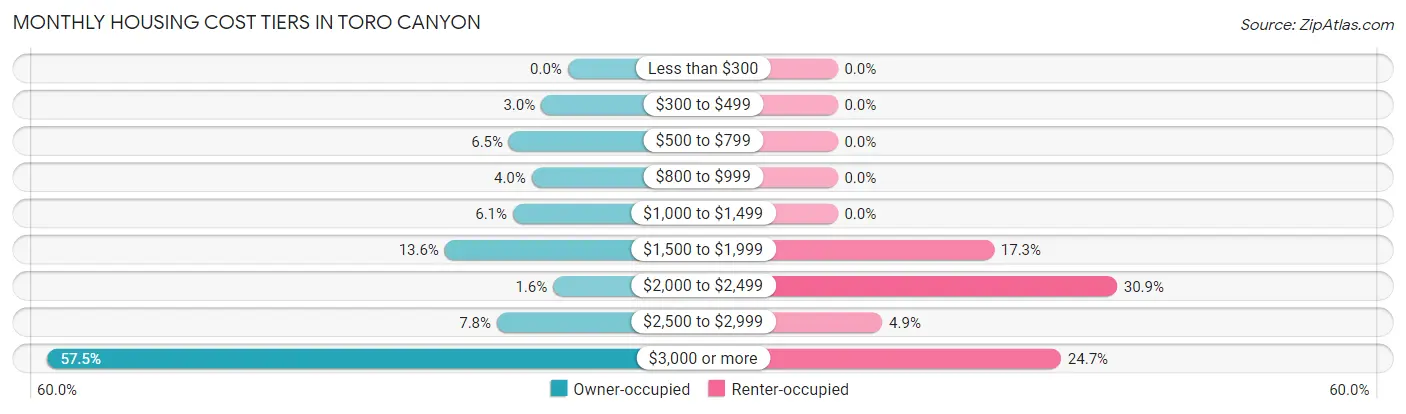
| Monthly Cost | Owner-occupied | Renter-occupied |
| Less than $300 | 0 (0.0%) | 0 (0.0%) |
| $300 to $499 | 20 (2.9%) | 0 (0.0%) |
| $500 to $799 | 44 (6.5%) | 0 (0.0%) |
| $800 to $999 | 27 (4.0%) | 0 (0.0%) |
| $1,000 to $1,499 | 41 (6.1%) | 0 (0.0%) |
| $1,500 to $1,999 | 92 (13.6%) | 14 (17.3%) |
| $2,000 to $2,499 | 11 (1.6%) | 25 (30.9%) |
| $2,500 to $2,999 | 53 (7.8%) | 4 (4.9%) |
| $3,000 or more | 389 (57.5%) | 20 (24.7%) |
| Total | 677 (100.0%) | 81 (100.0%) |
Physical Housing Characteristics in Toro Canyon
Housing Structures in Toro Canyon
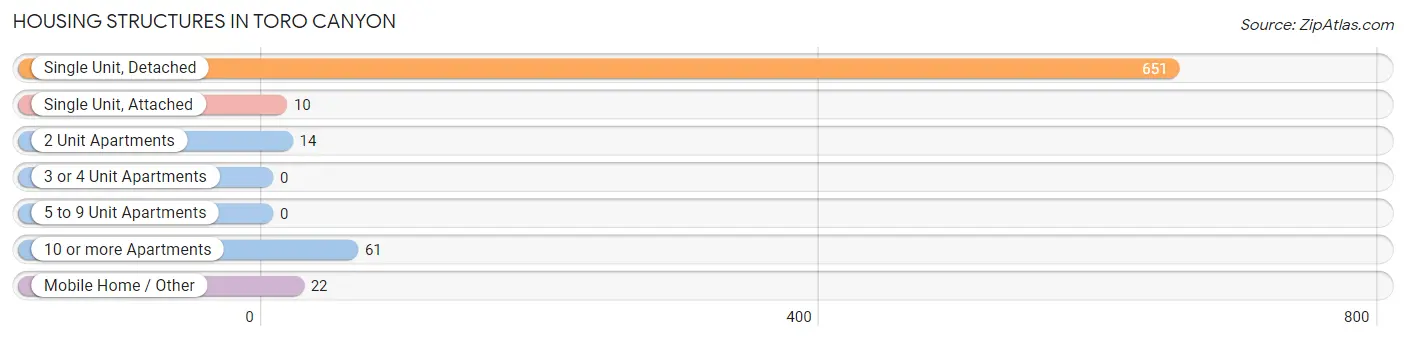
| Structure Type | # Housing Units | % Housing Units |
| Single Unit, Detached | 651 | 85.9% |
| Single Unit, Attached | 10 | 1.3% |
| 2 Unit Apartments | 14 | 1.8% |
| 3 or 4 Unit Apartments | 0 | 0.0% |
| 5 to 9 Unit Apartments | 0 | 0.0% |
| 10 or more Apartments | 61 | 8.1% |
| Mobile Home / Other | 22 | 2.9% |
| Total | 758 | 100.0% |
Housing Structures by Occupancy in Toro Canyon
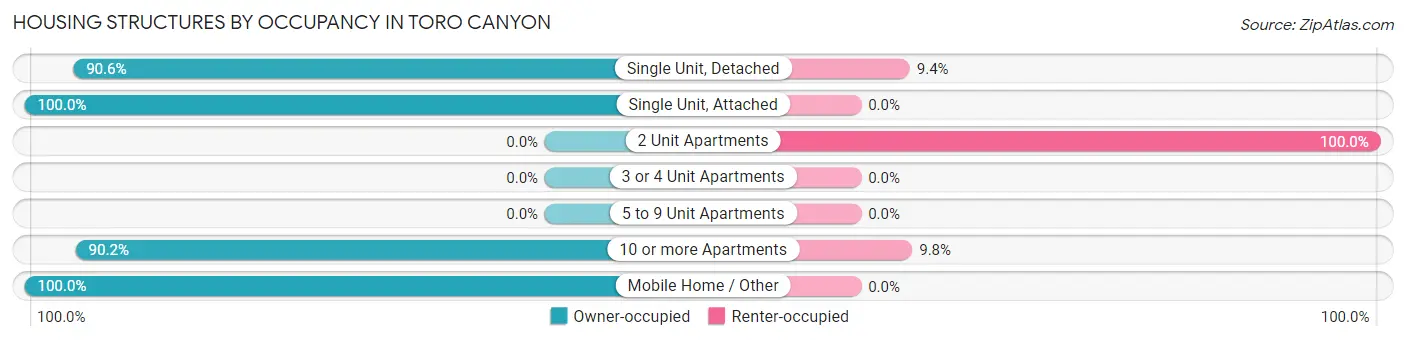
| Structure Type | Owner-occupied | Renter-occupied |
| Single Unit, Detached | 590 (90.6%) | 61 (9.4%) |
| Single Unit, Attached | 10 (100.0%) | 0 (0.0%) |
| 2 Unit Apartments | 0 (0.0%) | 14 (100.0%) |
| 3 or 4 Unit Apartments | 0 (0.0%) | 0 (0.0%) |
| 5 to 9 Unit Apartments | 0 (0.0%) | 0 (0.0%) |
| 10 or more Apartments | 55 (90.2%) | 6 (9.8%) |
| Mobile Home / Other | 22 (100.0%) | 0 (0.0%) |
| Total | 677 (89.3%) | 81 (10.7%) |
Housing Structures by Number of Rooms in Toro Canyon
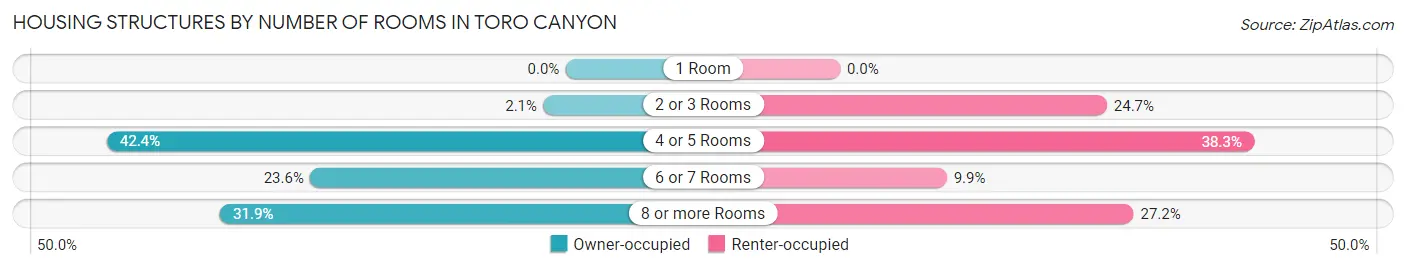
| Number of Rooms | Owner-occupied | Renter-occupied |
| 1 Room | 0 (0.0%) | 0 (0.0%) |
| 2 or 3 Rooms | 14 (2.1%) | 20 (24.7%) |
| 4 or 5 Rooms | 287 (42.4%) | 31 (38.3%) |
| 6 or 7 Rooms | 160 (23.6%) | 8 (9.9%) |
| 8 or more Rooms | 216 (31.9%) | 22 (27.2%) |
| Total | 677 (100.0%) | 81 (100.0%) |
Housing Structure by Heating Type in Toro Canyon
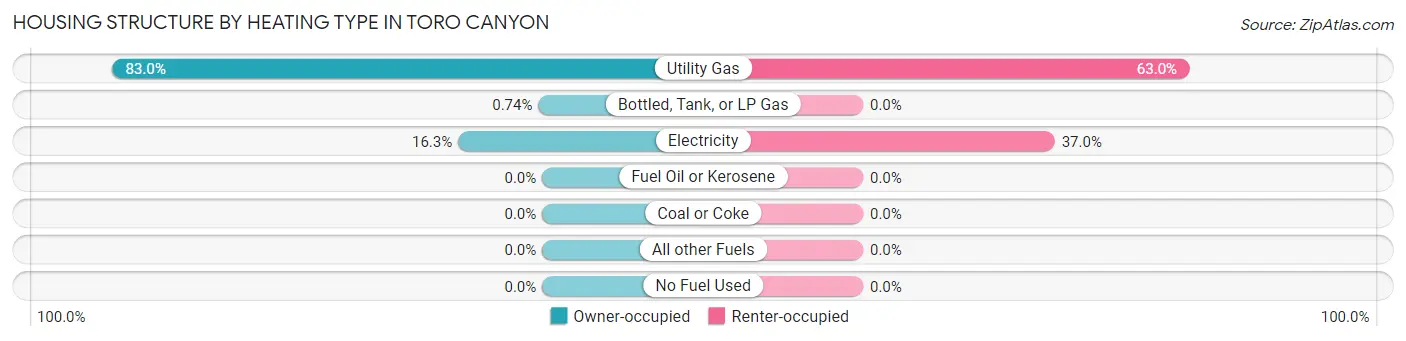
| Heating Type | Owner-occupied | Renter-occupied |
| Utility Gas | 562 (83.0%) | 51 (63.0%) |
| Bottled, Tank, or LP Gas | 5 (0.7%) | 0 (0.0%) |
| Electricity | 110 (16.3%) | 30 (37.0%) |
| Fuel Oil or Kerosene | 0 (0.0%) | 0 (0.0%) |
| Coal or Coke | 0 (0.0%) | 0 (0.0%) |
| All other Fuels | 0 (0.0%) | 0 (0.0%) |
| No Fuel Used | 0 (0.0%) | 0 (0.0%) |
| Total | 677 (100.0%) | 81 (100.0%) |
Household Vehicle Usage in Toro Canyon
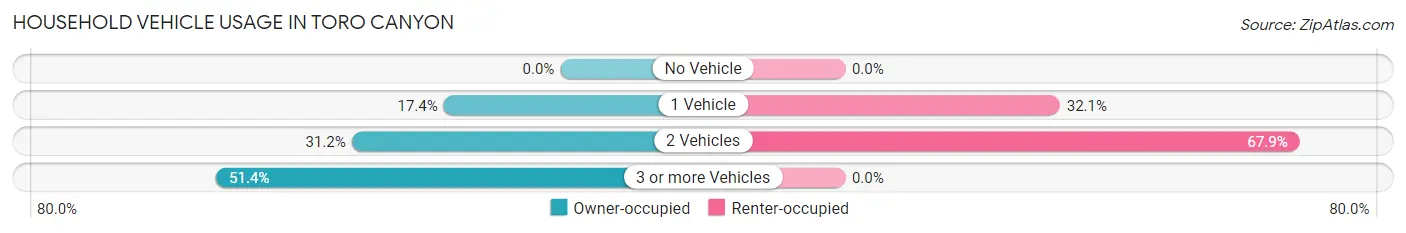
| Vehicles per Household | Owner-occupied | Renter-occupied |
| No Vehicle | 0 (0.0%) | 0 (0.0%) |
| 1 Vehicle | 118 (17.4%) | 26 (32.1%) |
| 2 Vehicles | 211 (31.2%) | 55 (67.9%) |
| 3 or more Vehicles | 348 (51.4%) | 0 (0.0%) |
| Total | 677 (100.0%) | 81 (100.0%) |
Real Estate & Mortgages in Toro Canyon
Real Estate and Mortgage Overview in Toro Canyon
| Characteristic | Without Mortgage | With Mortgage |
| Housing Units | 317 | 360 |
| Median Property Value | $2,000,001 | $2,000,001 |
| Median Household Income | - | - |
| Monthly Housing Costs | $1,501 | $306 |
| Real Estate Taxes | $10,001 | $0 |
Property Value by Mortgage Status in Toro Canyon
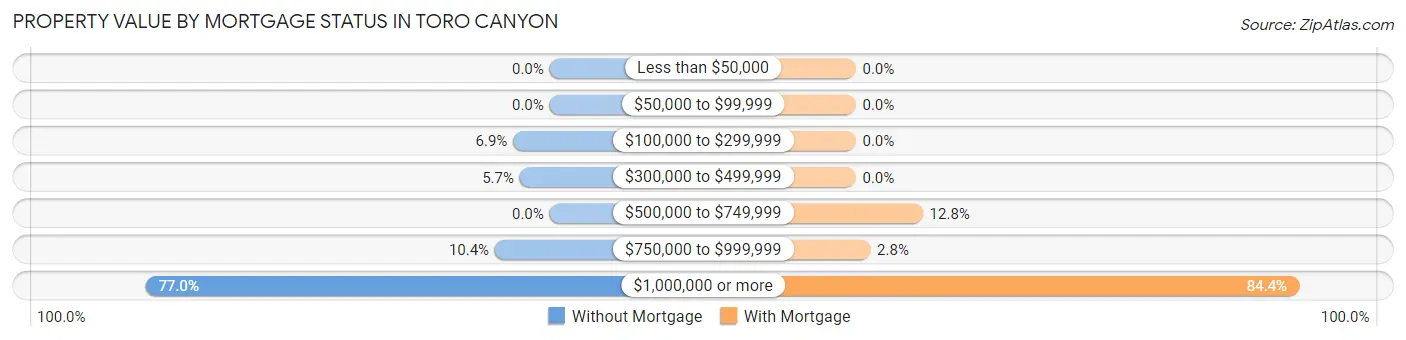
| Property Value | Without Mortgage | With Mortgage |
| Less than $50,000 | 0 (0.0%) | 0 (0.0%) |
| $50,000 to $99,999 | 0 (0.0%) | 0 (0.0%) |
| $100,000 to $299,999 | 22 (6.9%) | 0 (0.0%) |
| $300,000 to $499,999 | 18 (5.7%) | 0 (0.0%) |
| $500,000 to $749,999 | 0 (0.0%) | 46 (12.8%) |
| $750,000 to $999,999 | 33 (10.4%) | 10 (2.8%) |
| $1,000,000 or more | 244 (77.0%) | 304 (84.4%) |
| Total | 317 (100.0%) | 360 (100.0%) |
Household Income by Mortgage Status in Toro Canyon
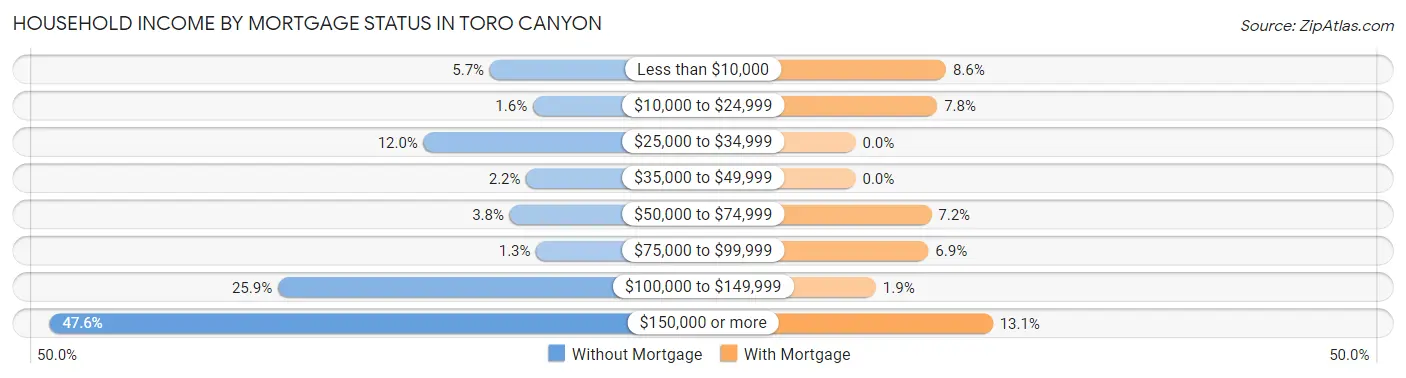
| Household Income | Without Mortgage | With Mortgage |
| Less than $10,000 | 18 (5.7%) | 31 (8.6%) |
| $10,000 to $24,999 | 5 (1.6%) | 28 (7.8%) |
| $25,000 to $34,999 | 38 (12.0%) | 0 (0.0%) |
| $35,000 to $49,999 | 7 (2.2%) | 0 (0.0%) |
| $50,000 to $74,999 | 12 (3.8%) | 26 (7.2%) |
| $75,000 to $99,999 | 4 (1.3%) | 25 (6.9%) |
| $100,000 to $149,999 | 82 (25.9%) | 7 (1.9%) |
| $150,000 or more | 151 (47.6%) | 47 (13.1%) |
| Total | 317 (100.0%) | 360 (100.0%) |
Property Value to Household Income Ratio in Toro Canyon
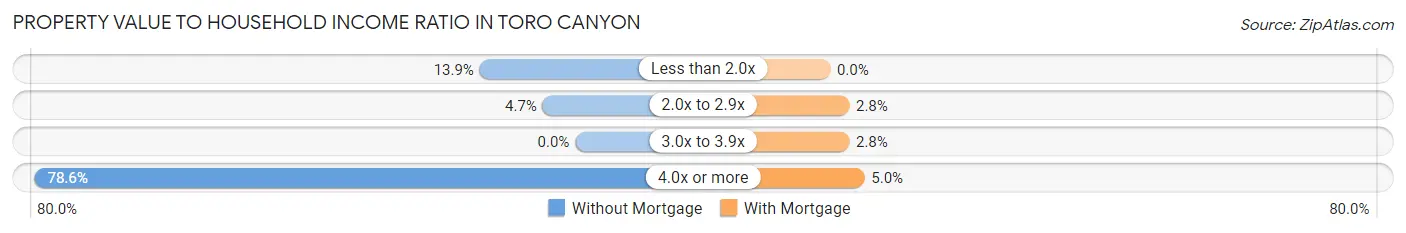
| Value-to-Income Ratio | Without Mortgage | With Mortgage |
| Less than 2.0x | 44 (13.9%) | 0 (0.0%) |
| 2.0x to 2.9x | 15 (4.7%) | 10 (2.8%) |
| 3.0x to 3.9x | 0 (0.0%) | 10 (2.8%) |
| 4.0x or more | 249 (78.5%) | 18 (5.0%) |
| Total | 317 (100.0%) | 360 (100.0%) |
Real Estate Taxes by Mortgage Status in Toro Canyon
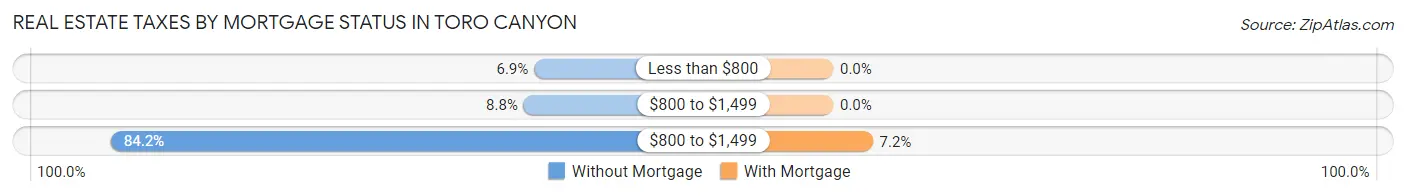
| Property Taxes | Without Mortgage | With Mortgage |
| Less than $800 | 22 (6.9%) | 0 (0.0%) |
| $800 to $1,499 | 28 (8.8%) | 0 (0.0%) |
| $800 to $1,499 | 267 (84.2%) | 26 (7.2%) |
| Total | 317 (100.0%) | 360 (100.0%) |
Health & Disability in Toro Canyon
Health Insurance Coverage by Age in Toro Canyon
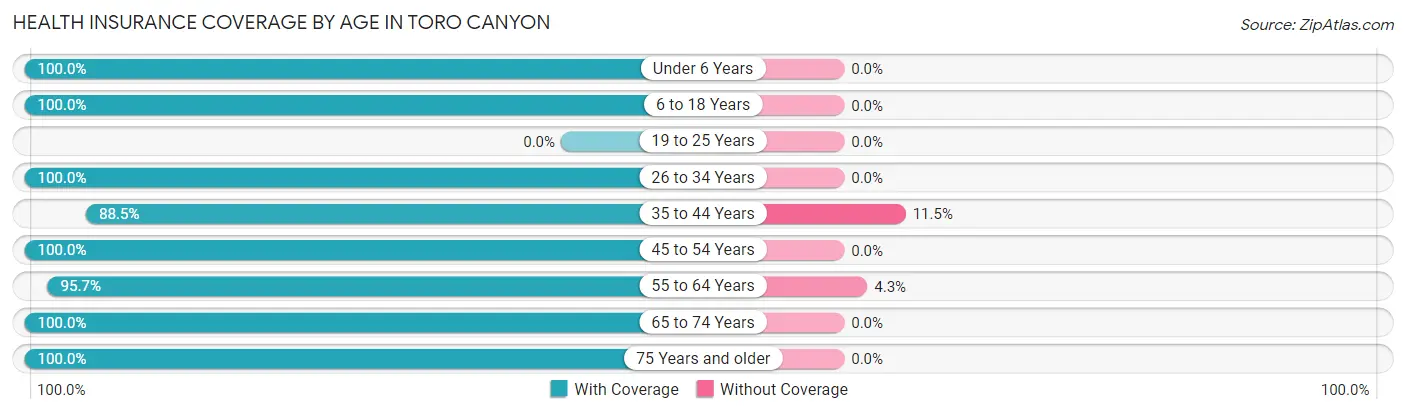
| Age Bracket | With Coverage | Without Coverage |
| Under 6 Years | 92 (100.0%) | 0 (0.0%) |
| 6 to 18 Years | 119 (100.0%) | 0 (0.0%) |
| 19 to 25 Years | 0 (0.0%) | 0 (0.0%) |
| 26 to 34 Years | 102 (100.0%) | 0 (0.0%) |
| 35 to 44 Years | 170 (88.5%) | 22 (11.5%) |
| 45 to 54 Years | 49 (100.0%) | 0 (0.0%) |
| 55 to 64 Years | 267 (95.7%) | 12 (4.3%) |
| 65 to 74 Years | 497 (100.0%) | 0 (0.0%) |
| 75 Years and older | 362 (100.0%) | 0 (0.0%) |
| Total | 1,658 (98.0%) | 34 (2.0%) |
Health Insurance Coverage by Citizenship Status in Toro Canyon
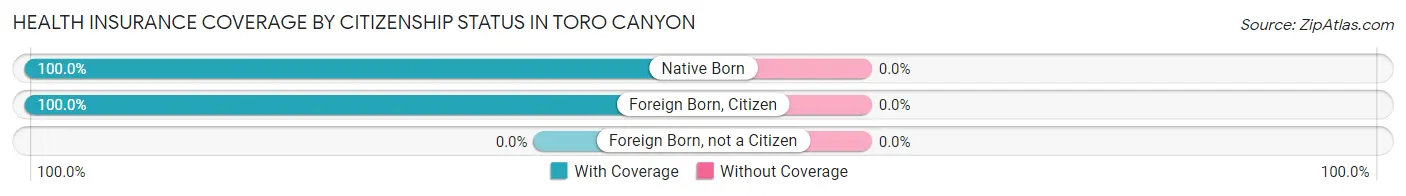
| Citizenship Status | With Coverage | Without Coverage |
| Native Born | 92 (100.0%) | 0 (0.0%) |
| Foreign Born, Citizen | 119 (100.0%) | 0 (0.0%) |
| Foreign Born, not a Citizen | 0 (0.0%) | 0 (0.0%) |
Health Insurance Coverage by Household Income in Toro Canyon
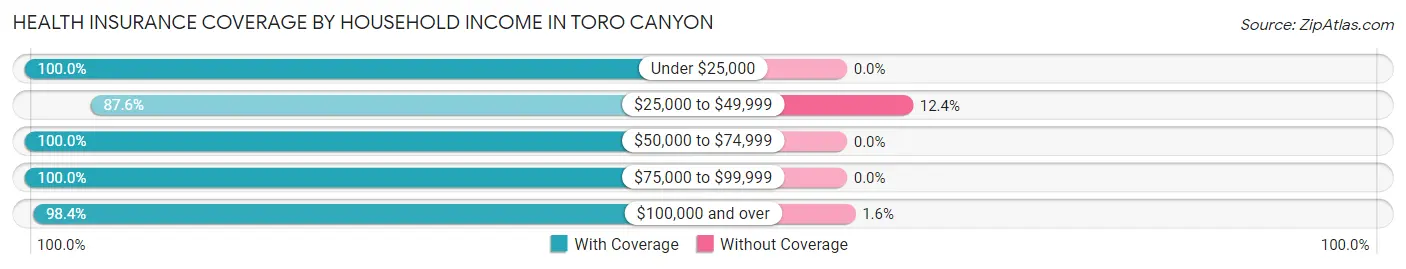
| Household Income | With Coverage | Without Coverage |
| Under $25,000 | 84 (100.0%) | 0 (0.0%) |
| $25,000 to $49,999 | 85 (87.6%) | 12 (12.4%) |
| $50,000 to $74,999 | 79 (100.0%) | 0 (0.0%) |
| $75,000 to $99,999 | 22 (100.0%) | 0 (0.0%) |
| $100,000 and over | 1,383 (98.4%) | 22 (1.6%) |
Public vs Private Health Insurance Coverage by Age in Toro Canyon
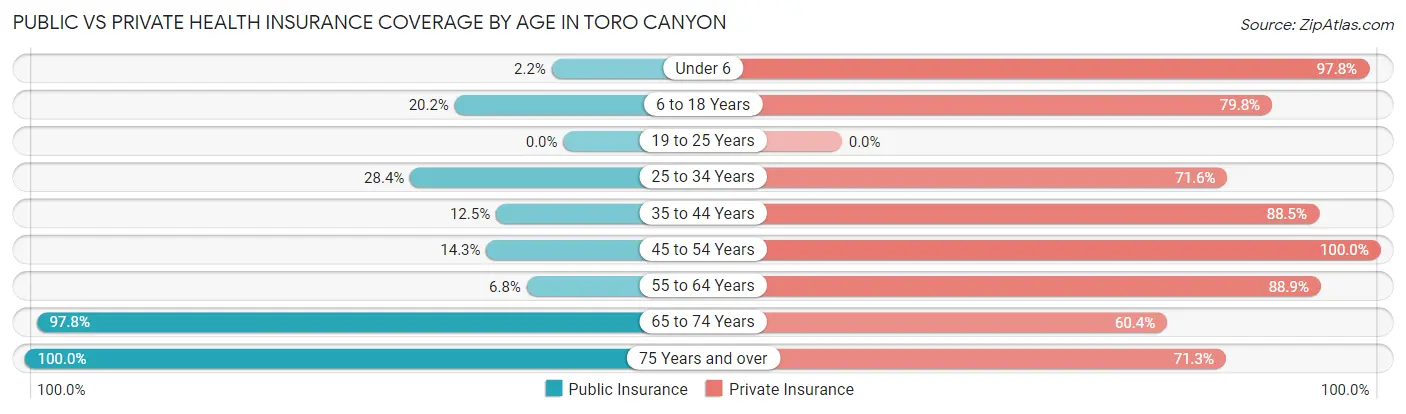
| Age Bracket | Public Insurance | Private Insurance |
| Under 6 | 2 (2.2%) | 90 (97.8%) |
| 6 to 18 Years | 24 (20.2%) | 95 (79.8%) |
| 19 to 25 Years | 0 (0.0%) | 0 (0.0%) |
| 25 to 34 Years | 29 (28.4%) | 73 (71.6%) |
| 35 to 44 Years | 24 (12.5%) | 170 (88.5%) |
| 45 to 54 Years | 7 (14.3%) | 49 (100.0%) |
| 55 to 64 Years | 19 (6.8%) | 248 (88.9%) |
| 65 to 74 Years | 486 (97.8%) | 300 (60.4%) |
| 75 Years and over | 362 (100.0%) | 258 (71.3%) |
| Total | 953 (56.3%) | 1,283 (75.8%) |
Disability Status by Sex by Age in Toro Canyon
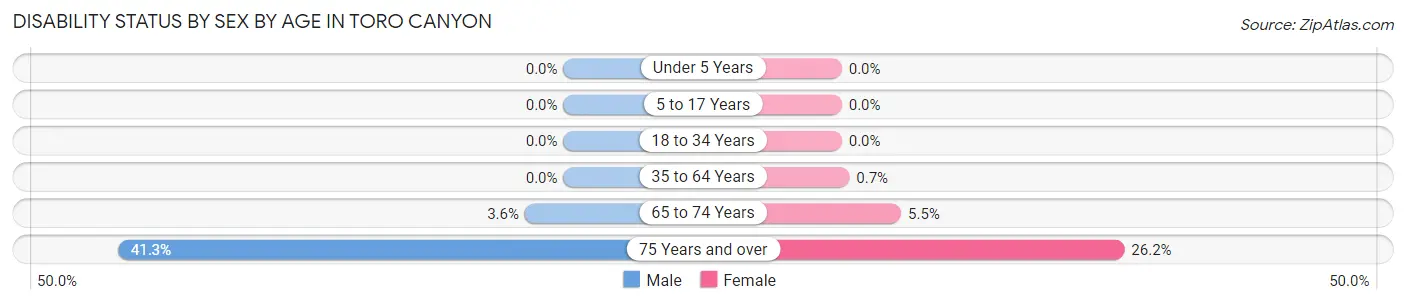
| Age Bracket | Male | Female |
| Under 5 Years | 0 (0.0%) | 0 (0.0%) |
| 5 to 17 Years | 0 (0.0%) | 0 (0.0%) |
| 18 to 34 Years | 0 (0.0%) | 0 (0.0%) |
| 35 to 64 Years | 0 (0.0%) | 2 (0.7%) |
| 65 to 74 Years | 10 (3.6%) | 12 (5.5%) |
| 75 Years and over | 74 (41.3%) | 48 (26.2%) |
Disability Class by Sex by Age in Toro Canyon
Disability Class: Hearing Difficulty
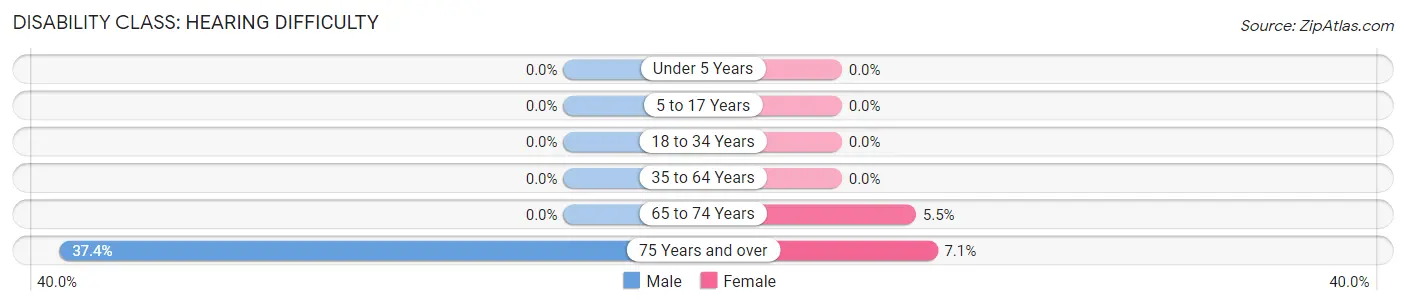
| Age Bracket | Male | Female |
| Under 5 Years | 0 (0.0%) | 0 (0.0%) |
| 5 to 17 Years | 0 (0.0%) | 0 (0.0%) |
| 18 to 34 Years | 0 (0.0%) | 0 (0.0%) |
| 35 to 64 Years | 0 (0.0%) | 0 (0.0%) |
| 65 to 74 Years | 0 (0.0%) | 12 (5.5%) |
| 75 Years and over | 67 (37.4%) | 13 (7.1%) |
Disability Class: Vision Difficulty
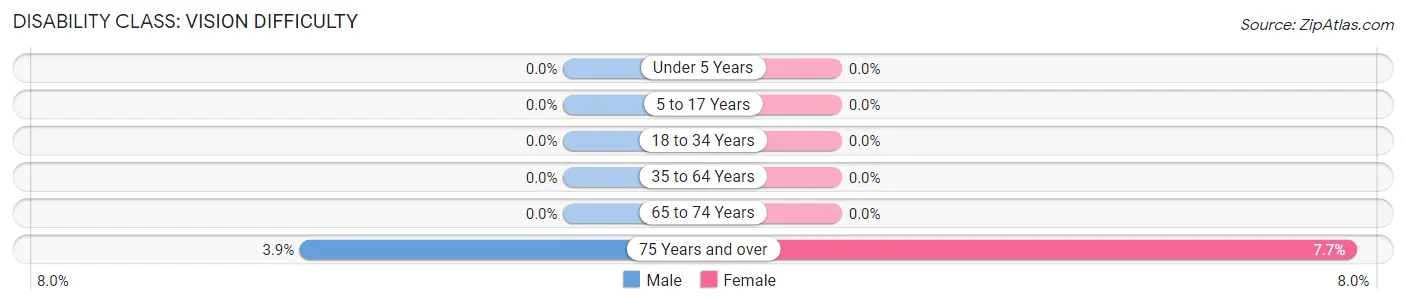
| Age Bracket | Male | Female |
| Under 5 Years | 0 (0.0%) | 0 (0.0%) |
| 5 to 17 Years | 0 (0.0%) | 0 (0.0%) |
| 18 to 34 Years | 0 (0.0%) | 0 (0.0%) |
| 35 to 64 Years | 0 (0.0%) | 0 (0.0%) |
| 65 to 74 Years | 0 (0.0%) | 0 (0.0%) |
| 75 Years and over | 7 (3.9%) | 14 (7.6%) |
Disability Class: Cognitive Difficulty
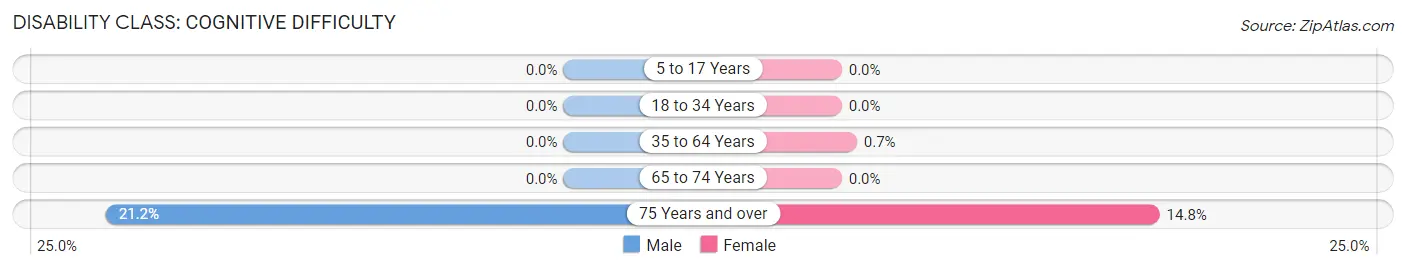
| Age Bracket | Male | Female |
| 5 to 17 Years | 0 (0.0%) | 0 (0.0%) |
| 18 to 34 Years | 0 (0.0%) | 0 (0.0%) |
| 35 to 64 Years | 0 (0.0%) | 2 (0.7%) |
| 65 to 74 Years | 0 (0.0%) | 0 (0.0%) |
| 75 Years and over | 38 (21.2%) | 27 (14.7%) |
Disability Class: Ambulatory Difficulty
| Age Bracket | Male | Female |
| 5 to 17 Years | 0 (0.0%) | 0 (0.0%) |
| 18 to 34 Years | 0 (0.0%) | 0 (0.0%) |
| 35 to 64 Years | 0 (0.0%) | 2 (0.7%) |
| 65 to 74 Years | 10 (3.6%) | 0 (0.0%) |
| 75 Years and over | 38 (21.2%) | 35 (19.1%) |
Disability Class: Self-Care Difficulty
| Age Bracket | Male | Female |
| 5 to 17 Years | 0 (0.0%) | 0 (0.0%) |
| 18 to 34 Years | 0 (0.0%) | 0 (0.0%) |
| 35 to 64 Years | 0 (0.0%) | 2 (0.7%) |
| 65 to 74 Years | 0 (0.0%) | 0 (0.0%) |
| 75 Years and over | 19 (10.6%) | 14 (7.6%) |
Technology Access in Toro Canyon
Computing Device Access in Toro Canyon
| Device Type | # Households | % Households |
| Desktop or Laptop | 706 | 93.1% |
| Smartphone | 704 | 92.9% |
| Tablet | 426 | 56.2% |
| No Computing Device | 5 | 0.7% |
| Total | 758 | 100.0% |
Internet Access in Toro Canyon
| Internet Type | # Households | % Households |
| Dial-Up Internet | 0 | 0.0% |
| Broadband Home | 672 | 88.6% |
| Cellular Data Only | 27 | 3.6% |
| Satellite Internet | 55 | 7.3% |
| No Internet | 14 | 1.8% |
| Total | 758 | 100.0% |
Toro Canyon Summary
Toro Canyon is a small unincorporated community located in Santa Barbara County, California. It is situated in the Santa Ynez Valley, approximately 8 miles east of the city of Santa Barbara. The community is surrounded by the Los Padres National Forest and is home to a variety of wildlife, including deer, coyotes, and mountain lions.
History
The area now known as Toro Canyon was originally inhabited by the Chumash people, who lived in the area for thousands of years before the arrival of Europeans. The first Europeans to settle in the area were Spanish missionaries, who established the Mission Santa Ines in 1804. The mission was located near the present-day town of Solvang, and the Chumash people were forced to work in the mission’s fields and vineyards.
In the late 19th century, the area was settled by ranchers and farmers, who established small ranches and farms in the area. The area was known as “Toro Canyon” after the wild bulls that roamed the area. In the early 20th century, the area was developed for residential use, and the first homes were built in the area in the 1920s.
Geography
Toro Canyon is located in the Santa Ynez Valley, approximately 8 miles east of the city of Santa Barbara. The area is surrounded by the Los Padres National Forest, and is home to a variety of wildlife, including deer, coyotes, and mountain lions. The area is characterized by rolling hills, oak woodlands, and chaparral vegetation. The climate is Mediterranean, with mild winters and hot, dry summers.
Economy
The economy of Toro Canyon is largely based on agriculture and tourism. The area is home to several wineries, and the local economy is supported by the wine industry. The area is also popular with tourists, who come to enjoy the area’s natural beauty and outdoor activities.
Demographics
As of the 2010 census, the population of Toro Canyon was 1,845. The population is predominantly white (90.2%), with a small Hispanic population (7.2%). The median household income is $76,250, and the median home value is $845,000. The area is served by the Santa Barbara County Sheriff’s Office.
Common Questions
What is Per Capita Income in Toro Canyon?
Per Capita income in Toro Canyon is $139,129.
What is the Median Family Income in Toro Canyon?
Median Family Income in Toro Canyon is $174,821.
What is the Median Household income in Toro Canyon?
Median Household Income in Toro Canyon is $174,929.
What is Inequality or Gini Index in Toro Canyon?
Inequality or Gini Index in Toro Canyon is 0.56.
What is the Total Population of Toro Canyon?
Total Population of Toro Canyon is 1,692.
What is the Total Male Population of Toro Canyon?
Total Male Population of Toro Canyon is 793.
What is the Total Female Population of Toro Canyon?
Total Female Population of Toro Canyon is 899.
What is the Ratio of Males per 100 Females in Toro Canyon?
There are 88.21 Males per 100 Females in Toro Canyon.
What is the Ratio of Females per 100 Males in Toro Canyon?
There are 113.37 Females per 100 Males in Toro Canyon.
What is the Median Population Age in Toro Canyon?
Median Population Age in Toro Canyon is 65.9 Years.
What is the Average Family Size in Toro Canyon
Average Family Size in Toro Canyon is 2.7 People.
What is the Average Household Size in Toro Canyon
Average Household Size in Toro Canyon is 2.2 People.
How Large is the Labor Force in Toro Canyon?
There are 753 People in the Labor Forcein in Toro Canyon.
What is the Percentage of People in the Labor Force in Toro Canyon?
50.2% of People are in the Labor Force in Toro Canyon.
What is the Unemployment Rate in Toro Canyon?
Unemployment Rate in Toro Canyon is 7.7%.