Lafayette, CA Map & Demographics
Lafayette Map
Lafayette Overview
$111,213
PER CAPITA INCOME
$250,001
AVG FAMILY INCOME
$219,250
AVG HOUSEHOLD INCOME
33.3%
WAGE / INCOME GAP [ % ]
66.7¢/ $1
WAGE / INCOME GAP [ $ ]
0.48
INEQUALITY / GINI INDEX
25,310
TOTAL POPULATION
12,767
MALE POPULATION
12,543
FEMALE POPULATION
101.79
MALES / 100 FEMALES
98.25
FEMALES / 100 MALES
45.4
MEDIAN AGE
3.0
AVG FAMILY SIZE
2.8
AVG HOUSEHOLD SIZE
12,791
LABOR FORCE [ PEOPLE ]
64.7%
PERCENT IN LABOR FORCE
6.3%
UNEMPLOYMENT RATE
Lafayette Zip Codes
Income in Lafayette
Income Overview in Lafayette
Per Capita Income in Lafayette is $111,213, while median incomes of families and households are $250,001 and $219,250 respectively.
| Characteristic | Number | Measure |
| Per Capita Income | 25,310 | $111,213 |
| Median Family Income | 6,935 | $250,001 |
| Mean Family Income | 6,935 | $356,458 |
| Median Household Income | 9,014 | $219,250 |
| Mean Household Income | 9,014 | $312,233 |
| Income Deficit | 6,935 | $0 |
| Wage / Income Gap (%) | 25,310 | 33.25% |
| Wage / Income Gap ($) | 25,310 | 66.75¢ per $1 |
| Gini / Inequality Index | 25,310 | 0.48 |
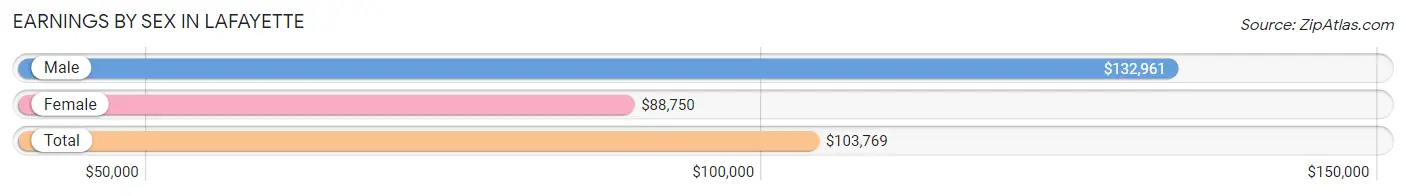
Earnings by Sex in Lafayette
Average Earnings in Lafayette are $103,769, $132,961 for men and $88,750 for women, a difference of 33.3%.
| Sex | Number | Average Earnings |
| Male | 7,352 (56.2%) | $132,961 |
| Female | 5,729 (43.8%) | $88,750 |
| Total | 13,081 (100.0%) | $103,769 |
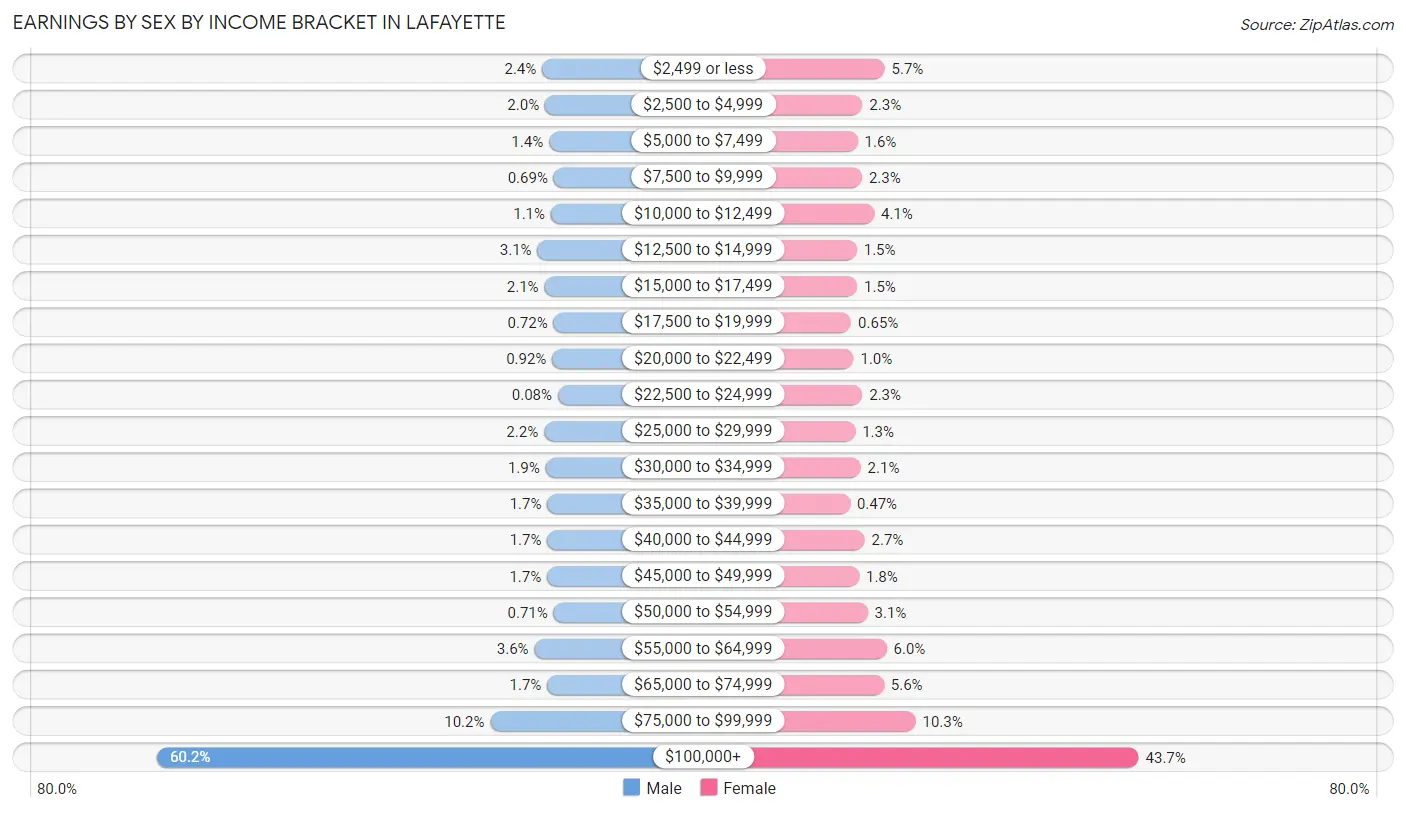
Earnings by Sex by Income Bracket in Lafayette
The most common earnings brackets in Lafayette are $100,000+ for men (4,422 | 60.2%) and $100,000+ for women (2,506 | 43.7%).
| Income | Male | Female |
| $2,499 or less | 179 (2.4%) | 325 (5.7%) |
| $2,500 to $4,999 | 147 (2.0%) | 134 (2.3%) |
| $5,000 to $7,499 | 103 (1.4%) | 93 (1.6%) |
| $7,500 to $9,999 | 51 (0.7%) | 130 (2.3%) |
| $10,000 to $12,499 | 82 (1.1%) | 234 (4.1%) |
| $12,500 to $14,999 | 231 (3.1%) | 86 (1.5%) |
| $15,000 to $17,499 | 154 (2.1%) | 88 (1.5%) |
| $17,500 to $19,999 | 53 (0.7%) | 37 (0.6%) |
| $20,000 to $22,499 | 68 (0.9%) | 58 (1.0%) |
| $22,500 to $24,999 | 6 (0.1%) | 133 (2.3%) |
| $25,000 to $29,999 | 158 (2.1%) | 72 (1.3%) |
| $30,000 to $34,999 | 141 (1.9%) | 119 (2.1%) |
| $35,000 to $39,999 | 122 (1.7%) | 27 (0.5%) |
| $40,000 to $44,999 | 122 (1.7%) | 153 (2.7%) |
| $45,000 to $49,999 | 124 (1.7%) | 105 (1.8%) |
| $50,000 to $54,999 | 52 (0.7%) | 179 (3.1%) |
| $55,000 to $64,999 | 264 (3.6%) | 342 (6.0%) |
| $65,000 to $74,999 | 123 (1.7%) | 318 (5.6%) |
| $75,000 to $99,999 | 750 (10.2%) | 590 (10.3%) |
| $100,000+ | 4,422 (60.2%) | 2,506 (43.7%) |
| Total | 7,352 (100.0%) | 5,729 (100.0%) |
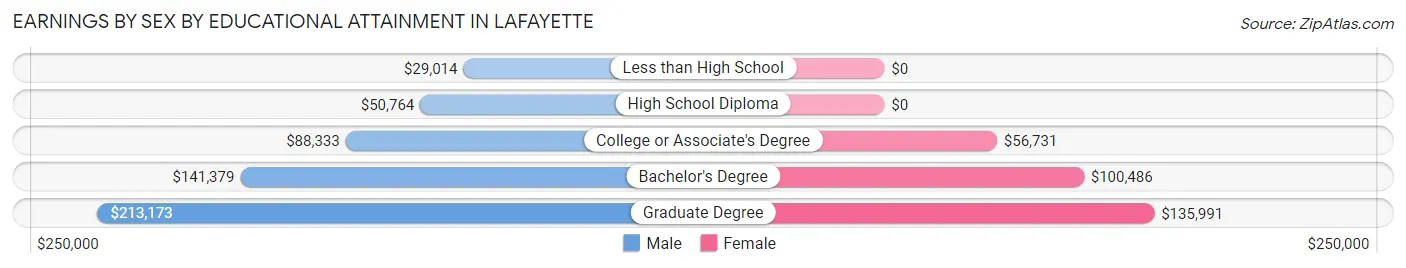
Earnings by Sex by Educational Attainment in Lafayette
Average earnings in Lafayette are $144,057 for men and $98,561 for women, a difference of 31.6%. Men with an educational attainment of graduate degree enjoy the highest average annual earnings of $213,173, while those with less than high school education earn the least with $29,014. Women with an educational attainment of graduate degree earn the most with the average annual earnings of $135,991, while those with college or associate's degree education have the smallest earnings of $56,731.
| Educational Attainment | Male Income | Female Income |
| Less than High School | $29,014 | $0 |
| High School Diploma | $50,764 | $0 |
| College or Associate's Degree | $88,333 | $56,731 |
| Bachelor's Degree | $141,379 | $100,486 |
| Graduate Degree | $213,173 | $135,991 |
| Total | $144,057 | $98,561 |
Family Income in Lafayette
Family Income Brackets in Lafayette
According to the Lafayette family income data, there are 4,418 families falling into the $200,000+ income range, which is the most common income bracket and makes up 63.7% of all families. Conversely, the $15,000 to $24,999 income bracket is the least frequent group with only 35 families (0.5%) belonging to this category.
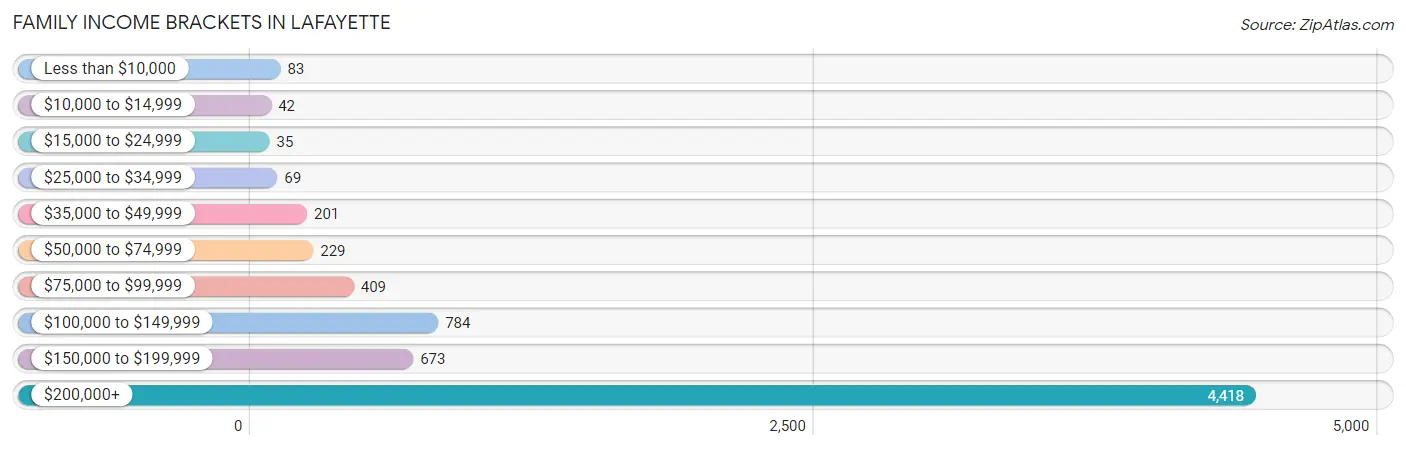
| Income Bracket | # Families | % Families |
| Less than $10,000 | 83 | 1.2% |
| $10,000 to $14,999 | 42 | 0.6% |
| $15,000 to $24,999 | 35 | 0.5% |
| $25,000 to $34,999 | 69 | 1.0% |
| $35,000 to $49,999 | 201 | 2.9% |
| $50,000 to $74,999 | 229 | 3.3% |
| $75,000 to $99,999 | 409 | 5.9% |
| $100,000 to $149,999 | 784 | 11.3% |
| $150,000 to $199,999 | 673 | 9.7% |
| $200,000+ | 4,418 | 63.7% |
Family Income by Famaliy Size in Lafayette
3-person families (1,720 | 24.8%) account for the highest median family income in Lafayette with $250,001 per family, while 2-person families (2,925 | 42.2%) have the highest median income of $101,602 per family member.
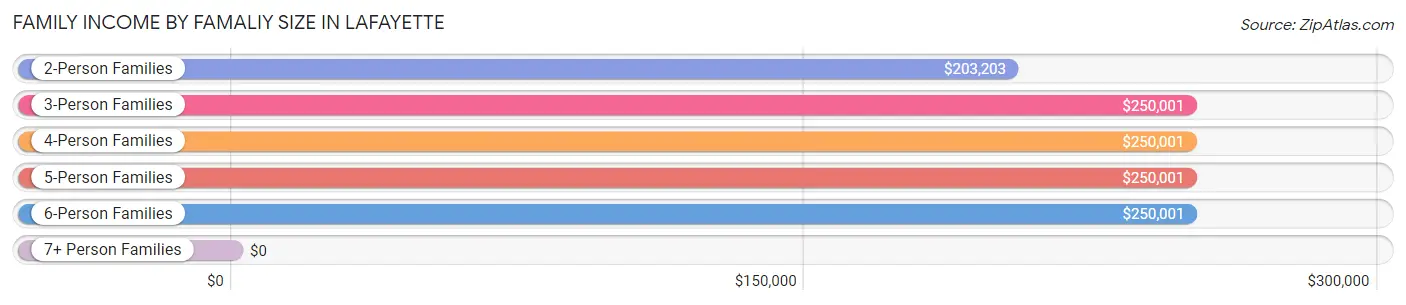
| Income Bracket | # Families | Median Income |
| 2-Person Families | 2,925 (42.2%) | $203,203 |
| 3-Person Families | 1,720 (24.8%) | $250,001 |
| 4-Person Families | 1,714 (24.7%) | $250,001 |
| 5-Person Families | 479 (6.9%) | $250,001 |
| 6-Person Families | 84 (1.2%) | $250,001 |
| 7+ Person Families | 13 (0.2%) | $0 |
| Total | 6,935 (100.0%) | $250,001 |
Family Income by Number of Earners in Lafayette
The median family income in Lafayette is $250,001, with families comprising 2 earners (3,289) having the highest median family income of $250,001, while families with no earners (1,053) have the lowest median family income of $136,597, accounting for 47.4% and 15.2% of families, respectively.
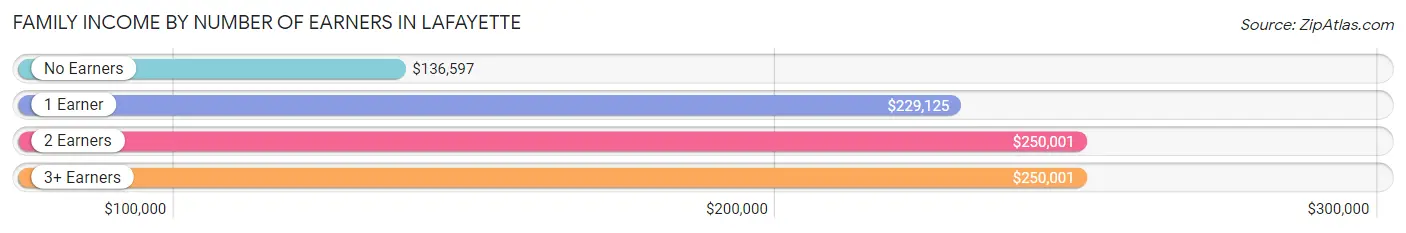
| Number of Earners | # Families | Median Income |
| No Earners | 1,053 (15.2%) | $136,597 |
| 1 Earner | 2,045 (29.5%) | $229,125 |
| 2 Earners | 3,289 (47.4%) | $250,001 |
| 3+ Earners | 548 (7.9%) | $250,001 |
| Total | 6,935 (100.0%) | $250,001 |
Household Income in Lafayette
Household Income Brackets in Lafayette
With 4,832 households falling in the category, the $200,000+ income range is the most frequent in Lafayette, accounting for 53.6% of all households. In contrast, only 90 households (1.0%) fall into the $10,000 to $14,999 income bracket, making it the least populous group.
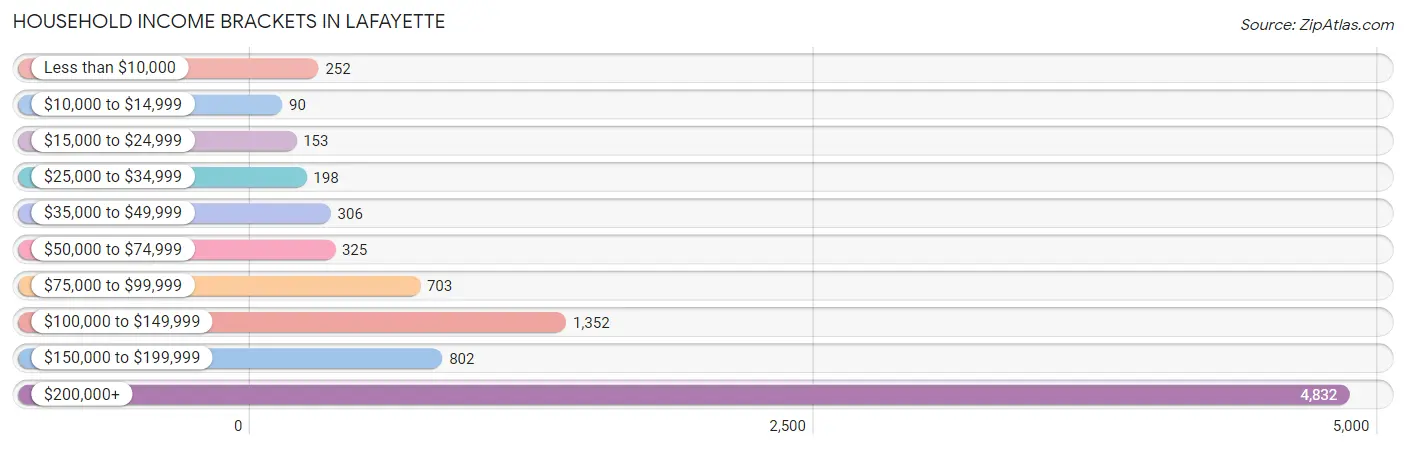
| Income Bracket | # Households | % Households |
| Less than $10,000 | 252 | 2.8% |
| $10,000 to $14,999 | 90 | 1.0% |
| $15,000 to $24,999 | 153 | 1.7% |
| $25,000 to $34,999 | 198 | 2.2% |
| $35,000 to $49,999 | 306 | 3.4% |
| $50,000 to $74,999 | 325 | 3.6% |
| $75,000 to $99,999 | 703 | 7.8% |
| $100,000 to $149,999 | 1,352 | 15.0% |
| $150,000 to $199,999 | 802 | 8.9% |
| $200,000+ | 4,832 | 53.6% |
Household Income by Householder Age in Lafayette
The median household income in Lafayette is $219,250, with the highest median household income of $250,001 found in the 25 to 44 years age bracket for the primary householder. A total of 1,923 households (21.3%) fall into this category. Meanwhile, the 15 to 24 years age bracket for the primary householder has the lowest median household income of $2,499, with 105 households (1.2%) in this group.
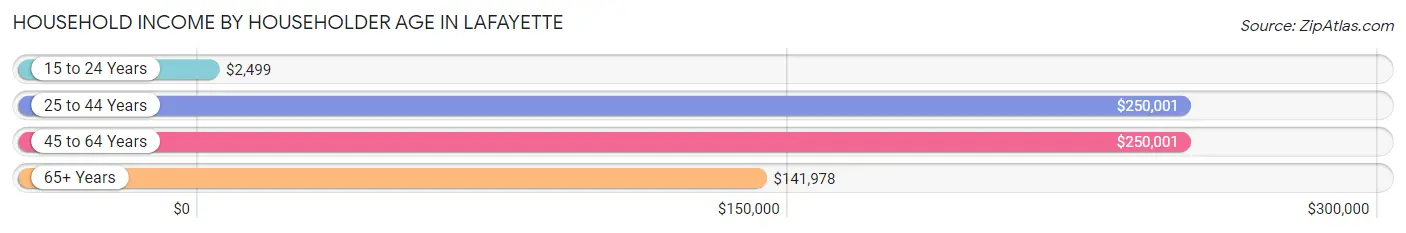
| Income Bracket | # Households | Median Income |
| 15 to 24 Years | 105 (1.2%) | $2,499 |
| 25 to 44 Years | 1,923 (21.3%) | $250,001 |
| 45 to 64 Years | 4,128 (45.8%) | $250,001 |
| 65+ Years | 2,858 (31.7%) | $141,978 |
| Total | 9,014 (100.0%) | $219,250 |
Poverty in Lafayette
Income Below Poverty by Sex and Age in Lafayette
With 4.3% poverty level for males and 5.0% for females among the residents of Lafayette, 5 year old males and 18 to 24 year old females are the most vulnerable to poverty, with 20 males (17.9%) and 231 females (26.6%) in their respective age groups living below the poverty level.
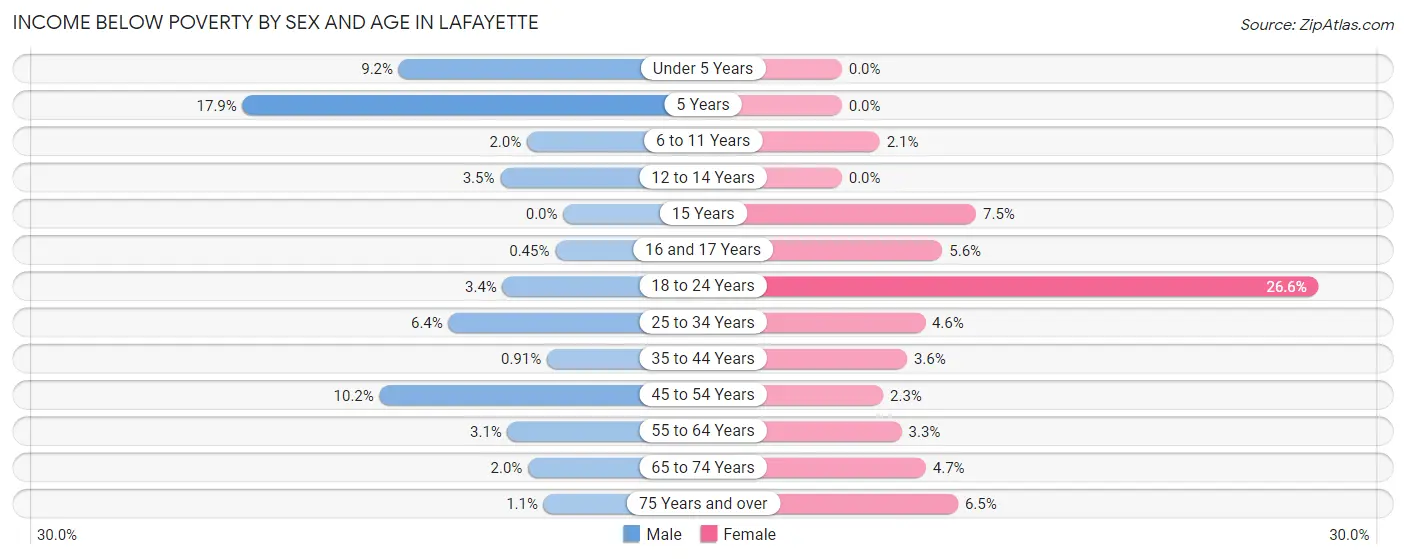
| Age Bracket | Male | Female |
| Under 5 Years | 35 (9.2%) | 0 (0.0%) |
| 5 Years | 20 (17.9%) | 0 (0.0%) |
| 6 to 11 Years | 30 (2.0%) | 19 (2.1%) |
| 12 to 14 Years | 17 (3.5%) | 0 (0.0%) |
| 15 Years | 0 (0.0%) | 27 (7.5%) |
| 16 and 17 Years | 1 (0.4%) | 20 (5.6%) |
| 18 to 24 Years | 18 (3.4%) | 231 (26.6%) |
| 25 to 34 Years | 74 (6.4%) | 34 (4.6%) |
| 35 to 44 Years | 14 (0.9%) | 56 (3.6%) |
| 45 to 54 Years | 233 (10.2%) | 46 (2.3%) |
| 55 to 64 Years | 65 (3.1%) | 51 (3.3%) |
| 65 to 74 Years | 22 (2.0%) | 73 (4.7%) |
| 75 Years and over | 12 (1.1%) | 69 (6.5%) |
| Total | 541 (4.3%) | 626 (5.0%) |
Income Above Poverty by Sex and Age in Lafayette
According to the poverty statistics in Lafayette, males aged 15 years and females aged under 5 years are the age groups that are most secure financially, with 100.0% of males and 100.0% of females in these age groups living above the poverty line.
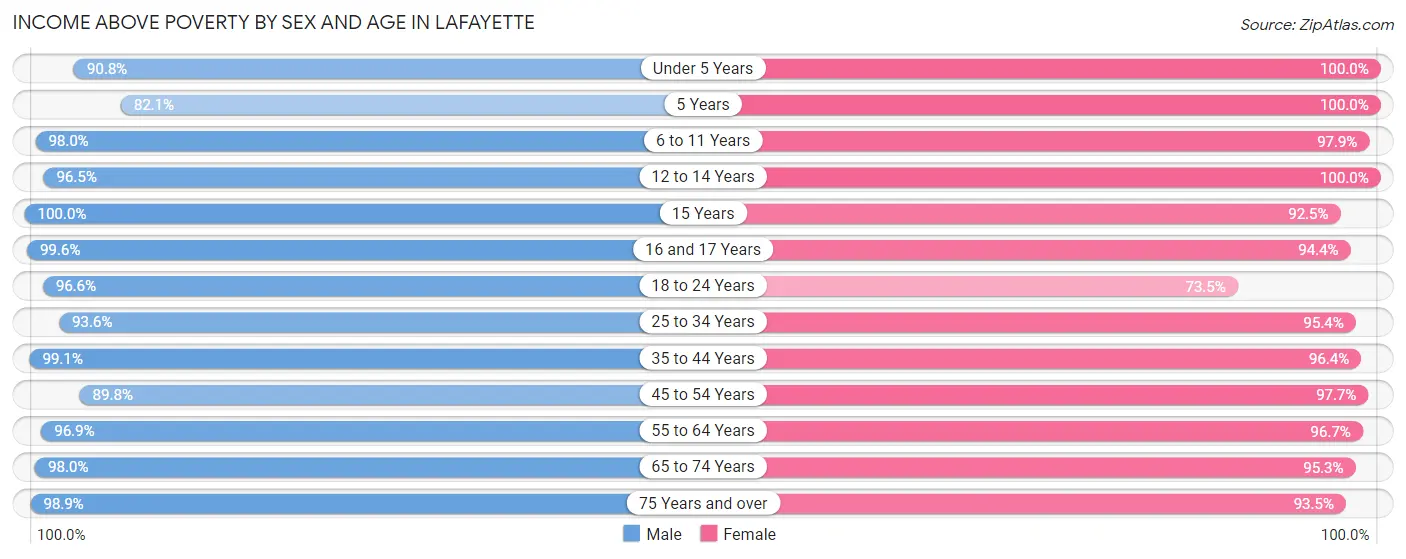
| Age Bracket | Male | Female |
| Under 5 Years | 347 (90.8%) | 731 (100.0%) |
| 5 Years | 92 (82.1%) | 133 (100.0%) |
| 6 to 11 Years | 1,455 (98.0%) | 883 (97.9%) |
| 12 to 14 Years | 468 (96.5%) | 702 (100.0%) |
| 15 Years | 215 (100.0%) | 334 (92.5%) |
| 16 and 17 Years | 223 (99.6%) | 337 (94.4%) |
| 18 to 24 Years | 515 (96.6%) | 639 (73.5%) |
| 25 to 34 Years | 1,084 (93.6%) | 701 (95.4%) |
| 35 to 44 Years | 1,522 (99.1%) | 1,487 (96.4%) |
| 45 to 54 Years | 2,045 (89.8%) | 1,954 (97.7%) |
| 55 to 64 Years | 2,032 (96.9%) | 1,479 (96.7%) |
| 65 to 74 Years | 1,101 (98.0%) | 1,488 (95.3%) |
| 75 Years and over | 1,086 (98.9%) | 998 (93.5%) |
| Total | 12,185 (95.8%) | 11,866 (95.0%) |
Income Below Poverty Among Married-Couple Families in Lafayette
The poverty statistics for married-couple families in Lafayette show that 1.1% or 66 of the total 6,284 families live below the poverty line. Families with no children have the highest poverty rate of 1.8%, comprising of 60 families. On the other hand, families with 1 or 2 children have the lowest poverty rate of 0.0%, which includes 0 families.
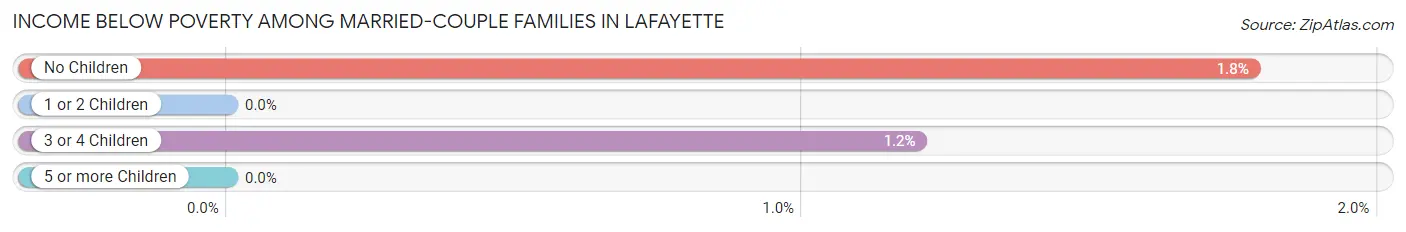
| Children | Above Poverty | Below Poverty |
| No Children | 3,317 (98.2%) | 60 (1.8%) |
| 1 or 2 Children | 2,406 (100.0%) | 0 (0.0%) |
| 3 or 4 Children | 495 (98.8%) | 6 (1.2%) |
| 5 or more Children | 0 (0.0%) | 0 (0.0%) |
| Total | 6,218 (99.0%) | 66 (1.1%) |
Income Below Poverty Among Single-Parent Households in Lafayette
According to the poverty data in Lafayette, 11.5% or 35 single-father households and 7.5% or 26 single-mother households are living below the poverty line. Among single-father households, those with 3 or 4 children have the highest poverty rate, with 14 households (56.0%) experiencing poverty. Likewise, among single-mother households, those with 1 or 2 children have the highest poverty rate, with 26 households (15.9%) falling below the poverty line.
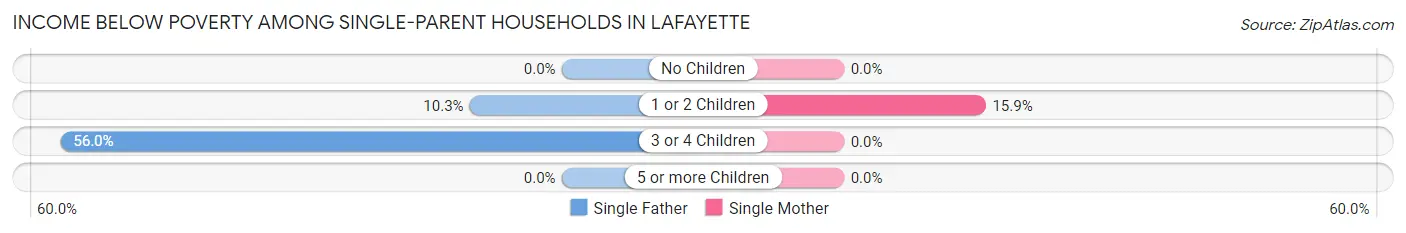
| Children | Single Father | Single Mother |
| No Children | 0 (0.0%) | 0 (0.0%) |
| 1 or 2 Children | 21 (10.3%) | 26 (15.9%) |
| 3 or 4 Children | 14 (56.0%) | 0 (0.0%) |
| 5 or more Children | 0 (0.0%) | 0 (0.0%) |
| Total | 35 (11.5%) | 26 (7.5%) |
Income Below Poverty Among Married-Couple vs Single-Parent Households in Lafayette
The poverty data for Lafayette shows that 66 of the married-couple family households (1.1%) and 61 of the single-parent households (9.4%) are living below the poverty level. Within the married-couple family households, those with no children have the highest poverty rate, with 60 households (1.8%) falling below the poverty line. Among the single-parent households, those with 3 or 4 children have the highest poverty rate, with 14 household (56.0%) living below poverty.
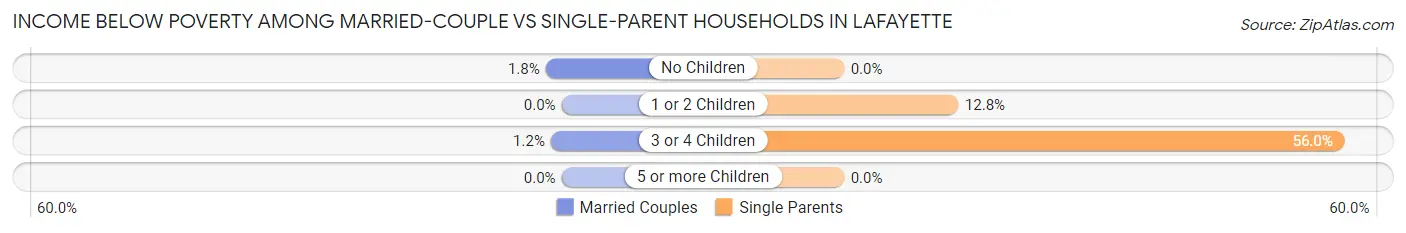
| Children | Married-Couple Families | Single-Parent Households |
| No Children | 60 (1.8%) | 0 (0.0%) |
| 1 or 2 Children | 0 (0.0%) | 47 (12.8%) |
| 3 or 4 Children | 6 (1.2%) | 14 (56.0%) |
| 5 or more Children | 0 (0.0%) | 0 (0.0%) |
| Total | 66 (1.1%) | 61 (9.4%) |
Race in Lafayette
The most populous races in Lafayette are White / Caucasian (19,561 | 77.3%), Two or more Races (2,608 | 10.3%), and Asian (2,596 | 10.3%).
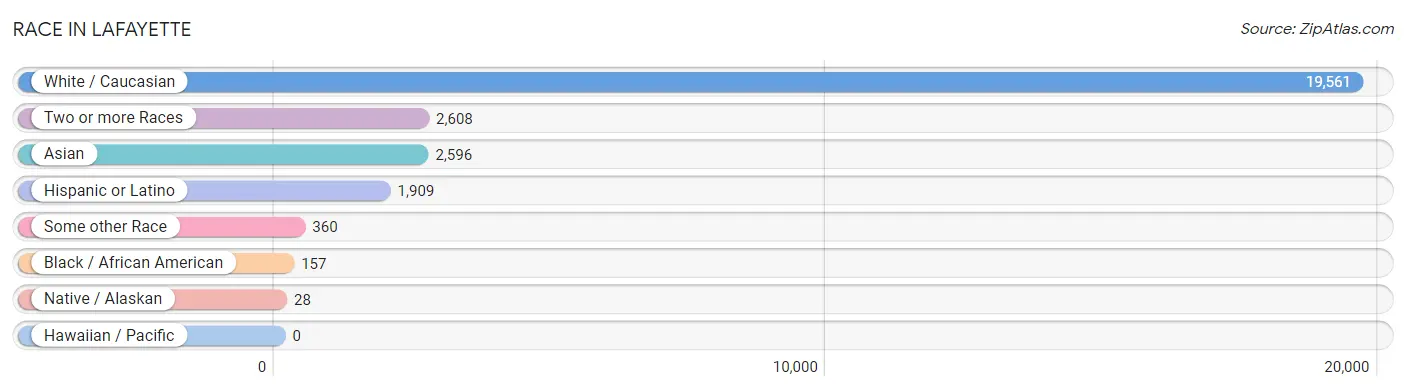
| Race | # Population | % Population |
| Asian | 2,596 | 10.3% |
| Black / African American | 157 | 0.6% |
| Hawaiian / Pacific | 0 | 0.0% |
| Hispanic or Latino | 1,909 | 7.5% |
| Native / Alaskan | 28 | 0.1% |
| White / Caucasian | 19,561 | 77.3% |
| Two or more Races | 2,608 | 10.3% |
| Some other Race | 360 | 1.4% |
| Total | 25,310 | 100.0% |
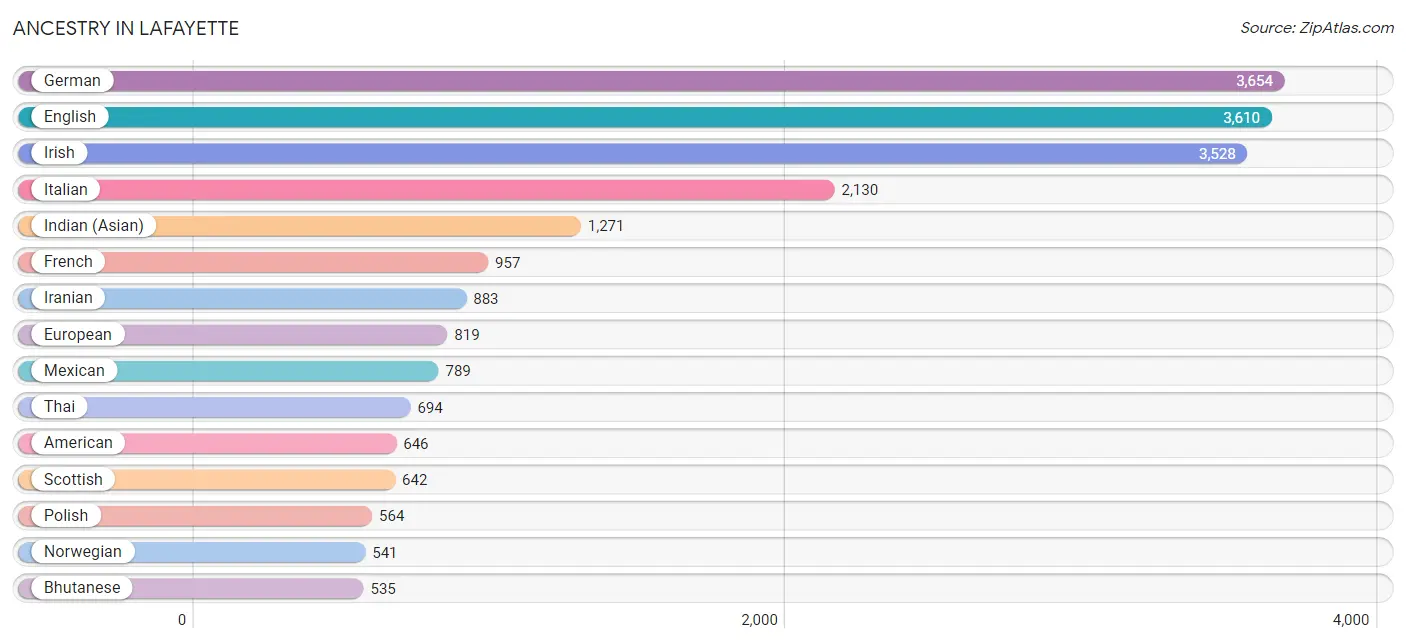
Ancestry in Lafayette
The most populous ancestries reported in Lafayette are German (3,654 | 14.4%), English (3,610 | 14.3%), Irish (3,528 | 13.9%), Italian (2,130 | 8.4%), and Indian (Asian) (1,271 | 5.0%), together accounting for 56.1% of all Lafayette residents.
| Ancestry | # Population | % Population |
| Afghan | 71 | 0.3% |
| African | 16 | 0.1% |
| Alaska Native | 26 | 0.1% |
| Albanian | 67 | 0.3% |
| American | 646 | 2.5% |
| Arab | 159 | 0.6% |
| Argentinean | 25 | 0.1% |
| Armenian | 101 | 0.4% |
| Australian | 303 | 1.2% |
| Austrian | 65 | 0.3% |
| Basque | 41 | 0.2% |
| Belgian | 135 | 0.5% |
| Bhutanese | 535 | 2.1% |
| Brazilian | 69 | 0.3% |
| British | 450 | 1.8% |
| Bulgarian | 16 | 0.1% |
| Burmese | 480 | 1.9% |
| Canadian | 101 | 0.4% |
| Central American | 445 | 1.8% |
| Cherokee | 108 | 0.4% |
| Chippewa | 10 | 0.0% |
| Colombian | 142 | 0.6% |
| Costa Rican | 115 | 0.4% |
| Croatian | 156 | 0.6% |
| Cuban | 67 | 0.3% |
| Czech | 97 | 0.4% |
| Danish | 199 | 0.8% |
| Dutch | 502 | 2.0% |
| Eastern European | 306 | 1.2% |
| Egyptian | 59 | 0.2% |
| English | 3,610 | 14.3% |
| Estonian | 31 | 0.1% |
| European | 819 | 3.2% |
| Filipino | 63 | 0.3% |
| Finnish | 143 | 0.6% |
| French | 957 | 3.8% |
| French Canadian | 113 | 0.4% |
| German | 3,654 | 14.4% |
| Greek | 81 | 0.3% |
| Haitian | 26 | 0.1% |
| Hungarian | 102 | 0.4% |
| Indian (Asian) | 1,271 | 5.0% |
| Iranian | 883 | 3.5% |
| Iraqi | 50 | 0.2% |
| Irish | 3,528 | 13.9% |
| Italian | 2,130 | 8.4% |
| Korean | 225 | 0.9% |
| Laotian | 20 | 0.1% |
| Latvian | 16 | 0.1% |
| Lebanese | 35 | 0.1% |
| Lithuanian | 87 | 0.3% |
| Maltese | 49 | 0.2% |
| Mexican | 789 | 3.1% |
| Mexican American Indian | 26 | 0.1% |
| Native Hawaiian | 18 | 0.1% |
| Navajo | 14 | 0.1% |
| Nicaraguan | 57 | 0.2% |
| Northern European | 74 | 0.3% |
| Norwegian | 541 | 2.1% |
| Pakistani | 16 | 0.1% |
| Palestinian | 15 | 0.1% |
| Panamanian | 16 | 0.1% |
| Pennsylvania German | 8 | 0.0% |
| Peruvian | 107 | 0.4% |
| Polish | 564 | 2.2% |
| Portuguese | 458 | 1.8% |
| Puerto Rican | 72 | 0.3% |
| Romanian | 76 | 0.3% |
| Russian | 341 | 1.3% |
| Salvadoran | 257 | 1.0% |
| Samoan | 124 | 0.5% |
| Scandinavian | 147 | 0.6% |
| Scotch-Irish | 225 | 0.9% |
| Scottish | 642 | 2.5% |
| Serbian | 32 | 0.1% |
| Slavic | 29 | 0.1% |
| Slovak | 11 | 0.0% |
| Slovene | 47 | 0.2% |
| South African | 123 | 0.5% |
| South American | 306 | 1.2% |
| South American Indian | 37 | 0.2% |
| Spaniard | 20 | 0.1% |
| Spanish | 187 | 0.7% |
| Sri Lankan | 114 | 0.4% |
| Subsaharan African | 139 | 0.5% |
| Swedish | 402 | 1.6% |
| Swiss | 67 | 0.3% |
| Thai | 694 | 2.7% |
| Turkish | 125 | 0.5% |
| Ukrainian | 74 | 0.3% |
| Uruguayan | 32 | 0.1% |
| Welsh | 148 | 0.6% |
| Yugoslavian | 20 | 0.1% | View All 93 Rows |
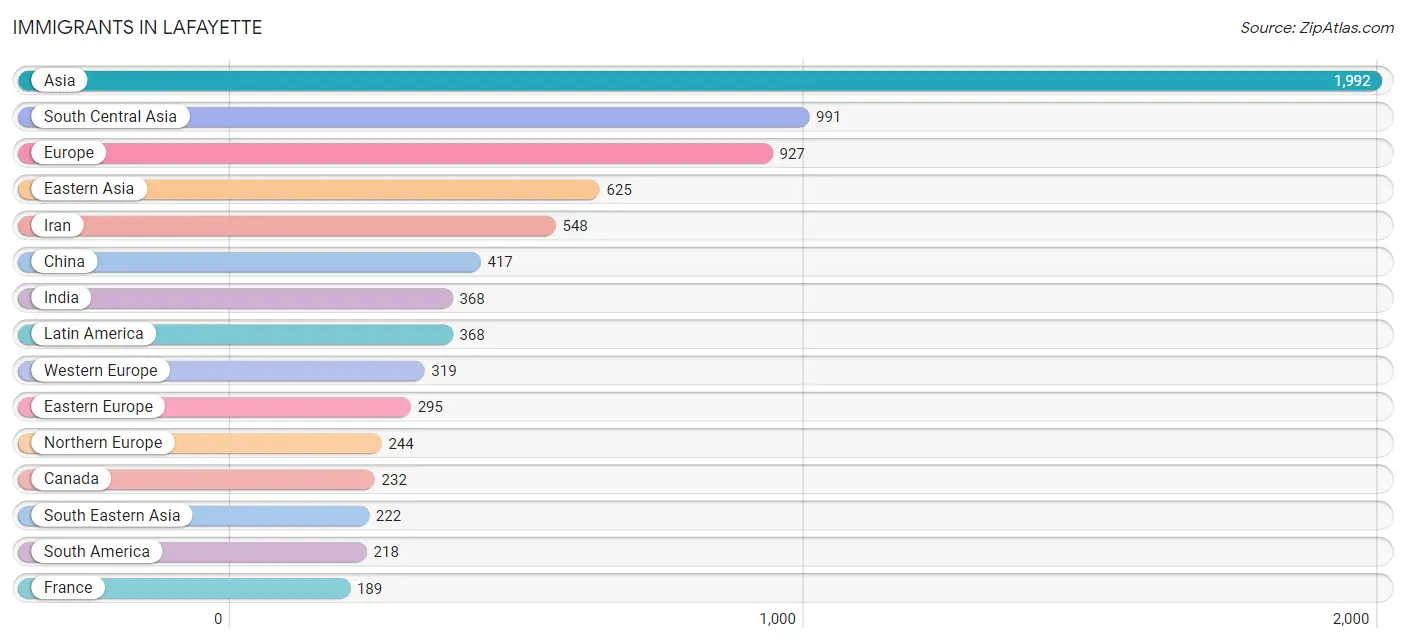
Immigrants in Lafayette
The most numerous immigrant groups reported in Lafayette came from Asia (1,992 | 7.9%), South Central Asia (991 | 3.9%), Europe (927 | 3.7%), Eastern Asia (625 | 2.5%), and Iran (548 | 2.2%), together accounting for 20.1% of all Lafayette residents.
| Immigration Origin | # Population | % Population |
| Africa | 110 | 0.4% |
| Argentina | 1 | 0.0% |
| Asia | 1,992 | 7.9% |
| Australia | 151 | 0.6% |
| Belarus | 14 | 0.1% |
| Brazil | 91 | 0.4% |
| Bulgaria | 16 | 0.1% |
| Canada | 232 | 0.9% |
| Caribbean | 26 | 0.1% |
| Central America | 124 | 0.5% |
| China | 417 | 1.7% |
| Colombia | 76 | 0.3% |
| Czechoslovakia | 13 | 0.1% |
| Denmark | 10 | 0.0% |
| Eastern Africa | 9 | 0.0% |
| Eastern Asia | 625 | 2.5% |
| Eastern Europe | 295 | 1.2% |
| Egypt | 35 | 0.1% |
| El Salvador | 17 | 0.1% |
| England | 23 | 0.1% |
| Europe | 927 | 3.7% |
| France | 189 | 0.7% |
| Germany | 21 | 0.1% |
| Greece | 35 | 0.1% |
| Haiti | 26 | 0.1% |
| Hong Kong | 135 | 0.5% |
| Hungary | 29 | 0.1% |
| India | 368 | 1.5% |
| Iran | 548 | 2.2% |
| Iraq | 50 | 0.2% |
| Ireland | 47 | 0.2% |
| Israel | 54 | 0.2% |
| Italy | 34 | 0.1% |
| Japan | 50 | 0.2% |
| Korea | 158 | 0.6% |
| Latin America | 368 | 1.5% |
| Lithuania | 12 | 0.1% |
| Malaysia | 20 | 0.1% |
| Mexico | 50 | 0.2% |
| Netherlands | 101 | 0.4% |
| Nicaragua | 57 | 0.2% |
| Northern Africa | 35 | 0.1% |
| Northern Europe | 244 | 1.0% |
| Oceania | 172 | 0.7% |
| Pakistan | 23 | 0.1% |
| Peru | 50 | 0.2% |
| Philippines | 115 | 0.4% |
| Poland | 25 | 0.1% |
| Russia | 123 | 0.5% |
| South Africa | 66 | 0.3% |
| South America | 218 | 0.9% |
| South Central Asia | 991 | 3.9% |
| South Eastern Asia | 222 | 0.9% |
| Southern Europe | 69 | 0.3% |
| Sri Lanka | 41 | 0.2% |
| Sweden | 32 | 0.1% |
| Switzerland | 8 | 0.0% |
| Taiwan | 49 | 0.2% |
| Thailand | 35 | 0.1% |
| Turkey | 50 | 0.2% |
| Ukraine | 44 | 0.2% |
| Vietnam | 52 | 0.2% |
| Western Asia | 154 | 0.6% |
| Western Europe | 319 | 1.3% | View All 64 Rows |
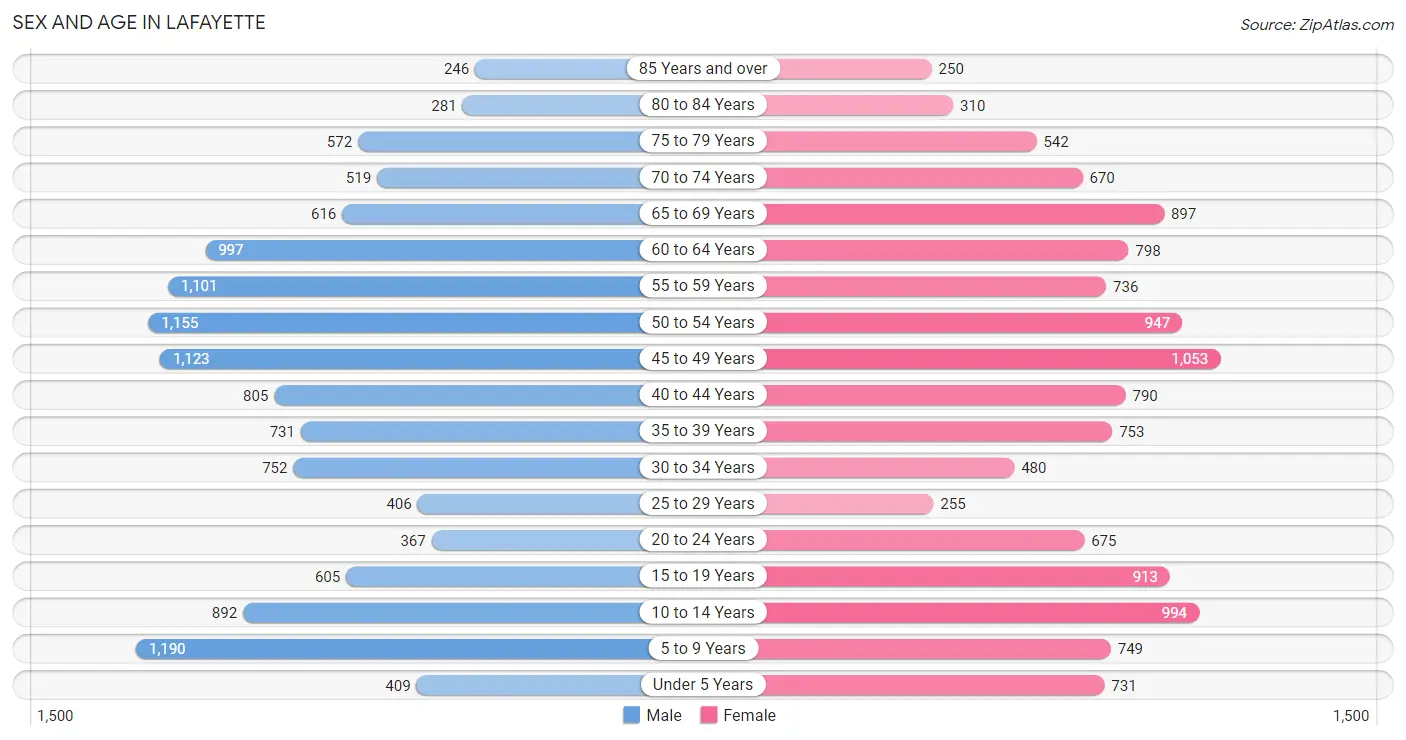
Sex and Age in Lafayette
Sex and Age in Lafayette
The most populous age groups in Lafayette are 5 to 9 Years (1,190 | 9.3%) for men and 45 to 49 Years (1,053 | 8.4%) for women.
| Age Bracket | Male | Female |
| Under 5 Years | 409 (3.2%) | 731 (5.8%) |
| 5 to 9 Years | 1,190 (9.3%) | 749 (6.0%) |
| 10 to 14 Years | 892 (7.0%) | 994 (7.9%) |
| 15 to 19 Years | 605 (4.7%) | 913 (7.3%) |
| 20 to 24 Years | 367 (2.9%) | 675 (5.4%) |
| 25 to 29 Years | 406 (3.2%) | 255 (2.0%) |
| 30 to 34 Years | 752 (5.9%) | 480 (3.8%) |
| 35 to 39 Years | 731 (5.7%) | 753 (6.0%) |
| 40 to 44 Years | 805 (6.3%) | 790 (6.3%) |
| 45 to 49 Years | 1,123 (8.8%) | 1,053 (8.4%) |
| 50 to 54 Years | 1,155 (9.0%) | 947 (7.5%) |
| 55 to 59 Years | 1,101 (8.6%) | 736 (5.9%) |
| 60 to 64 Years | 997 (7.8%) | 798 (6.4%) |
| 65 to 69 Years | 616 (4.8%) | 897 (7.1%) |
| 70 to 74 Years | 519 (4.1%) | 670 (5.3%) |
| 75 to 79 Years | 572 (4.5%) | 542 (4.3%) |
| 80 to 84 Years | 281 (2.2%) | 310 (2.5%) |
| 85 Years and over | 246 (1.9%) | 250 (2.0%) |
| Total | 12,767 (100.0%) | 12,543 (100.0%) |
Families and Households in Lafayette
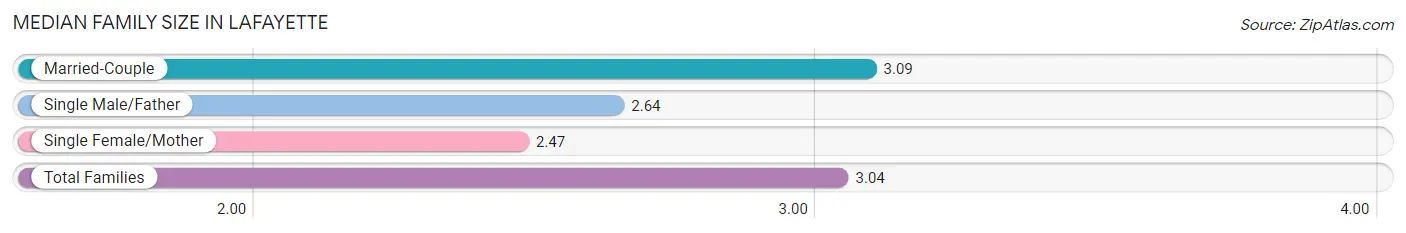
Median Family Size in Lafayette
The median family size in Lafayette is 3.04 persons per family, with married-couple families (6,284 | 90.6%) accounting for the largest median family size of 3.09 persons per family. On the other hand, single female/mother families (347 | 5.0%) represent the smallest median family size with 2.47 persons per family.
| Family Type | # Families | Family Size |
| Married-Couple | 6,284 (90.6%) | 3.09 |
| Single Male/Father | 304 (4.4%) | 2.64 |
| Single Female/Mother | 347 (5.0%) | 2.47 |
| Total Families | 6,935 (100.0%) | 3.04 |
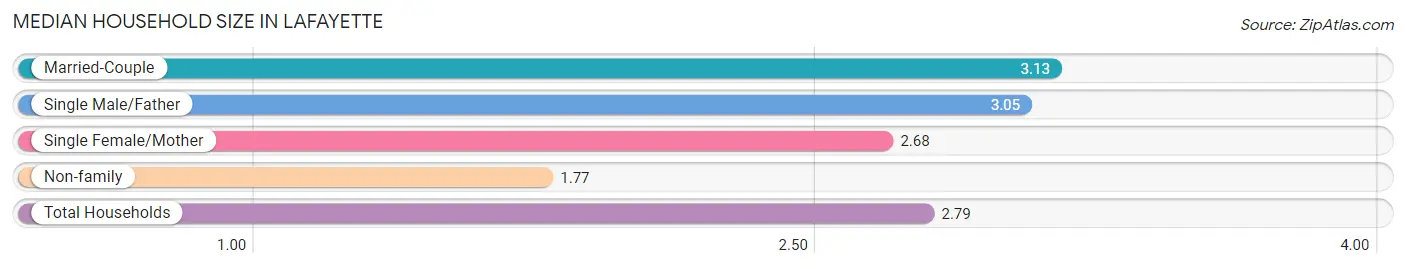
Median Household Size in Lafayette
The median household size in Lafayette is 2.79 persons per household, with married-couple households (6,284 | 69.7%) accounting for the largest median household size of 3.13 persons per household. non-family households (2,079 | 23.1%) represent the smallest median household size with 1.77 persons per household.
| Household Type | # Households | Household Size |
| Married-Couple | 6,284 (69.7%) | 3.13 |
| Single Male/Father | 304 (3.4%) | 3.05 |
| Single Female/Mother | 347 (3.8%) | 2.68 |
| Non-family | 2,079 (23.1%) | 1.77 |
| Total Households | 9,014 (100.0%) | 2.79 |
Household Size by Marriage Status in Lafayette
Out of a total of 9,014 households in Lafayette, 6,935 (76.9%) are family households, while 2,079 (23.1%) are nonfamily households. The most numerous type of family households are 2-person households, comprising 2,825, and the most common type of nonfamily households are 1-person households, comprising 1,509.
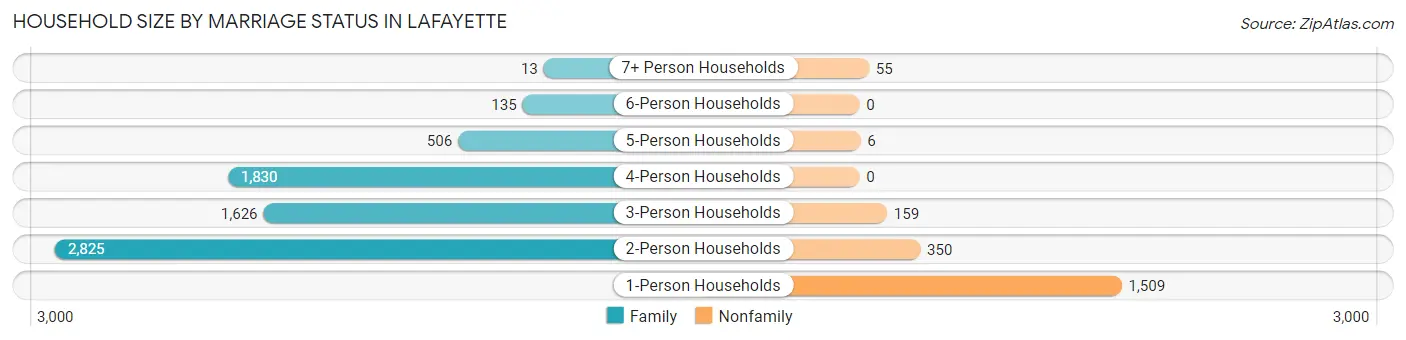
| Household Size | Family Households | Nonfamily Households |
| 1-Person Households | - | 1,509 (16.7%) |
| 2-Person Households | 2,825 (31.3%) | 350 (3.9%) |
| 3-Person Households | 1,626 (18.0%) | 159 (1.8%) |
| 4-Person Households | 1,830 (20.3%) | 0 (0.0%) |
| 5-Person Households | 506 (5.6%) | 6 (0.1%) |
| 6-Person Households | 135 (1.5%) | 0 (0.0%) |
| 7+ Person Households | 13 (0.1%) | 55 (0.6%) |
| Total | 6,935 (76.9%) | 2,079 (23.1%) |
Female Fertility in Lafayette
Fertility by Age in Lafayette
Average fertility rate in Lafayette is 41.0 births per 1,000 women. Women in the age bracket of 35 to 50 years have the highest fertility rate with 64.0 births per 1,000 women. Women in the age bracket of 35 to 50 years acount for 86.5% of all women with births.
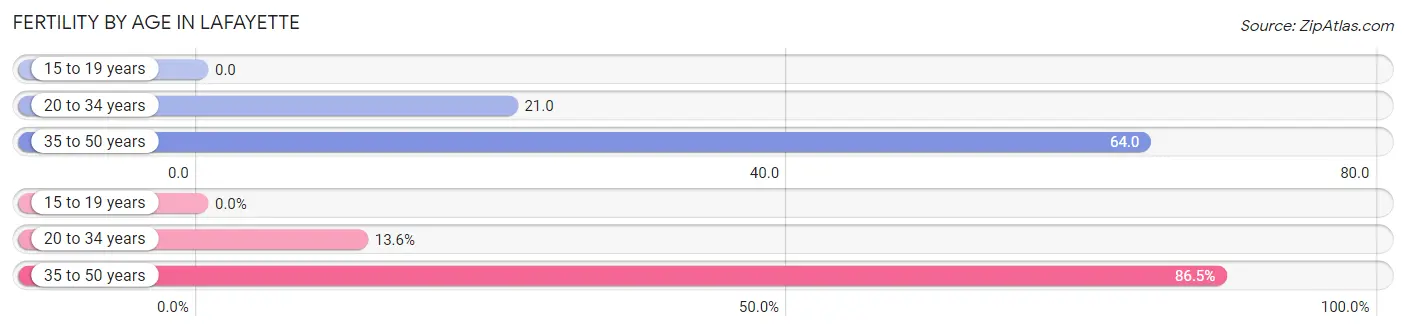
| Age Bracket | Women with Births | Births / 1,000 Women |
| 15 to 19 years | 0 (0.0%) | 0.0 |
| 20 to 34 years | 29 (13.6%) | 21.0 |
| 35 to 50 years | 185 (86.5%) | 64.0 |
| Total | 214 (100.0%) | 41.0 |
Fertility by Age by Marriage Status in Lafayette
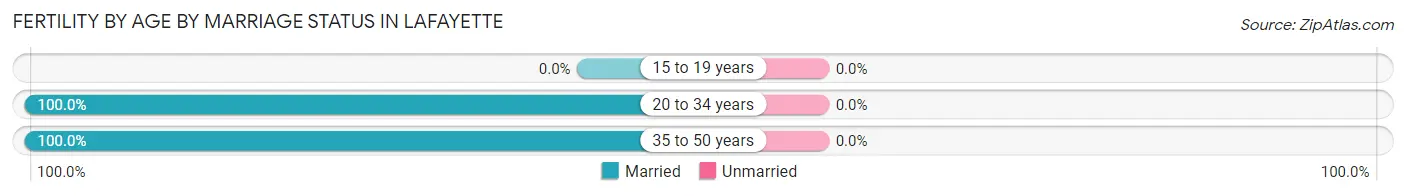
| Age Bracket | Married | Unmarried |
| 15 to 19 years | 0 (0.0%) | 0 (0.0%) |
| 20 to 34 years | 29 (100.0%) | 0 (0.0%) |
| 35 to 50 years | 185 (100.0%) | 0 (0.0%) |
| Total | 214 (100.0%) | 0 (0.0%) |
Fertility by Education in Lafayette
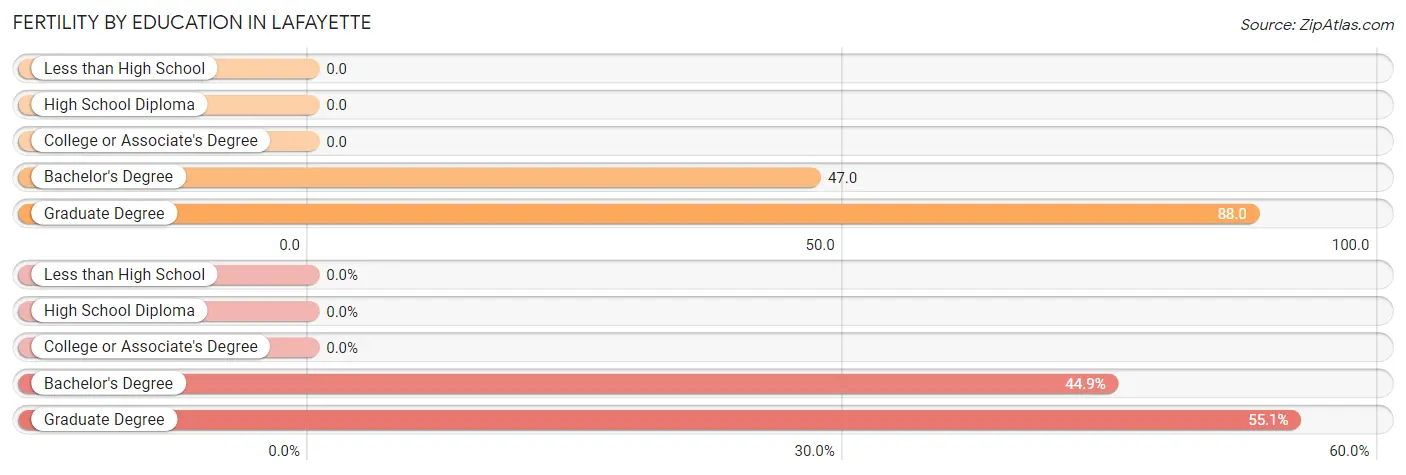
| Educational Attainment | Women with Births | Births / 1,000 Women |
| Less than High School | 0 (0.0%) | 0.0 |
| High School Diploma | 0 (0.0%) | 0.0 |
| College or Associate's Degree | 0 (0.0%) | 0.0 |
| Bachelor's Degree | 96 (44.9%) | 47.0 |
| Graduate Degree | 118 (55.1%) | 88.0 |
| Total | 214 (100.0%) | 41.0 |
Fertility by Education by Marriage Status in Lafayette
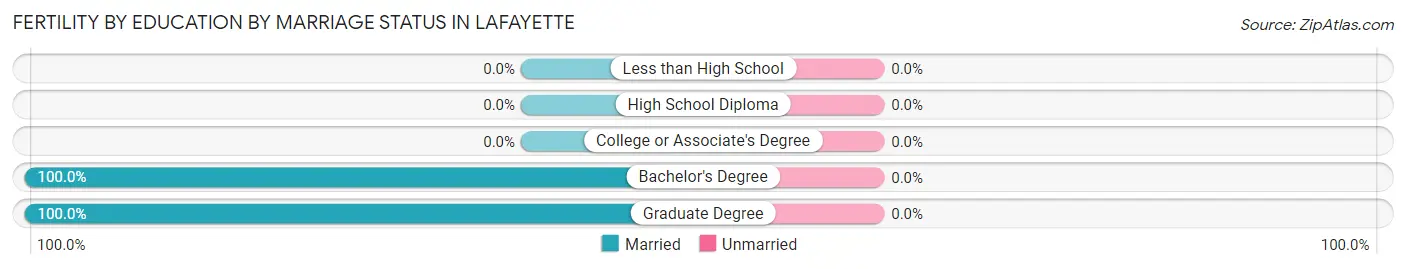
| Educational Attainment | Married | Unmarried |
| Less than High School | 0 (0.0%) | 0 (0.0%) |
| High School Diploma | 0 (0.0%) | 0 (0.0%) |
| College or Associate's Degree | 0 (0.0%) | 0 (0.0%) |
| Bachelor's Degree | 96 (100.0%) | 0 (0.0%) |
| Graduate Degree | 118 (100.0%) | 0 (0.0%) |
| Total | 214 (100.0%) | 0 (0.0%) |
Employment Characteristics in Lafayette
Employment by Class of Employer in Lafayette
Among the 11,709 employed individuals in Lafayette, private company employees (7,760 | 66.3%), self-employed (not incorporated) (1,048 | 8.9%), and self-employed (incorporated) (922 | 7.9%) make up the most common classes of employment.
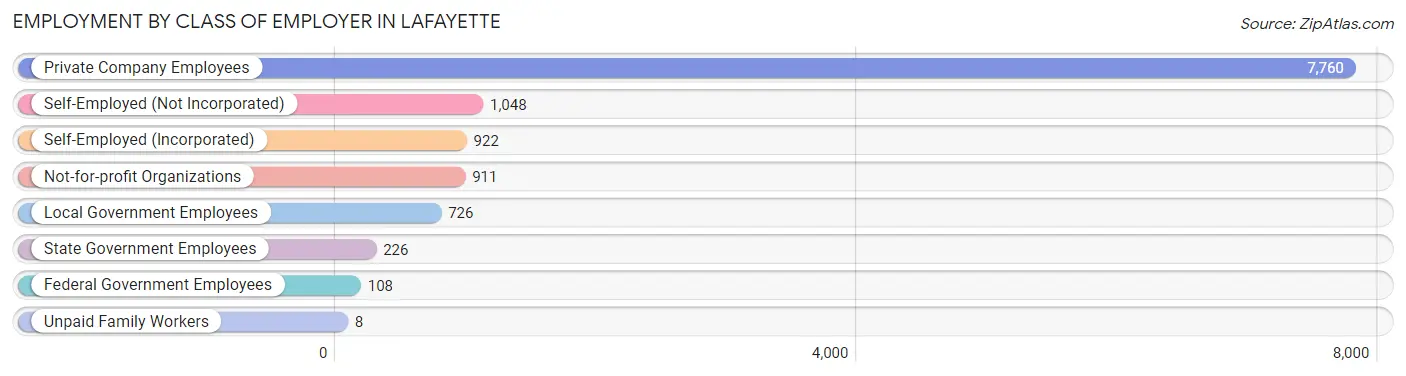
| Employer Class | # Employees | % Employees |
| Private Company Employees | 7,760 | 66.3% |
| Self-Employed (Incorporated) | 922 | 7.9% |
| Self-Employed (Not Incorporated) | 1,048 | 8.9% |
| Not-for-profit Organizations | 911 | 7.8% |
| Local Government Employees | 726 | 6.2% |
| State Government Employees | 226 | 1.9% |
| Federal Government Employees | 108 | 0.9% |
| Unpaid Family Workers | 8 | 0.1% |
| Total | 11,709 | 100.0% |
Employment Status by Age in Lafayette
According to the labor force statistics for Lafayette, out of the total population over 16 years of age (19,769), 64.7% or 12,791 individuals are in the labor force, with 6.3% or 806 of them unemployed. The age group with the highest labor force participation rate is 30 to 34 years, with 89.4% or 1,101 individuals in the labor force. Within the labor force, the 45 to 54 years age range has the highest percentage of unemployed individuals, with 11.1% or 393 of them being unemployed.
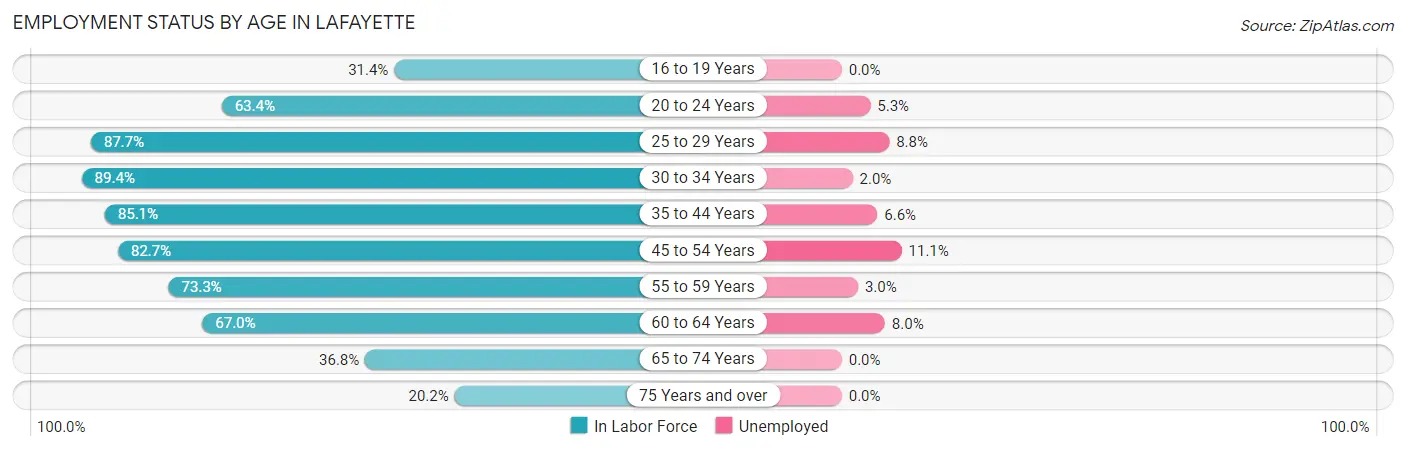
| Age Bracket | In Labor Force | Unemployed |
| 16 to 19 Years | 296 (31.4%) | 0 (0.0%) |
| 20 to 24 Years | 661 (63.4%) | 35 (5.3%) |
| 25 to 29 Years | 580 (87.7%) | 51 (8.8%) |
| 30 to 34 Years | 1,101 (89.4%) | 22 (2.0%) |
| 35 to 44 Years | 2,620 (85.1%) | 173 (6.6%) |
| 45 to 54 Years | 3,538 (82.7%) | 393 (11.1%) |
| 55 to 59 Years | 1,347 (73.3%) | 40 (3.0%) |
| 60 to 64 Years | 1,203 (67.0%) | 96 (8.0%) |
| 65 to 74 Years | 994 (36.8%) | 0 (0.0%) |
| 75 Years and over | 445 (20.2%) | 0 (0.0%) |
| Total | 12,791 (64.7%) | 806 (6.3%) |
Employment Status by Educational Attainment in Lafayette
According to labor force statistics for Lafayette, 80.6% of individuals (10,383) out of the total population between 25 and 64 years of age (12,882) are in the labor force, with 7.5% or 779 of them being unemployed. The group with the highest labor force participation rate are those with the educational attainment of high school diploma, with 86.8% or 452 individuals in the labor force. Within the labor force, individuals with less than high school education have the highest percentage of unemployment, with 15.6% or 22 of them being unemployed.
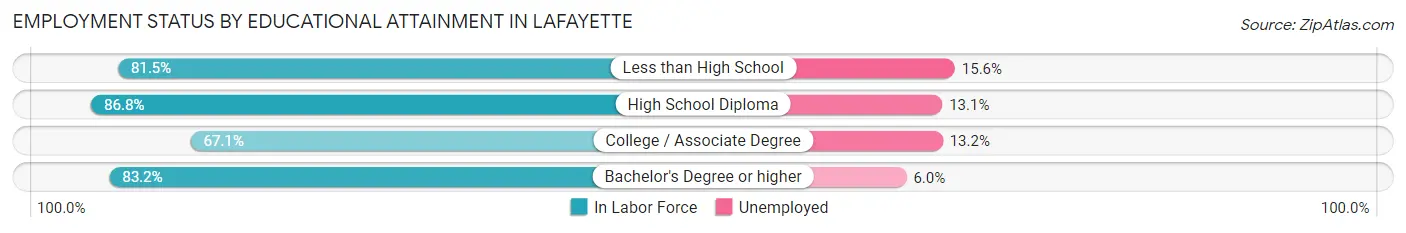
| Educational Attainment | In Labor Force | Unemployed |
| Less than High School | 141 (81.5%) | 27 (15.6%) |
| High School Diploma | 452 (86.8%) | 68 (13.1%) |
| College / Associate Degree | 1,423 (67.1%) | 280 (13.2%) |
| Bachelor's Degree or higher | 8,377 (83.2%) | 604 (6.0%) |
| Total | 10,383 (80.6%) | 966 (7.5%) |
Employment Occupations by Sex in Lafayette
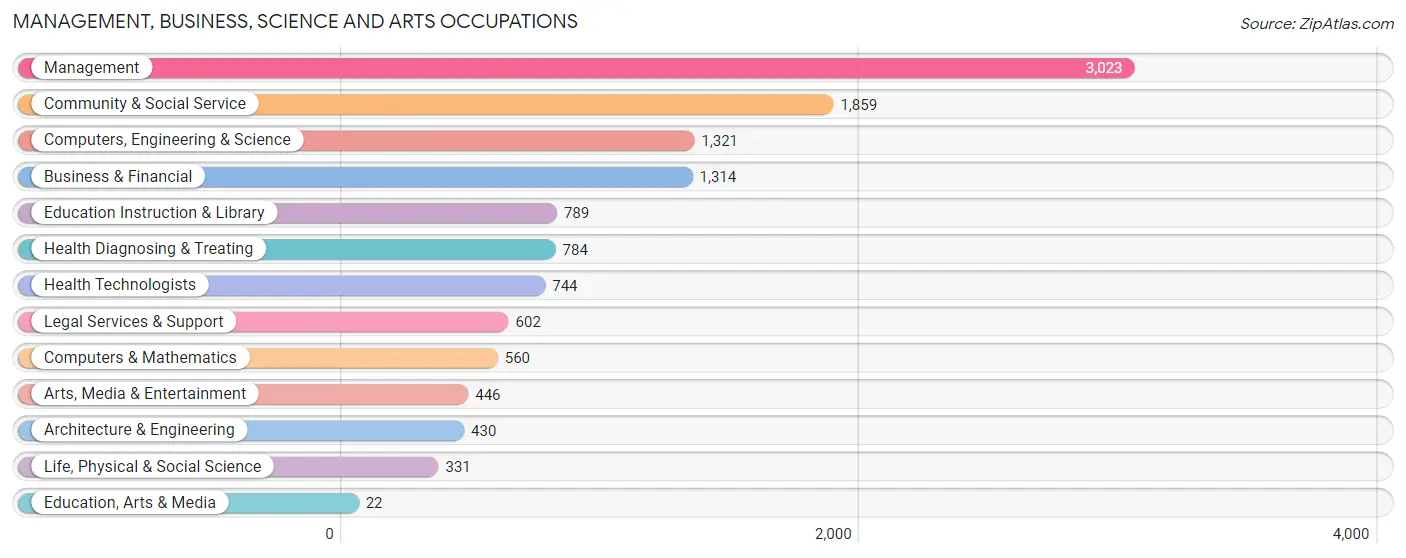
Management, Business, Science and Arts Occupations
The most common Management, Business, Science and Arts occupations in Lafayette are Management (3,023 | 25.2%), Community & Social Service (1,859 | 15.5%), Computers, Engineering & Science (1,321 | 11.0%), Business & Financial (1,314 | 11.0%), and Education Instruction & Library (789 | 6.6%).
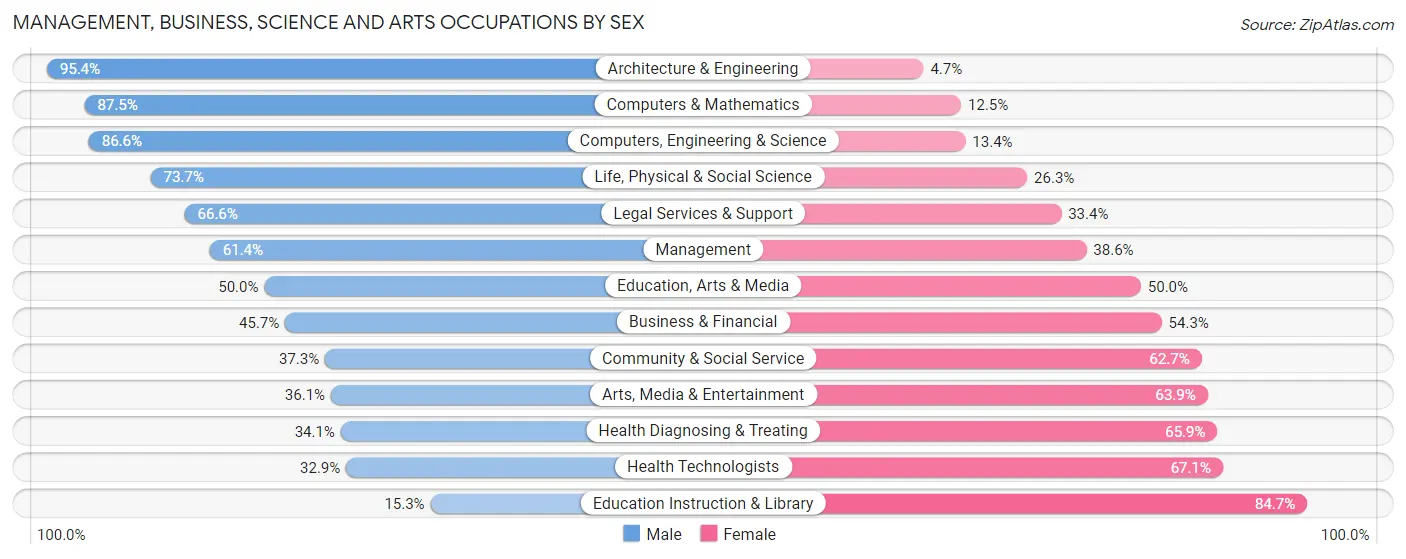
Management, Business, Science and Arts Occupations by Sex
Within the Management, Business, Science and Arts occupations in Lafayette, the most male-oriented occupations are Architecture & Engineering (95.4%), Computers & Mathematics (87.5%), and Computers, Engineering & Science (86.6%), while the most female-oriented occupations are Education Instruction & Library (84.7%), Health Technologists (67.1%), and Health Diagnosing & Treating (65.9%).
| Occupation | Male | Female |
| Management | 1,855 (61.4%) | 1,168 (38.6%) |
| Business & Financial | 600 (45.7%) | 714 (54.3%) |
| Computers, Engineering & Science | 1,144 (86.6%) | 177 (13.4%) |
| Computers & Mathematics | 490 (87.5%) | 70 (12.5%) |
| Architecture & Engineering | 410 (95.4%) | 20 (4.6%) |
| Life, Physical & Social Science | 244 (73.7%) | 87 (26.3%) |
| Community & Social Service | 694 (37.3%) | 1,165 (62.7%) |
| Education, Arts & Media | 11 (50.0%) | 11 (50.0%) |
| Legal Services & Support | 401 (66.6%) | 201 (33.4%) |
| Education Instruction & Library | 121 (15.3%) | 668 (84.7%) |
| Arts, Media & Entertainment | 161 (36.1%) | 285 (63.9%) |
| Health Diagnosing & Treating | 267 (34.1%) | 517 (65.9%) |
| Health Technologists | 245 (32.9%) | 499 (67.1%) |
| Total (Category) | 4,560 (54.9%) | 3,741 (45.1%) |
| Total (Overall) | 6,740 (56.3%) | 5,236 (43.7%) |
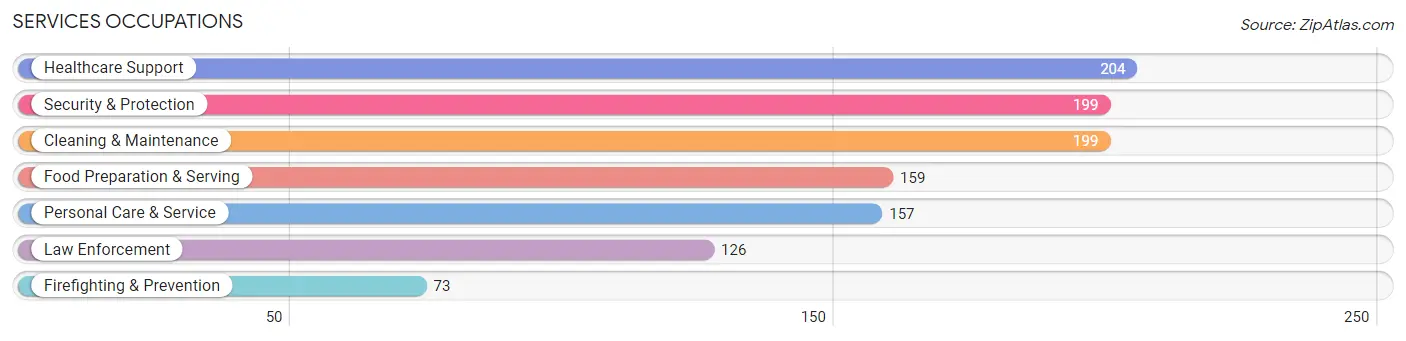
Services Occupations
The most common Services occupations in Lafayette are Healthcare Support (204 | 1.7%), Security & Protection (199 | 1.7%), Cleaning & Maintenance (199 | 1.7%), Food Preparation & Serving (159 | 1.3%), and Personal Care & Service (157 | 1.3%).
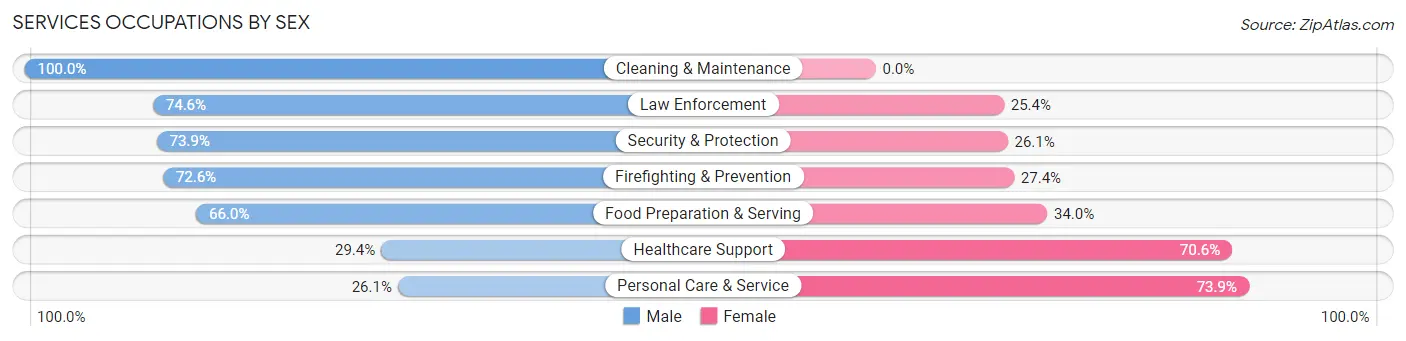
Services Occupations by Sex
Within the Services occupations in Lafayette, the most male-oriented occupations are Cleaning & Maintenance (100.0%), Law Enforcement (74.6%), and Security & Protection (73.9%), while the most female-oriented occupations are Personal Care & Service (73.9%), Healthcare Support (70.6%), and Food Preparation & Serving (34.0%).
| Occupation | Male | Female |
| Healthcare Support | 60 (29.4%) | 144 (70.6%) |
| Security & Protection | 147 (73.9%) | 52 (26.1%) |
| Firefighting & Prevention | 53 (72.6%) | 20 (27.4%) |
| Law Enforcement | 94 (74.6%) | 32 (25.4%) |
| Food Preparation & Serving | 105 (66.0%) | 54 (34.0%) |
| Cleaning & Maintenance | 199 (100.0%) | 0 (0.0%) |
| Personal Care & Service | 41 (26.1%) | 116 (73.9%) |
| Total (Category) | 552 (60.1%) | 366 (39.9%) |
| Total (Overall) | 6,740 (56.3%) | 5,236 (43.7%) |
Sales and Office Occupations
The most common Sales and Office occupations in Lafayette are Sales & Related (1,286 | 10.7%), and Office & Administration (737 | 6.1%).

Sales and Office Occupations by Sex
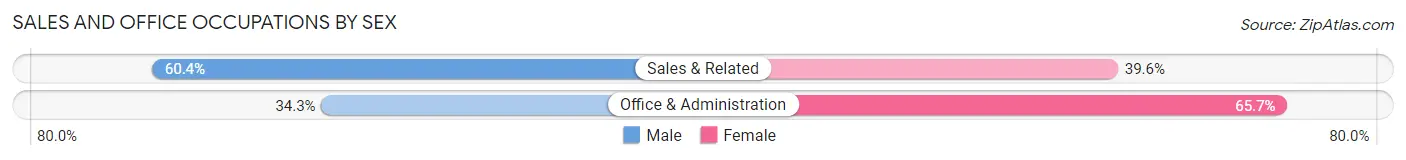
| Occupation | Male | Female |
| Sales & Related | 777 (60.4%) | 509 (39.6%) |
| Office & Administration | 253 (34.3%) | 484 (65.7%) |
| Total (Category) | 1,030 (50.9%) | 993 (49.1%) |
| Total (Overall) | 6,740 (56.3%) | 5,236 (43.7%) |
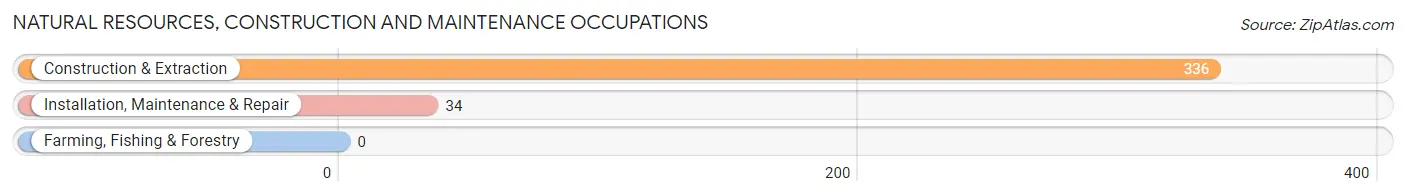
Natural Resources, Construction and Maintenance Occupations
The most common Natural Resources, Construction and Maintenance occupations in Lafayette are Construction & Extraction (336 | 2.8%), and Installation, Maintenance & Repair (34 | 0.3%).
Natural Resources, Construction and Maintenance Occupations by Sex
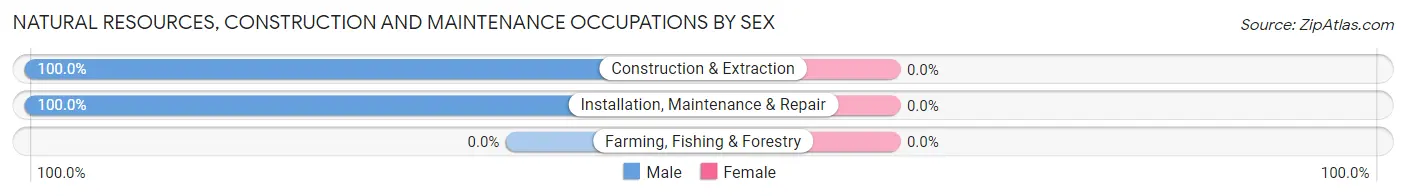
| Occupation | Male | Female |
| Farming, Fishing & Forestry | 0 (0.0%) | 0 (0.0%) |
| Construction & Extraction | 336 (100.0%) | 0 (0.0%) |
| Installation, Maintenance & Repair | 34 (100.0%) | 0 (0.0%) |
| Total (Category) | 370 (100.0%) | 0 (0.0%) |
| Total (Overall) | 6,740 (56.3%) | 5,236 (43.7%) |
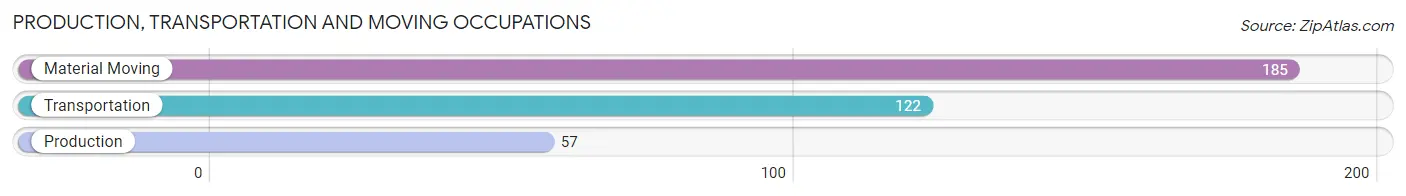
Production, Transportation and Moving Occupations
The most common Production, Transportation and Moving occupations in Lafayette are Material Moving (185 | 1.5%), Transportation (122 | 1.0%), and Production (57 | 0.5%).
Production, Transportation and Moving Occupations by Sex
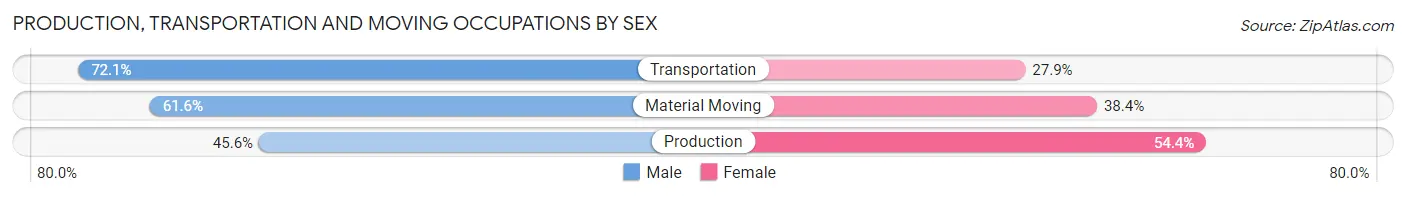
| Occupation | Male | Female |
| Production | 26 (45.6%) | 31 (54.4%) |
| Transportation | 88 (72.1%) | 34 (27.9%) |
| Material Moving | 114 (61.6%) | 71 (38.4%) |
| Total (Category) | 228 (62.6%) | 136 (37.4%) |
| Total (Overall) | 6,740 (56.3%) | 5,236 (43.7%) |
Employment Industries by Sex in Lafayette
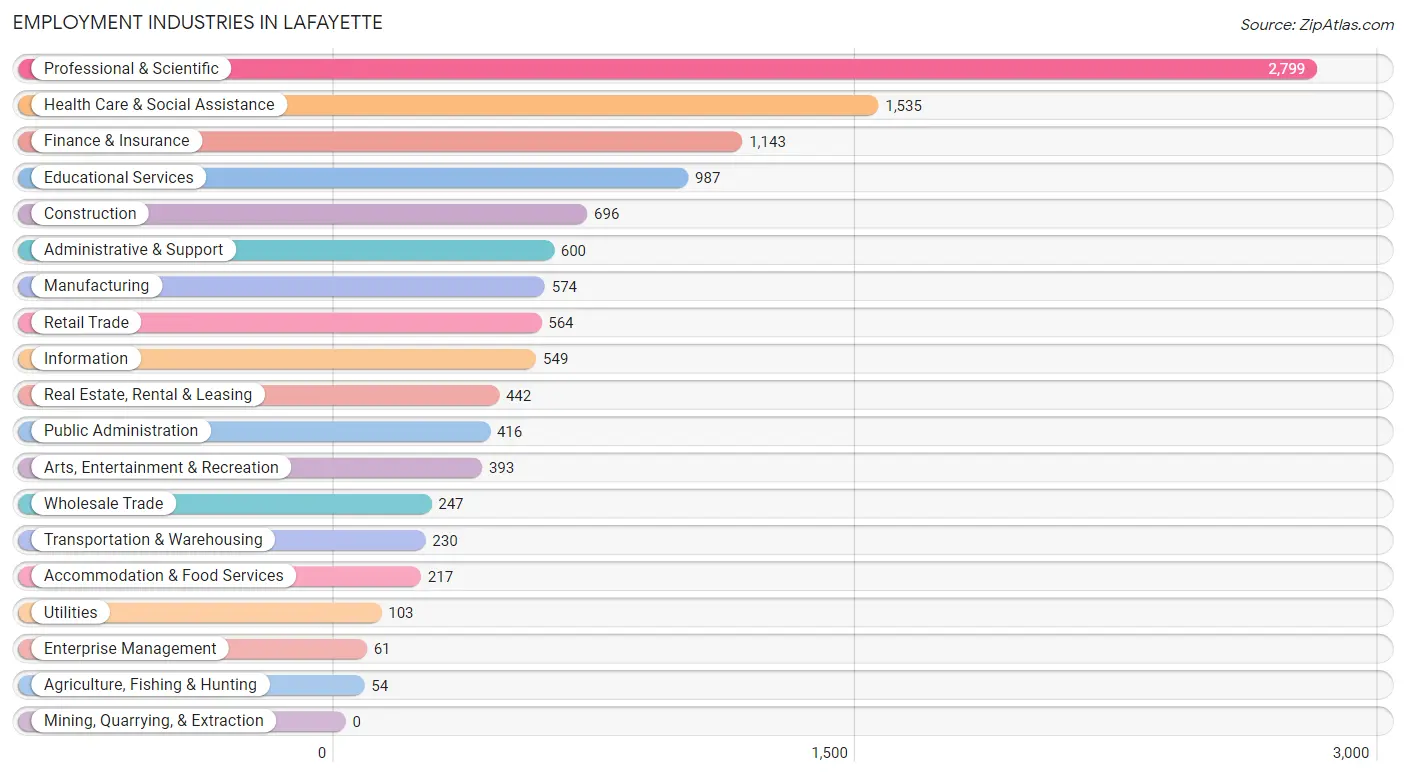
Employment Industries in Lafayette
The major employment industries in Lafayette include Professional & Scientific (2,799 | 23.4%), Health Care & Social Assistance (1,535 | 12.8%), Finance & Insurance (1,143 | 9.5%), Educational Services (987 | 8.2%), and Construction (696 | 5.8%).
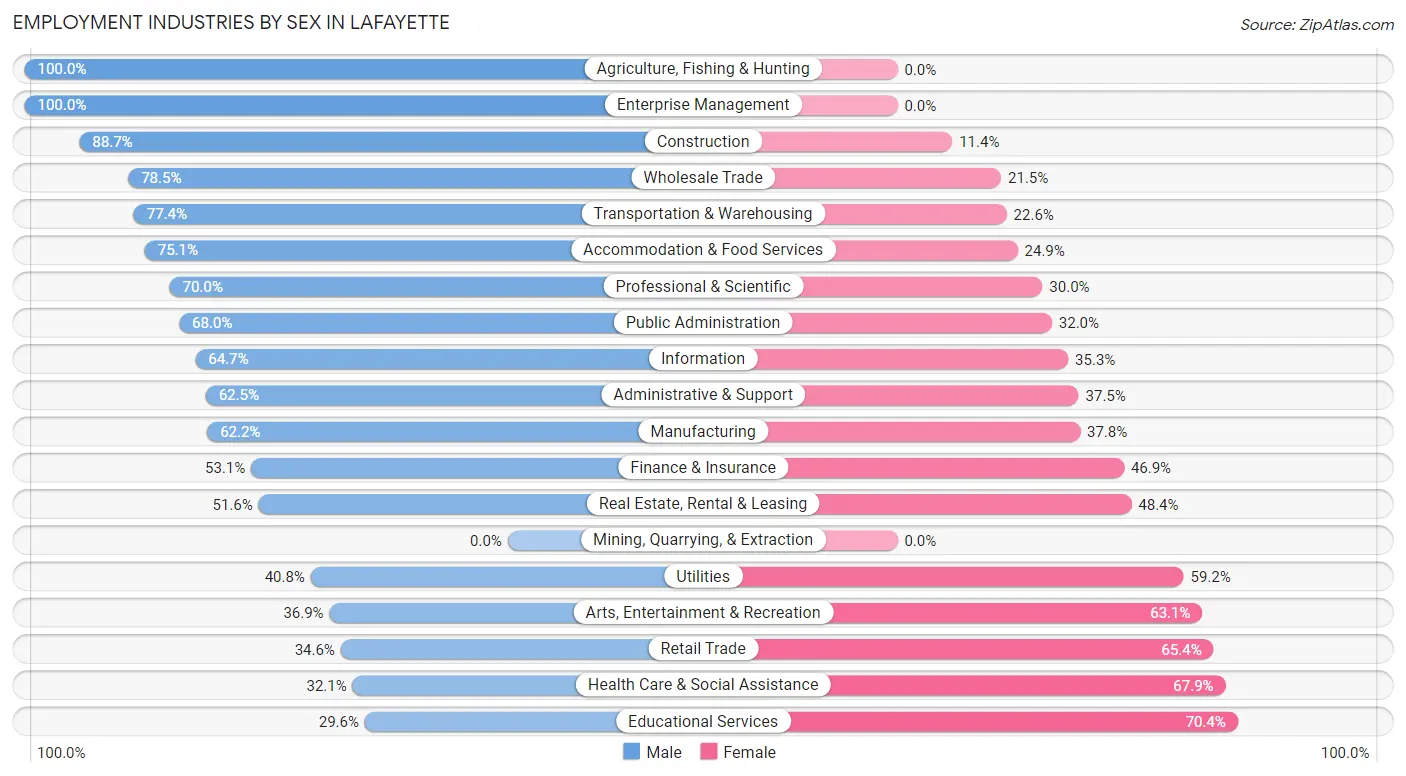
Employment Industries by Sex in Lafayette
The Lafayette industries that see more men than women are Agriculture, Fishing & Hunting (100.0%), Enterprise Management (100.0%), and Construction (88.6%), whereas the industries that tend to have a higher number of women are Educational Services (70.4%), Health Care & Social Assistance (67.9%), and Retail Trade (65.4%).
| Industry | Male | Female |
| Agriculture, Fishing & Hunting | 54 (100.0%) | 0 (0.0%) |
| Mining, Quarrying, & Extraction | 0 (0.0%) | 0 (0.0%) |
| Construction | 617 (88.6%) | 79 (11.4%) |
| Manufacturing | 357 (62.2%) | 217 (37.8%) |
| Wholesale Trade | 194 (78.5%) | 53 (21.5%) |
| Retail Trade | 195 (34.6%) | 369 (65.4%) |
| Transportation & Warehousing | 178 (77.4%) | 52 (22.6%) |
| Utilities | 42 (40.8%) | 61 (59.2%) |
| Information | 355 (64.7%) | 194 (35.3%) |
| Finance & Insurance | 607 (53.1%) | 536 (46.9%) |
| Real Estate, Rental & Leasing | 228 (51.6%) | 214 (48.4%) |
| Professional & Scientific | 1,959 (70.0%) | 840 (30.0%) |
| Enterprise Management | 61 (100.0%) | 0 (0.0%) |
| Administrative & Support | 375 (62.5%) | 225 (37.5%) |
| Educational Services | 292 (29.6%) | 695 (70.4%) |
| Health Care & Social Assistance | 493 (32.1%) | 1,042 (67.9%) |
| Arts, Entertainment & Recreation | 145 (36.9%) | 248 (63.1%) |
| Accommodation & Food Services | 163 (75.1%) | 54 (24.9%) |
| Public Administration | 283 (68.0%) | 133 (32.0%) |
| Total | 6,740 (56.3%) | 5,236 (43.7%) |
Education in Lafayette
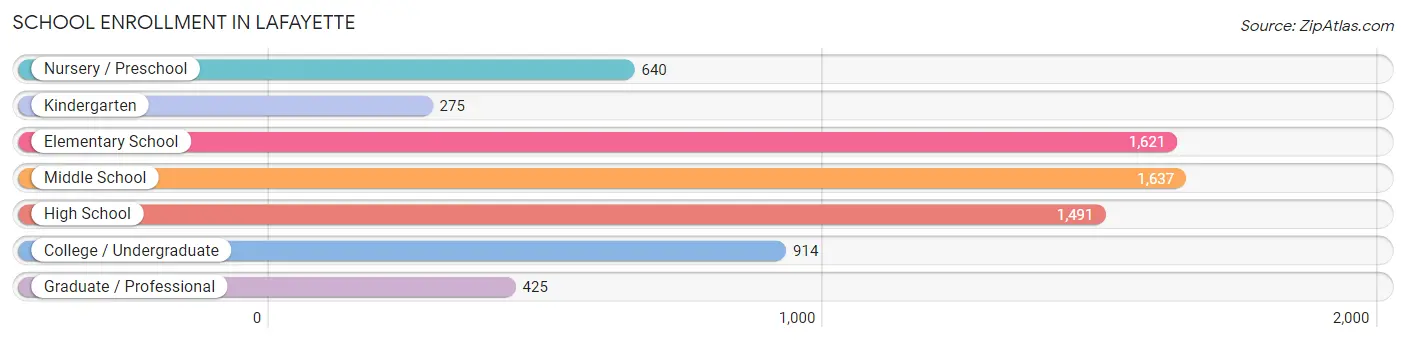
School Enrollment in Lafayette
The most common levels of schooling among the 7,003 students in Lafayette are middle school (1,637 | 23.4%), elementary school (1,621 | 23.2%), and high school (1,491 | 21.3%).
| School Level | # Students | % Students |
| Nursery / Preschool | 640 | 9.1% |
| Kindergarten | 275 | 3.9% |
| Elementary School | 1,621 | 23.2% |
| Middle School | 1,637 | 23.4% |
| High School | 1,491 | 21.3% |
| College / Undergraduate | 914 | 13.1% |
| Graduate / Professional | 425 | 6.1% |
| Total | 7,003 | 100.0% |
School Enrollment by Age by Funding Source in Lafayette
Out of a total of 7,003 students who are enrolled in schools in Lafayette, 1,751 (25.0%) attend a private institution, while the remaining 5,252 (75.0%) are enrolled in public schools. The age group of 3 to 4 year olds has the highest likelihood of being enrolled in private schools, with 380 (72.0% in the age bracket) enrolled. Conversely, the age group of 15 to 17 year olds has the lowest likelihood of being enrolled in a private school, with 1,069 (93.0% in the age bracket) attending a public institution.
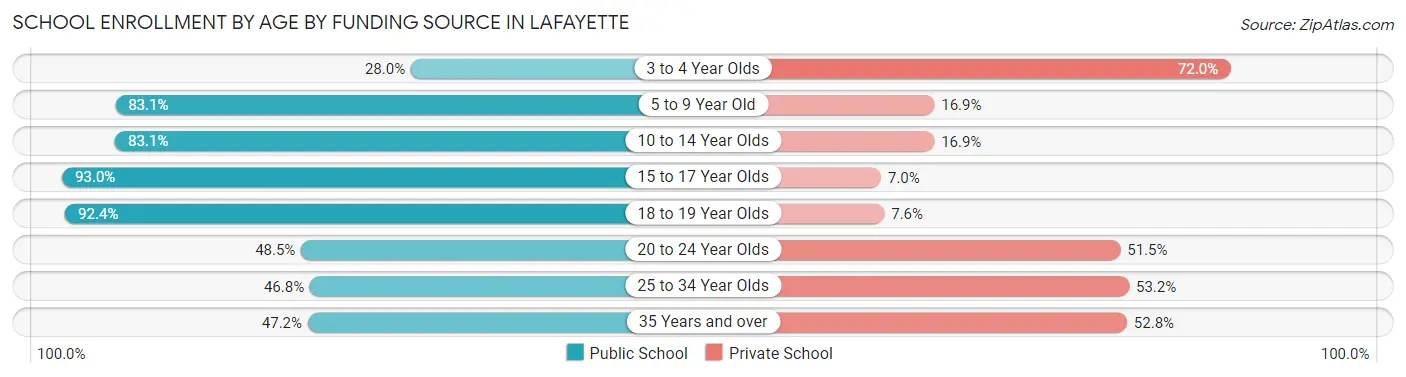
| Age Bracket | Public School | Private School |
| 3 to 4 Year Olds | 148 (28.0%) | 380 (72.0%) |
| 5 to 9 Year Old | 1,581 (83.1%) | 321 (16.9%) |
| 10 to 14 Year Olds | 1,568 (83.1%) | 318 (16.9%) |
| 15 to 17 Year Olds | 1,069 (93.0%) | 80 (7.0%) |
| 18 to 19 Year Olds | 318 (92.4%) | 26 (7.6%) |
| 20 to 24 Year Olds | 302 (48.5%) | 321 (51.5%) |
| 25 to 34 Year Olds | 89 (46.8%) | 101 (53.2%) |
| 35 Years and over | 180 (47.2%) | 201 (52.8%) |
| Total | 5,252 (75.0%) | 1,751 (25.0%) |
Educational Attainment by Field of Study in Lafayette
Social sciences (2,233 | 15.2%), business (2,209 | 15.0%), engineering (1,718 | 11.7%), bio, nature & agricultural (1,504 | 10.2%), and liberal arts & history (994 | 6.8%) are the most common fields of study among 14,689 individuals in Lafayette who have obtained a bachelor's degree or higher.
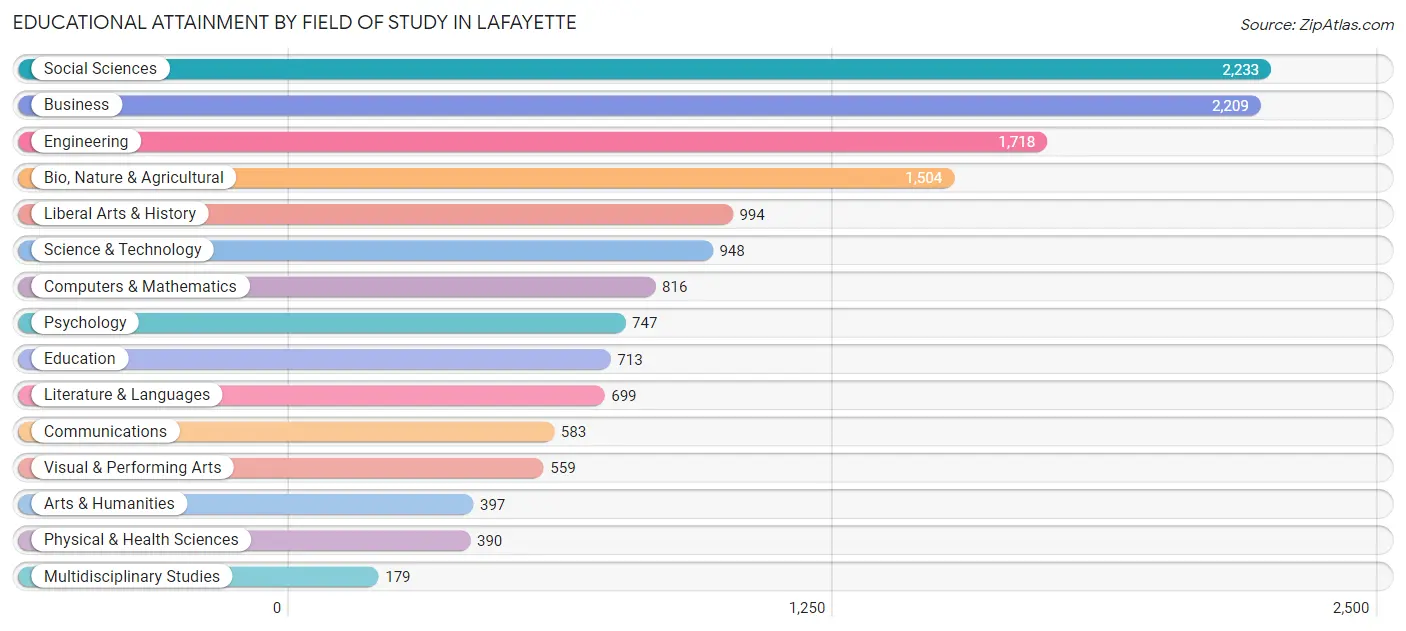
| Field of Study | # Graduates | % Graduates |
| Computers & Mathematics | 816 | 5.6% |
| Bio, Nature & Agricultural | 1,504 | 10.2% |
| Physical & Health Sciences | 390 | 2.7% |
| Psychology | 747 | 5.1% |
| Social Sciences | 2,233 | 15.2% |
| Engineering | 1,718 | 11.7% |
| Multidisciplinary Studies | 179 | 1.2% |
| Science & Technology | 948 | 6.5% |
| Business | 2,209 | 15.0% |
| Education | 713 | 4.9% |
| Literature & Languages | 699 | 4.8% |
| Liberal Arts & History | 994 | 6.8% |
| Visual & Performing Arts | 559 | 3.8% |
| Communications | 583 | 4.0% |
| Arts & Humanities | 397 | 2.7% |
| Total | 14,689 | 100.0% |
Transportation & Commute in Lafayette
Vehicle Availability by Sex in Lafayette
The most prevalent vehicle ownership categories in Lafayette are males with 2 vehicles (2,738, accounting for 41.4%) and females with 2 vehicles (2,164, making up 53.9%).
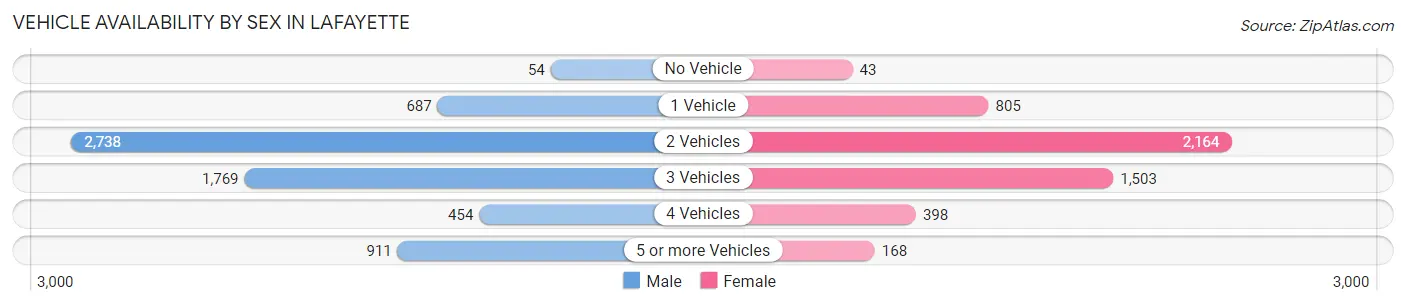
| Vehicles Available | Male | Female |
| No Vehicle | 54 (0.8%) | 43 (0.9%) |
| 1 Vehicle | 687 (10.4%) | 805 (15.8%) |
| 2 Vehicles | 2,738 (41.4%) | 2,164 (42.6%) |
| 3 Vehicles | 1,769 (26.8%) | 1,503 (29.6%) |
| 4 Vehicles | 454 (6.9%) | 398 (7.8%) |
| 5 or more Vehicles | 911 (13.8%) | 168 (3.3%) |
| Total | 6,613 (100.0%) | 5,081 (100.0%) |
Commute Time in Lafayette
The most frequently occuring commute durations in Lafayette are 10 to 14 minutes (1,071 commuters, 14.6%), 20 to 24 minutes (1,000 commuters, 13.7%), and 45 to 59 minutes (822 commuters, 11.2%).
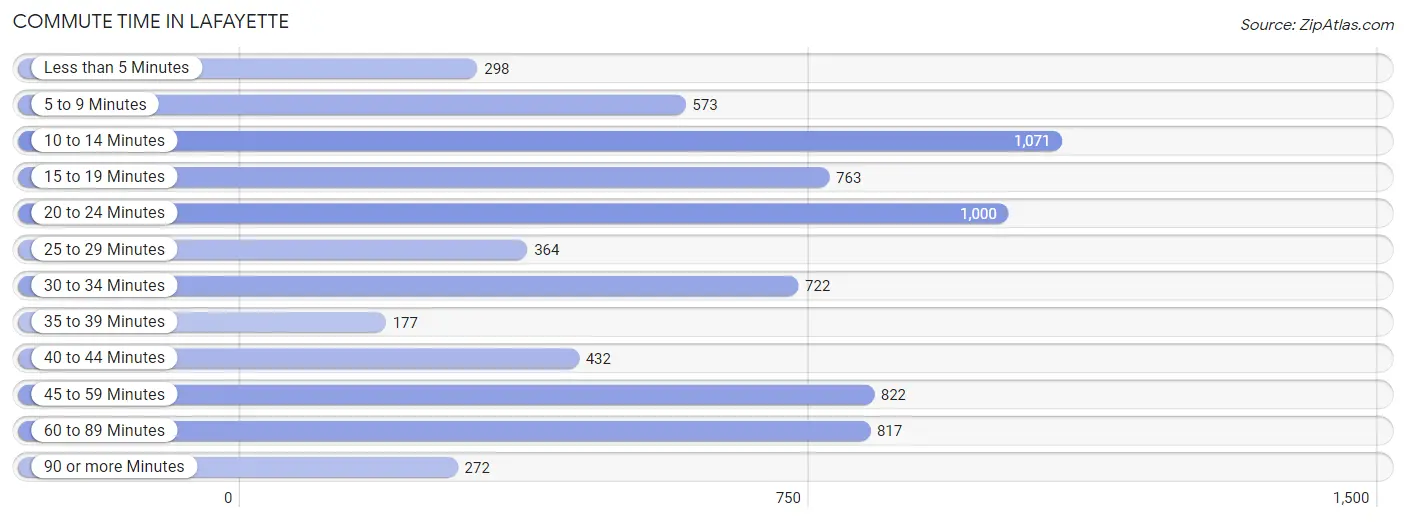
| Commute Time | # Commuters | % Commuters |
| Less than 5 Minutes | 298 | 4.1% |
| 5 to 9 Minutes | 573 | 7.8% |
| 10 to 14 Minutes | 1,071 | 14.6% |
| 15 to 19 Minutes | 763 | 10.4% |
| 20 to 24 Minutes | 1,000 | 13.7% |
| 25 to 29 Minutes | 364 | 5.0% |
| 30 to 34 Minutes | 722 | 9.9% |
| 35 to 39 Minutes | 177 | 2.4% |
| 40 to 44 Minutes | 432 | 5.9% |
| 45 to 59 Minutes | 822 | 11.2% |
| 60 to 89 Minutes | 817 | 11.2% |
| 90 or more Minutes | 272 | 3.7% |
Commute Time by Sex in Lafayette
The most common commute times in Lafayette are 60 to 89 minutes (548 commuters, 13.2%) for males and 10 to 14 minutes (554 commuters, 17.5%) for females.
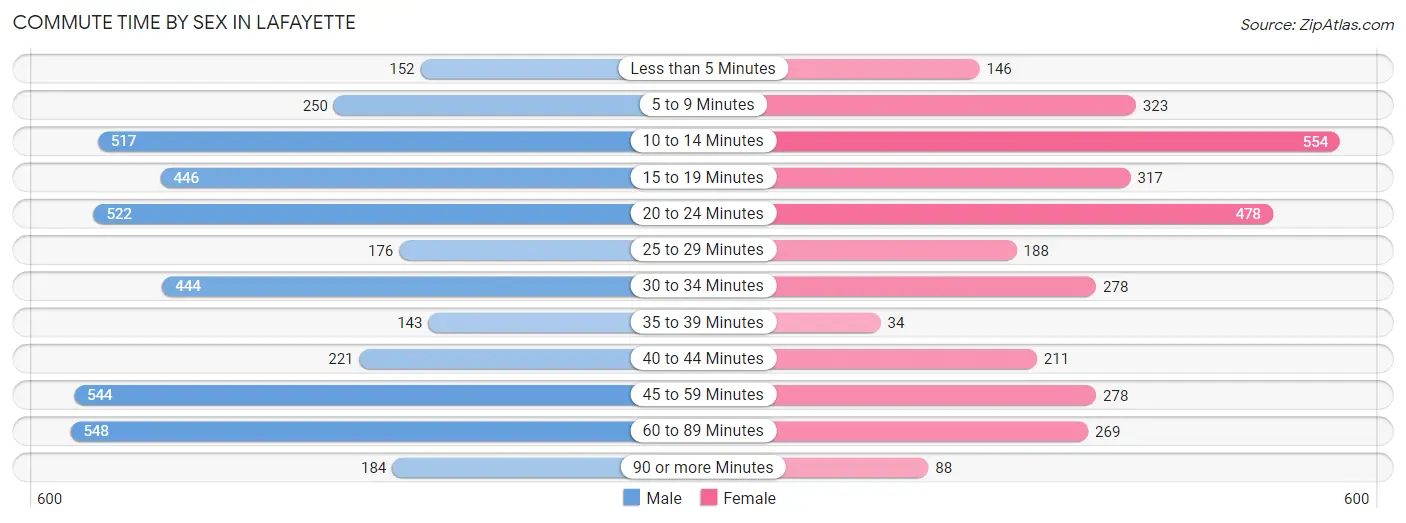
| Commute Time | Male | Female |
| Less than 5 Minutes | 152 (3.7%) | 146 (4.6%) |
| 5 to 9 Minutes | 250 (6.0%) | 323 (10.2%) |
| 10 to 14 Minutes | 517 (12.5%) | 554 (17.5%) |
| 15 to 19 Minutes | 446 (10.7%) | 317 (10.0%) |
| 20 to 24 Minutes | 522 (12.6%) | 478 (15.1%) |
| 25 to 29 Minutes | 176 (4.2%) | 188 (5.9%) |
| 30 to 34 Minutes | 444 (10.7%) | 278 (8.8%) |
| 35 to 39 Minutes | 143 (3.5%) | 34 (1.1%) |
| 40 to 44 Minutes | 221 (5.3%) | 211 (6.7%) |
| 45 to 59 Minutes | 544 (13.1%) | 278 (8.8%) |
| 60 to 89 Minutes | 548 (13.2%) | 269 (8.5%) |
| 90 or more Minutes | 184 (4.4%) | 88 (2.8%) |
Time of Departure to Work by Sex in Lafayette
The most frequent times of departure to work in Lafayette are 7:00 AM to 7:29 AM (825, 19.9%) for males and 7:30 AM to 7:59 AM (747, 23.6%) for females.
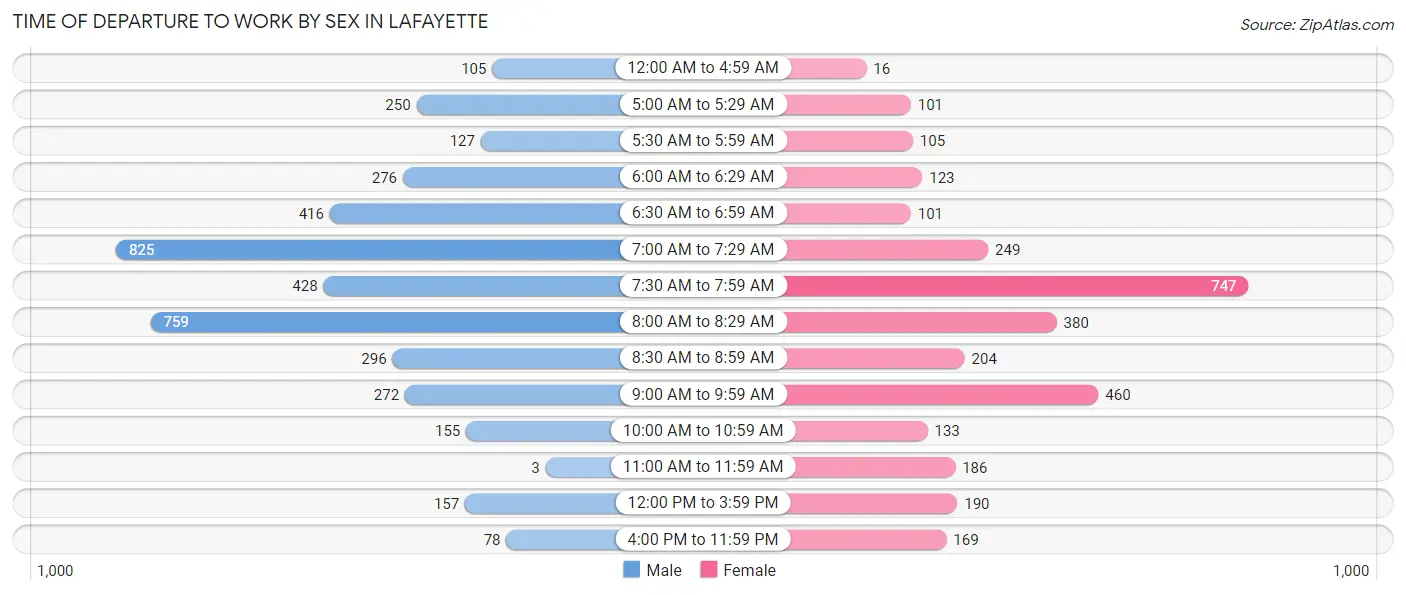
| Time of Departure | Male | Female |
| 12:00 AM to 4:59 AM | 105 (2.5%) | 16 (0.5%) |
| 5:00 AM to 5:29 AM | 250 (6.0%) | 101 (3.2%) |
| 5:30 AM to 5:59 AM | 127 (3.1%) | 105 (3.3%) |
| 6:00 AM to 6:29 AM | 276 (6.7%) | 123 (3.9%) |
| 6:30 AM to 6:59 AM | 416 (10.0%) | 101 (3.2%) |
| 7:00 AM to 7:29 AM | 825 (19.9%) | 249 (7.9%) |
| 7:30 AM to 7:59 AM | 428 (10.3%) | 747 (23.6%) |
| 8:00 AM to 8:29 AM | 759 (18.3%) | 380 (12.0%) |
| 8:30 AM to 8:59 AM | 296 (7.1%) | 204 (6.5%) |
| 9:00 AM to 9:59 AM | 272 (6.6%) | 460 (14.5%) |
| 10:00 AM to 10:59 AM | 155 (3.7%) | 133 (4.2%) |
| 11:00 AM to 11:59 AM | 3 (0.1%) | 186 (5.9%) |
| 12:00 PM to 3:59 PM | 157 (3.8%) | 190 (6.0%) |
| 4:00 PM to 11:59 PM | 78 (1.9%) | 169 (5.3%) |
| Total | 4,147 (100.0%) | 3,164 (100.0%) |
Housing Occupancy in Lafayette
Occupancy by Ownership in Lafayette
Of the total 9,014 dwellings in Lafayette, owner-occupied units account for 6,631 (73.6%), while renter-occupied units make up 2,383 (26.4%).
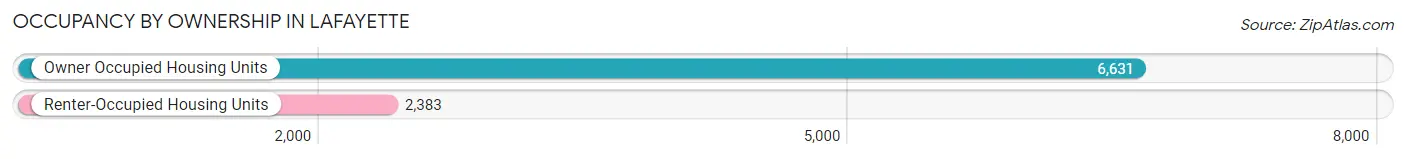
| Occupancy | # Housing Units | % Housing Units |
| Owner Occupied Housing Units | 6,631 | 73.6% |
| Renter-Occupied Housing Units | 2,383 | 26.4% |
| Total Occupied Housing Units | 9,014 | 100.0% |
Occupancy by Household Size in Lafayette
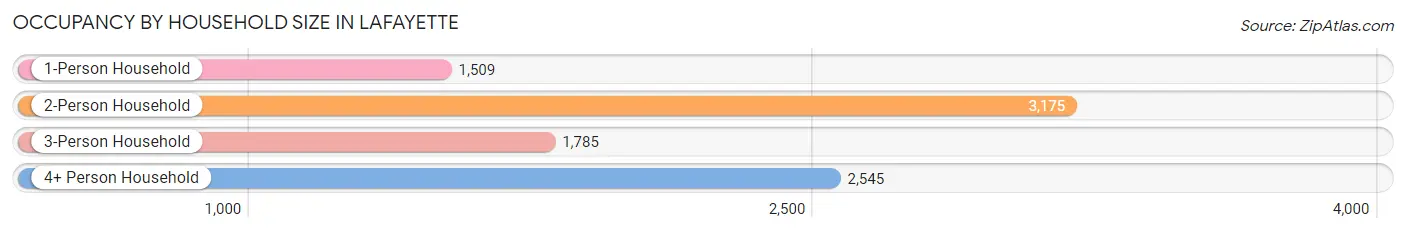
| Household Size | # Housing Units | % Housing Units |
| 1-Person Household | 1,509 | 16.7% |
| 2-Person Household | 3,175 | 35.2% |
| 3-Person Household | 1,785 | 19.8% |
| 4+ Person Household | 2,545 | 28.2% |
| Total Housing Units | 9,014 | 100.0% |
Occupancy by Ownership by Household Size in Lafayette
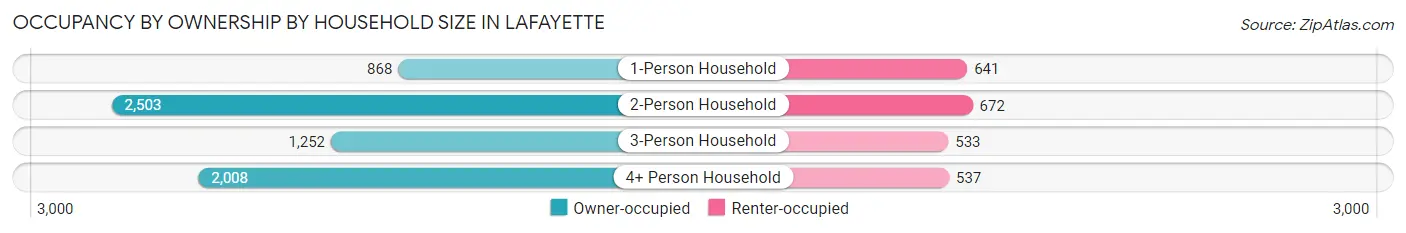
| Household Size | Owner-occupied | Renter-occupied |
| 1-Person Household | 868 (57.5%) | 641 (42.5%) |
| 2-Person Household | 2,503 (78.8%) | 672 (21.2%) |
| 3-Person Household | 1,252 (70.1%) | 533 (29.9%) |
| 4+ Person Household | 2,008 (78.9%) | 537 (21.1%) |
| Total Housing Units | 6,631 (73.6%) | 2,383 (26.4%) |
Occupancy by Educational Attainment in Lafayette
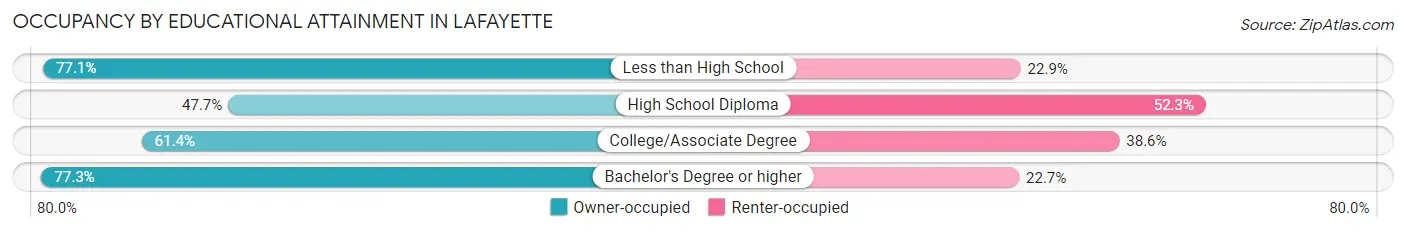
| Household Size | Owner-occupied | Renter-occupied |
| Less than High School | 37 (77.1%) | 11 (22.9%) |
| High School Diploma | 188 (47.7%) | 206 (52.3%) |
| College/Associate Degree | 860 (61.4%) | 540 (38.6%) |
| Bachelor's Degree or higher | 5,546 (77.3%) | 1,626 (22.7%) |
Occupancy by Age of Householder in Lafayette
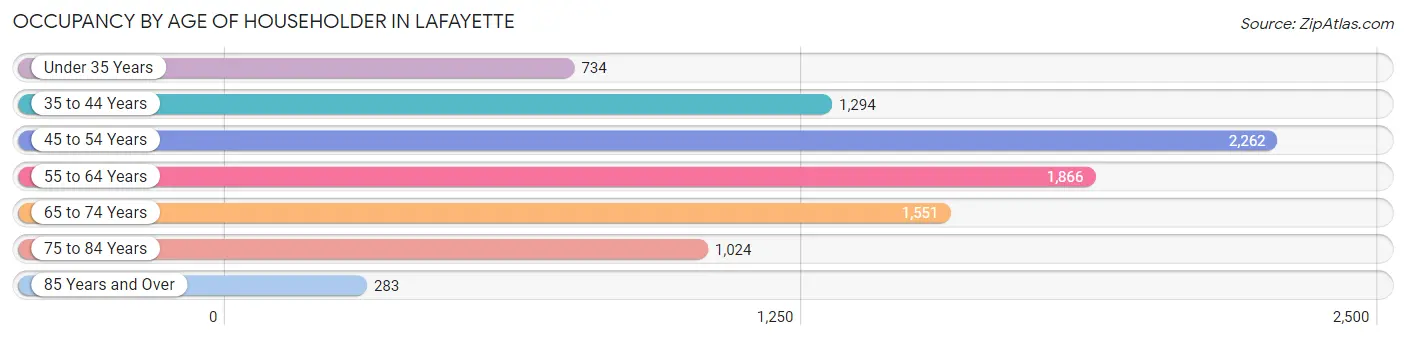
| Age Bracket | # Households | % Households |
| Under 35 Years | 734 | 8.1% |
| 35 to 44 Years | 1,294 | 14.4% |
| 45 to 54 Years | 2,262 | 25.1% |
| 55 to 64 Years | 1,866 | 20.7% |
| 65 to 74 Years | 1,551 | 17.2% |
| 75 to 84 Years | 1,024 | 11.4% |
| 85 Years and Over | 283 | 3.1% |
| Total | 9,014 | 100.0% |
Housing Finances in Lafayette
Median Income by Occupancy in Lafayette
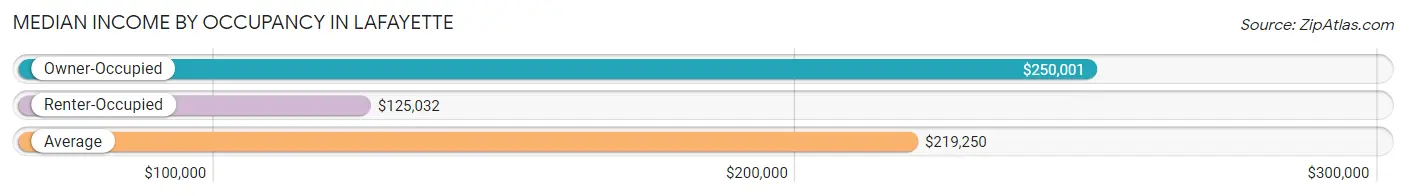
| Occupancy Type | # Households | Median Income |
| Owner-Occupied | 6,631 (73.6%) | $250,001 |
| Renter-Occupied | 2,383 (26.4%) | $125,032 |
| Average | 9,014 (100.0%) | $219,250 |
Occupancy by Householder Income Bracket in Lafayette
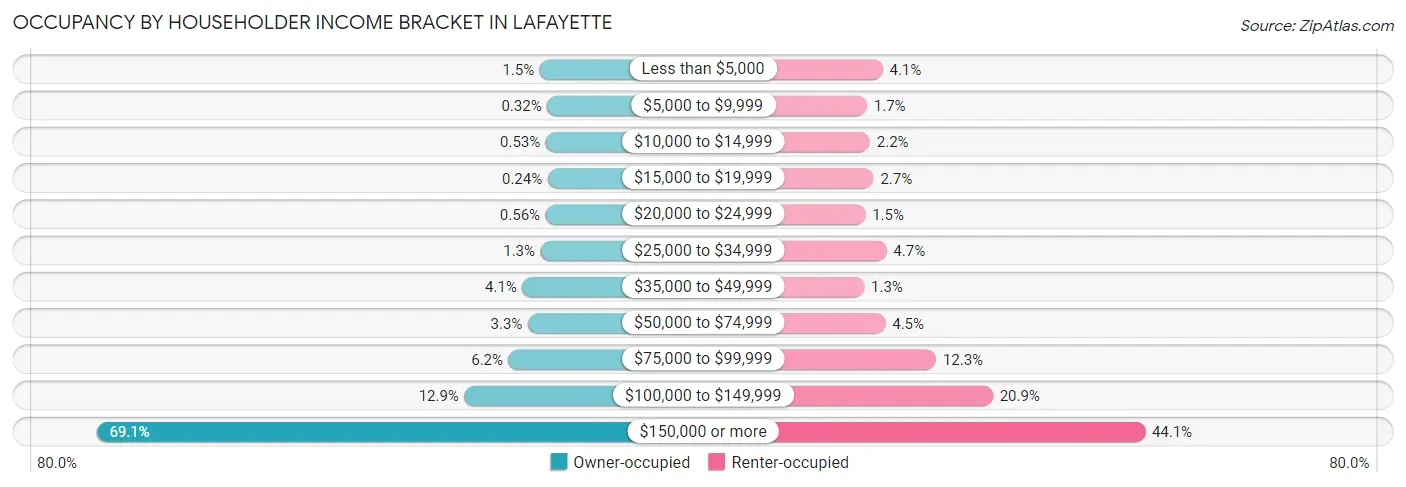
| Income Bracket | Owner-occupied | Renter-occupied |
| Less than $5,000 | 96 (1.5%) | 98 (4.1%) |
| $5,000 to $9,999 | 21 (0.3%) | 41 (1.7%) |
| $10,000 to $14,999 | 35 (0.5%) | 52 (2.2%) |
| $15,000 to $19,999 | 16 (0.2%) | 65 (2.7%) |
| $20,000 to $24,999 | 37 (0.6%) | 35 (1.5%) |
| $25,000 to $34,999 | 88 (1.3%) | 112 (4.7%) |
| $35,000 to $49,999 | 272 (4.1%) | 31 (1.3%) |
| $50,000 to $74,999 | 217 (3.3%) | 108 (4.5%) |
| $75,000 to $99,999 | 412 (6.2%) | 292 (12.2%) |
| $100,000 to $149,999 | 858 (12.9%) | 498 (20.9%) |
| $150,000 or more | 4,579 (69.1%) | 1,051 (44.1%) |
| Total | 6,631 (100.0%) | 2,383 (100.0%) |
Monthly Housing Cost Tiers in Lafayette
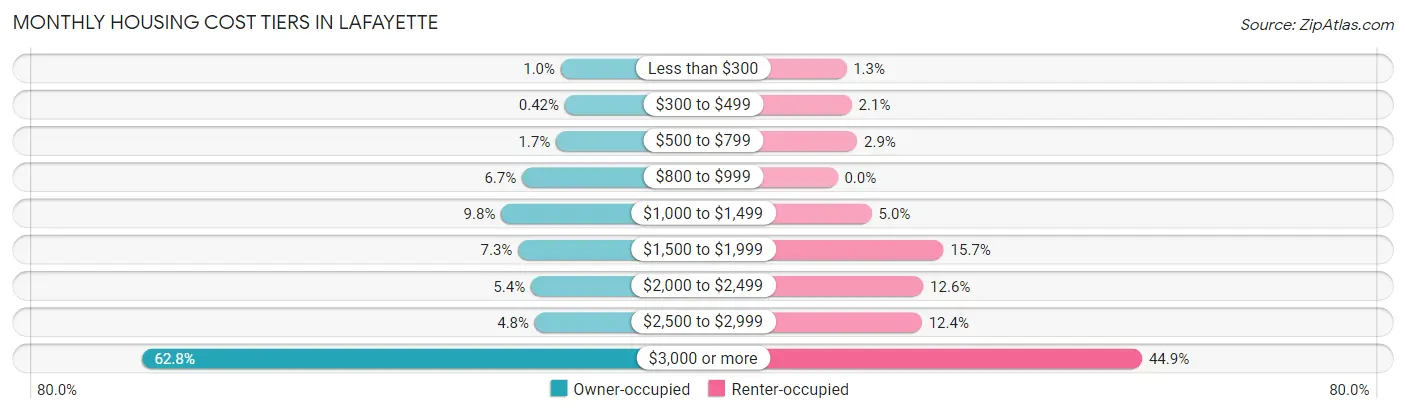
| Monthly Cost | Owner-occupied | Renter-occupied |
| Less than $300 | 67 (1.0%) | 31 (1.3%) |
| $300 to $499 | 28 (0.4%) | 50 (2.1%) |
| $500 to $799 | 114 (1.7%) | 69 (2.9%) |
| $800 to $999 | 446 (6.7%) | 0 (0.0%) |
| $1,000 to $1,499 | 649 (9.8%) | 120 (5.0%) |
| $1,500 to $1,999 | 484 (7.3%) | 373 (15.7%) |
| $2,000 to $2,499 | 359 (5.4%) | 301 (12.6%) |
| $2,500 to $2,999 | 321 (4.8%) | 296 (12.4%) |
| $3,000 or more | 4,163 (62.8%) | 1,069 (44.9%) |
| Total | 6,631 (100.0%) | 2,383 (100.0%) |
Physical Housing Characteristics in Lafayette
Housing Structures in Lafayette
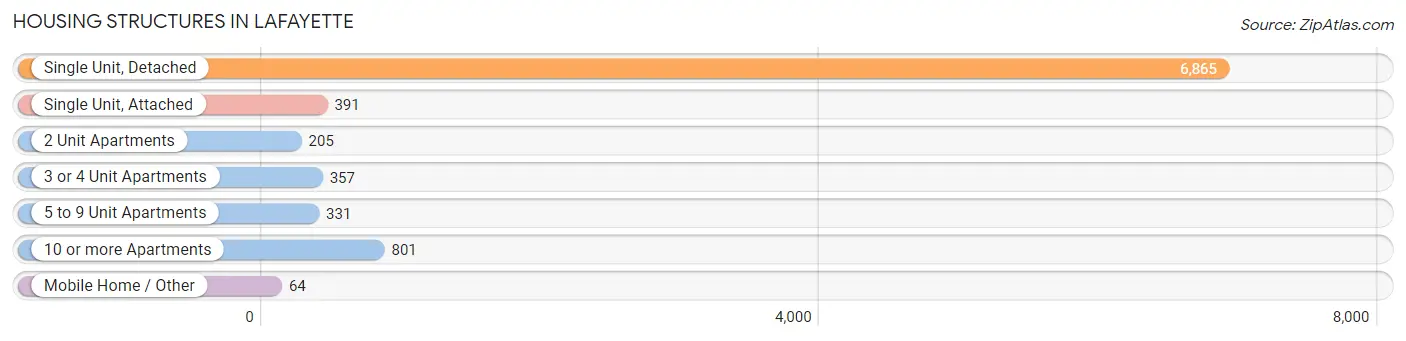
| Structure Type | # Housing Units | % Housing Units |
| Single Unit, Detached | 6,865 | 76.2% |
| Single Unit, Attached | 391 | 4.3% |
| 2 Unit Apartments | 205 | 2.3% |
| 3 or 4 Unit Apartments | 357 | 4.0% |
| 5 to 9 Unit Apartments | 331 | 3.7% |
| 10 or more Apartments | 801 | 8.9% |
| Mobile Home / Other | 64 | 0.7% |
| Total | 9,014 | 100.0% |
Housing Structures by Occupancy in Lafayette
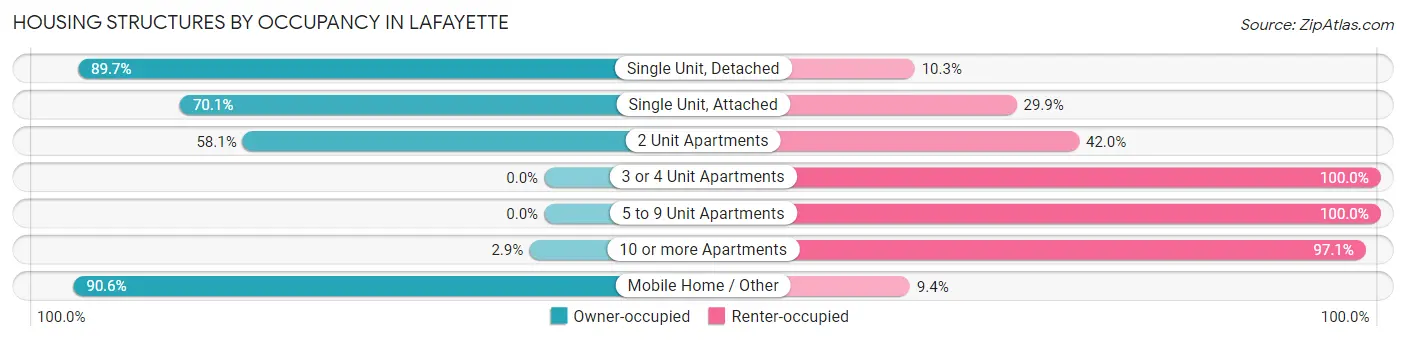
| Structure Type | Owner-occupied | Renter-occupied |
| Single Unit, Detached | 6,157 (89.7%) | 708 (10.3%) |
| Single Unit, Attached | 274 (70.1%) | 117 (29.9%) |
| 2 Unit Apartments | 119 (58.1%) | 86 (41.9%) |
| 3 or 4 Unit Apartments | 0 (0.0%) | 357 (100.0%) |
| 5 to 9 Unit Apartments | 0 (0.0%) | 331 (100.0%) |
| 10 or more Apartments | 23 (2.9%) | 778 (97.1%) |
| Mobile Home / Other | 58 (90.6%) | 6 (9.4%) |
| Total | 6,631 (73.6%) | 2,383 (26.4%) |
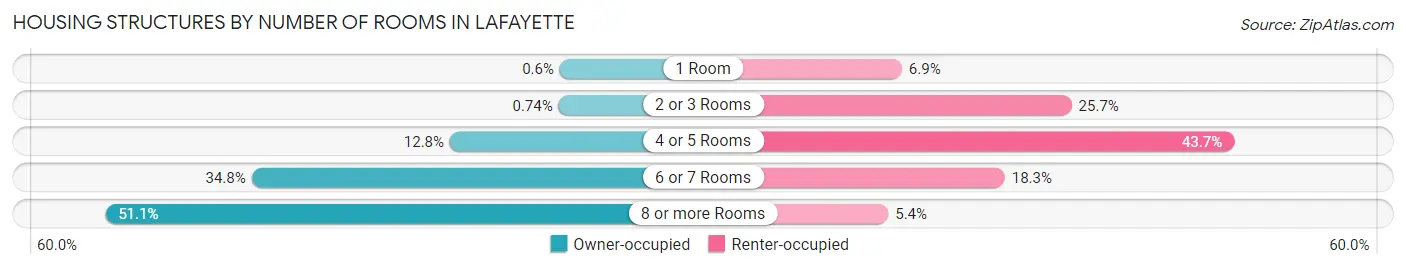
Housing Structures by Number of Rooms in Lafayette
| Number of Rooms | Owner-occupied | Renter-occupied |
| 1 Room | 40 (0.6%) | 164 (6.9%) |
| 2 or 3 Rooms | 49 (0.7%) | 613 (25.7%) |
| 4 or 5 Rooms | 849 (12.8%) | 1,042 (43.7%) |
| 6 or 7 Rooms | 2,308 (34.8%) | 436 (18.3%) |
| 8 or more Rooms | 3,385 (51.0%) | 128 (5.4%) |
| Total | 6,631 (100.0%) | 2,383 (100.0%) |
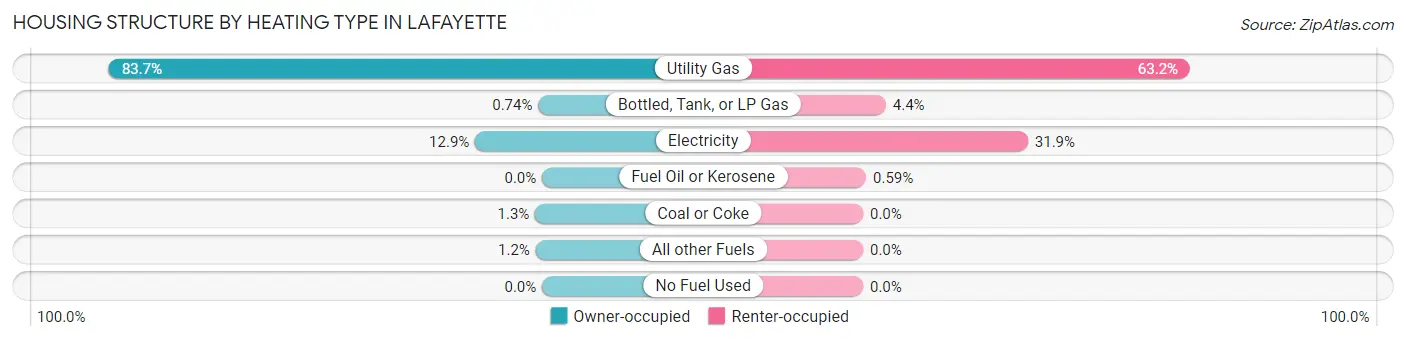
Housing Structure by Heating Type in Lafayette
| Heating Type | Owner-occupied | Renter-occupied |
| Utility Gas | 5,553 (83.7%) | 1,505 (63.2%) |
| Bottled, Tank, or LP Gas | 49 (0.7%) | 105 (4.4%) |
| Electricity | 858 (12.9%) | 759 (31.9%) |
| Fuel Oil or Kerosene | 0 (0.0%) | 14 (0.6%) |
| Coal or Coke | 89 (1.3%) | 0 (0.0%) |
| All other Fuels | 82 (1.2%) | 0 (0.0%) |
| No Fuel Used | 0 (0.0%) | 0 (0.0%) |
| Total | 6,631 (100.0%) | 2,383 (100.0%) |
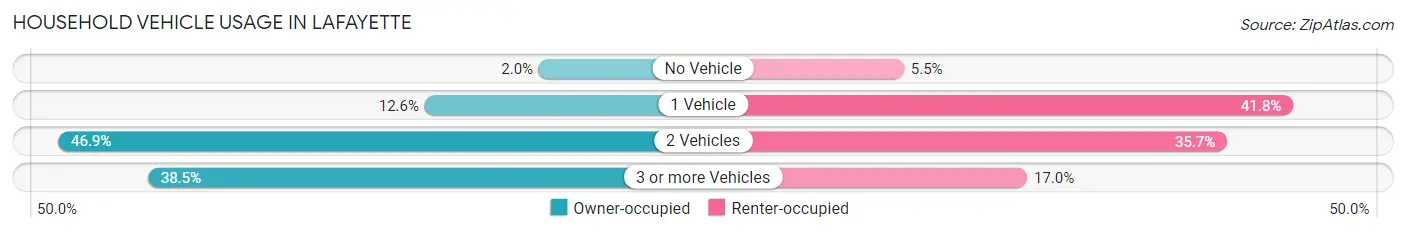
Household Vehicle Usage in Lafayette
| Vehicles per Household | Owner-occupied | Renter-occupied |
| No Vehicle | 132 (2.0%) | 131 (5.5%) |
| 1 Vehicle | 838 (12.6%) | 997 (41.8%) |
| 2 Vehicles | 3,108 (46.9%) | 850 (35.7%) |
| 3 or more Vehicles | 2,553 (38.5%) | 405 (17.0%) |
| Total | 6,631 (100.0%) | 2,383 (100.0%) |
Real Estate & Mortgages in Lafayette
Real Estate and Mortgage Overview in Lafayette
| Characteristic | Without Mortgage | With Mortgage |
| Housing Units | 1,793 | 4,838 |
| Median Property Value | $1,856,500 | $1,930,800 |
| Median Household Income | $181,563 | $3,582 |
| Monthly Housing Costs | $1,284 | $4,085 |
| Real Estate Taxes | $8,297 | $8 |
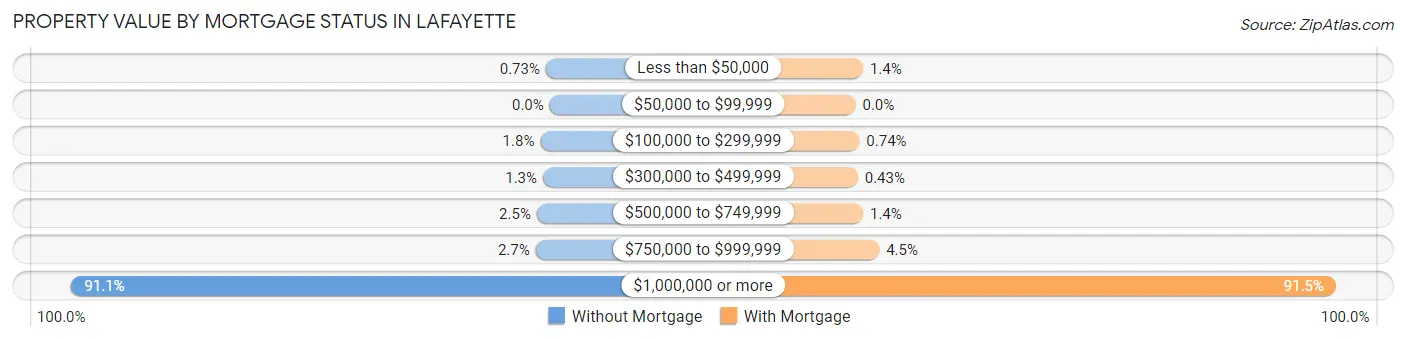
Property Value by Mortgage Status in Lafayette
| Property Value | Without Mortgage | With Mortgage |
| Less than $50,000 | 13 (0.7%) | 68 (1.4%) |
| $50,000 to $99,999 | 0 (0.0%) | 0 (0.0%) |
| $100,000 to $299,999 | 32 (1.8%) | 36 (0.7%) |
| $300,000 to $499,999 | 23 (1.3%) | 21 (0.4%) |
| $500,000 to $749,999 | 44 (2.5%) | 69 (1.4%) |
| $750,000 to $999,999 | 48 (2.7%) | 218 (4.5%) |
| $1,000,000 or more | 1,633 (91.1%) | 4,426 (91.5%) |
| Total | 1,793 (100.0%) | 4,838 (100.0%) |
Household Income by Mortgage Status in Lafayette
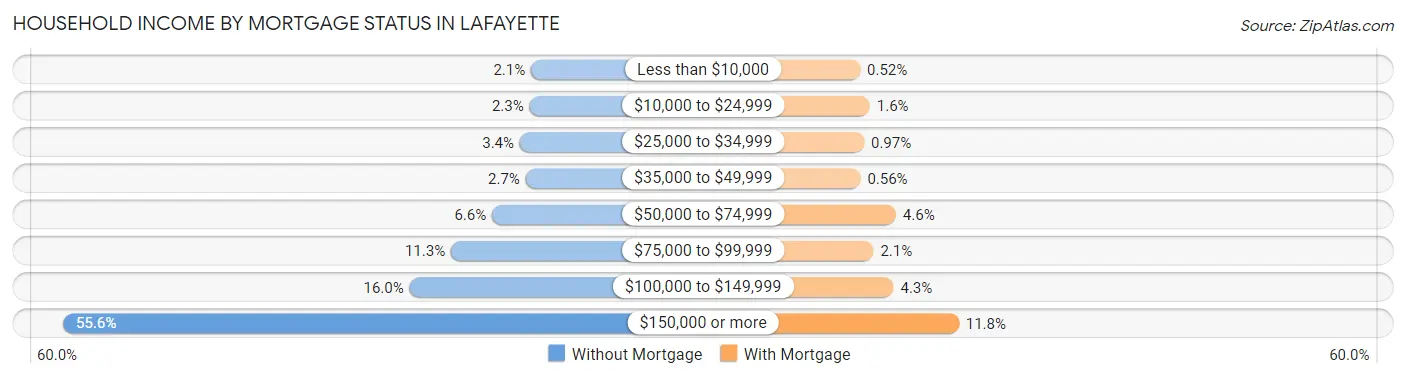
| Household Income | Without Mortgage | With Mortgage |
| Less than $10,000 | 38 (2.1%) | 25 (0.5%) |
| $10,000 to $24,999 | 41 (2.3%) | 79 (1.6%) |
| $25,000 to $34,999 | 61 (3.4%) | 47 (1.0%) |
| $35,000 to $49,999 | 49 (2.7%) | 27 (0.6%) |
| $50,000 to $74,999 | 118 (6.6%) | 223 (4.6%) |
| $75,000 to $99,999 | 202 (11.3%) | 99 (2.1%) |
| $100,000 to $149,999 | 287 (16.0%) | 210 (4.3%) |
| $150,000 or more | 997 (55.6%) | 571 (11.8%) |
| Total | 1,793 (100.0%) | 4,838 (100.0%) |
Property Value to Household Income Ratio in Lafayette
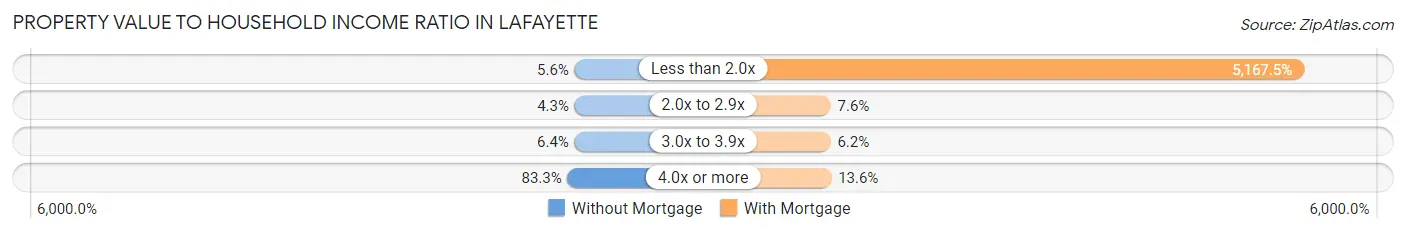
| Value-to-Income Ratio | Without Mortgage | With Mortgage |
| Less than 2.0x | 100 (5.6%) | 250,001 (5,167.5%) |
| 2.0x to 2.9x | 77 (4.3%) | 368 (7.6%) |
| 3.0x to 3.9x | 114 (6.4%) | 298 (6.2%) |
| 4.0x or more | 1,493 (83.3%) | 660 (13.6%) |
| Total | 1,793 (100.0%) | 4,838 (100.0%) |
Real Estate Taxes by Mortgage Status in Lafayette
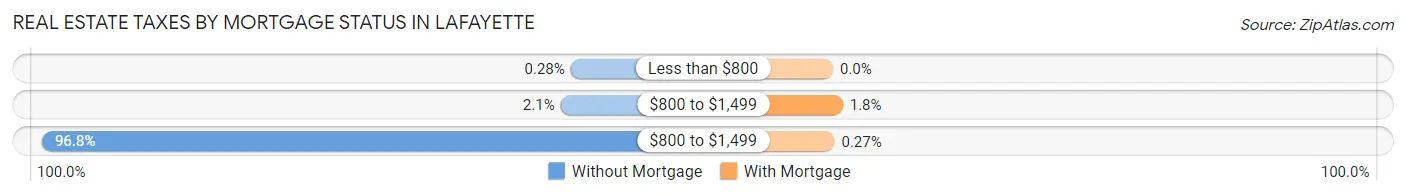
| Property Taxes | Without Mortgage | With Mortgage |
| Less than $800 | 5 (0.3%) | 0 (0.0%) |
| $800 to $1,499 | 38 (2.1%) | 86 (1.8%) |
| $800 to $1,499 | 1,736 (96.8%) | 13 (0.3%) |
| Total | 1,793 (100.0%) | 4,838 (100.0%) |
Health & Disability in Lafayette
Health Insurance Coverage by Age in Lafayette
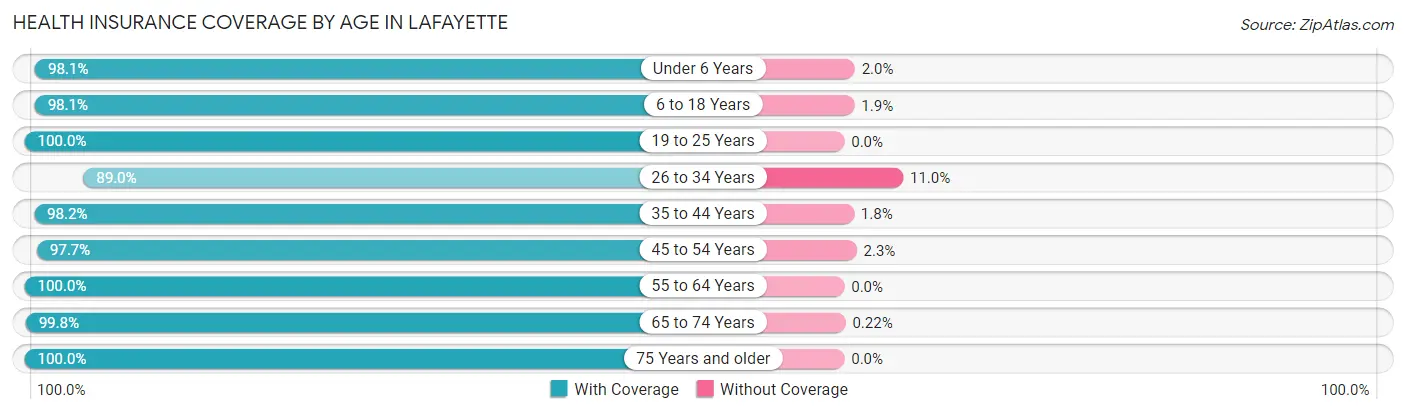
| Age Bracket | With Coverage | Without Coverage |
| Under 6 Years | 1,358 (98.1%) | 27 (1.9%) |
| 6 to 18 Years | 4,891 (98.1%) | 94 (1.9%) |
| 19 to 25 Years | 1,296 (100.0%) | 0 (0.0%) |
| 26 to 34 Years | 1,560 (89.0%) | 192 (11.0%) |
| 35 to 44 Years | 3,024 (98.2%) | 55 (1.8%) |
| 45 to 54 Years | 4,180 (97.7%) | 98 (2.3%) |
| 55 to 64 Years | 3,627 (100.0%) | 0 (0.0%) |
| 65 to 74 Years | 2,678 (99.8%) | 6 (0.2%) |
| 75 Years and older | 2,165 (100.0%) | 0 (0.0%) |
| Total | 24,779 (98.1%) | 472 (1.9%) |
Health Insurance Coverage by Citizenship Status in Lafayette
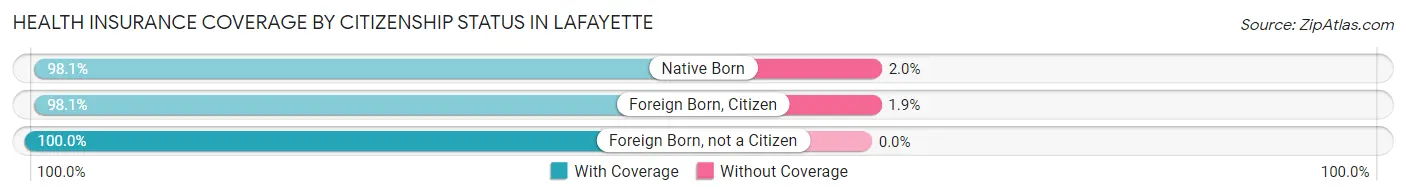
| Citizenship Status | With Coverage | Without Coverage |
| Native Born | 1,358 (98.1%) | 27 (1.9%) |
| Foreign Born, Citizen | 4,891 (98.1%) | 94 (1.9%) |
| Foreign Born, not a Citizen | 1,296 (100.0%) | 0 (0.0%) |
Health Insurance Coverage by Household Income in Lafayette
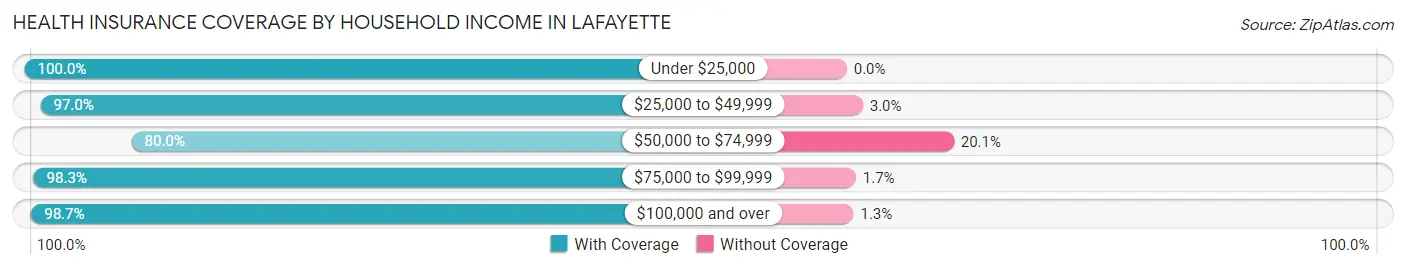
| Household Income | With Coverage | Without Coverage |
| Under $25,000 | 791 (100.0%) | 0 (0.0%) |
| $25,000 to $49,999 | 875 (97.0%) | 27 (3.0%) |
| $50,000 to $74,999 | 602 (79.9%) | 151 (20.1%) |
| $75,000 to $99,999 | 1,442 (98.3%) | 25 (1.7%) |
| $100,000 and over | 21,008 (98.7%) | 269 (1.3%) |
Public vs Private Health Insurance Coverage by Age in Lafayette
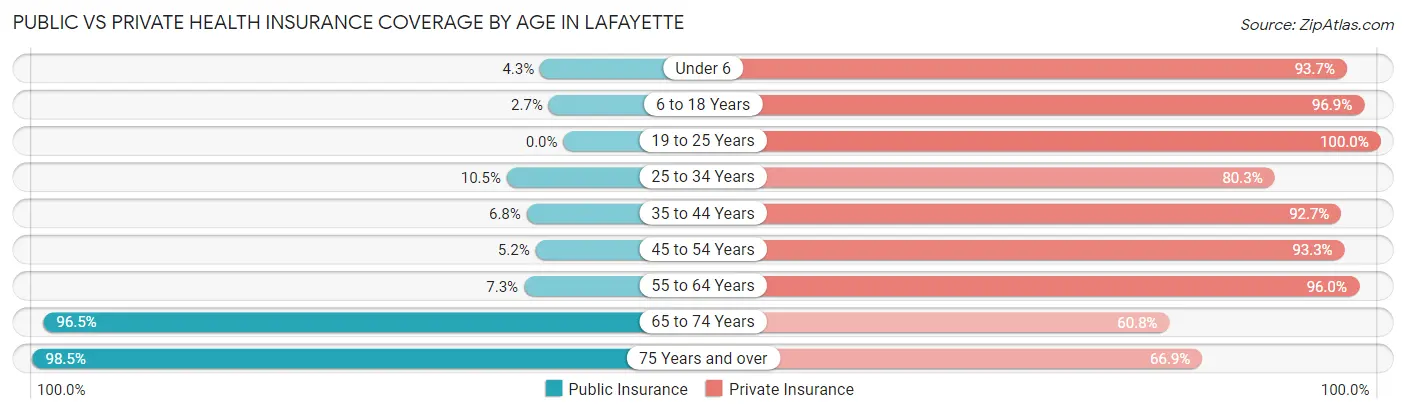
| Age Bracket | Public Insurance | Private Insurance |
| Under 6 | 60 (4.3%) | 1,298 (93.7%) |
| 6 to 18 Years | 135 (2.7%) | 4,832 (96.9%) |
| 19 to 25 Years | 0 (0.0%) | 1,296 (100.0%) |
| 25 to 34 Years | 184 (10.5%) | 1,407 (80.3%) |
| 35 to 44 Years | 210 (6.8%) | 2,854 (92.7%) |
| 45 to 54 Years | 221 (5.2%) | 3,991 (93.3%) |
| 55 to 64 Years | 265 (7.3%) | 3,480 (96.0%) |
| 65 to 74 Years | 2,590 (96.5%) | 1,632 (60.8%) |
| 75 Years and over | 2,133 (98.5%) | 1,448 (66.9%) |
| Total | 5,798 (23.0%) | 22,238 (88.1%) |
Disability Status by Sex by Age in Lafayette
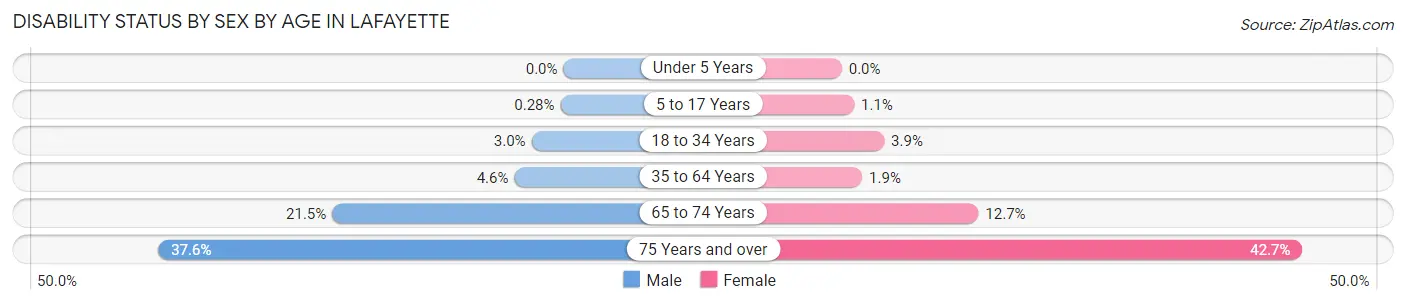
| Age Bracket | Male | Female |
| Under 5 Years | 0 (0.0%) | 0 (0.0%) |
| 5 to 17 Years | 7 (0.3%) | 28 (1.1%) |
| 18 to 34 Years | 50 (3.0%) | 63 (3.9%) |
| 35 to 64 Years | 269 (4.5%) | 96 (1.9%) |
| 65 to 74 Years | 241 (21.5%) | 198 (12.7%) |
| 75 Years and over | 413 (37.6%) | 456 (42.7%) |
Disability Class by Sex by Age in Lafayette
Disability Class: Hearing Difficulty
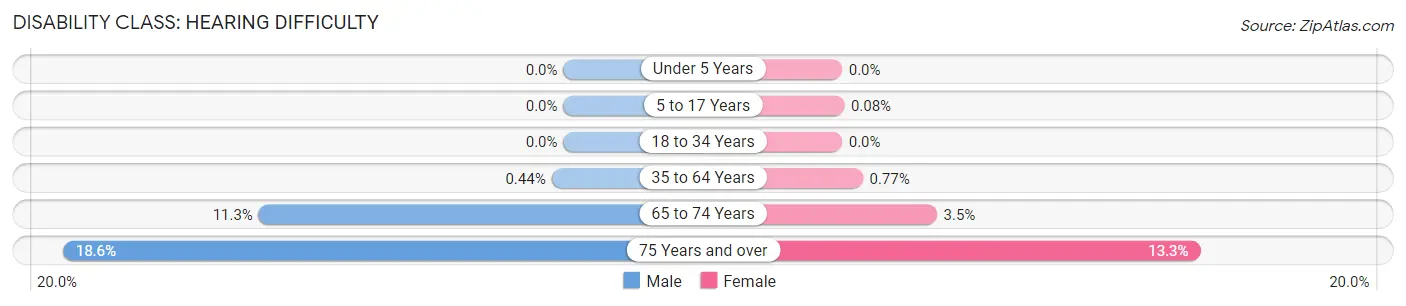
| Age Bracket | Male | Female |
| Under 5 Years | 0 (0.0%) | 0 (0.0%) |
| 5 to 17 Years | 0 (0.0%) | 2 (0.1%) |
| 18 to 34 Years | 0 (0.0%) | 0 (0.0%) |
| 35 to 64 Years | 26 (0.4%) | 39 (0.8%) |
| 65 to 74 Years | 127 (11.3%) | 55 (3.5%) |
| 75 Years and over | 204 (18.6%) | 142 (13.3%) |
Disability Class: Vision Difficulty
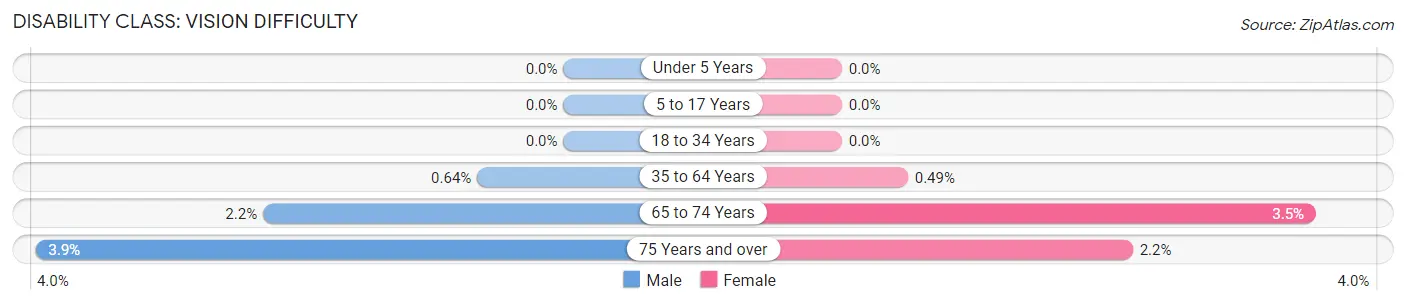
| Age Bracket | Male | Female |
| Under 5 Years | 0 (0.0%) | 0 (0.0%) |
| 5 to 17 Years | 0 (0.0%) | 0 (0.0%) |
| 18 to 34 Years | 0 (0.0%) | 0 (0.0%) |
| 35 to 64 Years | 38 (0.6%) | 25 (0.5%) |
| 65 to 74 Years | 25 (2.2%) | 55 (3.5%) |
| 75 Years and over | 43 (3.9%) | 23 (2.2%) |
Disability Class: Cognitive Difficulty
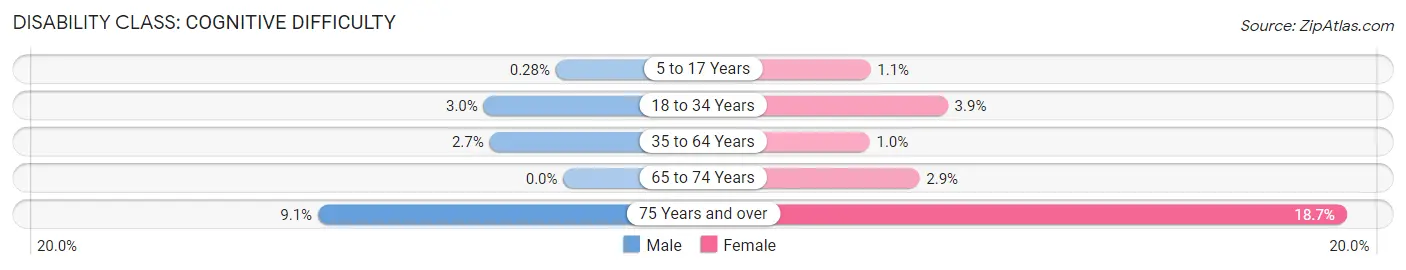
| Age Bracket | Male | Female |
| 5 to 17 Years | 7 (0.3%) | 26 (1.1%) |
| 18 to 34 Years | 50 (3.0%) | 63 (3.9%) |
| 35 to 64 Years | 162 (2.7%) | 52 (1.0%) |
| 65 to 74 Years | 0 (0.0%) | 45 (2.9%) |
| 75 Years and over | 100 (9.1%) | 200 (18.7%) |
Disability Class: Ambulatory Difficulty
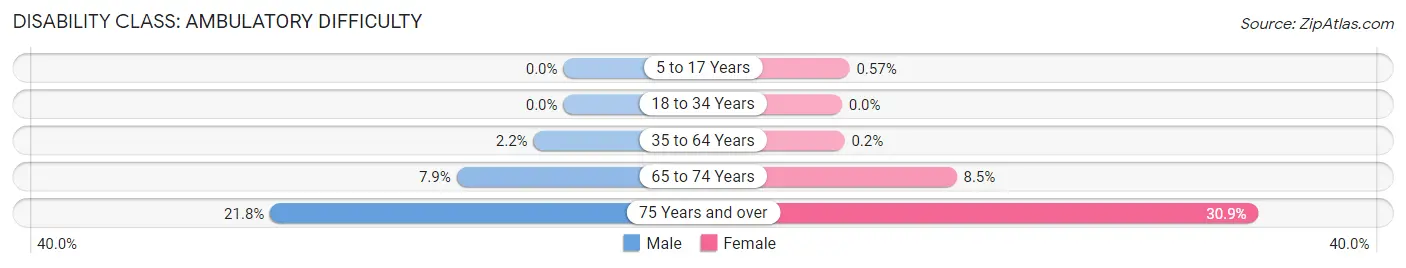
| Age Bracket | Male | Female |
| 5 to 17 Years | 0 (0.0%) | 14 (0.6%) |
| 18 to 34 Years | 0 (0.0%) | 0 (0.0%) |
| 35 to 64 Years | 131 (2.2%) | 10 (0.2%) |
| 65 to 74 Years | 89 (7.9%) | 133 (8.5%) |
| 75 Years and over | 239 (21.8%) | 330 (30.9%) |
Disability Class: Self-Care Difficulty
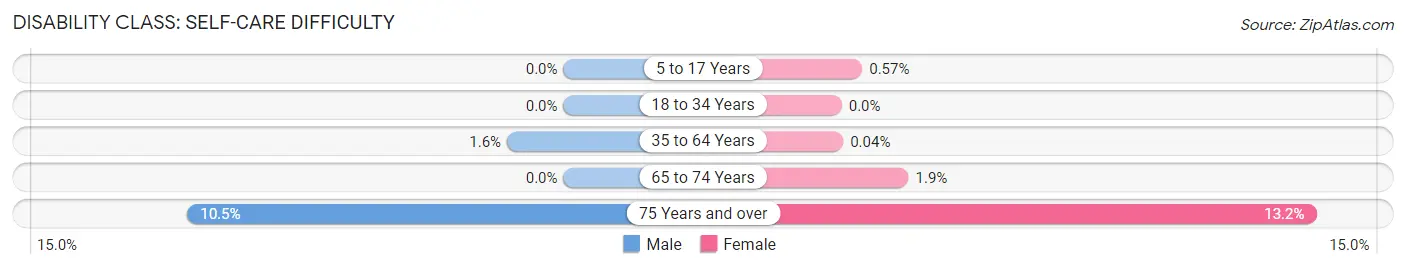
| Age Bracket | Male | Female |
| 5 to 17 Years | 0 (0.0%) | 14 (0.6%) |
| 18 to 34 Years | 0 (0.0%) | 0 (0.0%) |
| 35 to 64 Years | 93 (1.6%) | 2 (0.0%) |
| 65 to 74 Years | 0 (0.0%) | 29 (1.9%) |
| 75 Years and over | 115 (10.5%) | 141 (13.2%) |
Technology Access in Lafayette
Computing Device Access in Lafayette
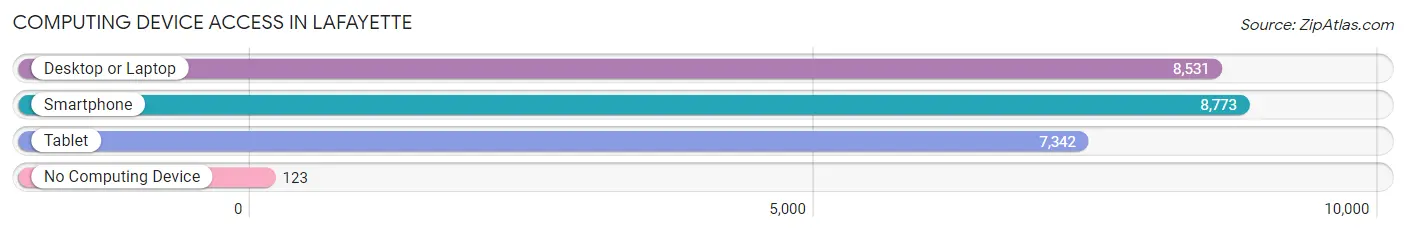
| Device Type | # Households | % Households |
| Desktop or Laptop | 8,531 | 94.6% |
| Smartphone | 8,773 | 97.3% |
| Tablet | 7,342 | 81.5% |
| No Computing Device | 123 | 1.4% |
| Total | 9,014 | 100.0% |
Internet Access in Lafayette
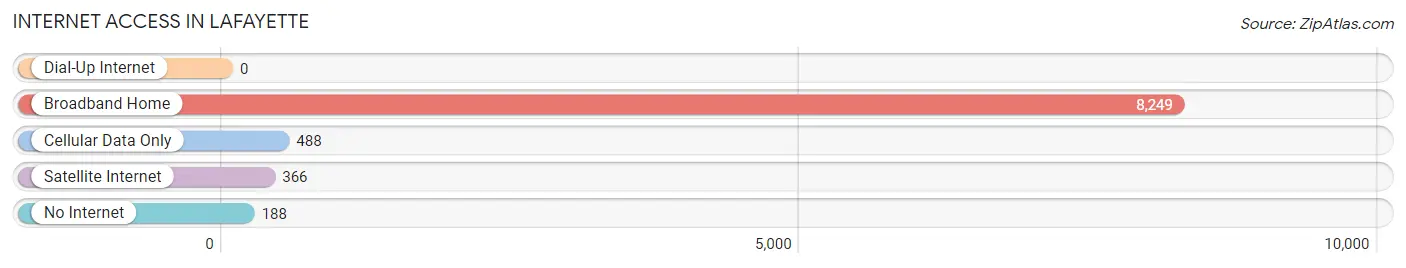
| Internet Type | # Households | % Households |
| Dial-Up Internet | 0 | 0.0% |
| Broadband Home | 8,249 | 91.5% |
| Cellular Data Only | 488 | 5.4% |
| Satellite Internet | 366 | 4.1% |
| No Internet | 188 | 2.1% |
| Total | 9,014 | 100.0% |
Lafayette Summary
Lafayette is a city in Contra Costa County, California, United States. It is located in the East Bay region of the San Francisco Bay Area. The population was estimated to be 25,285 in 2019. The city is known for its small-town charm and its proximity to the larger cities of Oakland and San Francisco.
History
The area that is now Lafayette was originally inhabited by the Saclan tribe of Native Americans. The first Europeans to settle in the area were the Spanish, who established a mission in the area in 1776. The area was then part of the Rancho Acalanes Mexican land grant, which was granted to the brothers Domingo and Vicente Martinez in 1834.
In 1857, the area was purchased by William T. Smith, who established a stagecoach stop and a general store. The area was then known as Smith's Landing. In 1868, the area was renamed Lafayette after the Marquis de Lafayette, a French military hero of the American Revolutionary War.
In 1892, the town was incorporated as the City of Lafayette. The city grew rapidly in the early 20th century, and by the 1950s, it had become a popular suburban community.
Geography
Lafayette is located in the East Bay region of the San Francisco Bay Area. It is situated in the foothills of the Diablo Range, about 20 miles east of Oakland and 30 miles northeast of San Francisco. The city covers an area of 8.3 square miles, with a population density of 3,039 people per square mile.
The city is bordered by the cities of Walnut Creek to the north, Orinda to the east, Moraga to the south, and Pleasant Hill to the west. The city is also bordered by the unincorporated communities of Reliez Valley and Happy Valley.
The city is located in a hilly area, with elevations ranging from 200 to 1,000 feet. The highest point in the city is the summit of Mount Diablo, which is located just outside the city limits.
Economy
Lafayette is a primarily residential city, with a small but vibrant business community. The city's economy is largely driven by the service sector, with many businesses providing services to the local community. The city is also home to a number of technology companies, including Oracle, which has a large campus in the city.
The city is also home to a number of retail businesses, including the Lafayette Plaza Shopping Center, which is the largest shopping center in the city.
Demographics
As of the 2019 census, the population of Lafayette was estimated to be 25,285. The racial makeup of the city was 73.2% White, 11.2% Asian, 8.2% Hispanic or Latino, 5.2% African American, and 0.7% Native American.
The median household income in the city was $133,845, and the median family income was $152,945. The per capita income in the city was $68,845.
The city is served by the Lafayette School District, which includes four elementary schools, one middle school, and one high school. The city is also home to several private schools, including the Lafayette Christian School and the Lafayette Waldorf School.
Common Questions
What is Per Capita Income in Lafayette?
Per Capita income in Lafayette is $111,213.
What is the Median Family Income in Lafayette?
Median Family Income in Lafayette is $250,001.
What is the Median Household income in Lafayette?
Median Household Income in Lafayette is $219,250.
What is Income or Wage Gap in Lafayette?
Income or Wage Gap in Lafayette is 33.3%.
Women in Lafayette earn 66.7 cents for every dollar earned by a man.
What is Inequality or Gini Index in Lafayette?
Inequality or Gini Index in Lafayette is 0.48.
What is the Total Population of Lafayette?
Total Population of Lafayette is 25,310.
What is the Total Male Population of Lafayette?
Total Male Population of Lafayette is 12,767.
What is the Total Female Population of Lafayette?
Total Female Population of Lafayette is 12,543.
What is the Ratio of Males per 100 Females in Lafayette?
There are 101.79 Males per 100 Females in Lafayette.
What is the Ratio of Females per 100 Males in Lafayette?
There are 98.25 Females per 100 Males in Lafayette.
What is the Median Population Age in Lafayette?
Median Population Age in Lafayette is 45.4 Years.
What is the Average Family Size in Lafayette
Average Family Size in Lafayette is 3.0 People.
What is the Average Household Size in Lafayette
Average Household Size in Lafayette is 2.8 People.
How Large is the Labor Force in Lafayette?
There are 12,791 People in the Labor Forcein in Lafayette.
What is the Percentage of People in the Labor Force in Lafayette?
64.7% of People are in the Labor Force in Lafayette.
What is the Unemployment Rate in Lafayette?
Unemployment Rate in Lafayette is 6.3%.