Cities with the Highest Percentage of Population Employed in Legal Services & Support in Virginia
RELATED REPORTS & OPTIONS
Legal Services & Support
Virginia
Compare Cities
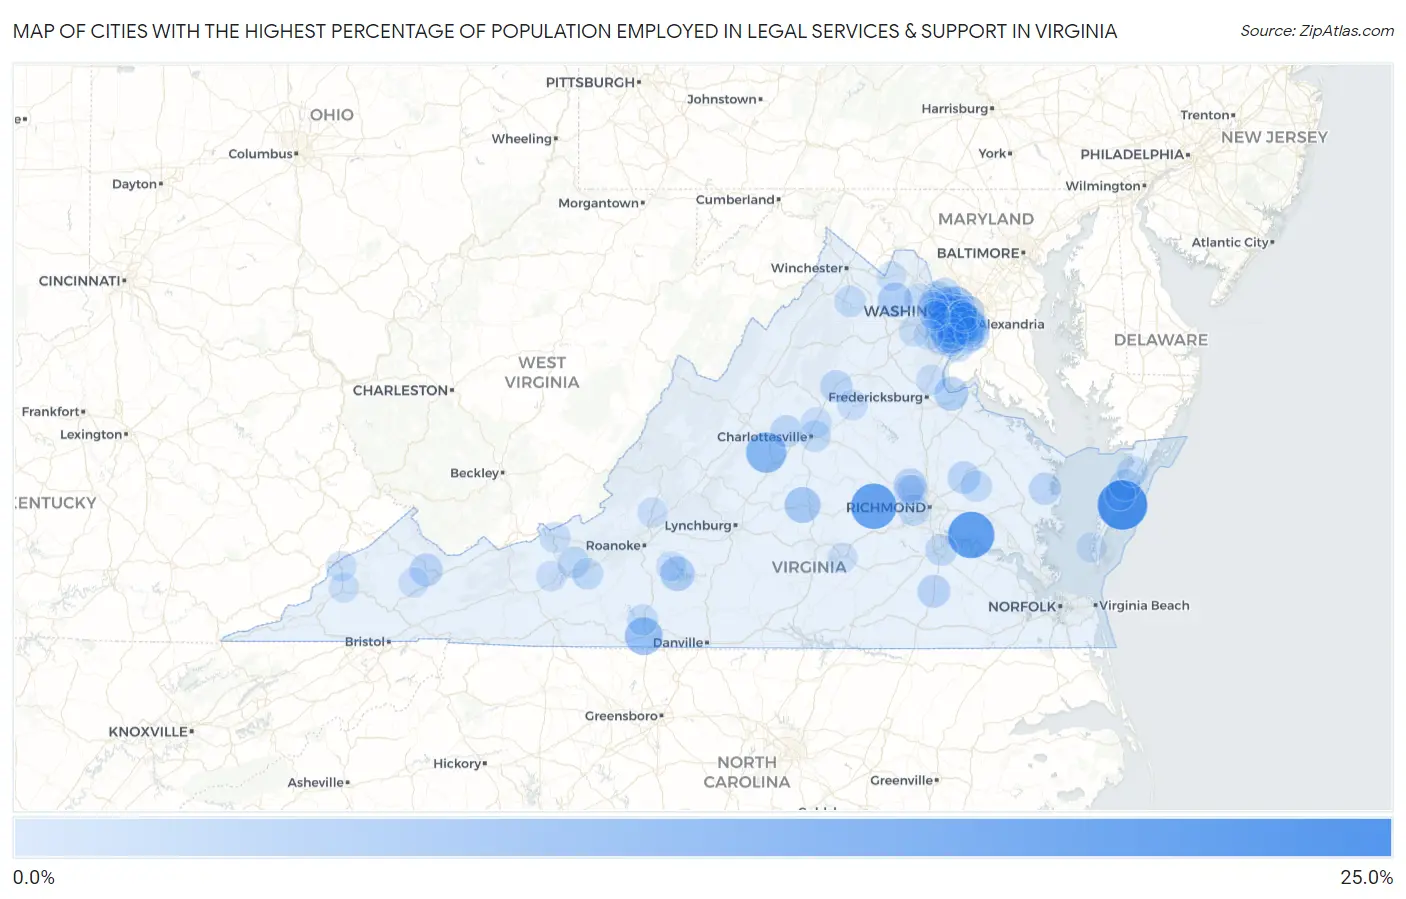
Map of Cities with the Highest Percentage of Population Employed in Legal Services & Support in Virginia
0.0%
25.0%
Cities with the Highest Percentage of Population Employed in Legal Services & Support in Virginia
| City | % Employed | vs State | vs National | |
| 1. | Quinby | 24.8% | 1.6%(+23.1)#1 | 1.2%(+23.6)#36 |
| 2. | Charles City | 21.1% | 1.6%(+19.4)#2 | 1.2%(+19.9)#53 |
| 3. | Powhatan | 19.8% | 1.6%(+18.2)#3 | 1.2%(+18.6)#59 |
| 4. | Nellysford | 14.0% | 1.6%(+12.4)#4 | 1.2%(+12.8)#120 |
| 5. | Horse Pasture | 10.9% | 1.6%(+9.33)#5 | 1.2%(+9.77)#186 |
| 6. | Mclean | 9.6% | 1.6%(+8.02)#6 | 1.2%(+8.46)#246 |
| 7. | Buckingham Courthouse | 8.7% | 1.6%(+7.10)#7 | 1.2%(+7.54)#290 |
| 8. | North Shore | 7.2% | 1.6%(+5.58)#8 | 1.2%(+6.01)#421 |
| 9. | Middleburg | 7.1% | 1.6%(+5.52)#9 | 1.2%(+5.96)#426 |
| 10. | Wolf Trap | 6.8% | 1.6%(+5.15)#10 | 1.2%(+5.59)#464 |
| 11. | Difficult Run | 6.7% | 1.6%(+5.08)#11 | 1.2%(+5.52)#473 |
| 12. | Crosspointe | 6.6% | 1.6%(+5.02)#12 | 1.2%(+5.45)#486 |
| 13. | Fairview Beach | 6.5% | 1.6%(+4.85)#13 | 1.2%(+5.29)#515 |
| 14. | Arlington | 6.5% | 1.6%(+4.84)#14 | 1.2%(+5.27)#521 |
| 15. | Fort Hunt | 6.3% | 1.6%(+4.69)#15 | 1.2%(+5.12)#544 |
| 16. | South Run | 6.3% | 1.6%(+4.66)#16 | 1.2%(+5.09)#551 |
| 17. | Belle Haven | 6.1% | 1.6%(+4.50)#17 | 1.2%(+4.94)#576 |
| 18. | Alexandria | 5.9% | 1.6%(+4.24)#18 | 1.2%(+4.68)#628 |
| 19. | Falls Church | 5.6% | 1.6%(+3.97)#19 | 1.2%(+4.41)#689 |
| 20. | Goose Creek | 5.4% | 1.6%(+3.78)#20 | 1.2%(+4.22)#731 |
| 21. | Raven | 5.4% | 1.6%(+3.76)#21 | 1.2%(+4.20)#734 |
| 22. | Mantua | 5.3% | 1.6%(+3.71)#22 | 1.2%(+4.15)#748 |
| 23. | Wyndham | 5.3% | 1.6%(+3.70)#23 | 1.2%(+4.13)#754 |
| 24. | Stony Creek | 5.2% | 1.6%(+3.60)#24 | 1.2%(+4.03)#780 |
| 25. | Central Garage | 4.9% | 1.6%(+3.27)#25 | 1.2%(+3.71)#872 |
| 26. | Merrifield | 4.8% | 1.6%(+3.20)#26 | 1.2%(+3.64)#899 |
| 27. | Dunn Loring | 4.8% | 1.6%(+3.17)#27 | 1.2%(+3.61)#910 |
| 28. | Vienna | 4.8% | 1.6%(+3.17)#28 | 1.2%(+3.61)#914 |
| 29. | Long Branch | 4.7% | 1.6%(+3.11)#29 | 1.2%(+3.55)#932 |
| 30. | Fairfax Station | 4.7% | 1.6%(+3.08)#30 | 1.2%(+3.52)#948 |
| 31. | Pimmit Hills | 4.7% | 1.6%(+3.05)#31 | 1.2%(+3.49)#957 |
| 32. | Mount Vernon | 4.6% | 1.6%(+3.00)#32 | 1.2%(+3.44)#974 |
| 33. | Irvington | 4.6% | 1.6%(+2.99)#33 | 1.2%(+3.43)#976 |
| 34. | Madison | 4.5% | 1.6%(+2.90)#34 | 1.2%(+3.34)#1,008 |
| 35. | Great Falls | 4.5% | 1.6%(+2.83)#35 | 1.2%(+3.27)#1,030 |
| 36. | North Garden | 4.4% | 1.6%(+2.81)#36 | 1.2%(+3.25)#1,037 |
| 37. | Crozet | 4.3% | 1.6%(+2.72)#37 | 1.2%(+3.16)#1,075 |
| 38. | Oakton | 4.2% | 1.6%(+2.58)#38 | 1.2%(+3.02)#1,137 |
| 39. | Fort Lee | 4.1% | 1.6%(+2.47)#39 | 1.2%(+2.91)#1,186 |
| 40. | Fairlawn | 4.0% | 1.6%(+2.42)#40 | 1.2%(+2.85)#1,210 |
| 41. | Great Falls Crossing | 4.0% | 1.6%(+2.41)#41 | 1.2%(+2.85)#1,214 |
| 42. | Onley | 3.8% | 1.6%(+2.16)#42 | 1.2%(+2.60)#1,332 |
| 43. | Woodburn | 3.8% | 1.6%(+2.13)#43 | 1.2%(+2.57)#1,350 |
| 44. | Shenandoah Shores | 3.7% | 1.6%(+2.09)#44 | 1.2%(+2.53)#1,382 |
| 45. | King William | 3.7% | 1.6%(+2.08)#45 | 1.2%(+2.52)#1,392 |
| 46. | Riner | 3.7% | 1.6%(+2.06)#46 | 1.2%(+2.50)#1,410 |
| 47. | Mason Neck | 3.7% | 1.6%(+2.05)#47 | 1.2%(+2.49)#1,414 |
| 48. | West Springfield | 3.6% | 1.6%(+2.01)#48 | 1.2%(+2.45)#1,439 |
| 49. | Bon Air | 3.6% | 1.6%(+2.01)#49 | 1.2%(+2.45)#1,443 |
| 50. | Pantops | 3.6% | 1.6%(+1.97)#50 | 1.2%(+2.41)#1,469 |
| 51. | One Loudoun | 3.6% | 1.6%(+1.95)#51 | 1.2%(+2.39)#1,488 |
| 52. | Hayfield | 3.5% | 1.6%(+1.91)#52 | 1.2%(+2.35)#1,505 |
| 53. | Franconia | 3.5% | 1.6%(+1.90)#53 | 1.2%(+2.34)#1,517 |
| 54. | Kingstowne | 3.5% | 1.6%(+1.88)#54 | 1.2%(+2.32)#1,535 |
| 55. | Fairfax | 3.4% | 1.6%(+1.80)#55 | 1.2%(+2.24)#1,593 |
| 56. | Stanleytown | 3.4% | 1.6%(+1.80)#56 | 1.2%(+2.24)#1,598 |
| 57. | Idylwood | 3.4% | 1.6%(+1.79)#57 | 1.2%(+2.23)#1,605 |
| 58. | Parksley | 3.3% | 1.6%(+1.67)#58 | 1.2%(+2.10)#1,692 |
| 59. | Lake Barcroft | 3.2% | 1.6%(+1.56)#59 | 1.2%(+1.99)#1,778 |
| 60. | Huntington | 3.2% | 1.6%(+1.54)#60 | 1.2%(+1.98)#1,792 |
| 61. | Dranesville | 3.1% | 1.6%(+1.44)#61 | 1.2%(+1.88)#1,862 |
| 62. | Occoquan | 3.0% | 1.6%(+1.36)#62 | 1.2%(+1.80)#1,947 |
| 63. | Franklin Farm | 3.0% | 1.6%(+1.36)#63 | 1.2%(+1.80)#1,949 |
| 64. | Kings Park West | 3.0% | 1.6%(+1.34)#64 | 1.2%(+1.78)#1,967 |
| 65. | Hollymead | 2.9% | 1.6%(+1.32)#65 | 1.2%(+1.76)#1,986 |
| 66. | Pearisburg | 2.9% | 1.6%(+1.32)#66 | 1.2%(+1.76)#1,991 |
| 67. | Fair Oaks | 2.9% | 1.6%(+1.29)#67 | 1.2%(+1.73)#2,023 |
| 68. | Orange | 2.9% | 1.6%(+1.27)#68 | 1.2%(+1.70)#2,041 |
| 69. | Brambleton | 2.9% | 1.6%(+1.24)#69 | 1.2%(+1.68)#2,059 |
| 70. | County Center | 2.8% | 1.6%(+1.18)#70 | 1.2%(+1.62)#2,124 |
| 71. | Keller | 2.8% | 1.6%(+1.16)#71 | 1.2%(+1.59)#2,156 |
| 72. | Lincolnia | 2.8% | 1.6%(+1.14)#72 | 1.2%(+1.58)#2,172 |
| 73. | Pulaski | 2.8% | 1.6%(+1.13)#73 | 1.2%(+1.57)#2,177 |
| 74. | Floris | 2.8% | 1.6%(+1.13)#74 | 1.2%(+1.57)#2,179 |
| 75. | Short Pump | 2.7% | 1.6%(+1.11)#75 | 1.2%(+1.55)#2,210 |
| 76. | Stafford Courthouse | 2.6% | 1.6%(+1.01)#76 | 1.2%(+1.45)#2,299 |
| 77. | Burke | 2.6% | 1.6%(+0.990)#77 | 1.2%(+1.43)#2,335 |
| 78. | Newington Forest | 2.6% | 1.6%(+0.957)#78 | 1.2%(+1.40)#2,371 |
| 79. | Rose Hill Cdp Fairfax County | 2.6% | 1.6%(+0.944)#79 | 1.2%(+1.38)#2,383 |
| 80. | Seven Corners | 2.5% | 1.6%(+0.915)#80 | 1.2%(+1.35)#2,411 |
| 81. | Fincastle | 2.5% | 1.6%(+0.909)#81 | 1.2%(+1.35)#2,416 |
| 82. | Innsbrook | 2.5% | 1.6%(+0.865)#82 | 1.2%(+1.30)#2,458 |
| 83. | Pound | 2.5% | 1.6%(+0.837)#83 | 1.2%(+1.28)#2,492 |
| 84. | Honaker | 2.4% | 1.6%(+0.828)#84 | 1.2%(+1.27)#2,505 |
| 85. | Linton Hall | 2.4% | 1.6%(+0.821)#85 | 1.2%(+1.26)#2,511 |
| 86. | Westlake Corner | 2.4% | 1.6%(+0.814)#86 | 1.2%(+1.25)#2,530 |
| 87. | Wise | 2.4% | 1.6%(+0.751)#87 | 1.2%(+1.19)#2,617 |
| 88. | Laurel Hill | 2.4% | 1.6%(+0.750)#88 | 1.2%(+1.19)#2,618 |
| 89. | Midlothian | 2.4% | 1.6%(+0.741)#89 | 1.2%(+1.18)#2,631 |
| 90. | Fair Lakes | 2.4% | 1.6%(+0.740)#90 | 1.2%(+1.18)#2,632 |
| 91. | Braddock | 2.3% | 1.6%(+0.721)#91 | 1.2%(+1.16)#2,664 |
| 92. | Bailey S Crossroads | 2.3% | 1.6%(+0.711)#92 | 1.2%(+1.15)#2,677 |
| 93. | Hybla Valley | 2.3% | 1.6%(+0.688)#93 | 1.2%(+1.13)#2,706 |
| 94. | Greenbriar | 2.3% | 1.6%(+0.648)#94 | 1.2%(+1.09)#2,763 |
| 95. | Buckhall | 2.3% | 1.6%(+0.630)#95 | 1.2%(+1.07)#2,788 |
| 96. | Navy | 2.2% | 1.6%(+0.619)#96 | 1.2%(+1.06)#2,808 |
| 97. | Sully Square | 2.2% | 1.6%(+0.615)#97 | 1.2%(+1.05)#2,815 |
| 98. | Burkeville | 2.2% | 1.6%(+0.600)#98 | 1.2%(+1.04)#2,843 |
| 99. | Cape Charles | 2.2% | 1.6%(+0.580)#99 | 1.2%(+1.02)#2,866 |
| 100. | Round Hill | 2.2% | 1.6%(+0.573)#100 | 1.2%(+1.01)#2,875 |
Common Questions
What are the Top 10 Cities with the Highest Percentage of Population Employed in Legal Services & Support in Virginia?
Top 10 Cities with the Highest Percentage of Population Employed in Legal Services & Support in Virginia are:
#1
24.8%
#2
21.1%
#3
19.8%
#4
14.0%
#5
10.9%
#6
9.6%
#7
8.7%
#8
7.2%
#9
7.1%
#10
6.8%
What city has the Highest Percentage of Population Employed in Legal Services & Support in Virginia?
Quinby has the Highest Percentage of Population Employed in Legal Services & Support in Virginia with 24.8%.
What is the Percentage of Population Employed in Legal Services & Support in the State of Virginia?
Percentage of Population Employed in Legal Services & Support in Virginia is 1.6%.
What is the Percentage of Population Employed in Legal Services & Support in the United States?
Percentage of Population Employed in Legal Services & Support in the United States is 1.2%.