Orinda, CA Map & Demographics
Orinda Map
Orinda Overview
$141,683
PER CAPITA INCOME
$250,001
AVG FAMILY INCOME
$250,001
AVG HOUSEHOLD INCOME
50.2%
WAGE / INCOME GAP [ % ]
49.8¢/ $1
WAGE / INCOME GAP [ $ ]
0.49
INEQUALITY / GINI INDEX
19,477
TOTAL POPULATION
9,648
MALE POPULATION
9,829
FEMALE POPULATION
98.16
MALES / 100 FEMALES
101.88
FEMALES / 100 MALES
49.4
MEDIAN AGE
3.0
AVG FAMILY SIZE
2.6
AVG HOUSEHOLD SIZE
9,288
LABOR FORCE [ PEOPLE ]
60.0%
PERCENT IN LABOR FORCE
3.3%
UNEMPLOYMENT RATE
Orinda Zip Codes
Orinda Area Codes
Income in Orinda
Income Overview in Orinda
Per Capita Income in Orinda is $141,683, while median incomes of families and households are $250,001 and $250,001 respectively.
| Characteristic | Number | Measure |
| Per Capita Income | 19,477 | $141,683 |
| Median Family Income | 5,521 | $250,001 |
| Mean Family Income | 5,521 | $395,793 |
| Median Household Income | 7,476 | $250,001 |
| Mean Household Income | 7,476 | $370,203 |
| Income Deficit | 5,521 | $0 |
| Wage / Income Gap (%) | 19,477 | 50.20% |
| Wage / Income Gap ($) | 19,477 | 49.80¢ per $1 |
| Gini / Inequality Index | 19,477 | 0.49 |
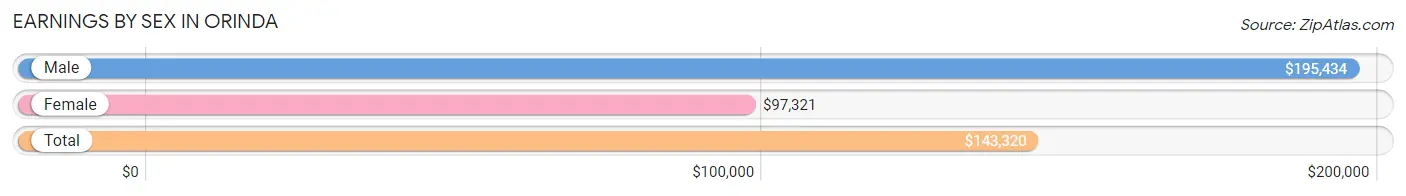
Earnings by Sex in Orinda
Average Earnings in Orinda are $143,320, $195,434 for men and $97,321 for women, a difference of 50.2%.
| Sex | Number | Average Earnings |
| Male | 5,763 (57.8%) | $195,434 |
| Female | 4,208 (42.2%) | $97,321 |
| Total | 9,971 (100.0%) | $143,320 |
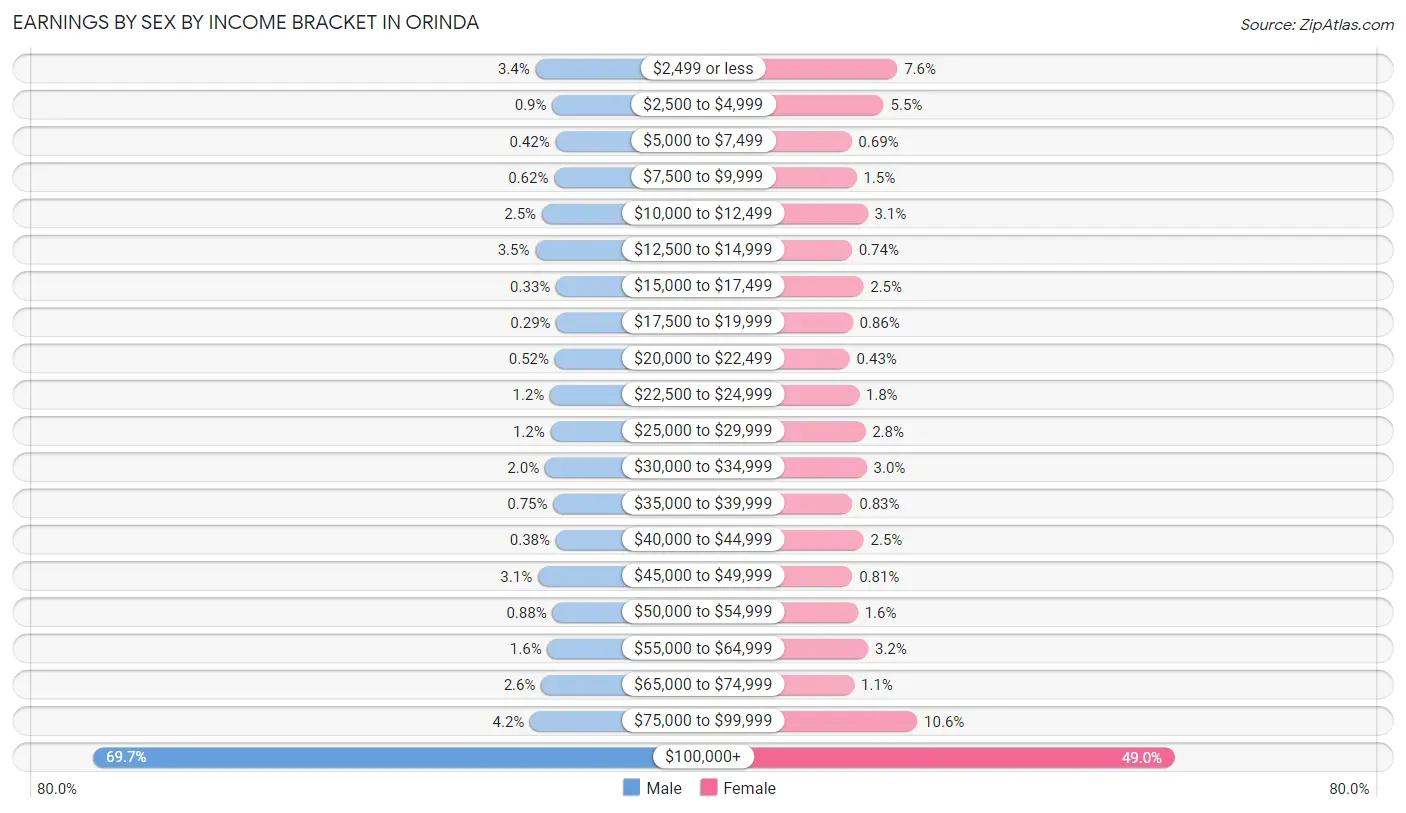
Earnings by Sex by Income Bracket in Orinda
The most common earnings brackets in Orinda are $100,000+ for men (4,018 | 69.7%) and $100,000+ for women (2,063 | 49.0%).
| Income | Male | Female |
| $2,499 or less | 197 (3.4%) | 318 (7.6%) |
| $2,500 to $4,999 | 52 (0.9%) | 232 (5.5%) |
| $5,000 to $7,499 | 24 (0.4%) | 29 (0.7%) |
| $7,500 to $9,999 | 36 (0.6%) | 61 (1.5%) |
| $10,000 to $12,499 | 142 (2.5%) | 131 (3.1%) |
| $12,500 to $14,999 | 199 (3.5%) | 31 (0.7%) |
| $15,000 to $17,499 | 19 (0.3%) | 104 (2.5%) |
| $17,500 to $19,999 | 17 (0.3%) | 36 (0.9%) |
| $20,000 to $22,499 | 30 (0.5%) | 18 (0.4%) |
| $22,500 to $24,999 | 71 (1.2%) | 76 (1.8%) |
| $25,000 to $29,999 | 67 (1.2%) | 116 (2.8%) |
| $30,000 to $34,999 | 115 (2.0%) | 125 (3.0%) |
| $35,000 to $39,999 | 43 (0.7%) | 35 (0.8%) |
| $40,000 to $44,999 | 22 (0.4%) | 106 (2.5%) |
| $45,000 to $49,999 | 176 (3.0%) | 34 (0.8%) |
| $50,000 to $54,999 | 51 (0.9%) | 69 (1.6%) |
| $55,000 to $64,999 | 94 (1.6%) | 134 (3.2%) |
| $65,000 to $74,999 | 147 (2.5%) | 46 (1.1%) |
| $75,000 to $99,999 | 243 (4.2%) | 444 (10.5%) |
| $100,000+ | 4,018 (69.7%) | 2,063 (49.0%) |
| Total | 5,763 (100.0%) | 4,208 (100.0%) |
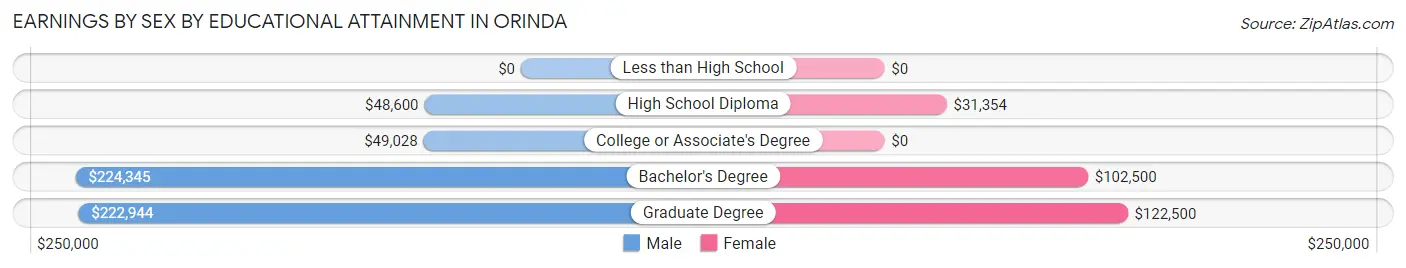
Earnings by Sex by Educational Attainment in Orinda
Average earnings in Orinda are $206,845 for men and $108,750 for women, a difference of 47.4%. Men with an educational attainment of bachelor's degree enjoy the highest average annual earnings of $224,345, while those with high school diploma education earn the least with $48,600. Women with an educational attainment of graduate degree earn the most with the average annual earnings of $122,500, while those with high school diploma education have the smallest earnings of $31,354.
| Educational Attainment | Male Income | Female Income |
| Less than High School | - | - |
| High School Diploma | $48,600 | $31,354 |
| College or Associate's Degree | $49,028 | $0 |
| Bachelor's Degree | $224,345 | $102,500 |
| Graduate Degree | $222,944 | $122,500 |
| Total | $206,845 | $108,750 |
Family Income in Orinda
Family Income Brackets in Orinda
According to the Orinda family income data, there are 3,870 families falling into the $200,000+ income range, which is the most common income bracket and makes up 70.1% of all families. Conversely, the less than $10,000 income bracket is the least frequent group with only 17 families (0.3%) belonging to this category.
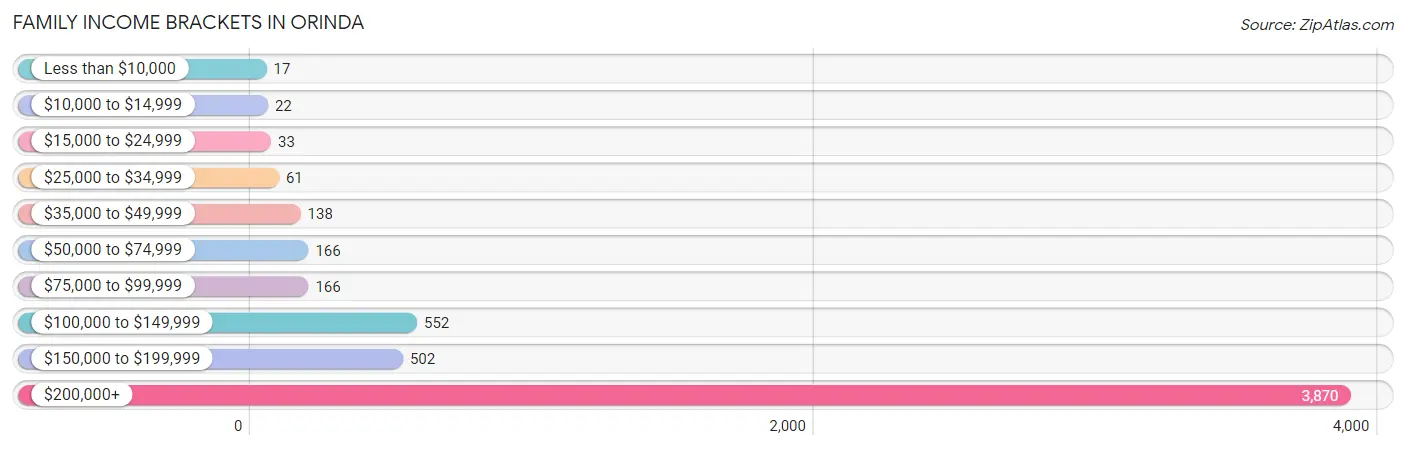
| Income Bracket | # Families | % Families |
| Less than $10,000 | 17 | 0.3% |
| $10,000 to $14,999 | 22 | 0.4% |
| $15,000 to $24,999 | 33 | 0.6% |
| $25,000 to $34,999 | 61 | 1.1% |
| $35,000 to $49,999 | 138 | 2.5% |
| $50,000 to $74,999 | 166 | 3.0% |
| $75,000 to $99,999 | 166 | 3.0% |
| $100,000 to $149,999 | 552 | 10.0% |
| $150,000 to $199,999 | 502 | 9.1% |
| $200,000+ | 3,870 | 70.1% |
Family Income by Famaliy Size in Orinda
3-person families (1,314 | 23.8%) account for the highest median family income in Orinda with $250,001 per family, while 2-person families (2,371 | 42.9%) have the highest median income of $113,177 per family member.
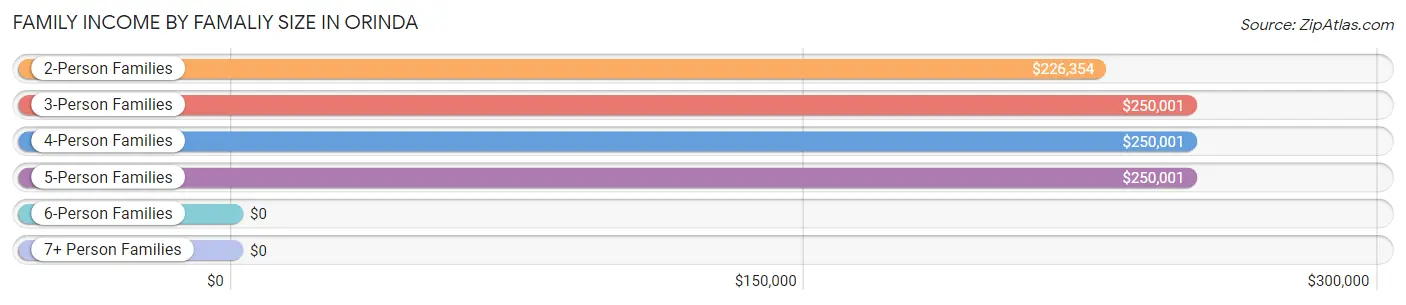
| Income Bracket | # Families | Median Income |
| 2-Person Families | 2,371 (42.9%) | $226,354 |
| 3-Person Families | 1,314 (23.8%) | $250,001 |
| 4-Person Families | 1,388 (25.1%) | $250,001 |
| 5-Person Families | 415 (7.5%) | $250,001 |
| 6-Person Families | 25 (0.4%) | $0 |
| 7+ Person Families | 8 (0.1%) | $0 |
| Total | 5,521 (100.0%) | $250,001 |
Family Income by Number of Earners in Orinda
The median family income in Orinda is $250,001, with families comprising 1 earner (1,729) having the highest median family income of $250,001, while families with no earners (783) have the lowest median family income of $168,958, accounting for 31.3% and 14.2% of families, respectively.
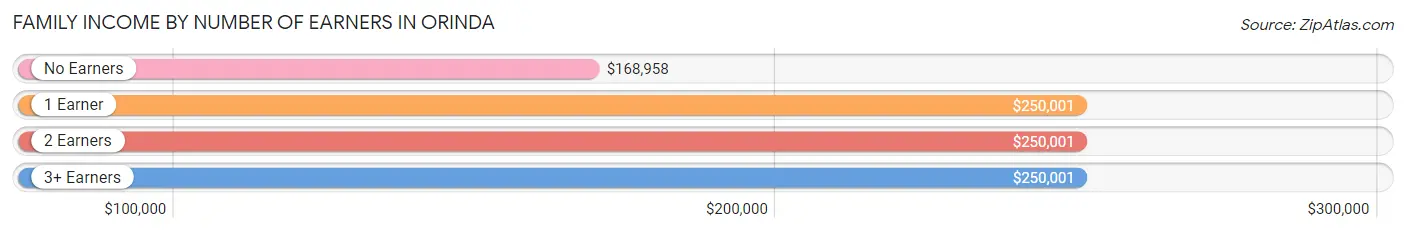
| Number of Earners | # Families | Median Income |
| No Earners | 783 (14.2%) | $168,958 |
| 1 Earner | 1,729 (31.3%) | $250,001 |
| 2 Earners | 2,397 (43.4%) | $250,001 |
| 3+ Earners | 612 (11.1%) | $250,001 |
| Total | 5,521 (100.0%) | $250,001 |
Household Income in Orinda
Household Income Brackets in Orinda
With 4,545 households falling in the category, the $200,000+ income range is the most frequent in Orinda, accounting for 60.8% of all households. In contrast, only 112 households (1.5%) fall into the $25,000 to $34,999 income bracket, making it the least populous group.
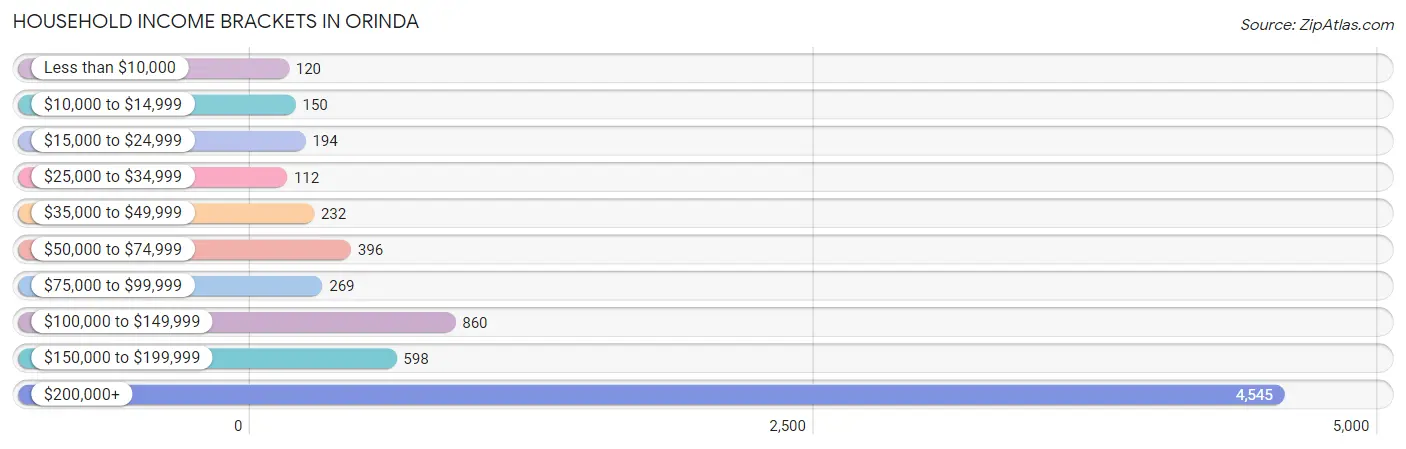
| Income Bracket | # Households | % Households |
| Less than $10,000 | 120 | 1.6% |
| $10,000 to $14,999 | 150 | 2.0% |
| $15,000 to $24,999 | 194 | 2.6% |
| $25,000 to $34,999 | 112 | 1.5% |
| $35,000 to $49,999 | 232 | 3.1% |
| $50,000 to $74,999 | 396 | 5.3% |
| $75,000 to $99,999 | 269 | 3.6% |
| $100,000 to $149,999 | 860 | 11.5% |
| $150,000 to $199,999 | 598 | 8.0% |
| $200,000+ | 4,545 | 60.8% |
Household Income by Householder Age in Orinda
The median household income in Orinda is $250,001, with the highest median household income of $250,001 found in the 25 to 44 years age bracket for the primary householder. A total of 1,180 households (15.8%) fall into this category. Meanwhile, the 15 to 24 years age bracket for the primary householder has the lowest median household income of $0, with 11 households (0.2%) in this group.
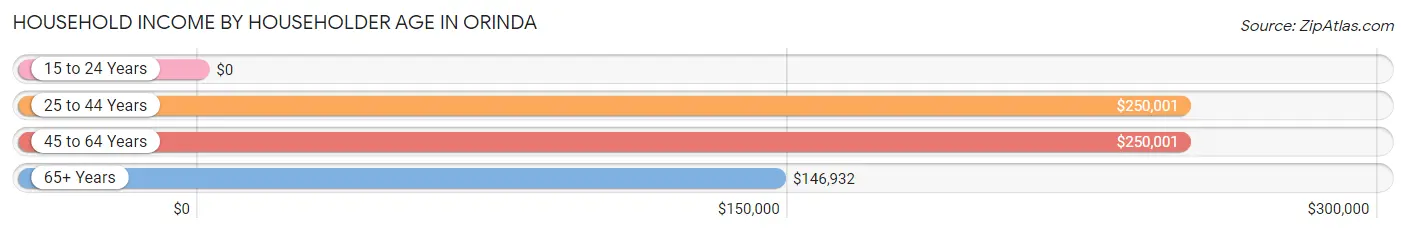
| Income Bracket | # Households | Median Income |
| 15 to 24 Years | 11 (0.2%) | $0 |
| 25 to 44 Years | 1,180 (15.8%) | $250,001 |
| 45 to 64 Years | 3,393 (45.4%) | $250,001 |
| 65+ Years | 2,892 (38.7%) | $146,932 |
| Total | 7,476 (100.0%) | $250,001 |
Poverty in Orinda
Income Below Poverty by Sex and Age in Orinda
With 1.9% poverty level for males and 2.3% for females among the residents of Orinda, 45 to 54 year old males and 18 to 24 year old females are the most vulnerable to poverty, with 80 males (4.4%) and 32 females (8.9%) in their respective age groups living below the poverty level.
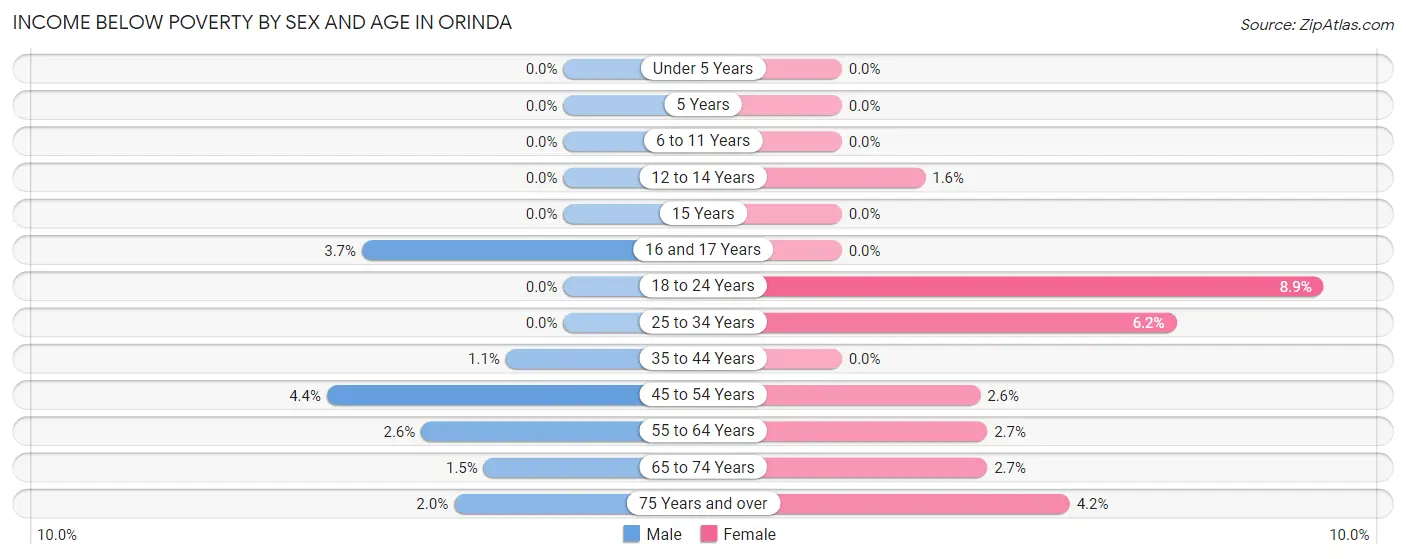
| Age Bracket | Male | Female |
| Under 5 Years | 0 (0.0%) | 0 (0.0%) |
| 5 Years | 0 (0.0%) | 0 (0.0%) |
| 6 to 11 Years | 0 (0.0%) | 0 (0.0%) |
| 12 to 14 Years | 0 (0.0%) | 9 (1.5%) |
| 15 Years | 0 (0.0%) | 0 (0.0%) |
| 16 and 17 Years | 8 (3.7%) | 0 (0.0%) |
| 18 to 24 Years | 0 (0.0%) | 32 (8.9%) |
| 25 to 34 Years | 0 (0.0%) | 20 (6.2%) |
| 35 to 44 Years | 12 (1.1%) | 0 (0.0%) |
| 45 to 54 Years | 80 (4.4%) | 41 (2.6%) |
| 55 to 64 Years | 42 (2.6%) | 38 (2.7%) |
| 65 to 74 Years | 17 (1.5%) | 28 (2.7%) |
| 75 Years and over | 21 (2.0%) | 54 (4.2%) |
| Total | 180 (1.9%) | 222 (2.3%) |
Income Above Poverty by Sex and Age in Orinda
According to the poverty statistics in Orinda, males aged under 5 years and females aged under 5 years are the age groups that are most secure financially, with 100.0% of males and 100.0% of females in these age groups living above the poverty line.
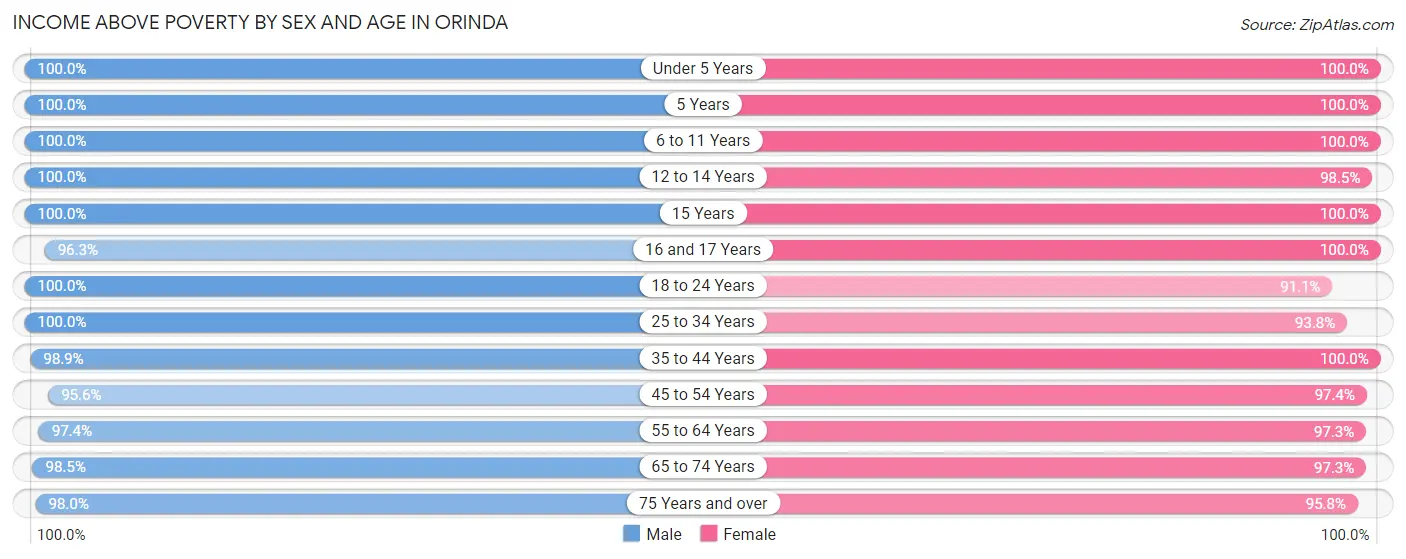
| Age Bracket | Male | Female |
| Under 5 Years | 410 (100.0%) | 516 (100.0%) |
| 5 Years | 111 (100.0%) | 170 (100.0%) |
| 6 to 11 Years | 956 (100.0%) | 634 (100.0%) |
| 12 to 14 Years | 277 (100.0%) | 570 (98.5%) |
| 15 Years | 133 (100.0%) | 200 (100.0%) |
| 16 and 17 Years | 206 (96.3%) | 559 (100.0%) |
| 18 to 24 Years | 437 (100.0%) | 326 (91.1%) |
| 25 to 34 Years | 351 (100.0%) | 302 (93.8%) |
| 35 to 44 Years | 1,111 (98.9%) | 1,155 (100.0%) |
| 45 to 54 Years | 1,741 (95.6%) | 1,557 (97.4%) |
| 55 to 64 Years | 1,547 (97.4%) | 1,371 (97.3%) |
| 65 to 74 Years | 1,133 (98.5%) | 1,009 (97.3%) |
| 75 Years and over | 1,015 (98.0%) | 1,224 (95.8%) |
| Total | 9,428 (98.1%) | 9,593 (97.7%) |
Income Below Poverty Among Married-Couple Families in Orinda
The poverty statistics for married-couple families in Orinda show that 0.6% or 30 of the total 5,071 families live below the poverty line. Families with no children have the highest poverty rate of 0.9%, comprising of 23 families. On the other hand, families with 3 or 4 children have the lowest poverty rate of 0.0%, which includes 0 families.
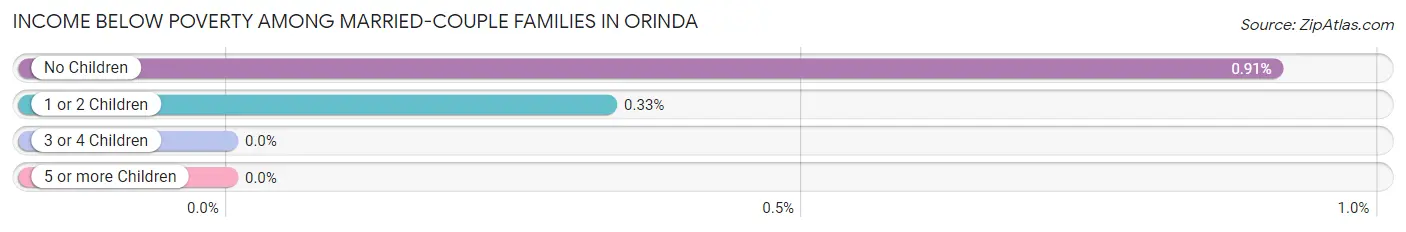
| Children | Above Poverty | Below Poverty |
| No Children | 2,504 (99.1%) | 23 (0.9%) |
| 1 or 2 Children | 2,126 (99.7%) | 7 (0.3%) |
| 3 or 4 Children | 411 (100.0%) | 0 (0.0%) |
| 5 or more Children | 0 (0.0%) | 0 (0.0%) |
| Total | 5,041 (99.4%) | 30 (0.6%) |
Income Below Poverty Among Single-Parent Households in Orinda
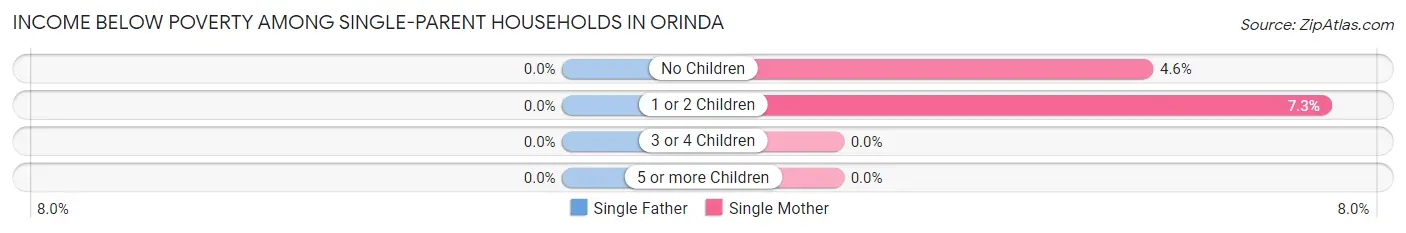
| Children | Single Father | Single Mother |
| No Children | 0 (0.0%) | 7 (4.6%) |
| 1 or 2 Children | 0 (0.0%) | 8 (7.3%) |
| 3 or 4 Children | 0 (0.0%) | 0 (0.0%) |
| 5 or more Children | 0 (0.0%) | 0 (0.0%) |
| Total | 0 (0.0%) | 15 (5.7%) |
Income Below Poverty Among Married-Couple vs Single-Parent Households in Orinda
The poverty data for Orinda shows that 30 of the married-couple family households (0.6%) and 15 of the single-parent households (3.3%) are living below the poverty level. Within the married-couple family households, those with no children have the highest poverty rate, with 23 households (0.9%) falling below the poverty line. Among the single-parent households, those with 1 or 2 children have the highest poverty rate, with 8 household (3.7%) living below poverty.
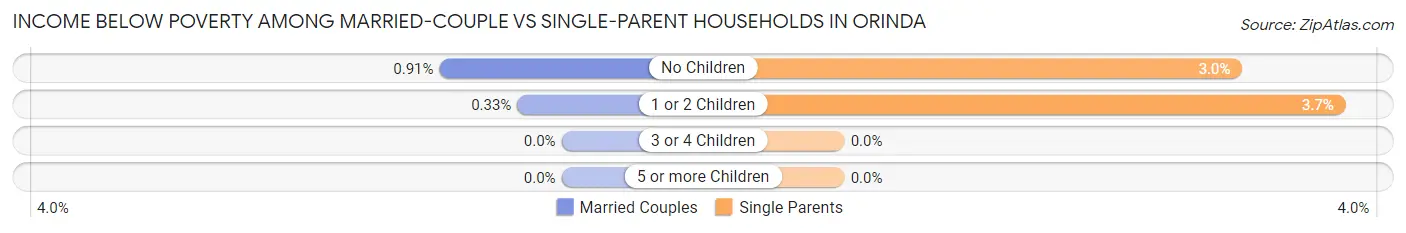
| Children | Married-Couple Families | Single-Parent Households |
| No Children | 23 (0.9%) | 7 (3.0%) |
| 1 or 2 Children | 7 (0.3%) | 8 (3.7%) |
| 3 or 4 Children | 0 (0.0%) | 0 (0.0%) |
| 5 or more Children | 0 (0.0%) | 0 (0.0%) |
| Total | 30 (0.6%) | 15 (3.3%) |
Race in Orinda
The most populous races in Orinda are White / Caucasian (13,862 | 71.2%), Asian (2,891 | 14.8%), and Two or more Races (2,475 | 12.7%).
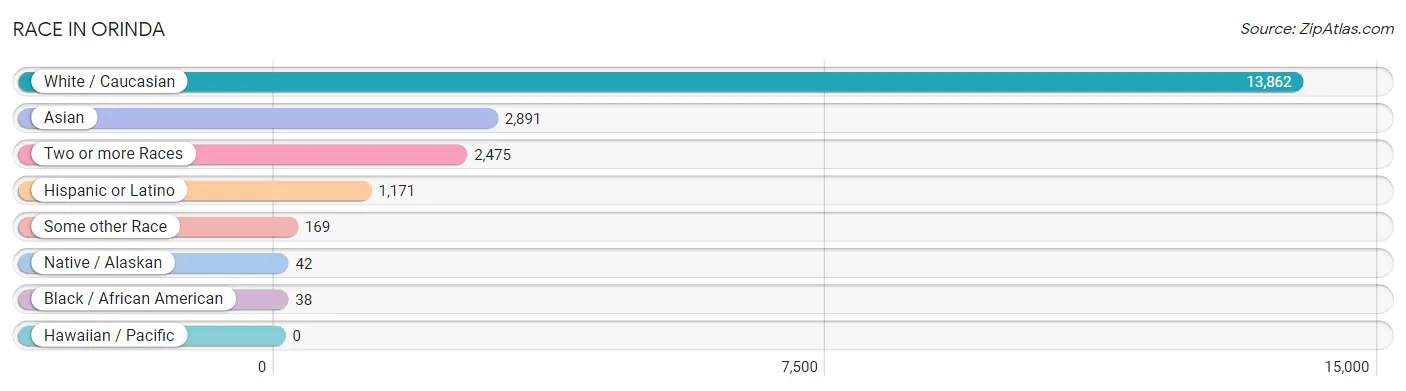
| Race | # Population | % Population |
| Asian | 2,891 | 14.8% |
| Black / African American | 38 | 0.2% |
| Hawaiian / Pacific | 0 | 0.0% |
| Hispanic or Latino | 1,171 | 6.0% |
| Native / Alaskan | 42 | 0.2% |
| White / Caucasian | 13,862 | 71.2% |
| Two or more Races | 2,475 | 12.7% |
| Some other Race | 169 | 0.9% |
| Total | 19,477 | 100.0% |
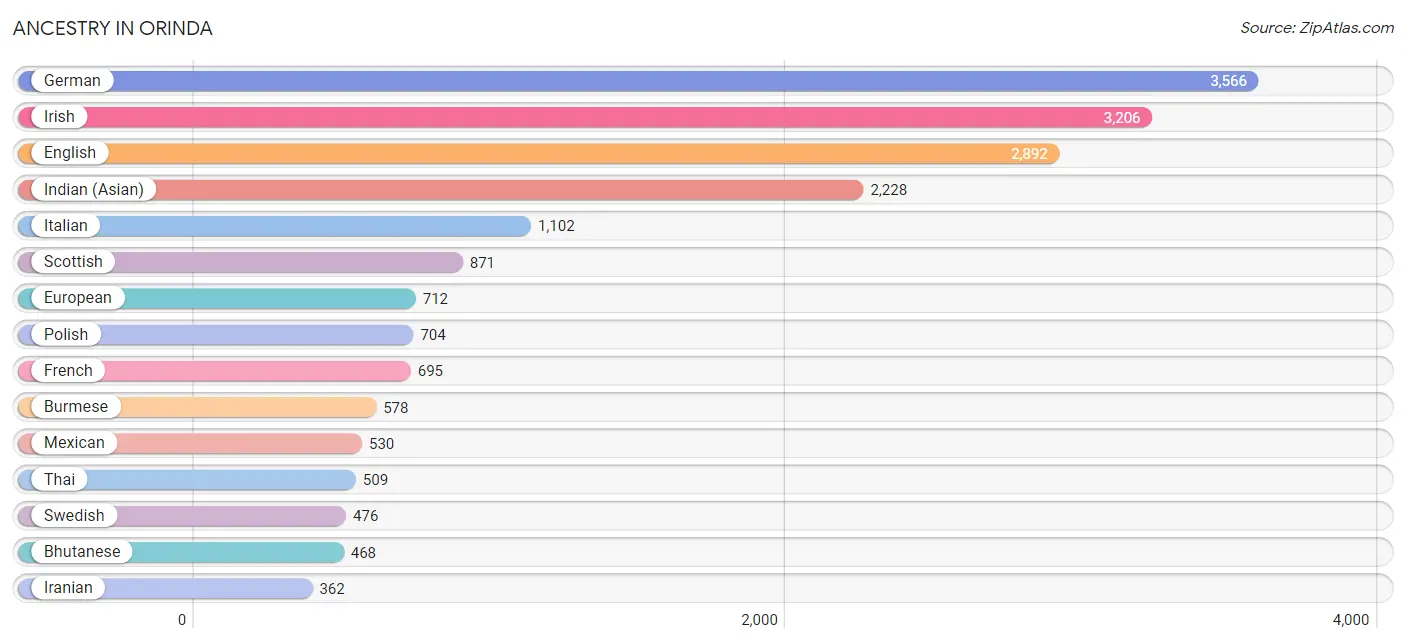
Ancestry in Orinda
The most populous ancestries reported in Orinda are German (3,566 | 18.3%), Irish (3,206 | 16.5%), English (2,892 | 14.8%), Indian (Asian) (2,228 | 11.4%), and Italian (1,102 | 5.7%), together accounting for 66.7% of all Orinda residents.
| Ancestry | # Population | % Population |
| African | 16 | 0.1% |
| Aleut | 25 | 0.1% |
| American | 335 | 1.7% |
| Apache | 16 | 0.1% |
| Arab | 112 | 0.6% |
| Argentinean | 54 | 0.3% |
| Armenian | 114 | 0.6% |
| Australian | 16 | 0.1% |
| Austrian | 111 | 0.6% |
| Basque | 44 | 0.2% |
| Bhutanese | 468 | 2.4% |
| Brazilian | 10 | 0.1% |
| British | 287 | 1.5% |
| Burmese | 578 | 3.0% |
| Canadian | 36 | 0.2% |
| Central American | 208 | 1.1% |
| Central American Indian | 89 | 0.5% |
| Cherokee | 118 | 0.6% |
| Chilean | 26 | 0.1% |
| Costa Rican | 8 | 0.0% |
| Cree | 6 | 0.0% |
| Croatian | 66 | 0.3% |
| Czech | 111 | 0.6% |
| Danish | 216 | 1.1% |
| Dominican | 45 | 0.2% |
| Dutch | 268 | 1.4% |
| Eastern European | 266 | 1.4% |
| Ecuadorian | 51 | 0.3% |
| Egyptian | 21 | 0.1% |
| English | 2,892 | 14.8% |
| European | 712 | 3.7% |
| Filipino | 189 | 1.0% |
| Finnish | 92 | 0.5% |
| French | 695 | 3.6% |
| French Canadian | 29 | 0.2% |
| German | 3,566 | 18.3% |
| Greek | 253 | 1.3% |
| Guamanian / Chamorro | 6 | 0.0% |
| Honduran | 89 | 0.5% |
| Hungarian | 146 | 0.7% |
| Indian (Asian) | 2,228 | 11.4% |
| Indonesian | 30 | 0.2% |
| Iranian | 362 | 1.9% |
| Iraqi | 12 | 0.1% |
| Irish | 3,206 | 16.5% |
| Italian | 1,102 | 5.7% |
| Japanese | 23 | 0.1% |
| Korean | 287 | 1.5% |
| Latvian | 32 | 0.2% |
| Lebanese | 41 | 0.2% |
| Lithuanian | 73 | 0.4% |
| Malaysian | 9 | 0.1% |
| Maltese | 53 | 0.3% |
| Mexican | 530 | 2.7% |
| Mexican American Indian | 33 | 0.2% |
| Native Hawaiian | 53 | 0.3% |
| Navajo | 19 | 0.1% |
| Nicaraguan | 62 | 0.3% |
| Northern European | 215 | 1.1% |
| Norwegian | 302 | 1.5% |
| Pakistani | 83 | 0.4% |
| Palestinian | 5 | 0.0% |
| Paraguayan | 51 | 0.3% |
| Peruvian | 17 | 0.1% |
| Polish | 704 | 3.6% |
| Portuguese | 121 | 0.6% |
| Romanian | 51 | 0.3% |
| Russian | 356 | 1.8% |
| Salvadoran | 49 | 0.3% |
| Samoan | 30 | 0.2% |
| Scandinavian | 119 | 0.6% |
| Scotch-Irish | 356 | 1.8% |
| Scottish | 871 | 4.5% |
| Slovak | 16 | 0.1% |
| Slovene | 12 | 0.1% |
| South American | 199 | 1.0% |
| South American Indian | 51 | 0.3% |
| Spaniard | 22 | 0.1% |
| Spanish | 103 | 0.5% |
| Sri Lankan | 216 | 1.1% |
| Subsaharan African | 16 | 0.1% |
| Swedish | 476 | 2.4% |
| Swiss | 165 | 0.9% |
| Thai | 509 | 2.6% |
| Turkish | 44 | 0.2% |
| Ukrainian | 95 | 0.5% |
| Welsh | 80 | 0.4% | View All 87 Rows |
Immigrants in Orinda
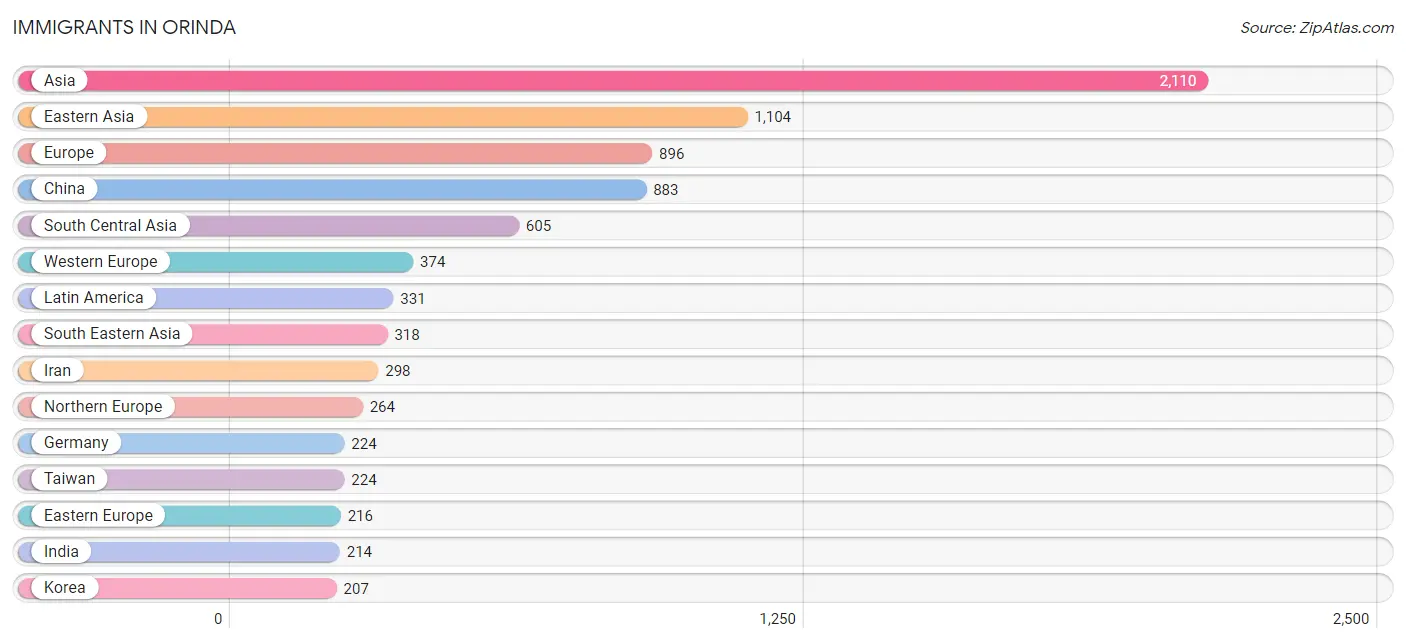
The most numerous immigrant groups reported in Orinda came from Asia (2,110 | 10.8%), Eastern Asia (1,104 | 5.7%), Europe (896 | 4.6%), China (883 | 4.5%), and South Central Asia (605 | 3.1%), together accounting for 28.7% of all Orinda residents.
| Immigration Origin | # Population | % Population |
| Africa | 83 | 0.4% |
| Argentina | 83 | 0.4% |
| Asia | 2,110 | 10.8% |
| Australia | 16 | 0.1% |
| Belgium | 9 | 0.1% |
| Bolivia | 10 | 0.1% |
| Brazil | 10 | 0.1% |
| Canada | 113 | 0.6% |
| Caribbean | 15 | 0.1% |
| Central America | 177 | 0.9% |
| China | 883 | 4.5% |
| Costa Rica | 15 | 0.1% |
| Croatia | 35 | 0.2% |
| Czechoslovakia | 12 | 0.1% |
| Denmark | 10 | 0.1% |
| Dominican Republic | 15 | 0.1% |
| Eastern Asia | 1,104 | 5.7% |
| Eastern Europe | 216 | 1.1% |
| Ecuador | 24 | 0.1% |
| Egypt | 43 | 0.2% |
| El Salvador | 62 | 0.3% |
| England | 24 | 0.1% |
| Europe | 896 | 4.6% |
| Fiji | 16 | 0.1% |
| France | 96 | 0.5% |
| Germany | 224 | 1.1% |
| Ghana | 40 | 0.2% |
| Greece | 12 | 0.1% |
| Honduras | 89 | 0.5% |
| Hong Kong | 194 | 1.0% |
| Hungary | 19 | 0.1% |
| India | 214 | 1.1% |
| Iran | 298 | 1.5% |
| Iraq | 12 | 0.1% |
| Ireland | 57 | 0.3% |
| Israel | 27 | 0.1% |
| Italy | 14 | 0.1% |
| Japan | 14 | 0.1% |
| Korea | 207 | 1.1% |
| Laos | 9 | 0.1% |
| Latin America | 331 | 1.7% |
| Latvia | 17 | 0.1% |
| Mexico | 11 | 0.1% |
| Moldova | 4 | 0.0% |
| Netherlands | 19 | 0.1% |
| Northern Africa | 43 | 0.2% |
| Northern Europe | 264 | 1.4% |
| Norway | 9 | 0.1% |
| Oceania | 32 | 0.2% |
| Pakistan | 48 | 0.3% |
| Philippines | 95 | 0.5% |
| Romania | 21 | 0.1% |
| Russia | 102 | 0.5% |
| Scotland | 20 | 0.1% |
| Singapore | 9 | 0.1% |
| South America | 139 | 0.7% |
| South Central Asia | 605 | 3.1% |
| South Eastern Asia | 318 | 1.6% |
| Southern Europe | 42 | 0.2% |
| Sri Lanka | 14 | 0.1% |
| Sweden | 9 | 0.1% |
| Switzerland | 26 | 0.1% |
| Taiwan | 224 | 1.1% |
| Turkey | 44 | 0.2% |
| Uzbekistan | 31 | 0.2% |
| Vietnam | 205 | 1.1% |
| Western Africa | 40 | 0.2% |
| Western Asia | 83 | 0.4% |
| Western Europe | 374 | 1.9% | View All 69 Rows |
Sex and Age in Orinda
Sex and Age in Orinda
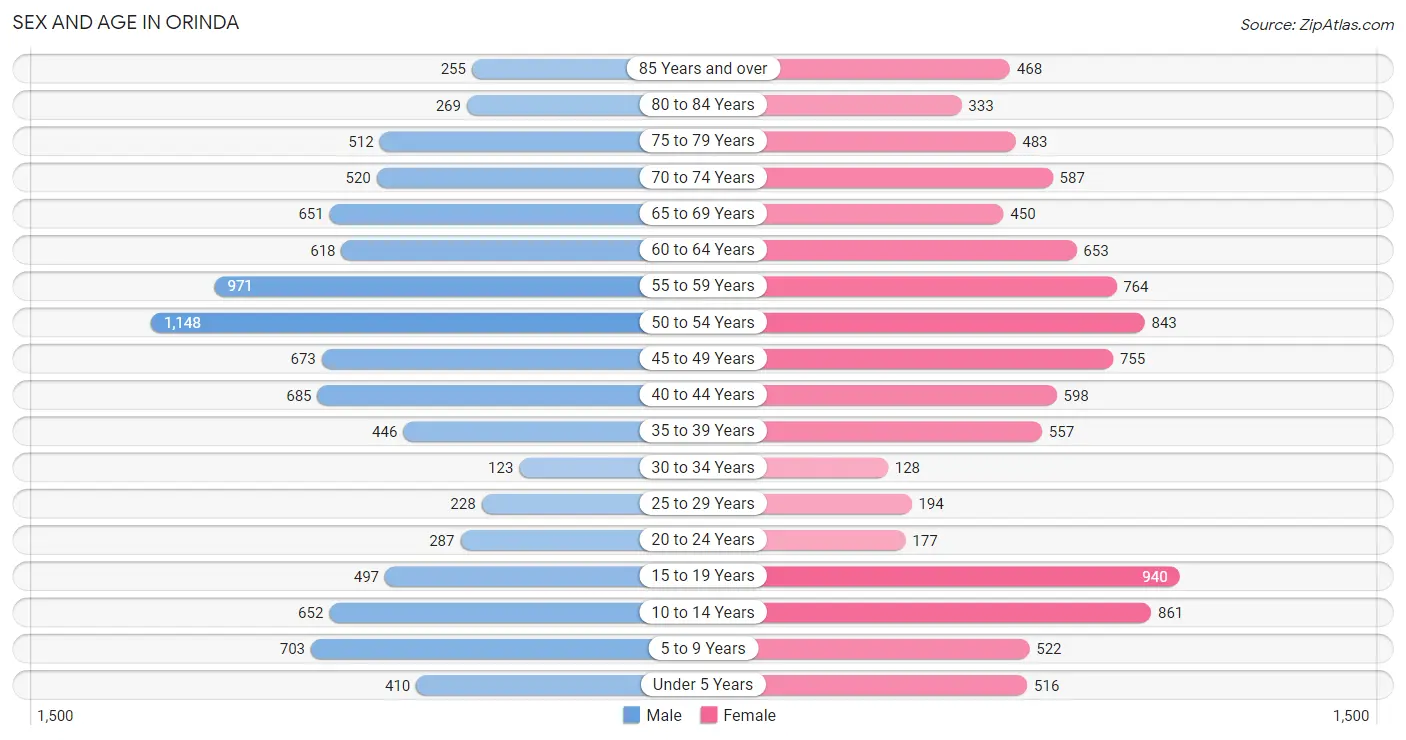
The most populous age groups in Orinda are 50 to 54 Years (1,148 | 11.9%) for men and 15 to 19 Years (940 | 9.6%) for women.
| Age Bracket | Male | Female |
| Under 5 Years | 410 (4.3%) | 516 (5.2%) |
| 5 to 9 Years | 703 (7.3%) | 522 (5.3%) |
| 10 to 14 Years | 652 (6.8%) | 861 (8.8%) |
| 15 to 19 Years | 497 (5.1%) | 940 (9.6%) |
| 20 to 24 Years | 287 (3.0%) | 177 (1.8%) |
| 25 to 29 Years | 228 (2.4%) | 194 (2.0%) |
| 30 to 34 Years | 123 (1.3%) | 128 (1.3%) |
| 35 to 39 Years | 446 (4.6%) | 557 (5.7%) |
| 40 to 44 Years | 685 (7.1%) | 598 (6.1%) |
| 45 to 49 Years | 673 (7.0%) | 755 (7.7%) |
| 50 to 54 Years | 1,148 (11.9%) | 843 (8.6%) |
| 55 to 59 Years | 971 (10.1%) | 764 (7.8%) |
| 60 to 64 Years | 618 (6.4%) | 653 (6.6%) |
| 65 to 69 Years | 651 (6.8%) | 450 (4.6%) |
| 70 to 74 Years | 520 (5.4%) | 587 (6.0%) |
| 75 to 79 Years | 512 (5.3%) | 483 (4.9%) |
| 80 to 84 Years | 269 (2.8%) | 333 (3.4%) |
| 85 Years and over | 255 (2.6%) | 468 (4.8%) |
| Total | 9,648 (100.0%) | 9,829 (100.0%) |
Families and Households in Orinda
Median Family Size in Orinda
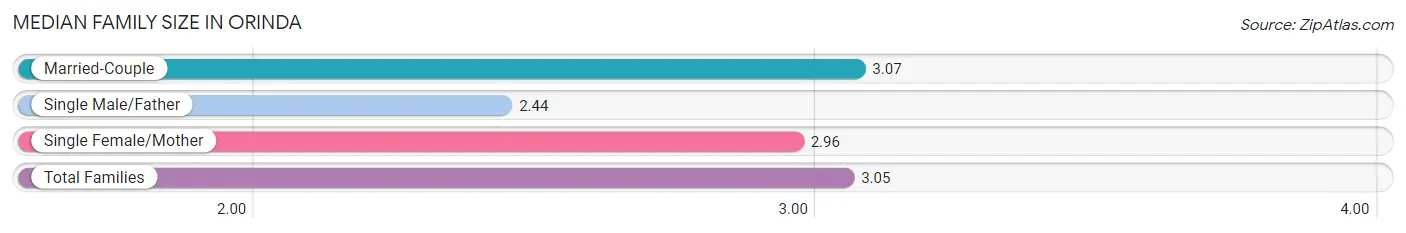
The median family size in Orinda is 3.05 persons per family, with married-couple families (5,071 | 91.8%) accounting for the largest median family size of 3.07 persons per family. On the other hand, single male/father families (188 | 3.4%) represent the smallest median family size with 2.44 persons per family.
| Family Type | # Families | Family Size |
| Married-Couple | 5,071 (91.8%) | 3.07 |
| Single Male/Father | 188 (3.4%) | 2.44 |
| Single Female/Mother | 262 (4.8%) | 2.96 |
| Total Families | 5,521 (100.0%) | 3.05 |
Median Household Size in Orinda
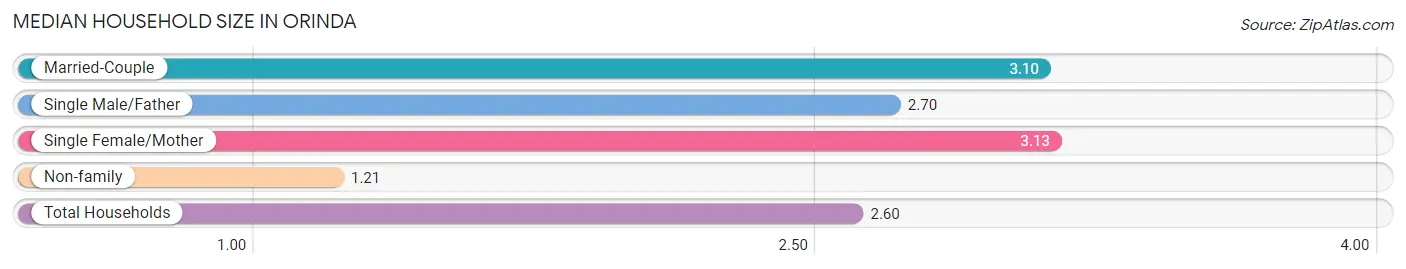
The median household size in Orinda is 2.60 persons per household, with single female/mother households (262 | 3.5%) accounting for the largest median household size of 3.13 persons per household. non-family households (1,955 | 26.2%) represent the smallest median household size with 1.21 persons per household.
| Household Type | # Households | Household Size |
| Married-Couple | 5,071 (67.8%) | 3.10 |
| Single Male/Father | 188 (2.5%) | 2.70 |
| Single Female/Mother | 262 (3.5%) | 3.13 |
| Non-family | 1,955 (26.2%) | 1.21 |
| Total Households | 7,476 (100.0%) | 2.60 |
Household Size by Marriage Status in Orinda
Out of a total of 7,476 households in Orinda, 5,521 (73.9%) are family households, while 1,955 (26.2%) are nonfamily households. The most numerous type of family households are 2-person households, comprising 2,307, and the most common type of nonfamily households are 1-person households, comprising 1,550.
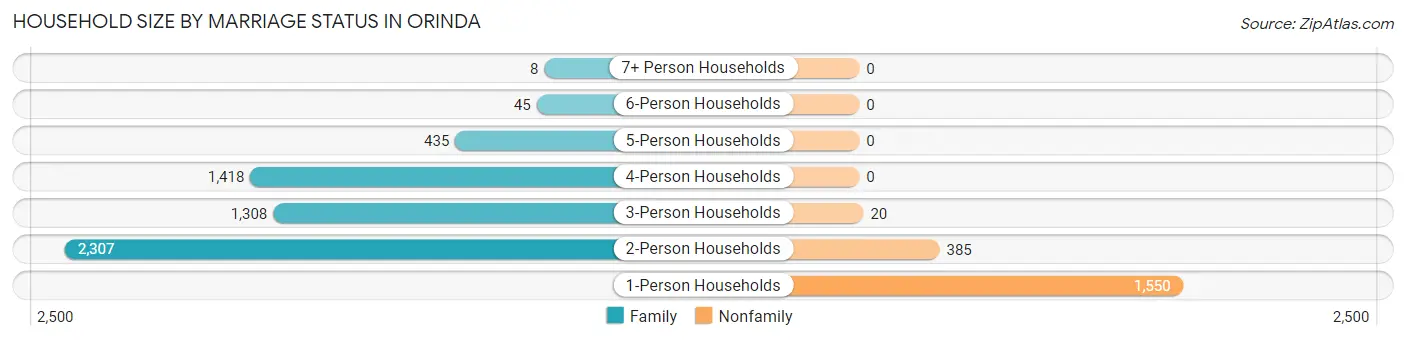
| Household Size | Family Households | Nonfamily Households |
| 1-Person Households | - | 1,550 (20.7%) |
| 2-Person Households | 2,307 (30.9%) | 385 (5.1%) |
| 3-Person Households | 1,308 (17.5%) | 20 (0.3%) |
| 4-Person Households | 1,418 (19.0%) | 0 (0.0%) |
| 5-Person Households | 435 (5.8%) | 0 (0.0%) |
| 6-Person Households | 45 (0.6%) | 0 (0.0%) |
| 7+ Person Households | 8 (0.1%) | 0 (0.0%) |
| Total | 5,521 (73.9%) | 1,955 (26.2%) |
Female Fertility in Orinda
Fertility by Age in Orinda
Average fertility rate in Orinda is 30.0 births per 1,000 women. Women in the age bracket of 20 to 34 years have the highest fertility rate with 76.0 births per 1,000 women. Women in the age bracket of 35 to 50 years acount for 63.1% of all women with births.
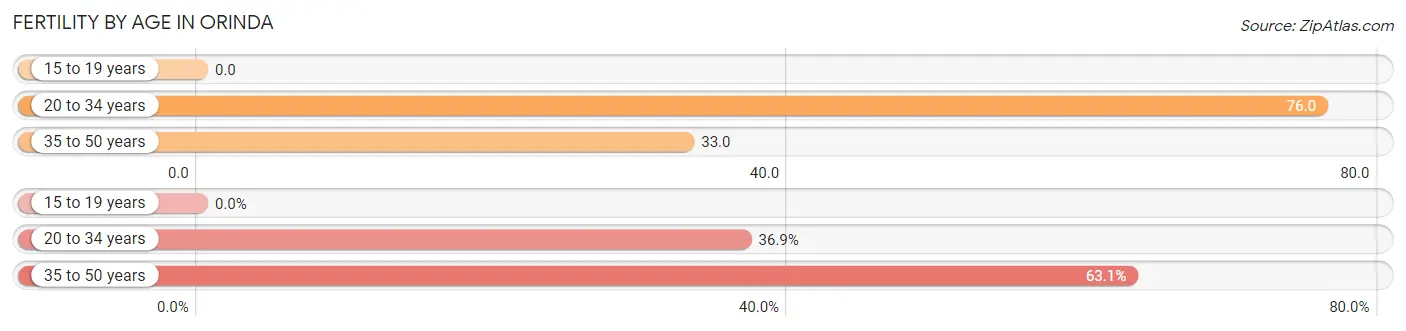
| Age Bracket | Women with Births | Births / 1,000 Women |
| 15 to 19 years | 0 (0.0%) | 0.0 |
| 20 to 34 years | 38 (36.9%) | 76.0 |
| 35 to 50 years | 65 (63.1%) | 33.0 |
| Total | 103 (100.0%) | 30.0 |
Fertility by Age by Marriage Status in Orinda
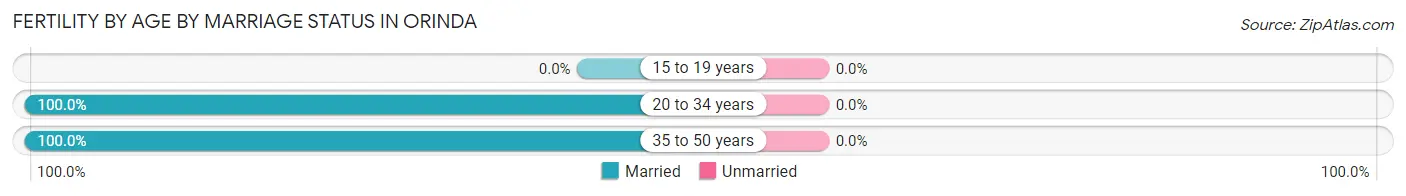
| Age Bracket | Married | Unmarried |
| 15 to 19 years | 0 (0.0%) | 0 (0.0%) |
| 20 to 34 years | 38 (100.0%) | 0 (0.0%) |
| 35 to 50 years | 65 (100.0%) | 0 (0.0%) |
| Total | 103 (100.0%) | 0 (0.0%) |
Fertility by Education in Orinda
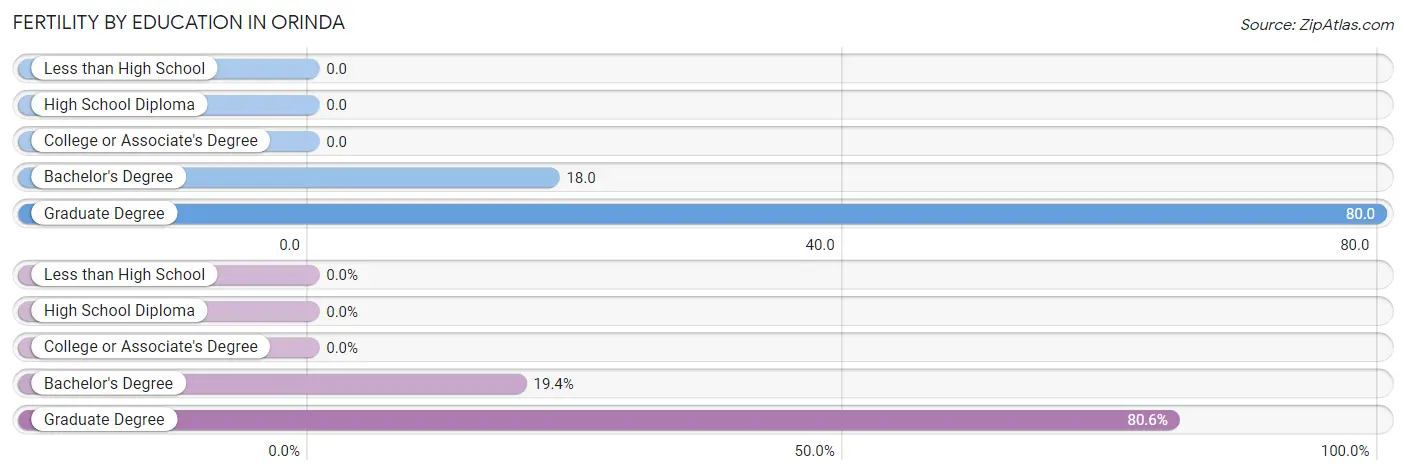
| Educational Attainment | Women with Births | Births / 1,000 Women |
| Less than High School | 0 (0.0%) | 0.0 |
| High School Diploma | 0 (0.0%) | 0.0 |
| College or Associate's Degree | 0 (0.0%) | 0.0 |
| Bachelor's Degree | 20 (19.4%) | 18.0 |
| Graduate Degree | 83 (80.6%) | 80.0 |
| Total | 103 (100.0%) | 30.0 |
Fertility by Education by Marriage Status in Orinda
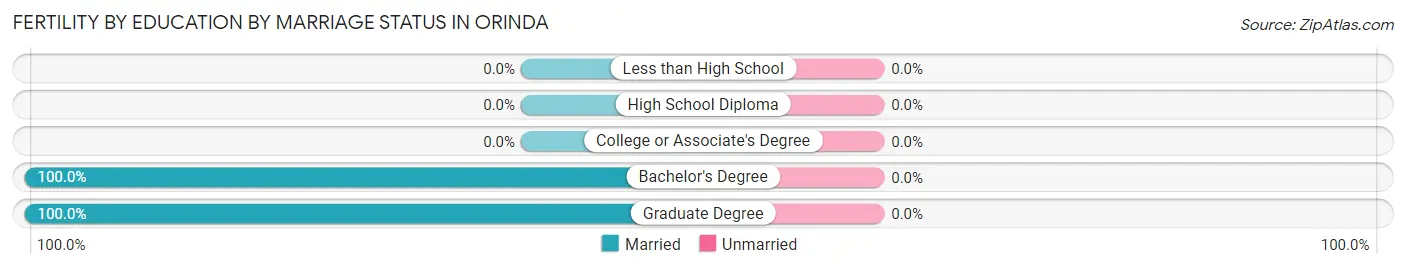
| Educational Attainment | Married | Unmarried |
| Less than High School | 0 (0.0%) | 0 (0.0%) |
| High School Diploma | 0 (0.0%) | 0 (0.0%) |
| College or Associate's Degree | 0 (0.0%) | 0 (0.0%) |
| Bachelor's Degree | 20 (100.0%) | 0 (0.0%) |
| Graduate Degree | 83 (100.0%) | 0 (0.0%) |
| Total | 103 (100.0%) | 0 (0.0%) |
Employment Characteristics in Orinda
Employment by Class of Employer in Orinda
Among the 8,919 employed individuals in Orinda, private company employees (5,780 | 64.8%), self-employed (not incorporated) (927 | 10.4%), and self-employed (incorporated) (798 | 8.9%) make up the most common classes of employment.
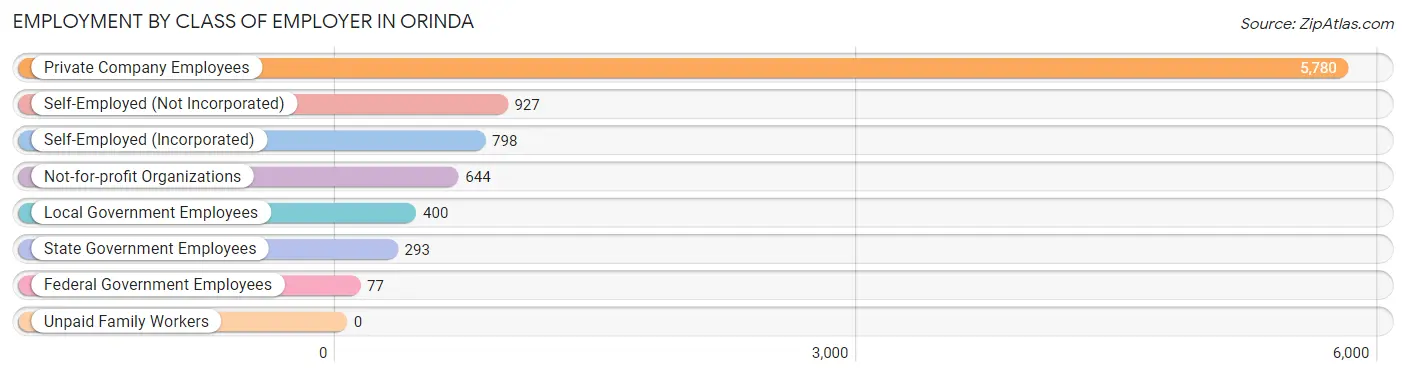
| Employer Class | # Employees | % Employees |
| Private Company Employees | 5,780 | 64.8% |
| Self-Employed (Incorporated) | 798 | 8.9% |
| Self-Employed (Not Incorporated) | 927 | 10.4% |
| Not-for-profit Organizations | 644 | 7.2% |
| Local Government Employees | 400 | 4.5% |
| State Government Employees | 293 | 3.3% |
| Federal Government Employees | 77 | 0.9% |
| Unpaid Family Workers | 0 | 0.0% |
| Total | 8,919 | 100.0% |
Employment Status by Age in Orinda
According to the labor force statistics for Orinda, out of the total population over 16 years of age (15,480), 60.0% or 9,288 individuals are in the labor force, with 3.3% or 307 of them unemployed. The age group with the highest labor force participation rate is 25 to 29 years, with 91.5% or 386 individuals in the labor force. Within the labor force, the 16 to 19 years age range has the highest percentage of unemployed individuals, with 22.8% or 61 of them being unemployed.
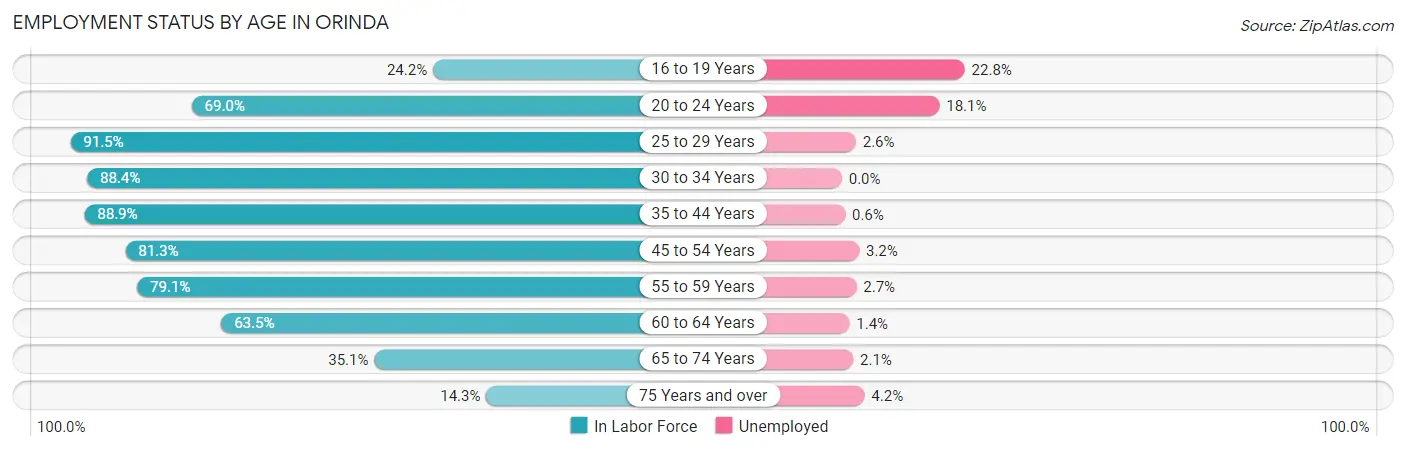
| Age Bracket | In Labor Force | Unemployed |
| 16 to 19 Years | 267 (24.2%) | 61 (22.8%) |
| 20 to 24 Years | 320 (69.0%) | 58 (18.1%) |
| 25 to 29 Years | 386 (91.5%) | 10 (2.6%) |
| 30 to 34 Years | 222 (88.4%) | 0 (0.0%) |
| 35 to 44 Years | 2,032 (88.9%) | 12 (0.6%) |
| 45 to 54 Years | 2,780 (81.3%) | 89 (3.2%) |
| 55 to 59 Years | 1,372 (79.1%) | 37 (2.7%) |
| 60 to 64 Years | 807 (63.5%) | 11 (1.4%) |
| 65 to 74 Years | 775 (35.1%) | 16 (2.1%) |
| 75 Years and over | 332 (14.3%) | 14 (4.2%) |
| Total | 9,288 (60.0%) | 307 (3.3%) |
Employment Status by Educational Attainment in Orinda
According to labor force statistics for Orinda, 81.0% of individuals (7,601) out of the total population between 25 and 64 years of age (9,384) are in the labor force, with 2.1% or 160 of them being unemployed. The group with the highest labor force participation rate are those with the educational attainment of high school diploma, with 82.6% or 157 individuals in the labor force. Within the labor force, individuals with less than high school education have the highest percentage of unemployment, with 36.2% or 25 of them being unemployed.
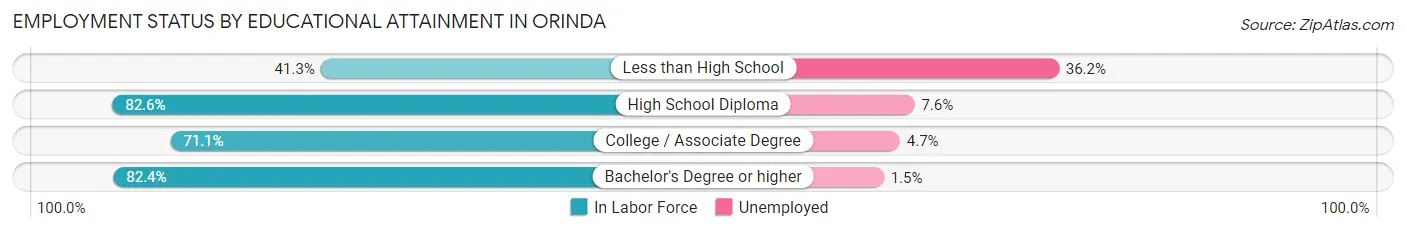
| Educational Attainment | In Labor Force | Unemployed |
| Less than High School | 69 (41.3%) | 60 (36.2%) |
| High School Diploma | 157 (82.6%) | 14 (7.6%) |
| College / Associate Degree | 379 (71.1%) | 25 (4.7%) |
| Bachelor's Degree or higher | 6,999 (82.4%) | 127 (1.5%) |
| Total | 7,601 (81.0%) | 197 (2.1%) |
Employment Occupations by Sex in Orinda
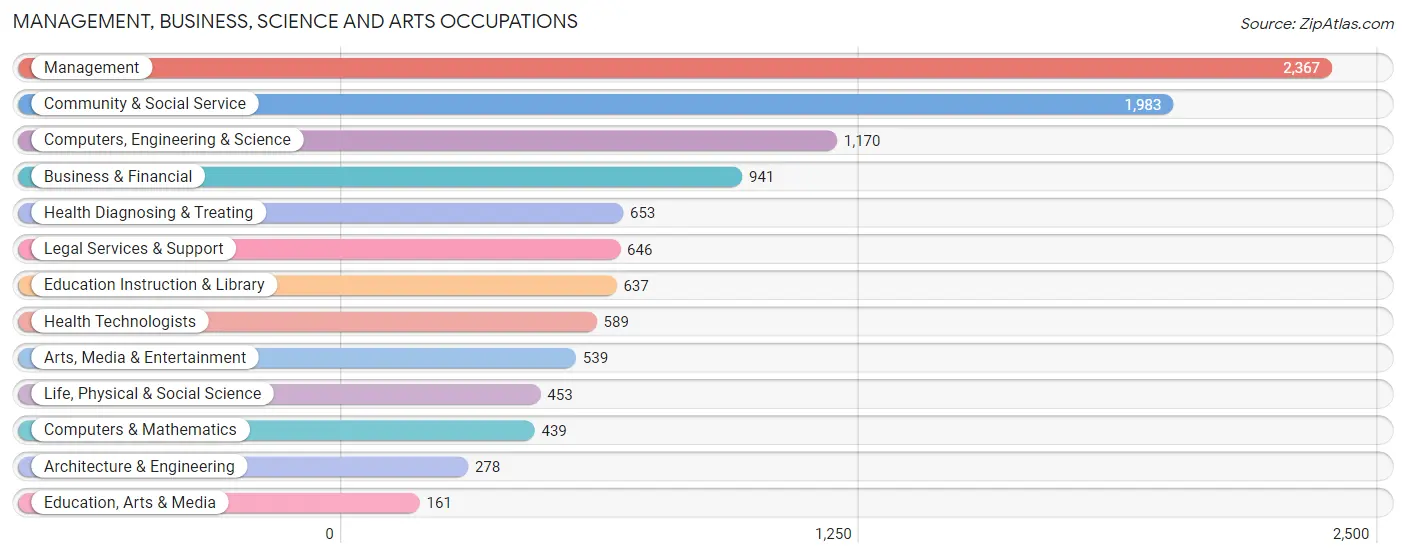
Management, Business, Science and Arts Occupations
The most common Management, Business, Science and Arts occupations in Orinda are Management (2,367 | 26.3%), Community & Social Service (1,983 | 22.1%), Computers, Engineering & Science (1,170 | 13.0%), Business & Financial (941 | 10.5%), and Health Diagnosing & Treating (653 | 7.3%).
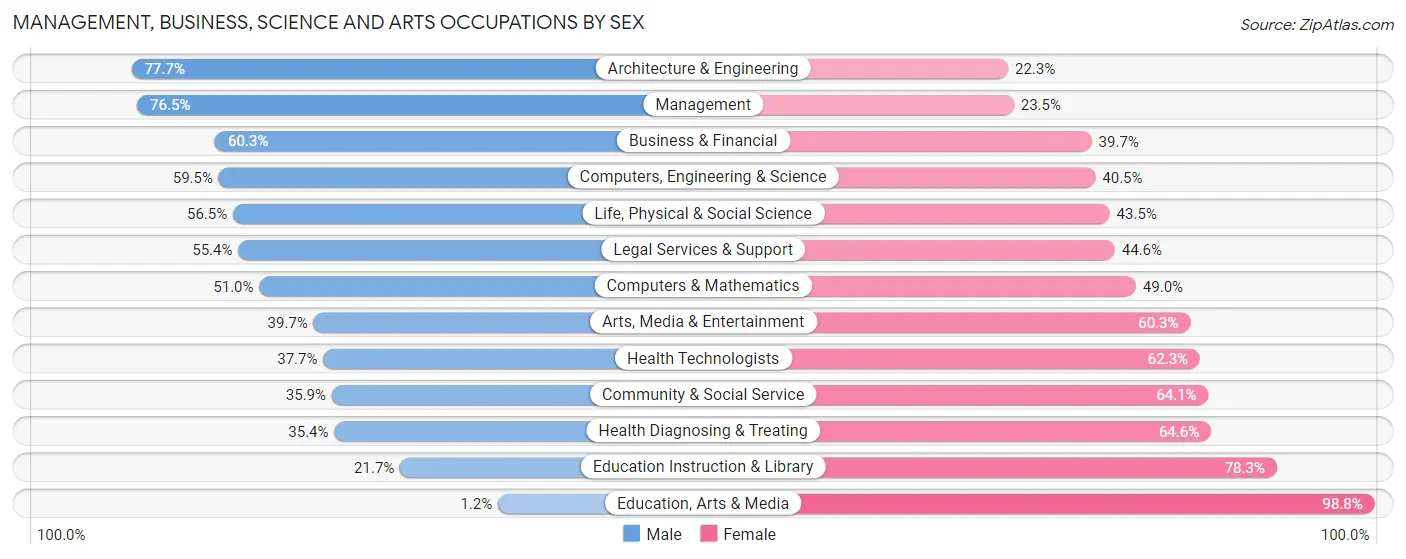
Management, Business, Science and Arts Occupations by Sex
Within the Management, Business, Science and Arts occupations in Orinda, the most male-oriented occupations are Architecture & Engineering (77.7%), Management (76.5%), and Business & Financial (60.3%), while the most female-oriented occupations are Education, Arts & Media (98.8%), Education Instruction & Library (78.3%), and Health Diagnosing & Treating (64.6%).
| Occupation | Male | Female |
| Management | 1,811 (76.5%) | 556 (23.5%) |
| Business & Financial | 567 (60.3%) | 374 (39.7%) |
| Computers, Engineering & Science | 696 (59.5%) | 474 (40.5%) |
| Computers & Mathematics | 224 (51.0%) | 215 (49.0%) |
| Architecture & Engineering | 216 (77.7%) | 62 (22.3%) |
| Life, Physical & Social Science | 256 (56.5%) | 197 (43.5%) |
| Community & Social Service | 712 (35.9%) | 1,271 (64.1%) |
| Education, Arts & Media | 2 (1.2%) | 159 (98.8%) |
| Legal Services & Support | 358 (55.4%) | 288 (44.6%) |
| Education Instruction & Library | 138 (21.7%) | 499 (78.3%) |
| Arts, Media & Entertainment | 214 (39.7%) | 325 (60.3%) |
| Health Diagnosing & Treating | 231 (35.4%) | 422 (64.6%) |
| Health Technologists | 222 (37.7%) | 367 (62.3%) |
| Total (Category) | 4,017 (56.5%) | 3,097 (43.5%) |
| Total (Overall) | 5,312 (59.1%) | 3,673 (40.9%) |
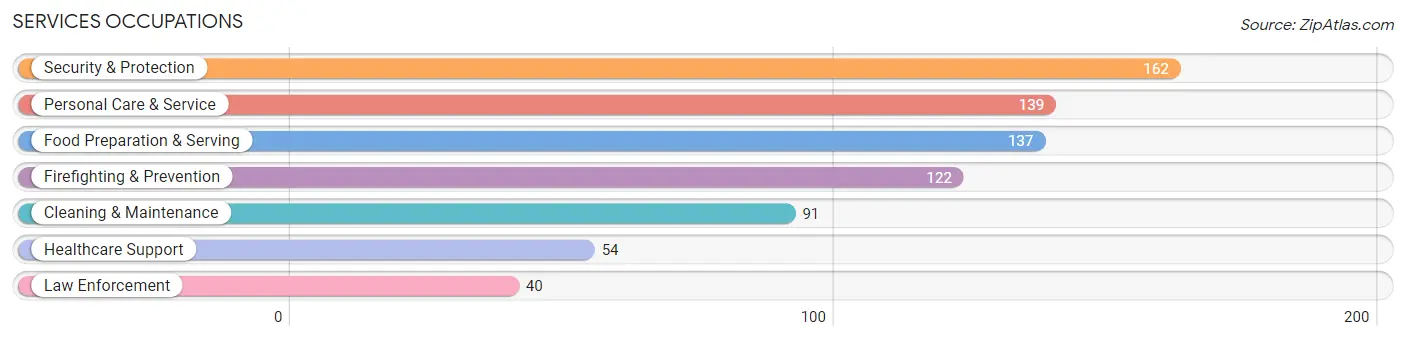
Services Occupations
The most common Services occupations in Orinda are Security & Protection (162 | 1.8%), Personal Care & Service (139 | 1.5%), Food Preparation & Serving (137 | 1.5%), Firefighting & Prevention (122 | 1.4%), and Cleaning & Maintenance (91 | 1.0%).
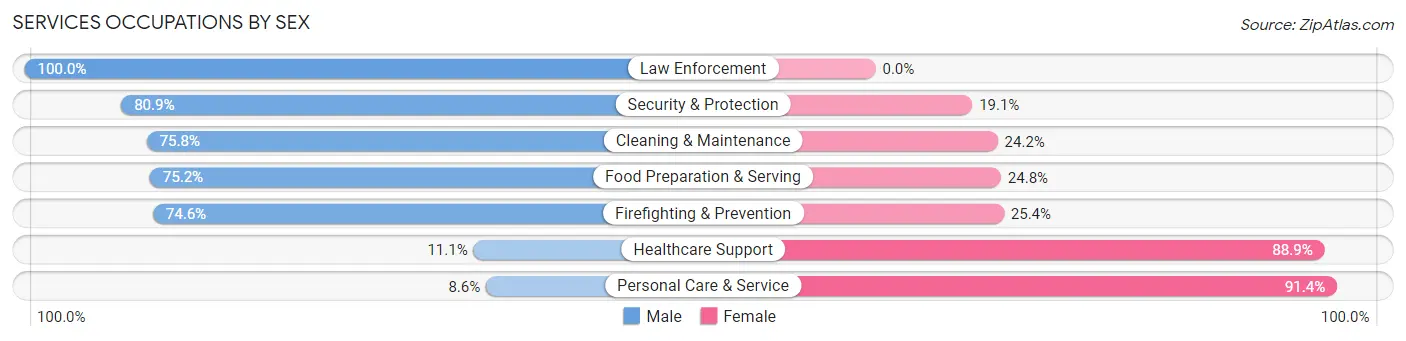
Services Occupations by Sex
Within the Services occupations in Orinda, the most male-oriented occupations are Law Enforcement (100.0%), Security & Protection (80.9%), and Cleaning & Maintenance (75.8%), while the most female-oriented occupations are Personal Care & Service (91.4%), Healthcare Support (88.9%), and Firefighting & Prevention (25.4%).
| Occupation | Male | Female |
| Healthcare Support | 6 (11.1%) | 48 (88.9%) |
| Security & Protection | 131 (80.9%) | 31 (19.1%) |
| Firefighting & Prevention | 91 (74.6%) | 31 (25.4%) |
| Law Enforcement | 40 (100.0%) | 0 (0.0%) |
| Food Preparation & Serving | 103 (75.2%) | 34 (24.8%) |
| Cleaning & Maintenance | 69 (75.8%) | 22 (24.2%) |
| Personal Care & Service | 12 (8.6%) | 127 (91.4%) |
| Total (Category) | 321 (55.1%) | 262 (44.9%) |
| Total (Overall) | 5,312 (59.1%) | 3,673 (40.9%) |
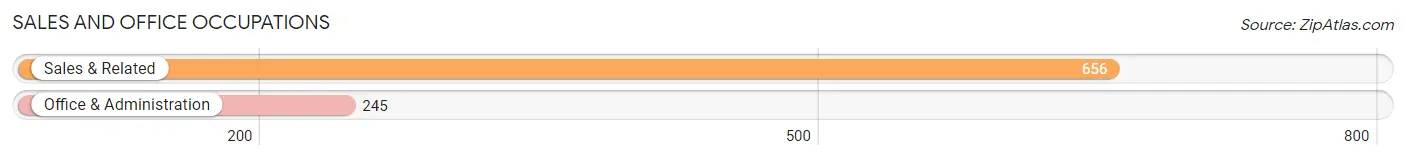
Sales and Office Occupations
The most common Sales and Office occupations in Orinda are Sales & Related (656 | 7.3%), and Office & Administration (245 | 2.7%).
Sales and Office Occupations by Sex
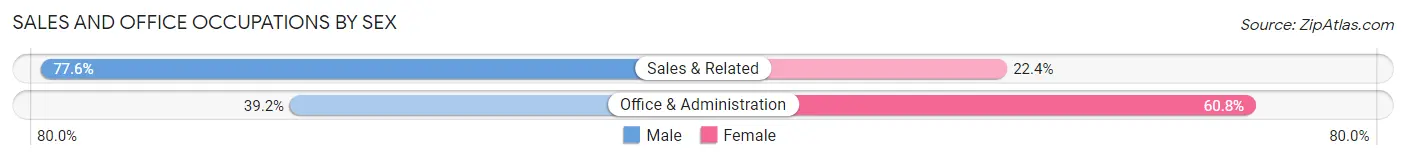
| Occupation | Male | Female |
| Sales & Related | 509 (77.6%) | 147 (22.4%) |
| Office & Administration | 96 (39.2%) | 149 (60.8%) |
| Total (Category) | 605 (67.1%) | 296 (32.9%) |
| Total (Overall) | 5,312 (59.1%) | 3,673 (40.9%) |
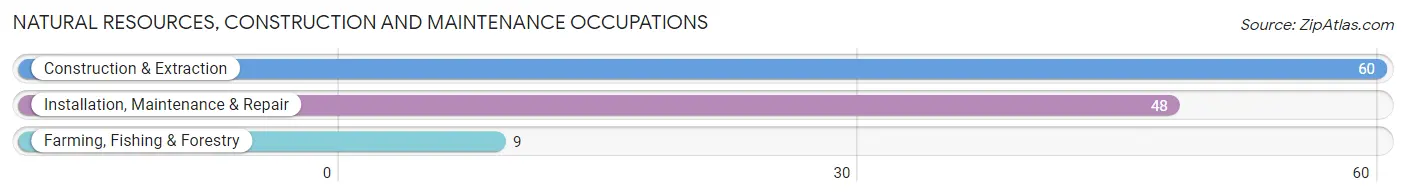
Natural Resources, Construction and Maintenance Occupations
The most common Natural Resources, Construction and Maintenance occupations in Orinda are Construction & Extraction (60 | 0.7%), Installation, Maintenance & Repair (48 | 0.5%), and Farming, Fishing & Forestry (9 | 0.1%).
Natural Resources, Construction and Maintenance Occupations by Sex
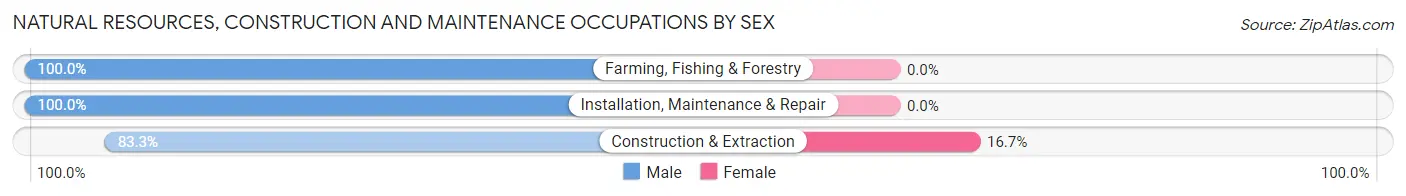
| Occupation | Male | Female |
| Farming, Fishing & Forestry | 9 (100.0%) | 0 (0.0%) |
| Construction & Extraction | 50 (83.3%) | 10 (16.7%) |
| Installation, Maintenance & Repair | 48 (100.0%) | 0 (0.0%) |
| Total (Category) | 107 (91.4%) | 10 (8.6%) |
| Total (Overall) | 5,312 (59.1%) | 3,673 (40.9%) |
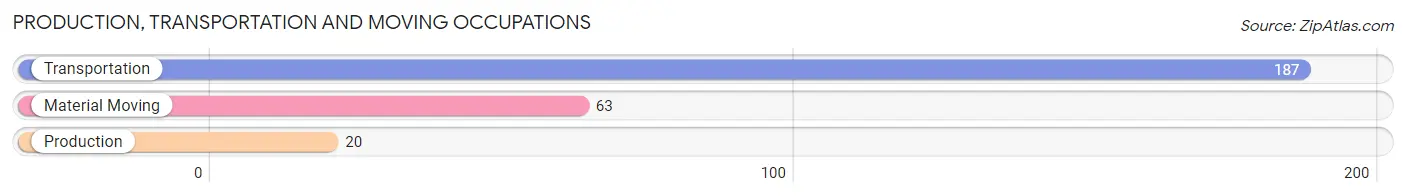
Production, Transportation and Moving Occupations
The most common Production, Transportation and Moving occupations in Orinda are Transportation (187 | 2.1%), Material Moving (63 | 0.7%), and Production (20 | 0.2%).
Production, Transportation and Moving Occupations by Sex
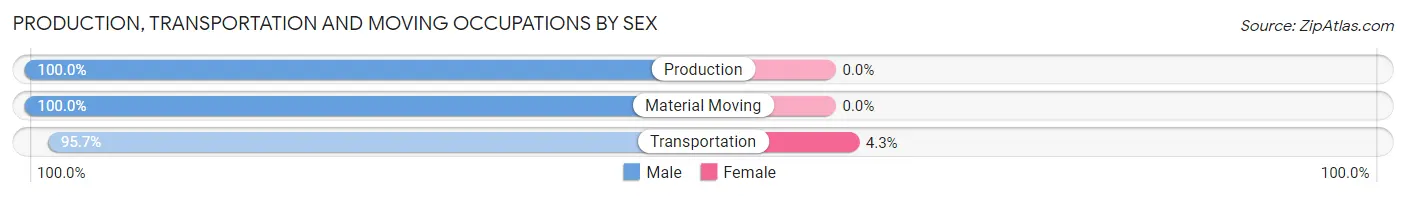
| Occupation | Male | Female |
| Production | 20 (100.0%) | 0 (0.0%) |
| Transportation | 179 (95.7%) | 8 (4.3%) |
| Material Moving | 63 (100.0%) | 0 (0.0%) |
| Total (Category) | 262 (97.0%) | 8 (3.0%) |
| Total (Overall) | 5,312 (59.1%) | 3,673 (40.9%) |
Employment Industries by Sex in Orinda
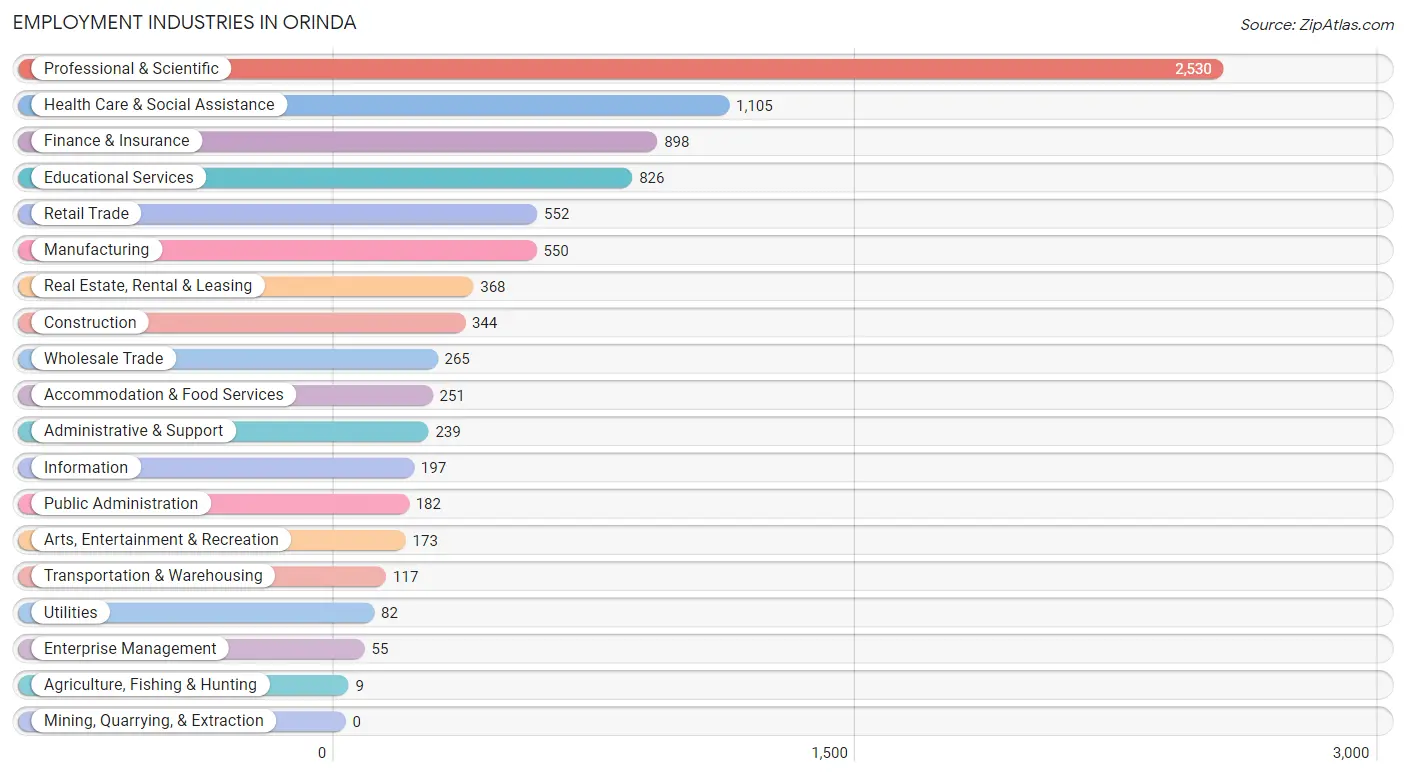
Employment Industries in Orinda
The major employment industries in Orinda include Professional & Scientific (2,530 | 28.2%), Health Care & Social Assistance (1,105 | 12.3%), Finance & Insurance (898 | 10.0%), Educational Services (826 | 9.2%), and Retail Trade (552 | 6.1%).
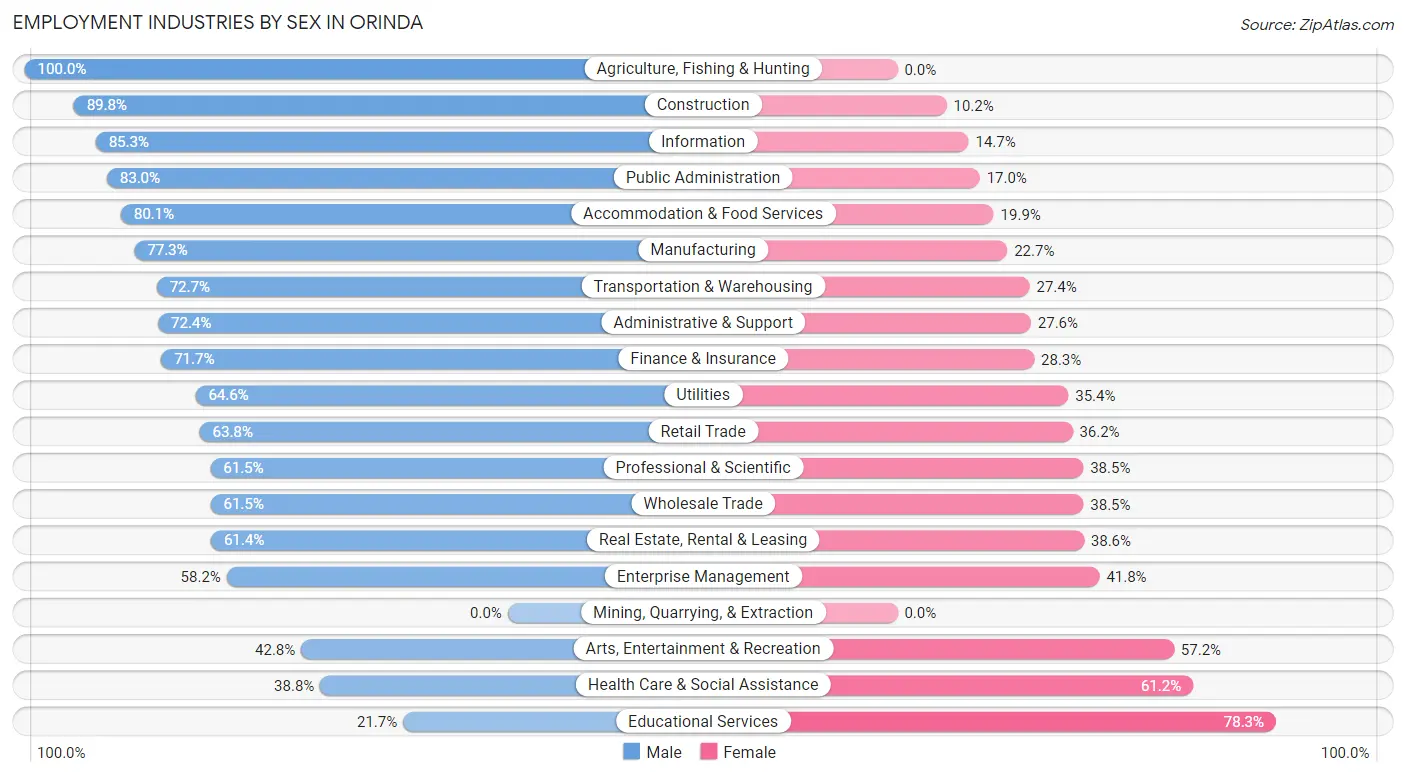
Employment Industries by Sex in Orinda
The Orinda industries that see more men than women are Agriculture, Fishing & Hunting (100.0%), Construction (89.8%), and Information (85.3%), whereas the industries that tend to have a higher number of women are Educational Services (78.3%), Health Care & Social Assistance (61.2%), and Arts, Entertainment & Recreation (57.2%).
| Industry | Male | Female |
| Agriculture, Fishing & Hunting | 9 (100.0%) | 0 (0.0%) |
| Mining, Quarrying, & Extraction | 0 (0.0%) | 0 (0.0%) |
| Construction | 309 (89.8%) | 35 (10.2%) |
| Manufacturing | 425 (77.3%) | 125 (22.7%) |
| Wholesale Trade | 163 (61.5%) | 102 (38.5%) |
| Retail Trade | 352 (63.8%) | 200 (36.2%) |
| Transportation & Warehousing | 85 (72.7%) | 32 (27.4%) |
| Utilities | 53 (64.6%) | 29 (35.4%) |
| Information | 168 (85.3%) | 29 (14.7%) |
| Finance & Insurance | 644 (71.7%) | 254 (28.3%) |
| Real Estate, Rental & Leasing | 226 (61.4%) | 142 (38.6%) |
| Professional & Scientific | 1,557 (61.5%) | 973 (38.5%) |
| Enterprise Management | 32 (58.2%) | 23 (41.8%) |
| Administrative & Support | 173 (72.4%) | 66 (27.6%) |
| Educational Services | 179 (21.7%) | 647 (78.3%) |
| Health Care & Social Assistance | 429 (38.8%) | 676 (61.2%) |
| Arts, Entertainment & Recreation | 74 (42.8%) | 99 (57.2%) |
| Accommodation & Food Services | 201 (80.1%) | 50 (19.9%) |
| Public Administration | 151 (83.0%) | 31 (17.0%) |
| Total | 5,312 (59.1%) | 3,673 (40.9%) |
Education in Orinda
School Enrollment in Orinda
The most common levels of schooling among the 5,298 students in Orinda are high school (1,450 | 27.4%), middle school (1,209 | 22.8%), and elementary school (872 | 16.5%).
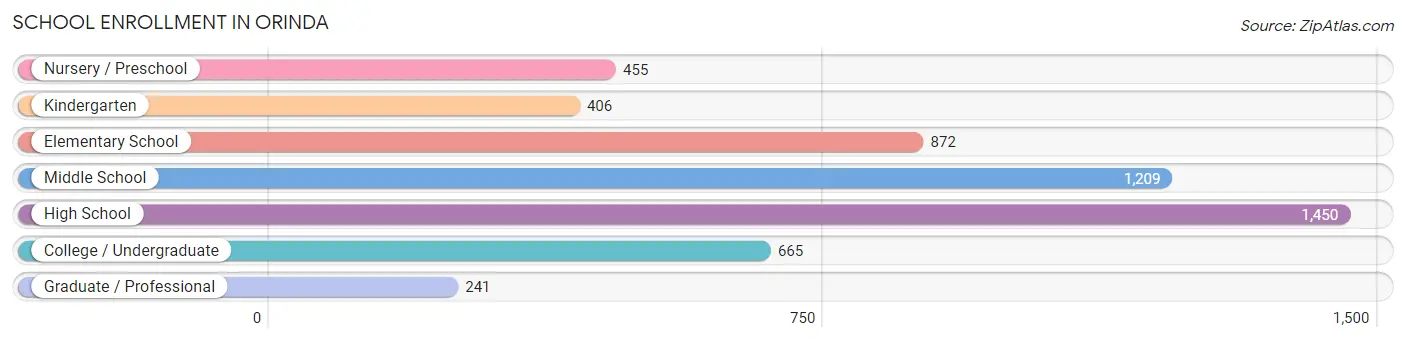
| School Level | # Students | % Students |
| Nursery / Preschool | 455 | 8.6% |
| Kindergarten | 406 | 7.7% |
| Elementary School | 872 | 16.5% |
| Middle School | 1,209 | 22.8% |
| High School | 1,450 | 27.4% |
| College / Undergraduate | 665 | 12.6% |
| Graduate / Professional | 241 | 4.5% |
| Total | 5,298 | 100.0% |
School Enrollment by Age by Funding Source in Orinda
Out of a total of 5,298 students who are enrolled in schools in Orinda, 927 (17.5%) attend a private institution, while the remaining 4,371 (82.5%) are enrolled in public schools. The age group of 3 to 4 year olds has the highest likelihood of being enrolled in private schools, with 306 (92.2% in the age bracket) enrolled. Conversely, the age group of 18 to 19 year olds has the lowest likelihood of being enrolled in a private school, with 331 (100.0% in the age bracket) attending a public institution.
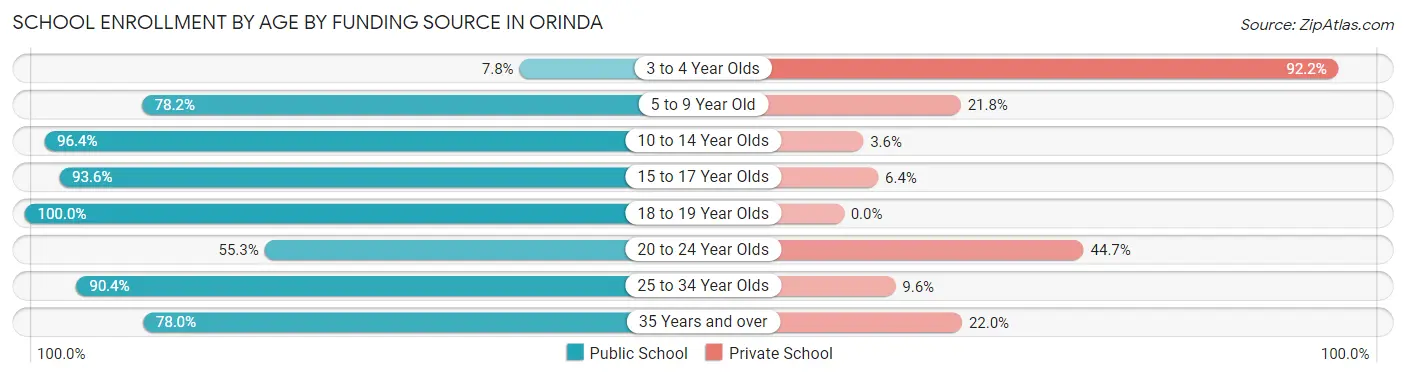
| Age Bracket | Public School | Private School |
| 3 to 4 Year Olds | 26 (7.8%) | 306 (92.2%) |
| 5 to 9 Year Old | 958 (78.2%) | 267 (21.8%) |
| 10 to 14 Year Olds | 1,458 (96.4%) | 55 (3.6%) |
| 15 to 17 Year Olds | 1,035 (93.6%) | 71 (6.4%) |
| 18 to 19 Year Olds | 331 (100.0%) | 0 (0.0%) |
| 20 to 24 Year Olds | 172 (55.3%) | 139 (44.7%) |
| 25 to 34 Year Olds | 122 (90.4%) | 13 (9.6%) |
| 35 Years and over | 269 (78.0%) | 76 (22.0%) |
| Total | 4,371 (82.5%) | 927 (17.5%) |
Educational Attainment by Field of Study in Orinda
Social sciences (2,052 | 15.7%), business (1,869 | 14.3%), engineering (1,110 | 8.5%), bio, nature & agricultural (1,064 | 8.1%), and science & technology (949 | 7.2%) are the most common fields of study among 13,097 individuals in Orinda who have obtained a bachelor's degree or higher.
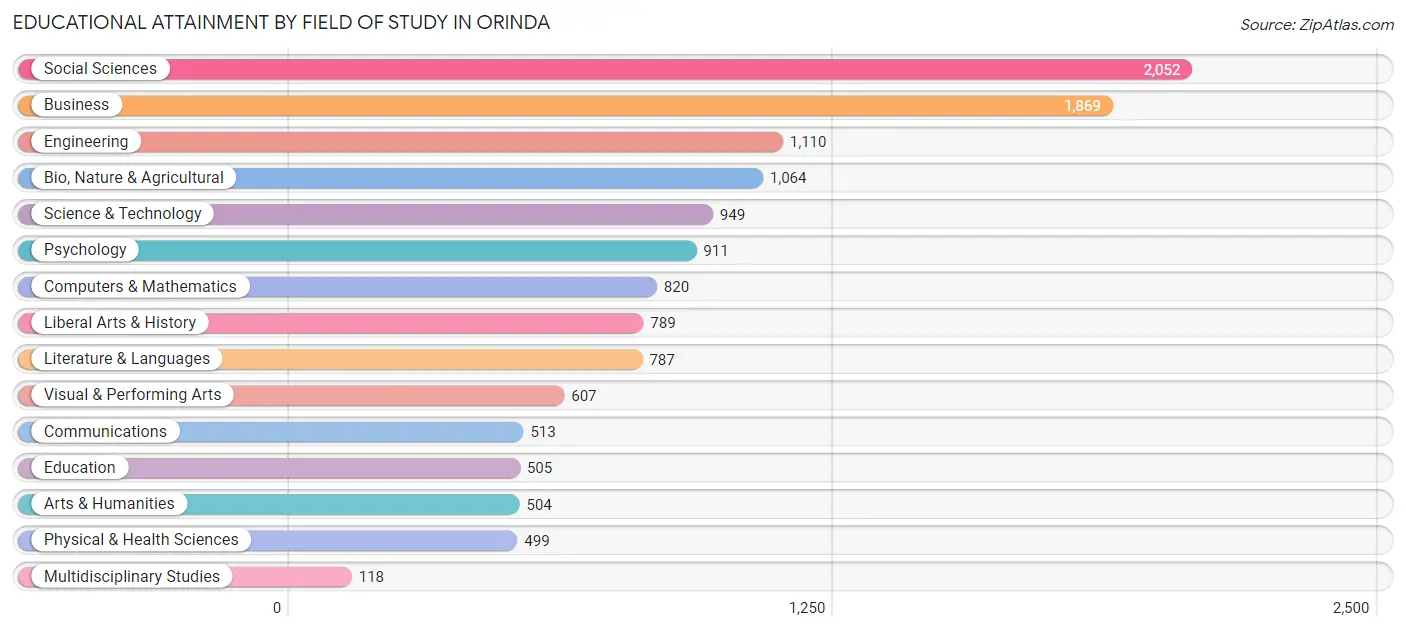
| Field of Study | # Graduates | % Graduates |
| Computers & Mathematics | 820 | 6.3% |
| Bio, Nature & Agricultural | 1,064 | 8.1% |
| Physical & Health Sciences | 499 | 3.8% |
| Psychology | 911 | 7.0% |
| Social Sciences | 2,052 | 15.7% |
| Engineering | 1,110 | 8.5% |
| Multidisciplinary Studies | 118 | 0.9% |
| Science & Technology | 949 | 7.2% |
| Business | 1,869 | 14.3% |
| Education | 505 | 3.9% |
| Literature & Languages | 787 | 6.0% |
| Liberal Arts & History | 789 | 6.0% |
| Visual & Performing Arts | 607 | 4.6% |
| Communications | 513 | 3.9% |
| Arts & Humanities | 504 | 3.8% |
| Total | 13,097 | 100.0% |
Transportation & Commute in Orinda
Vehicle Availability by Sex in Orinda
The most prevalent vehicle ownership categories in Orinda are males with 2 vehicles (2,219, accounting for 41.8%) and females with 2 vehicles (1,445, making up 61.5%).
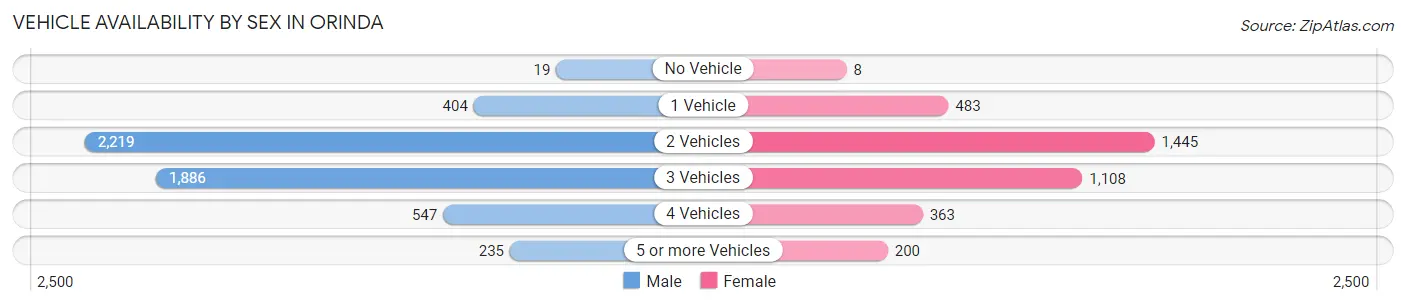
| Vehicles Available | Male | Female |
| No Vehicle | 19 (0.4%) | 8 (0.2%) |
| 1 Vehicle | 404 (7.6%) | 483 (13.4%) |
| 2 Vehicles | 2,219 (41.8%) | 1,445 (40.1%) |
| 3 Vehicles | 1,886 (35.5%) | 1,108 (30.7%) |
| 4 Vehicles | 547 (10.3%) | 363 (10.1%) |
| 5 or more Vehicles | 235 (4.4%) | 200 (5.5%) |
| Total | 5,310 (100.0%) | 3,607 (100.0%) |
Commute Time in Orinda
The most frequently occuring commute durations in Orinda are 45 to 59 minutes (1,177 commuters, 18.8%), 60 to 89 minutes (971 commuters, 15.5%), and 30 to 34 minutes (890 commuters, 14.2%).
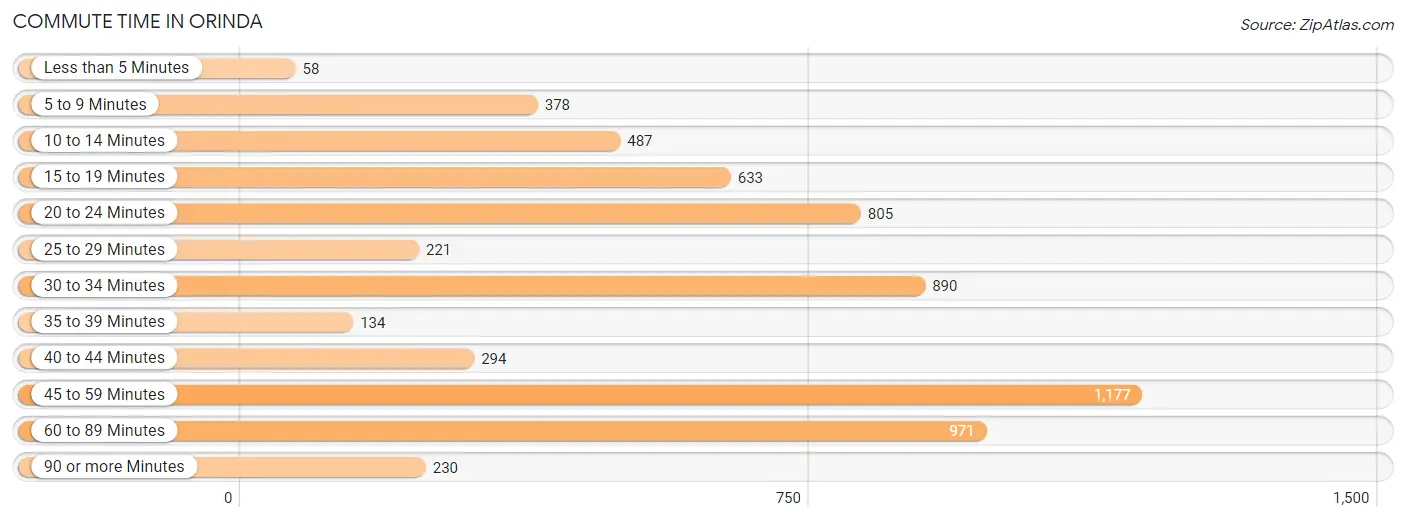
| Commute Time | # Commuters | % Commuters |
| Less than 5 Minutes | 58 | 0.9% |
| 5 to 9 Minutes | 378 | 6.0% |
| 10 to 14 Minutes | 487 | 7.8% |
| 15 to 19 Minutes | 633 | 10.1% |
| 20 to 24 Minutes | 805 | 12.8% |
| 25 to 29 Minutes | 221 | 3.5% |
| 30 to 34 Minutes | 890 | 14.2% |
| 35 to 39 Minutes | 134 | 2.1% |
| 40 to 44 Minutes | 294 | 4.7% |
| 45 to 59 Minutes | 1,177 | 18.8% |
| 60 to 89 Minutes | 971 | 15.5% |
| 90 or more Minutes | 230 | 3.7% |
Commute Time by Sex in Orinda
The most common commute times in Orinda are 45 to 59 minutes (807 commuters, 20.9%) for males and 30 to 34 minutes (401 commuters, 16.5%) for females.
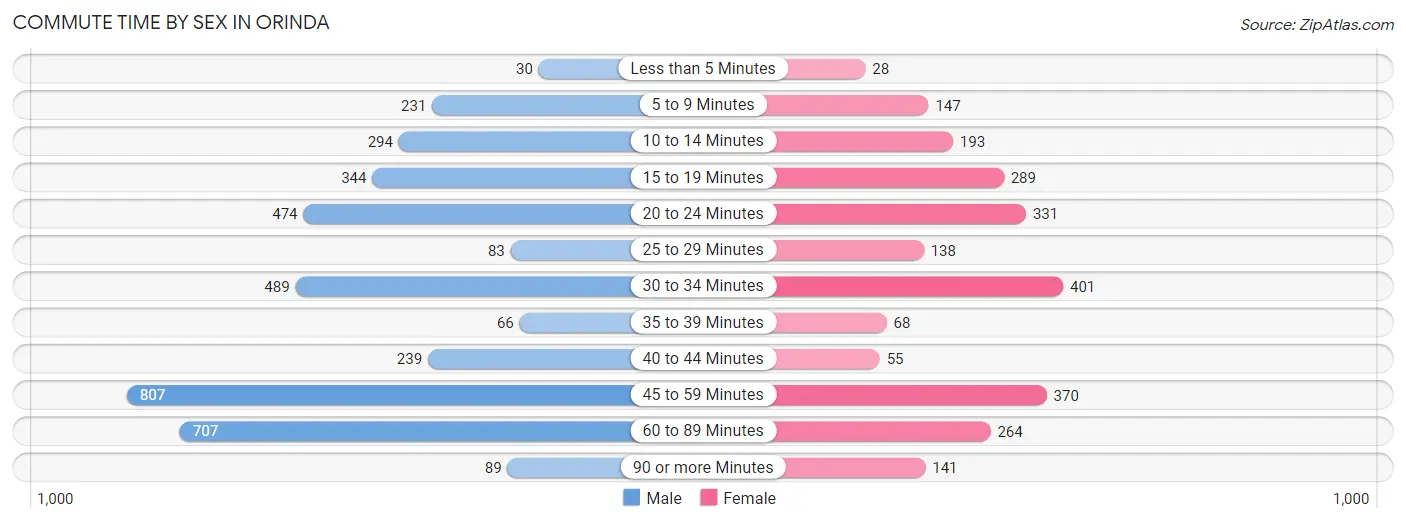
| Commute Time | Male | Female |
| Less than 5 Minutes | 30 (0.8%) | 28 (1.1%) |
| 5 to 9 Minutes | 231 (6.0%) | 147 (6.1%) |
| 10 to 14 Minutes | 294 (7.6%) | 193 (8.0%) |
| 15 to 19 Minutes | 344 (8.9%) | 289 (11.9%) |
| 20 to 24 Minutes | 474 (12.3%) | 331 (13.7%) |
| 25 to 29 Minutes | 83 (2.1%) | 138 (5.7%) |
| 30 to 34 Minutes | 489 (12.7%) | 401 (16.5%) |
| 35 to 39 Minutes | 66 (1.7%) | 68 (2.8%) |
| 40 to 44 Minutes | 239 (6.2%) | 55 (2.3%) |
| 45 to 59 Minutes | 807 (20.9%) | 370 (15.3%) |
| 60 to 89 Minutes | 707 (18.3%) | 264 (10.9%) |
| 90 or more Minutes | 89 (2.3%) | 141 (5.8%) |
Time of Departure to Work by Sex in Orinda
The most frequent times of departure to work in Orinda are 7:30 AM to 7:59 AM (667, 17.3%) for males and 7:00 AM to 7:29 AM (446, 18.4%) for females.
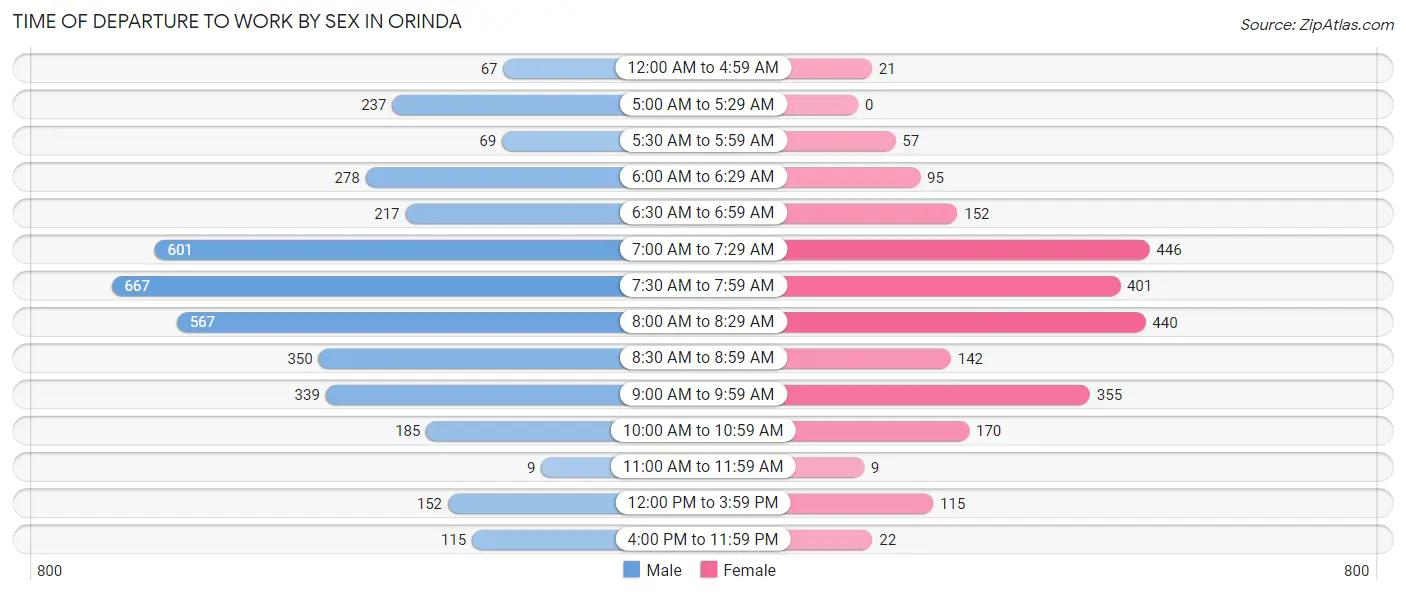
| Time of Departure | Male | Female |
| 12:00 AM to 4:59 AM | 67 (1.7%) | 21 (0.9%) |
| 5:00 AM to 5:29 AM | 237 (6.1%) | 0 (0.0%) |
| 5:30 AM to 5:59 AM | 69 (1.8%) | 57 (2.4%) |
| 6:00 AM to 6:29 AM | 278 (7.2%) | 95 (3.9%) |
| 6:30 AM to 6:59 AM | 217 (5.6%) | 152 (6.3%) |
| 7:00 AM to 7:29 AM | 601 (15.6%) | 446 (18.4%) |
| 7:30 AM to 7:59 AM | 667 (17.3%) | 401 (16.5%) |
| 8:00 AM to 8:29 AM | 567 (14.7%) | 440 (18.1%) |
| 8:30 AM to 8:59 AM | 350 (9.1%) | 142 (5.9%) |
| 9:00 AM to 9:59 AM | 339 (8.8%) | 355 (14.6%) |
| 10:00 AM to 10:59 AM | 185 (4.8%) | 170 (7.0%) |
| 11:00 AM to 11:59 AM | 9 (0.2%) | 9 (0.4%) |
| 12:00 PM to 3:59 PM | 152 (3.9%) | 115 (4.7%) |
| 4:00 PM to 11:59 PM | 115 (3.0%) | 22 (0.9%) |
| Total | 3,853 (100.0%) | 2,425 (100.0%) |
Housing Occupancy in Orinda
Occupancy by Ownership in Orinda
Of the total 7,476 dwellings in Orinda, owner-occupied units account for 6,947 (92.9%), while renter-occupied units make up 529 (7.1%).
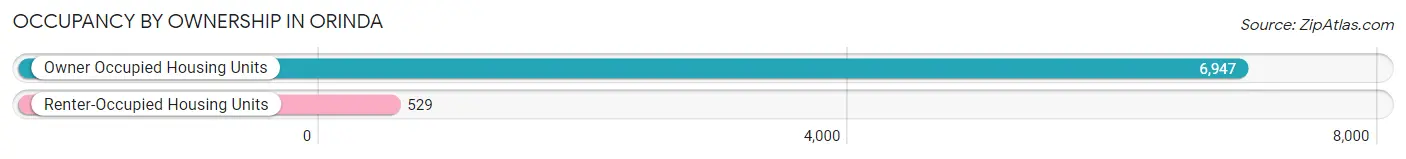
| Occupancy | # Housing Units | % Housing Units |
| Owner Occupied Housing Units | 6,947 | 92.9% |
| Renter-Occupied Housing Units | 529 | 7.1% |
| Total Occupied Housing Units | 7,476 | 100.0% |
Occupancy by Household Size in Orinda
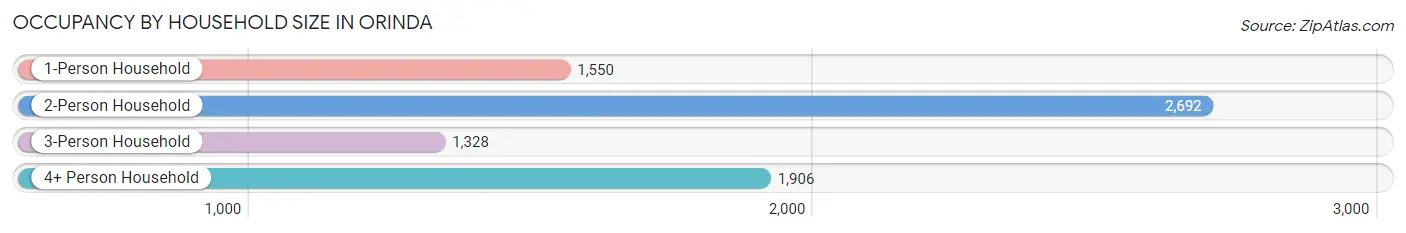
| Household Size | # Housing Units | % Housing Units |
| 1-Person Household | 1,550 | 20.7% |
| 2-Person Household | 2,692 | 36.0% |
| 3-Person Household | 1,328 | 17.8% |
| 4+ Person Household | 1,906 | 25.5% |
| Total Housing Units | 7,476 | 100.0% |
Occupancy by Ownership by Household Size in Orinda
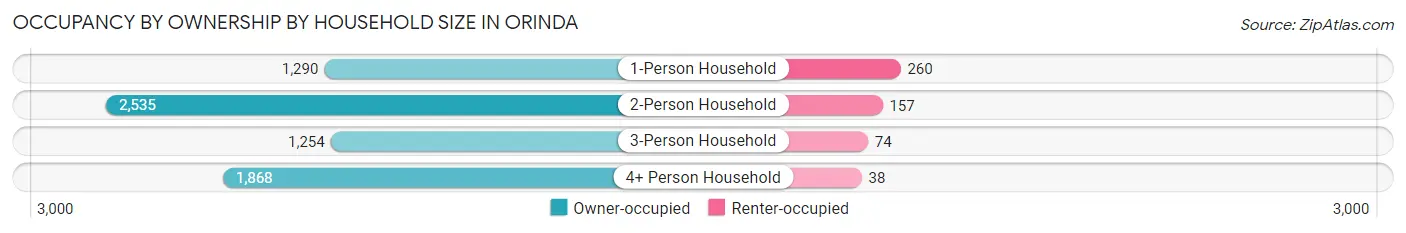
| Household Size | Owner-occupied | Renter-occupied |
| 1-Person Household | 1,290 (83.2%) | 260 (16.8%) |
| 2-Person Household | 2,535 (94.2%) | 157 (5.8%) |
| 3-Person Household | 1,254 (94.4%) | 74 (5.6%) |
| 4+ Person Household | 1,868 (98.0%) | 38 (2.0%) |
| Total Housing Units | 6,947 (92.9%) | 529 (7.1%) |
Occupancy by Educational Attainment in Orinda
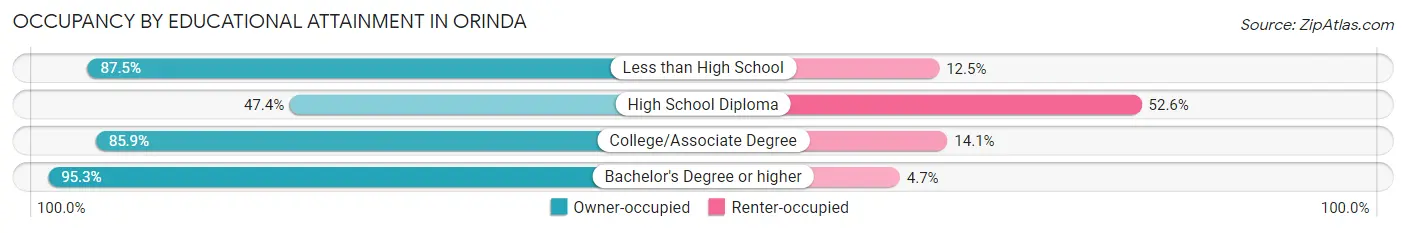
| Household Size | Owner-occupied | Renter-occupied |
| Less than High School | 42 (87.5%) | 6 (12.5%) |
| High School Diploma | 126 (47.4%) | 140 (52.6%) |
| College/Associate Degree | 432 (85.9%) | 71 (14.1%) |
| Bachelor's Degree or higher | 6,347 (95.3%) | 312 (4.7%) |
Occupancy by Age of Householder in Orinda
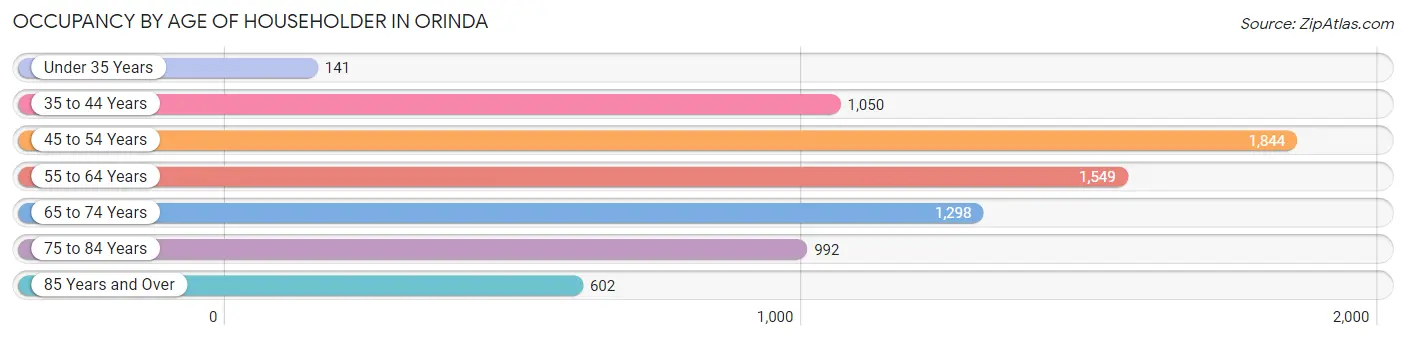
| Age Bracket | # Households | % Households |
| Under 35 Years | 141 | 1.9% |
| 35 to 44 Years | 1,050 | 14.0% |
| 45 to 54 Years | 1,844 | 24.7% |
| 55 to 64 Years | 1,549 | 20.7% |
| 65 to 74 Years | 1,298 | 17.4% |
| 75 to 84 Years | 992 | 13.3% |
| 85 Years and Over | 602 | 8.1% |
| Total | 7,476 | 100.0% |
Housing Finances in Orinda
Median Income by Occupancy in Orinda
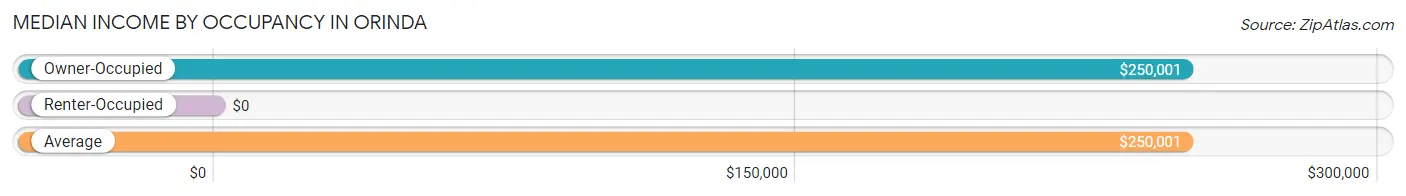
| Occupancy Type | # Households | Median Income |
| Owner-Occupied | 6,947 (92.9%) | $250,001 |
| Renter-Occupied | 529 (7.1%) | $0 |
| Average | 7,476 (100.0%) | $250,001 |
Occupancy by Householder Income Bracket in Orinda
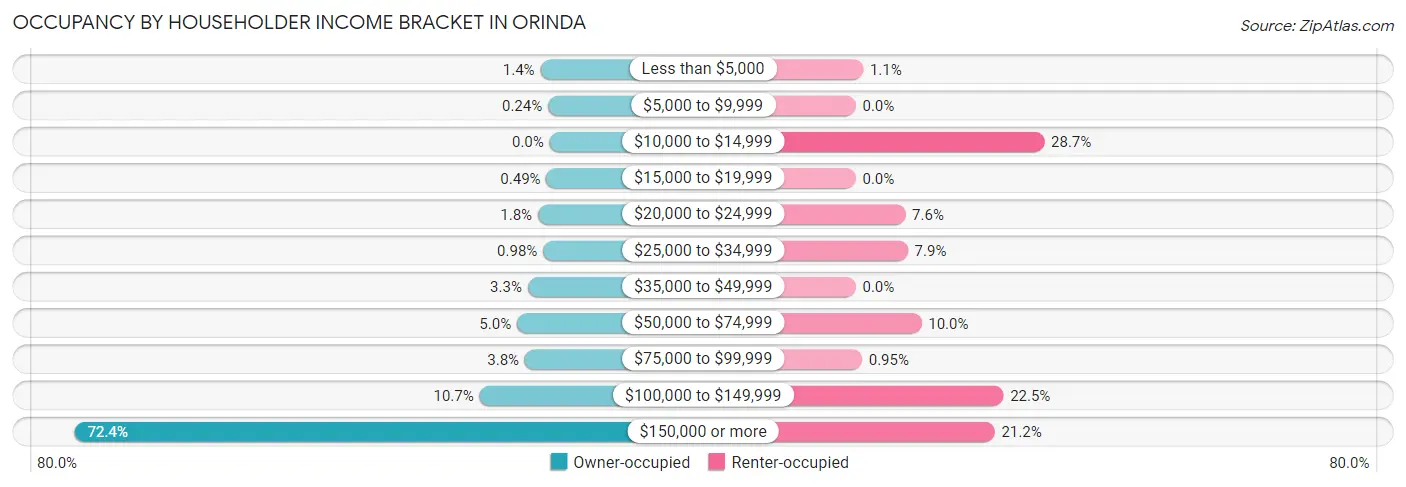
| Income Bracket | Owner-occupied | Renter-occupied |
| Less than $5,000 | 97 (1.4%) | 6 (1.1%) |
| $5,000 to $9,999 | 17 (0.2%) | 0 (0.0%) |
| $10,000 to $14,999 | 0 (0.0%) | 152 (28.7%) |
| $15,000 to $19,999 | 34 (0.5%) | 0 (0.0%) |
| $20,000 to $24,999 | 124 (1.8%) | 40 (7.6%) |
| $25,000 to $34,999 | 68 (1.0%) | 42 (7.9%) |
| $35,000 to $49,999 | 231 (3.3%) | 0 (0.0%) |
| $50,000 to $74,999 | 345 (5.0%) | 53 (10.0%) |
| $75,000 to $99,999 | 261 (3.8%) | 5 (0.9%) |
| $100,000 to $149,999 | 741 (10.7%) | 119 (22.5%) |
| $150,000 or more | 5,029 (72.4%) | 112 (21.2%) |
| Total | 6,947 (100.0%) | 529 (100.0%) |
Monthly Housing Cost Tiers in Orinda
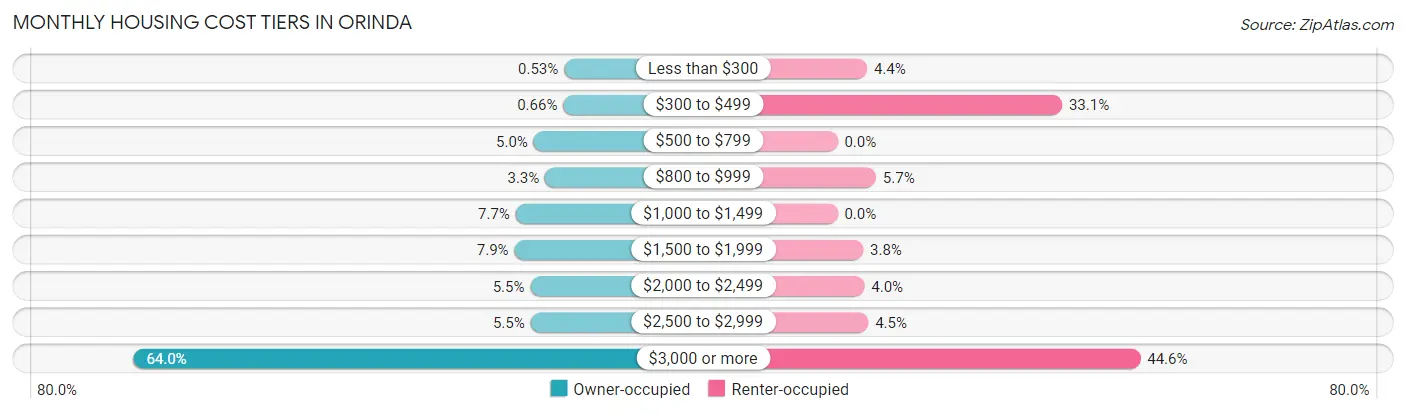
| Monthly Cost | Owner-occupied | Renter-occupied |
| Less than $300 | 37 (0.5%) | 23 (4.3%) |
| $300 to $499 | 46 (0.7%) | 175 (33.1%) |
| $500 to $799 | 348 (5.0%) | 0 (0.0%) |
| $800 to $999 | 231 (3.3%) | 30 (5.7%) |
| $1,000 to $1,499 | 533 (7.7%) | 0 (0.0%) |
| $1,500 to $1,999 | 545 (7.9%) | 20 (3.8%) |
| $2,000 to $2,499 | 383 (5.5%) | 21 (4.0%) |
| $2,500 to $2,999 | 381 (5.5%) | 24 (4.5%) |
| $3,000 or more | 4,443 (64.0%) | 236 (44.6%) |
| Total | 6,947 (100.0%) | 529 (100.0%) |
Physical Housing Characteristics in Orinda
Housing Structures in Orinda
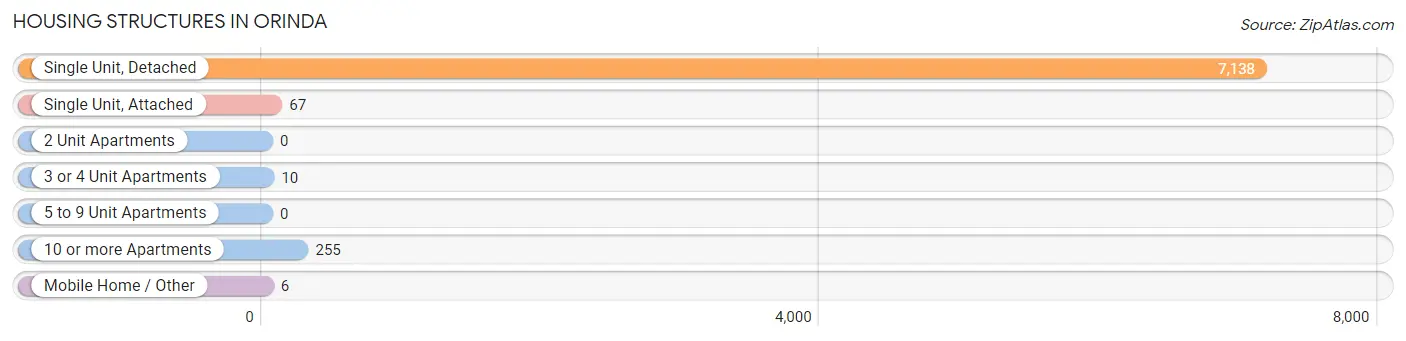
| Structure Type | # Housing Units | % Housing Units |
| Single Unit, Detached | 7,138 | 95.5% |
| Single Unit, Attached | 67 | 0.9% |
| 2 Unit Apartments | 0 | 0.0% |
| 3 or 4 Unit Apartments | 10 | 0.1% |
| 5 to 9 Unit Apartments | 0 | 0.0% |
| 10 or more Apartments | 255 | 3.4% |
| Mobile Home / Other | 6 | 0.1% |
| Total | 7,476 | 100.0% |
Housing Structures by Occupancy in Orinda
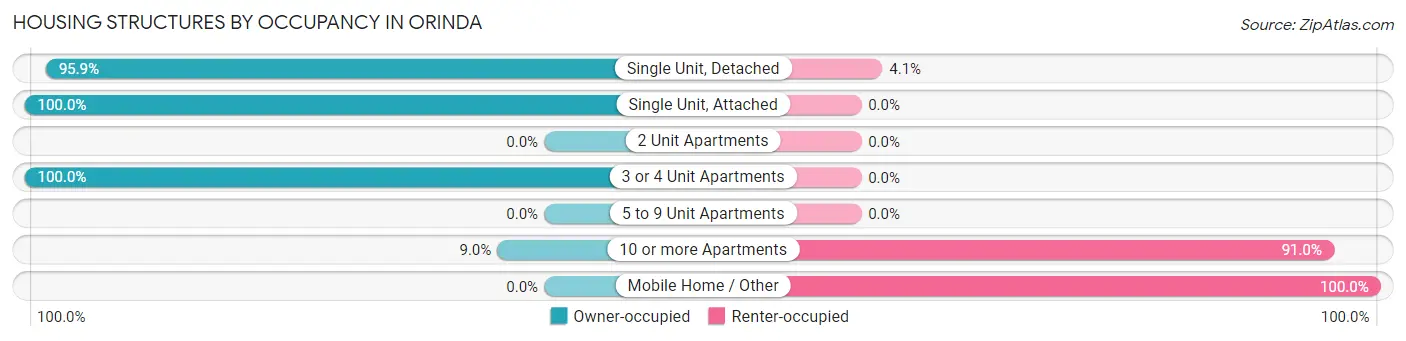
| Structure Type | Owner-occupied | Renter-occupied |
| Single Unit, Detached | 6,847 (95.9%) | 291 (4.1%) |
| Single Unit, Attached | 67 (100.0%) | 0 (0.0%) |
| 2 Unit Apartments | 0 (0.0%) | 0 (0.0%) |
| 3 or 4 Unit Apartments | 10 (100.0%) | 0 (0.0%) |
| 5 to 9 Unit Apartments | 0 (0.0%) | 0 (0.0%) |
| 10 or more Apartments | 23 (9.0%) | 232 (91.0%) |
| Mobile Home / Other | 0 (0.0%) | 6 (100.0%) |
| Total | 6,947 (92.9%) | 529 (7.1%) |
Housing Structures by Number of Rooms in Orinda
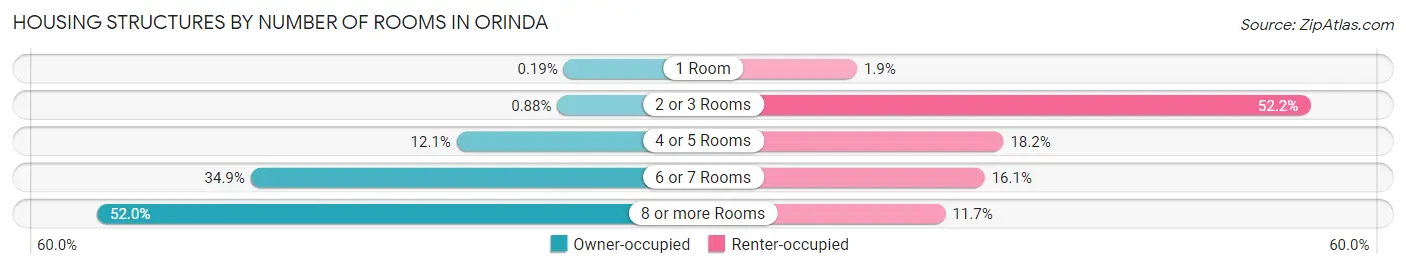
| Number of Rooms | Owner-occupied | Renter-occupied |
| 1 Room | 13 (0.2%) | 10 (1.9%) |
| 2 or 3 Rooms | 61 (0.9%) | 276 (52.2%) |
| 4 or 5 Rooms | 837 (12.0%) | 96 (18.1%) |
| 6 or 7 Rooms | 2,426 (34.9%) | 85 (16.1%) |
| 8 or more Rooms | 3,610 (52.0%) | 62 (11.7%) |
| Total | 6,947 (100.0%) | 529 (100.0%) |
Housing Structure by Heating Type in Orinda
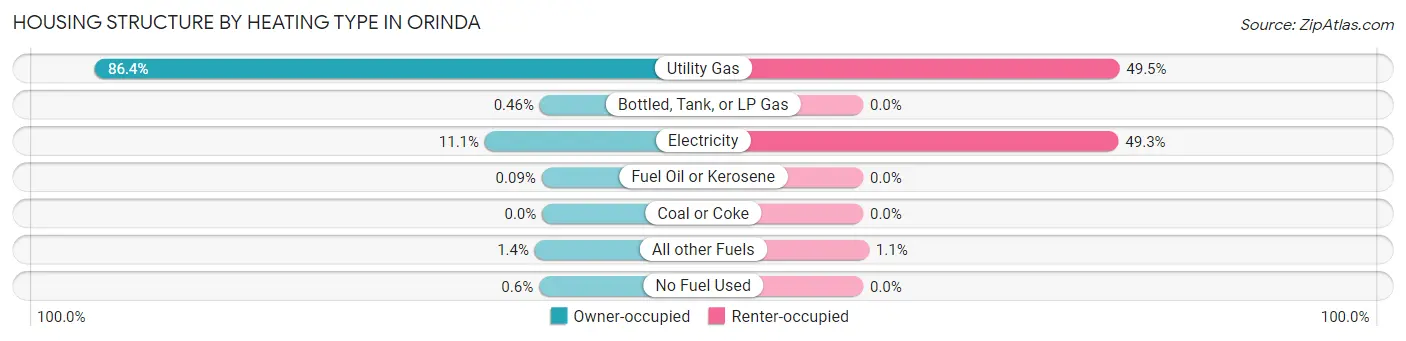
| Heating Type | Owner-occupied | Renter-occupied |
| Utility Gas | 6,001 (86.4%) | 262 (49.5%) |
| Bottled, Tank, or LP Gas | 32 (0.5%) | 0 (0.0%) |
| Electricity | 768 (11.1%) | 261 (49.3%) |
| Fuel Oil or Kerosene | 6 (0.1%) | 0 (0.0%) |
| Coal or Coke | 0 (0.0%) | 0 (0.0%) |
| All other Fuels | 98 (1.4%) | 6 (1.1%) |
| No Fuel Used | 42 (0.6%) | 0 (0.0%) |
| Total | 6,947 (100.0%) | 529 (100.0%) |
Household Vehicle Usage in Orinda
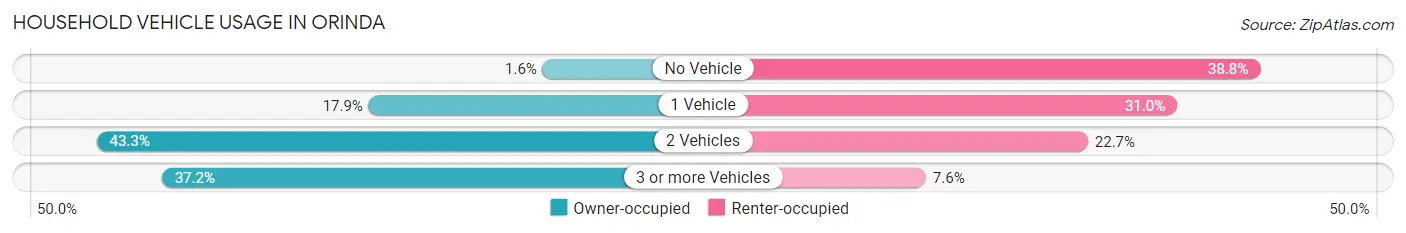
| Vehicles per Household | Owner-occupied | Renter-occupied |
| No Vehicle | 114 (1.6%) | 205 (38.8%) |
| 1 Vehicle | 1,242 (17.9%) | 164 (31.0%) |
| 2 Vehicles | 3,007 (43.3%) | 120 (22.7%) |
| 3 or more Vehicles | 2,584 (37.2%) | 40 (7.6%) |
| Total | 6,947 (100.0%) | 529 (100.0%) |
Real Estate & Mortgages in Orinda
Real Estate and Mortgage Overview in Orinda
| Characteristic | Without Mortgage | With Mortgage |
| Housing Units | 2,050 | 4,897 |
| Median Property Value | $1,597,900 | $1,810,000 |
| Median Household Income | $167,348 | $3,943 |
| Monthly Housing Costs | $1,383 | $4,270 |
| Real Estate Taxes | $8,268 | $54 |
Property Value by Mortgage Status in Orinda
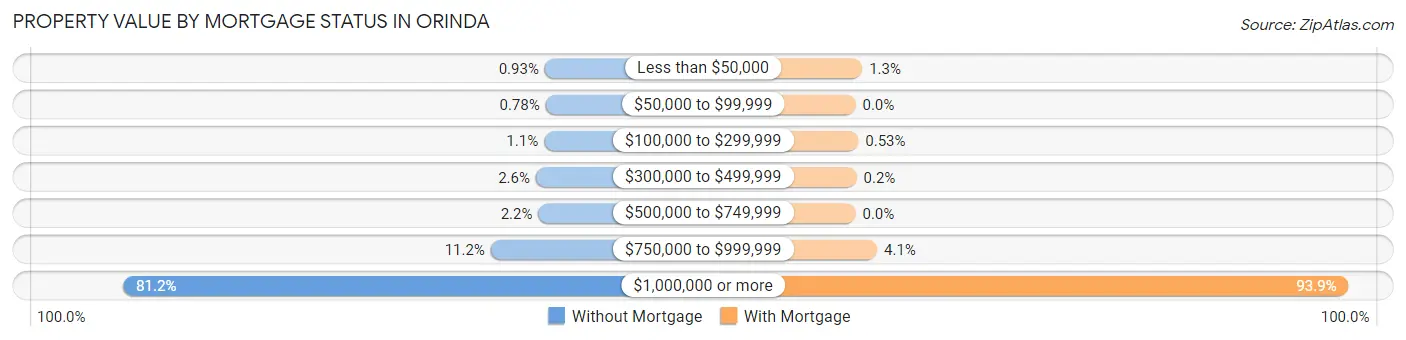
| Property Value | Without Mortgage | With Mortgage |
| Less than $50,000 | 19 (0.9%) | 62 (1.3%) |
| $50,000 to $99,999 | 16 (0.8%) | 0 (0.0%) |
| $100,000 to $299,999 | 22 (1.1%) | 26 (0.5%) |
| $300,000 to $499,999 | 54 (2.6%) | 10 (0.2%) |
| $500,000 to $749,999 | 44 (2.1%) | 0 (0.0%) |
| $750,000 to $999,999 | 230 (11.2%) | 201 (4.1%) |
| $1,000,000 or more | 1,665 (81.2%) | 4,598 (93.9%) |
| Total | 2,050 (100.0%) | 4,897 (100.0%) |
Household Income by Mortgage Status in Orinda
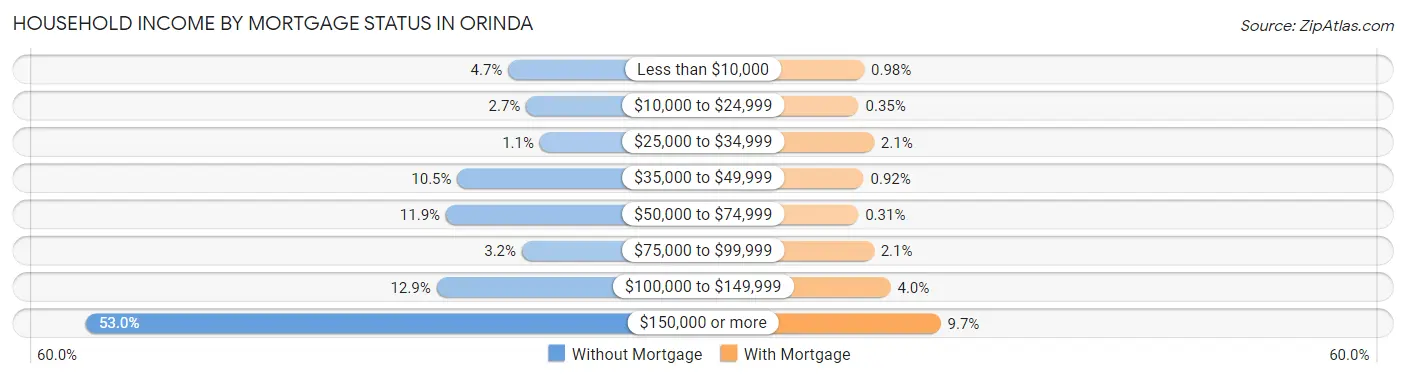
| Household Income | Without Mortgage | With Mortgage |
| Less than $10,000 | 97 (4.7%) | 48 (1.0%) |
| $10,000 to $24,999 | 55 (2.7%) | 17 (0.4%) |
| $25,000 to $34,999 | 23 (1.1%) | 103 (2.1%) |
| $35,000 to $49,999 | 216 (10.5%) | 45 (0.9%) |
| $50,000 to $74,999 | 243 (11.8%) | 15 (0.3%) |
| $75,000 to $99,999 | 65 (3.2%) | 102 (2.1%) |
| $100,000 to $149,999 | 265 (12.9%) | 196 (4.0%) |
| $150,000 or more | 1,086 (53.0%) | 476 (9.7%) |
| Total | 2,050 (100.0%) | 4,897 (100.0%) |
Property Value to Household Income Ratio in Orinda
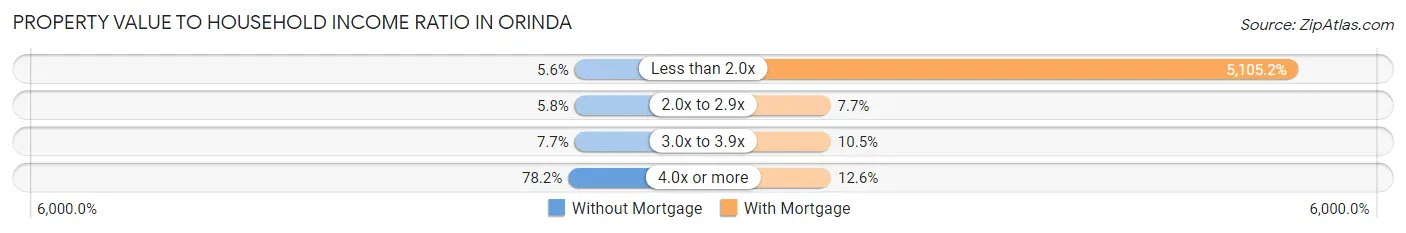
| Value-to-Income Ratio | Without Mortgage | With Mortgage |
| Less than 2.0x | 115 (5.6%) | 250,001 (5,105.2%) |
| 2.0x to 2.9x | 119 (5.8%) | 377 (7.7%) |
| 3.0x to 3.9x | 157 (7.7%) | 515 (10.5%) |
| 4.0x or more | 1,604 (78.2%) | 619 (12.6%) |
| Total | 2,050 (100.0%) | 4,897 (100.0%) |
Real Estate Taxes by Mortgage Status in Orinda
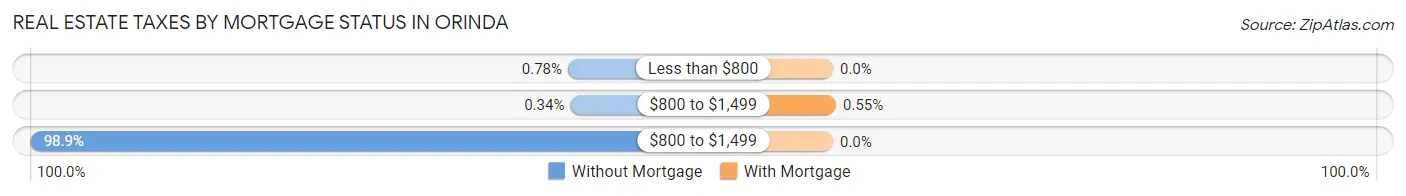
| Property Taxes | Without Mortgage | With Mortgage |
| Less than $800 | 16 (0.8%) | 0 (0.0%) |
| $800 to $1,499 | 7 (0.3%) | 27 (0.5%) |
| $800 to $1,499 | 2,027 (98.9%) | 0 (0.0%) |
| Total | 2,050 (100.0%) | 4,897 (100.0%) |
Health & Disability in Orinda
Health Insurance Coverage by Age in Orinda
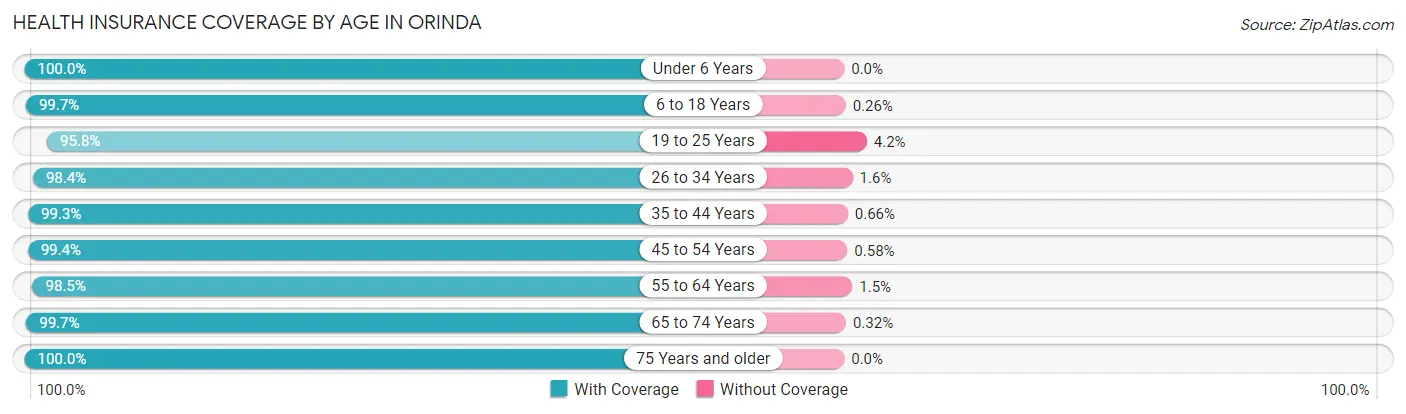
| Age Bracket | With Coverage | Without Coverage |
| Under 6 Years | 1,207 (100.0%) | 0 (0.0%) |
| 6 to 18 Years | 3,873 (99.7%) | 10 (0.3%) |
| 19 to 25 Years | 547 (95.8%) | 24 (4.2%) |
| 26 to 34 Years | 568 (98.4%) | 9 (1.6%) |
| 35 to 44 Years | 2,263 (99.3%) | 15 (0.7%) |
| 45 to 54 Years | 3,399 (99.4%) | 20 (0.6%) |
| 55 to 64 Years | 2,953 (98.5%) | 45 (1.5%) |
| 65 to 74 Years | 2,180 (99.7%) | 7 (0.3%) |
| 75 Years and older | 2,314 (100.0%) | 0 (0.0%) |
| Total | 19,304 (99.3%) | 130 (0.7%) |
Health Insurance Coverage by Citizenship Status in Orinda
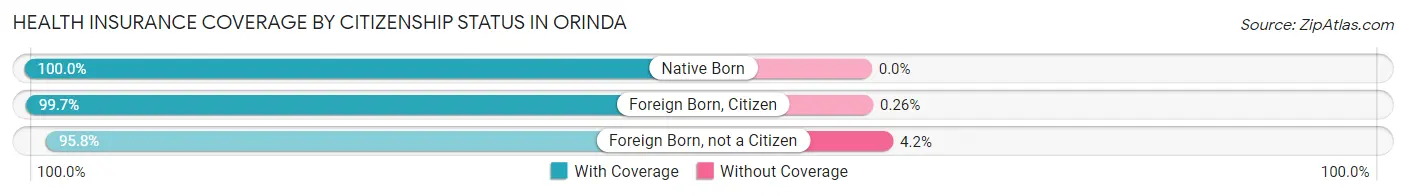
| Citizenship Status | With Coverage | Without Coverage |
| Native Born | 1,207 (100.0%) | 0 (0.0%) |
| Foreign Born, Citizen | 3,873 (99.7%) | 10 (0.3%) |
| Foreign Born, not a Citizen | 547 (95.8%) | 24 (4.2%) |
Health Insurance Coverage by Household Income in Orinda
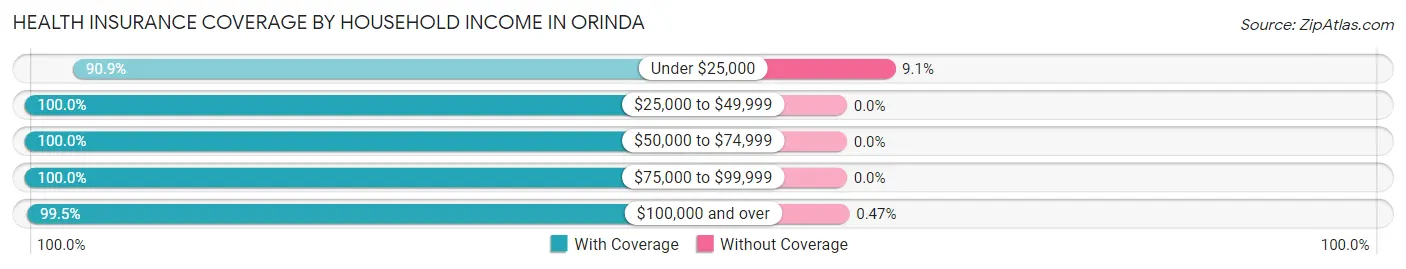
| Household Income | With Coverage | Without Coverage |
| Under $25,000 | 492 (90.9%) | 49 (9.1%) |
| $25,000 to $49,999 | 640 (100.0%) | 0 (0.0%) |
| $50,000 to $74,999 | 592 (100.0%) | 0 (0.0%) |
| $75,000 to $99,999 | 557 (100.0%) | 0 (0.0%) |
| $100,000 and over | 17,012 (99.5%) | 81 (0.5%) |
Public vs Private Health Insurance Coverage by Age in Orinda
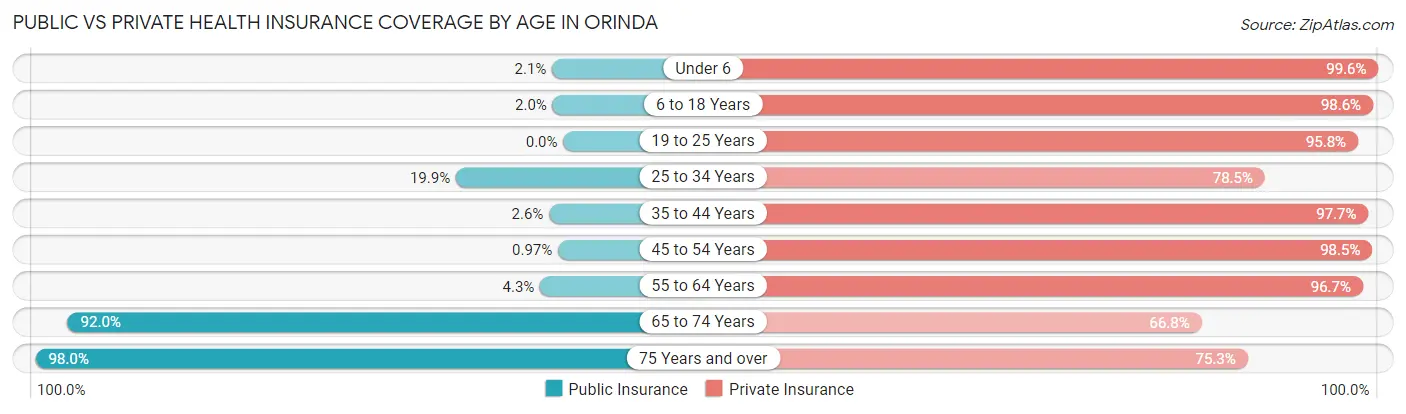
| Age Bracket | Public Insurance | Private Insurance |
| Under 6 | 25 (2.1%) | 1,202 (99.6%) |
| 6 to 18 Years | 77 (2.0%) | 3,828 (98.6%) |
| 19 to 25 Years | 0 (0.0%) | 547 (95.8%) |
| 25 to 34 Years | 115 (19.9%) | 453 (78.5%) |
| 35 to 44 Years | 60 (2.6%) | 2,226 (97.7%) |
| 45 to 54 Years | 33 (1.0%) | 3,366 (98.5%) |
| 55 to 64 Years | 129 (4.3%) | 2,899 (96.7%) |
| 65 to 74 Years | 2,012 (92.0%) | 1,460 (66.8%) |
| 75 Years and over | 2,267 (98.0%) | 1,743 (75.3%) |
| Total | 4,718 (24.3%) | 17,724 (91.2%) |
Disability Status by Sex by Age in Orinda
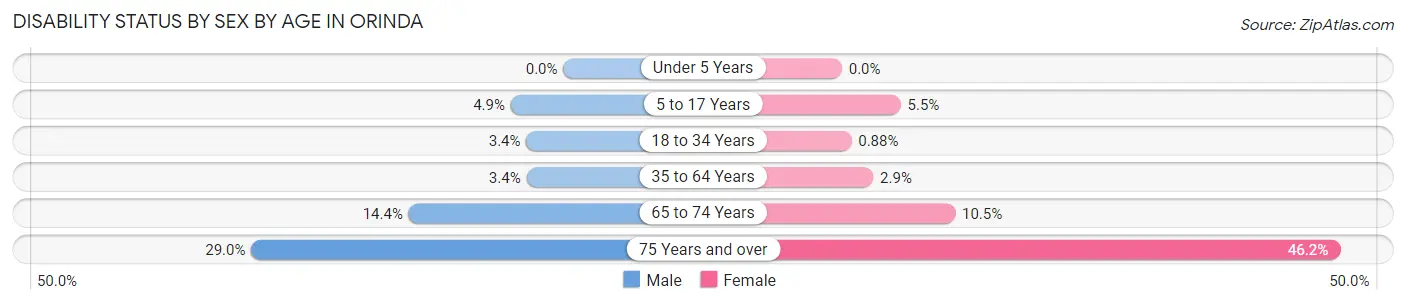
| Age Bracket | Male | Female |
| Under 5 Years | 0 (0.0%) | 0 (0.0%) |
| 5 to 17 Years | 83 (4.9%) | 117 (5.5%) |
| 18 to 34 Years | 27 (3.4%) | 6 (0.9%) |
| 35 to 64 Years | 155 (3.4%) | 121 (2.9%) |
| 65 to 74 Years | 165 (14.3%) | 109 (10.5%) |
| 75 Years and over | 300 (29.0%) | 591 (46.2%) |
Disability Class by Sex by Age in Orinda
Disability Class: Hearing Difficulty
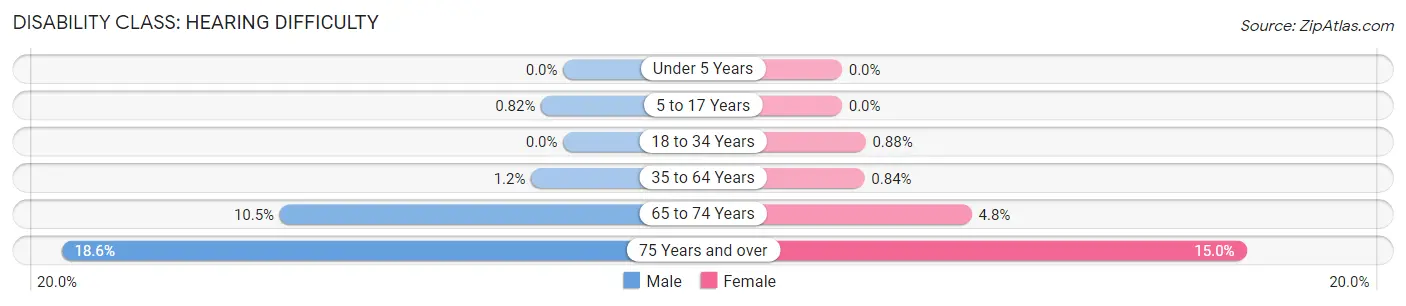
| Age Bracket | Male | Female |
| Under 5 Years | 0 (0.0%) | 0 (0.0%) |
| 5 to 17 Years | 14 (0.8%) | 0 (0.0%) |
| 18 to 34 Years | 0 (0.0%) | 6 (0.9%) |
| 35 to 64 Years | 54 (1.2%) | 35 (0.8%) |
| 65 to 74 Years | 121 (10.5%) | 50 (4.8%) |
| 75 Years and over | 193 (18.6%) | 192 (15.0%) |
Disability Class: Vision Difficulty
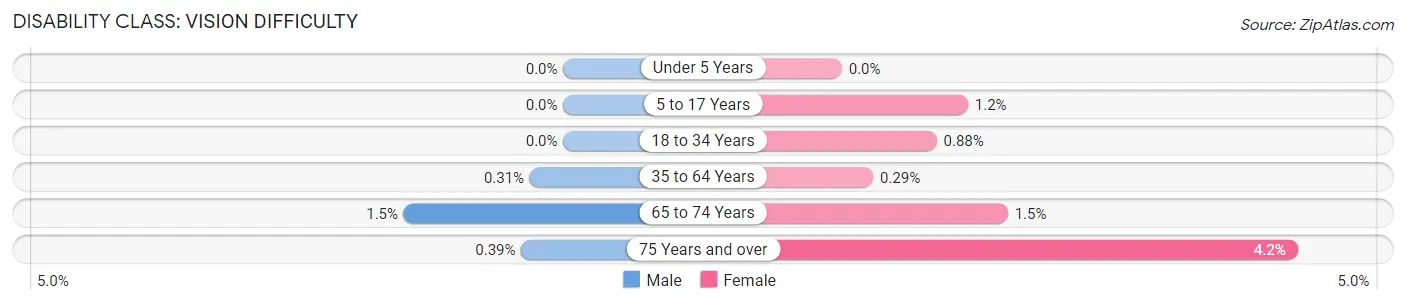
| Age Bracket | Male | Female |
| Under 5 Years | 0 (0.0%) | 0 (0.0%) |
| 5 to 17 Years | 0 (0.0%) | 25 (1.2%) |
| 18 to 34 Years | 0 (0.0%) | 6 (0.9%) |
| 35 to 64 Years | 14 (0.3%) | 12 (0.3%) |
| 65 to 74 Years | 17 (1.5%) | 16 (1.5%) |
| 75 Years and over | 4 (0.4%) | 54 (4.2%) |
Disability Class: Cognitive Difficulty
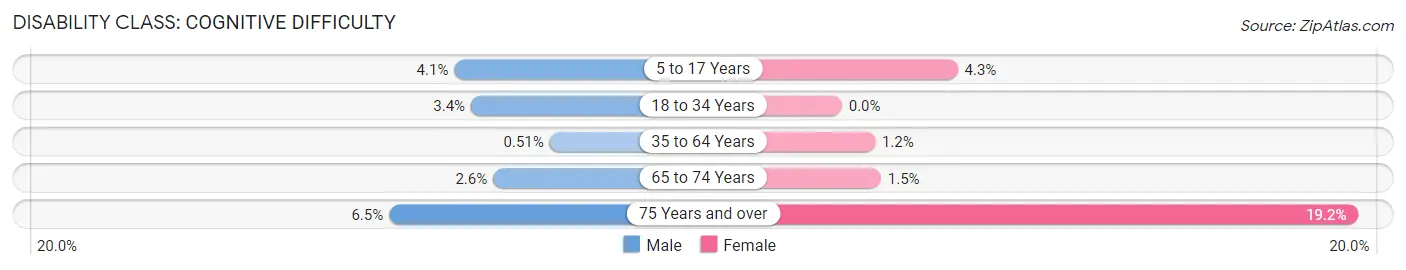
| Age Bracket | Male | Female |
| 5 to 17 Years | 69 (4.1%) | 92 (4.3%) |
| 18 to 34 Years | 27 (3.4%) | 0 (0.0%) |
| 35 to 64 Years | 23 (0.5%) | 51 (1.2%) |
| 65 to 74 Years | 30 (2.6%) | 15 (1.5%) |
| 75 Years and over | 67 (6.5%) | 245 (19.2%) |
Disability Class: Ambulatory Difficulty
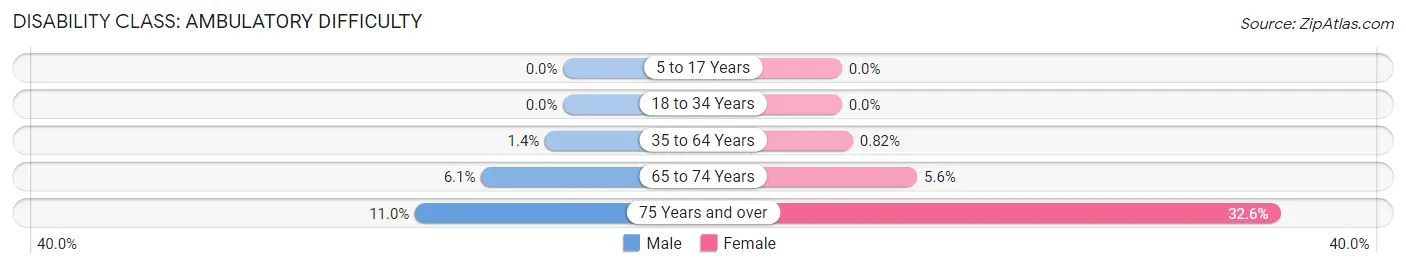
| Age Bracket | Male | Female |
| 5 to 17 Years | 0 (0.0%) | 0 (0.0%) |
| 18 to 34 Years | 0 (0.0%) | 0 (0.0%) |
| 35 to 64 Years | 61 (1.3%) | 34 (0.8%) |
| 65 to 74 Years | 70 (6.1%) | 58 (5.6%) |
| 75 Years and over | 114 (11.0%) | 416 (32.6%) |
Disability Class: Self-Care Difficulty
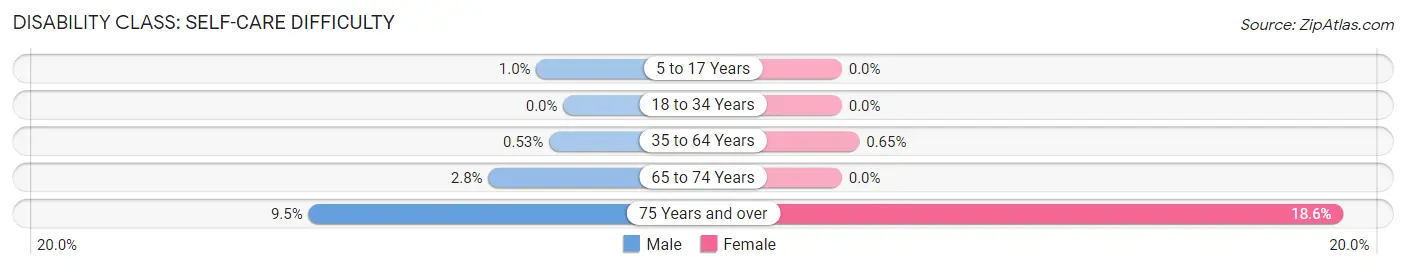
| Age Bracket | Male | Female |
| 5 to 17 Years | 17 (1.0%) | 0 (0.0%) |
| 18 to 34 Years | 0 (0.0%) | 0 (0.0%) |
| 35 to 64 Years | 24 (0.5%) | 27 (0.6%) |
| 65 to 74 Years | 32 (2.8%) | 0 (0.0%) |
| 75 Years and over | 98 (9.5%) | 238 (18.6%) |
Technology Access in Orinda
Computing Device Access in Orinda
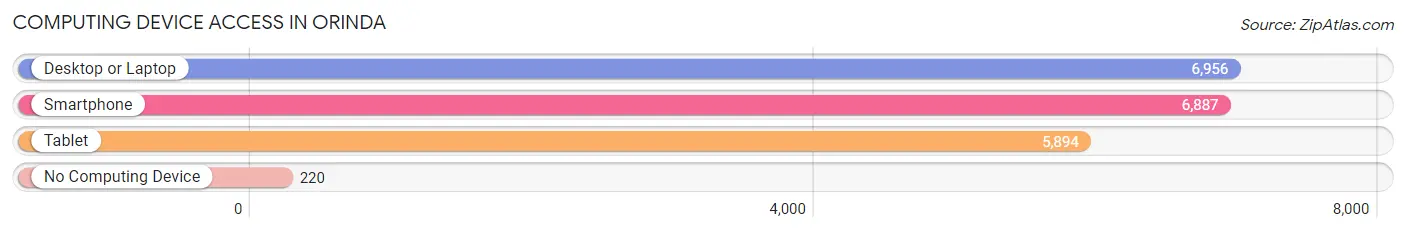
| Device Type | # Households | % Households |
| Desktop or Laptop | 6,956 | 93.0% |
| Smartphone | 6,887 | 92.1% |
| Tablet | 5,894 | 78.8% |
| No Computing Device | 220 | 2.9% |
| Total | 7,476 | 100.0% |
Internet Access in Orinda
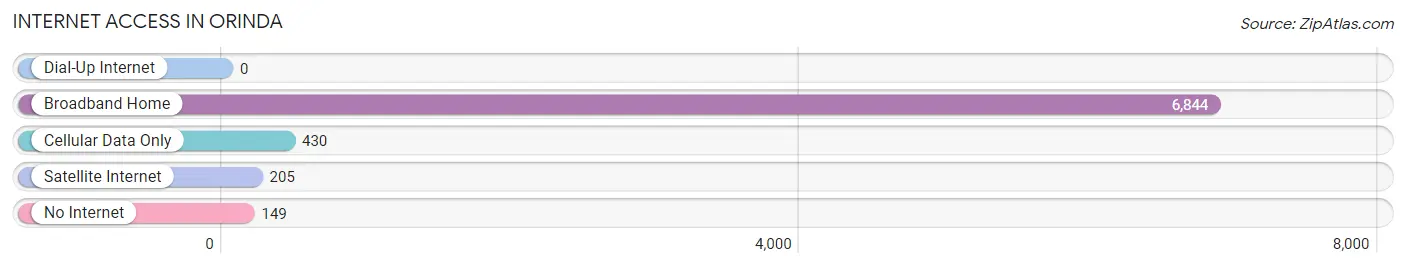
| Internet Type | # Households | % Households |
| Dial-Up Internet | 0 | 0.0% |
| Broadband Home | 6,844 | 91.5% |
| Cellular Data Only | 430 | 5.8% |
| Satellite Internet | 205 | 2.7% |
| No Internet | 149 | 2.0% |
| Total | 7,476 | 100.0% |
Orinda Summary
Orinda, California is a small city located in Contra Costa County, in the San Francisco Bay Area. It is situated on the eastern side of the Berkeley Hills, and is bordered by the cities of Lafayette, Moraga, and Walnut Creek. The population of Orinda was 17,643 at the 2010 census, and the median household income was $164,845 in 2019.
History
The area that is now Orinda was originally inhabited by the Ohlone people, who lived in the area for thousands of years before the arrival of Europeans. The first Europeans to settle in the area were the Spanish, who established the Mission San Francisco de Asís in 1776. The mission was abandoned in 1834, and the area was subsequently settled by ranchers and farmers.
In the late 19th century, the area was developed as a summer resort for wealthy San Franciscans. The town of Orinda was founded in 1874, and was named after the daughter of one of the original settlers. The town was incorporated in 1985, and has since grown to become a popular residential community.
Geography
Orinda is located in the East Bay region of the San Francisco Bay Area, in Contra Costa County. It is situated on the eastern side of the Berkeley Hills, and is bordered by the cities of Lafayette, Moraga, and Walnut Creek. The city covers an area of 12.1 square miles, and has an elevation of 545 feet.
The city is located in a Mediterranean climate zone, with hot, dry summers and mild, wet winters. The average annual temperature is 61°F, and the average annual precipitation is 24.5 inches.
Economy
Orinda’s economy is largely based on the service sector, with many residents employed in professional, scientific, and technical services. The city is also home to a number of retail stores, restaurants, and other businesses.
The median household income in Orinda was $164,845 in 2019, and the median home value was $1,541,000. The unemployment rate was 2.7% in 2019, and the poverty rate was 3.2%.
Demographics
As of the 2010 census, the population of Orinda was 17,643. The racial makeup of the city was 79.2% White, 8.2% Asian, 6.3% Hispanic or Latino, 4.2% African American, and 2.1% other.
The median age in Orinda was 45.2 years, and the median household income was $164,845. The median home value was $1,541,000, and the median rent was $2,845. The city had a homeownership rate of 81.2%.
Common Questions
What is Per Capita Income in Orinda?
Per Capita income in Orinda is $141,683.
What is the Median Family Income in Orinda?
Median Family Income in Orinda is $250,001.
What is the Median Household income in Orinda?
Median Household Income in Orinda is $250,001.
What is Income or Wage Gap in Orinda?
Income or Wage Gap in Orinda is 50.2%.
Women in Orinda earn 49.8 cents for every dollar earned by a man.
What is Inequality or Gini Index in Orinda?
Inequality or Gini Index in Orinda is 0.49.
What is the Total Population of Orinda?
Total Population of Orinda is 19,477.
What is the Total Male Population of Orinda?
Total Male Population of Orinda is 9,648.
What is the Total Female Population of Orinda?
Total Female Population of Orinda is 9,829.
What is the Ratio of Males per 100 Females in Orinda?
There are 98.16 Males per 100 Females in Orinda.
What is the Ratio of Females per 100 Males in Orinda?
There are 101.88 Females per 100 Males in Orinda.
What is the Median Population Age in Orinda?
Median Population Age in Orinda is 49.4 Years.
What is the Average Family Size in Orinda
Average Family Size in Orinda is 3.0 People.
What is the Average Household Size in Orinda
Average Household Size in Orinda is 2.6 People.
How Large is the Labor Force in Orinda?
There are 9,288 People in the Labor Forcein in Orinda.
What is the Percentage of People in the Labor Force in Orinda?
60.0% of People are in the Labor Force in Orinda.
What is the Unemployment Rate in Orinda?
Unemployment Rate in Orinda is 3.3%.