London, CA Map & Demographics
London Map
London Overview
$15,182
PER CAPITA INCOME
$51,471
AVG FAMILY INCOME
$51,324
AVG HOUSEHOLD INCOME
5.8%
WAGE / INCOME GAP [ % ]
94.2¢/ $1
WAGE / INCOME GAP [ $ ]
$11,472
FAMILY INCOME DEFICIT
0.40
INEQUALITY / GINI INDEX
1,785
TOTAL POPULATION
930
MALE POPULATION
855
FEMALE POPULATION
108.77
MALES / 100 FEMALES
91.94
FEMALES / 100 MALES
26.4
MEDIAN AGE
4.4
AVG FAMILY SIZE
4.2
AVG HOUSEHOLD SIZE
692
LABOR FORCE [ PEOPLE ]
56.2%
PERCENT IN LABOR FORCE
10.7%
UNEMPLOYMENT RATE
Income in London
Income Overview in London
Per Capita Income in London is $15,182, while median incomes of families and households are $51,471 and $51,324 respectively.
| Characteristic | Number | Measure |
| Per Capita Income | 1,785 | $15,182 |
| Median Family Income | 356 | $51,471 |
| Mean Family Income | 356 | $62,183 |
| Median Household Income | 422 | $51,324 |
| Mean Household Income | 422 | $62,635 |
| Income Deficit | 356 | $11,472 |
| Wage / Income Gap (%) | 1,785 | 5.79% |
| Wage / Income Gap ($) | 1,785 | 94.21¢ per $1 |
| Gini / Inequality Index | 1,785 | 0.40 |
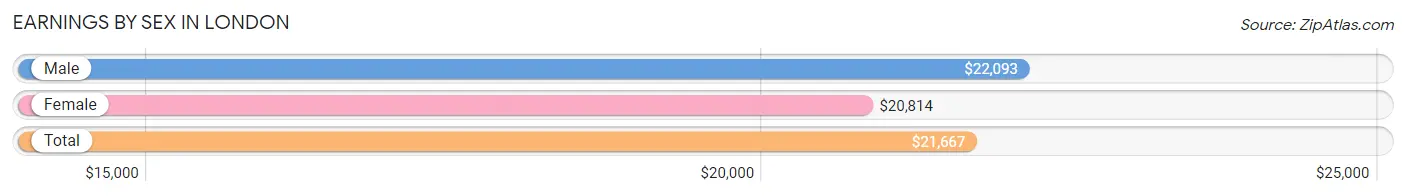
Earnings by Sex in London
Average Earnings in London are $21,667, $22,093 for men and $20,814 for women, a difference of 5.8%.
| Sex | Number | Average Earnings |
| Male | 380 (47.1%) | $22,093 |
| Female | 426 (52.8%) | $20,814 |
| Total | 806 (100.0%) | $21,667 |
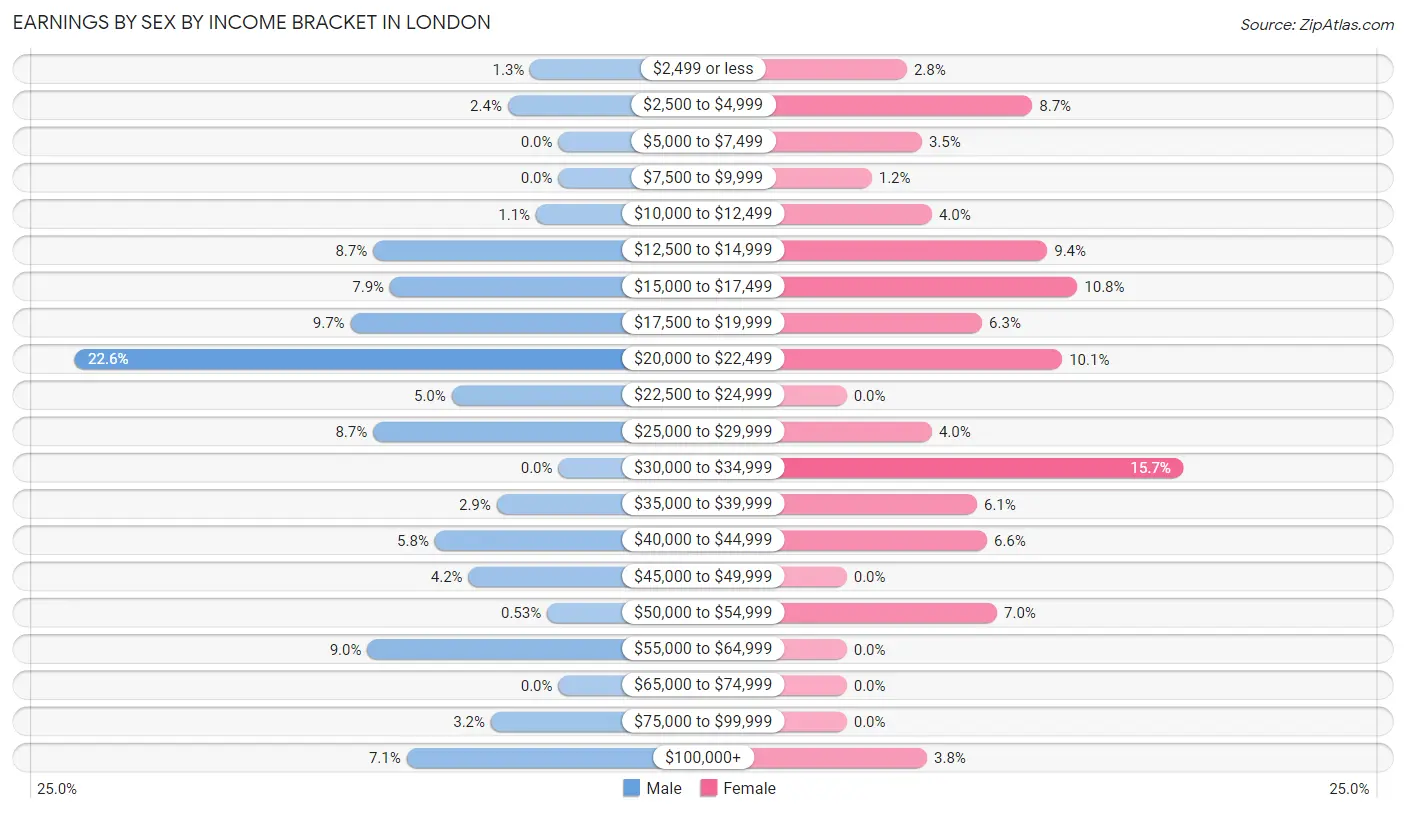
Earnings by Sex by Income Bracket in London
The most common earnings brackets in London are $20,000 to $22,499 for men (86 | 22.6%) and $30,000 to $34,999 for women (67 | 15.7%).
| Income | Male | Female |
| $2,499 or less | 5 (1.3%) | 12 (2.8%) |
| $2,500 to $4,999 | 9 (2.4%) | 37 (8.7%) |
| $5,000 to $7,499 | 0 (0.0%) | 15 (3.5%) |
| $7,500 to $9,999 | 0 (0.0%) | 5 (1.2%) |
| $10,000 to $12,499 | 4 (1.1%) | 17 (4.0%) |
| $12,500 to $14,999 | 33 (8.7%) | 40 (9.4%) |
| $15,000 to $17,499 | 30 (7.9%) | 46 (10.8%) |
| $17,500 to $19,999 | 37 (9.7%) | 27 (6.3%) |
| $20,000 to $22,499 | 86 (22.6%) | 43 (10.1%) |
| $22,500 to $24,999 | 19 (5.0%) | 0 (0.0%) |
| $25,000 to $29,999 | 33 (8.7%) | 17 (4.0%) |
| $30,000 to $34,999 | 0 (0.0%) | 67 (15.7%) |
| $35,000 to $39,999 | 11 (2.9%) | 26 (6.1%) |
| $40,000 to $44,999 | 22 (5.8%) | 28 (6.6%) |
| $45,000 to $49,999 | 16 (4.2%) | 0 (0.0%) |
| $50,000 to $54,999 | 2 (0.5%) | 30 (7.0%) |
| $55,000 to $64,999 | 34 (8.9%) | 0 (0.0%) |
| $65,000 to $74,999 | 0 (0.0%) | 0 (0.0%) |
| $75,000 to $99,999 | 12 (3.2%) | 0 (0.0%) |
| $100,000+ | 27 (7.1%) | 16 (3.8%) |
| Total | 380 (100.0%) | 426 (100.0%) |
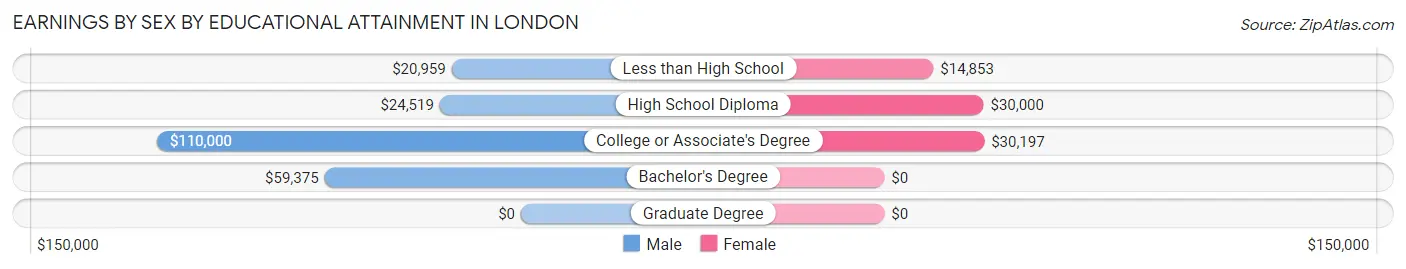
Earnings by Sex by Educational Attainment in London
Average earnings in London are $22,369 for men and $22,151 for women, a difference of 1.0%. Men with an educational attainment of college or associate's degree enjoy the highest average annual earnings of $110,000, while those with less than high school education earn the least with $20,959. Women with an educational attainment of college or associate's degree earn the most with the average annual earnings of $30,197, while those with less than high school education have the smallest earnings of $14,853.
| Educational Attainment | Male Income | Female Income |
| Less than High School | $20,959 | $14,853 |
| High School Diploma | $24,519 | $30,000 |
| College or Associate's Degree | $110,000 | $30,197 |
| Bachelor's Degree | $59,375 | $0 |
| Graduate Degree | - | - |
| Total | $22,369 | $22,151 |
Family Income in London
Family Income Brackets in London
According to the London family income data, there are 74 families falling into the $100,000 to $149,999 income range, which is the most common income bracket and makes up 20.8% of all families.
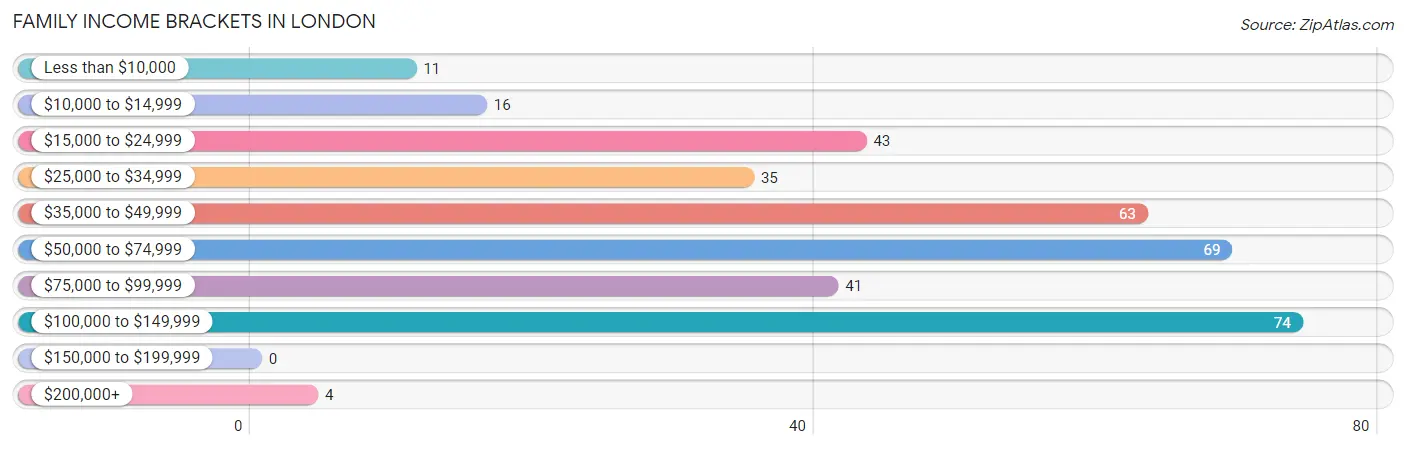
| Income Bracket | # Families | % Families |
| Less than $10,000 | 11 | 3.1% |
| $10,000 to $14,999 | 16 | 4.5% |
| $15,000 to $24,999 | 43 | 12.1% |
| $25,000 to $34,999 | 35 | 9.8% |
| $35,000 to $49,999 | 63 | 17.7% |
| $50,000 to $74,999 | 69 | 19.4% |
| $75,000 to $99,999 | 41 | 11.5% |
| $100,000 to $149,999 | 74 | 20.8% |
| $150,000 to $199,999 | 0 | 0.0% |
| $200,000+ | 4 | 1.1% |
Family Income by Famaliy Size in London
2-person families (77 | 21.6%) account for the highest median family income in London with $92,917 per family, while 2-person families (77 | 21.6%) have the highest median income of $46,458 per family member.
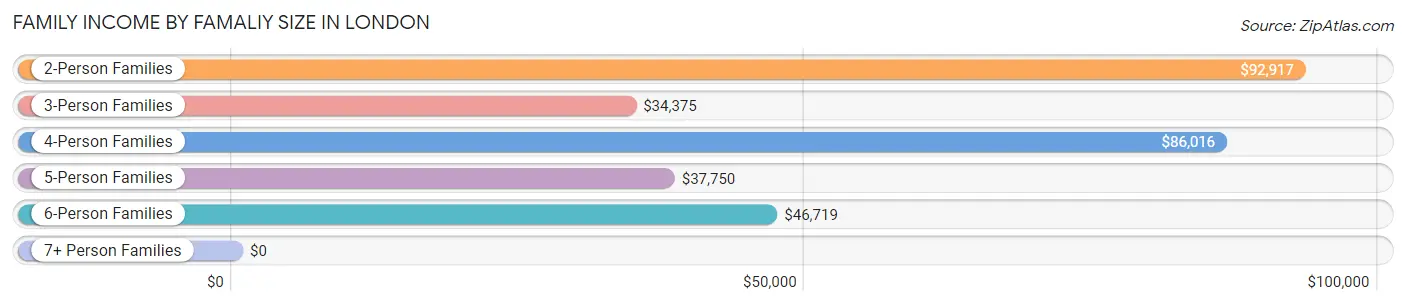
| Income Bracket | # Families | Median Income |
| 2-Person Families | 77 (21.6%) | $92,917 |
| 3-Person Families | 58 (16.3%) | $34,375 |
| 4-Person Families | 103 (28.9%) | $86,016 |
| 5-Person Families | 52 (14.6%) | $37,750 |
| 6-Person Families | 46 (12.9%) | $46,719 |
| 7+ Person Families | 20 (5.6%) | $0 |
| Total | 356 (100.0%) | $51,471 |
Family Income by Number of Earners in London
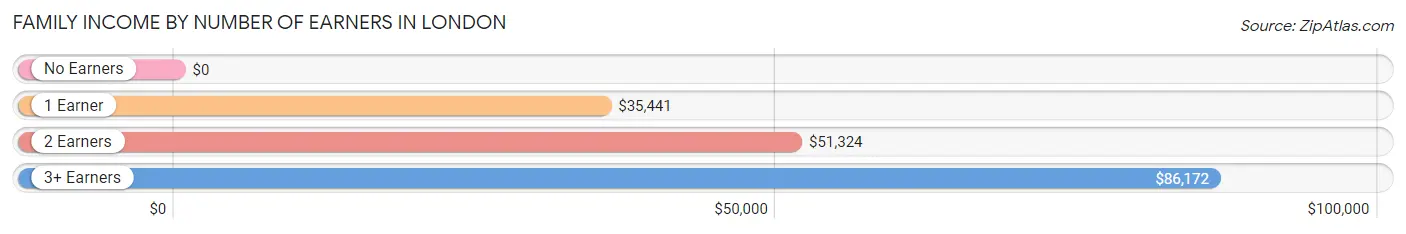
| Number of Earners | # Families | Median Income |
| No Earners | 15 (4.2%) | $0 |
| 1 Earner | 136 (38.2%) | $35,441 |
| 2 Earners | 128 (36.0%) | $51,324 |
| 3+ Earners | 77 (21.6%) | $86,172 |
| Total | 356 (100.0%) | $51,471 |
Household Income in London
Household Income Brackets in London
With 86 households falling in the category, the $50,000 to $74,999 income range is the most frequent in London, accounting for 20.4% of all households. In contrast, only 4 households (0.9%) fall into the $200,000+ income bracket, making it the least populous group.
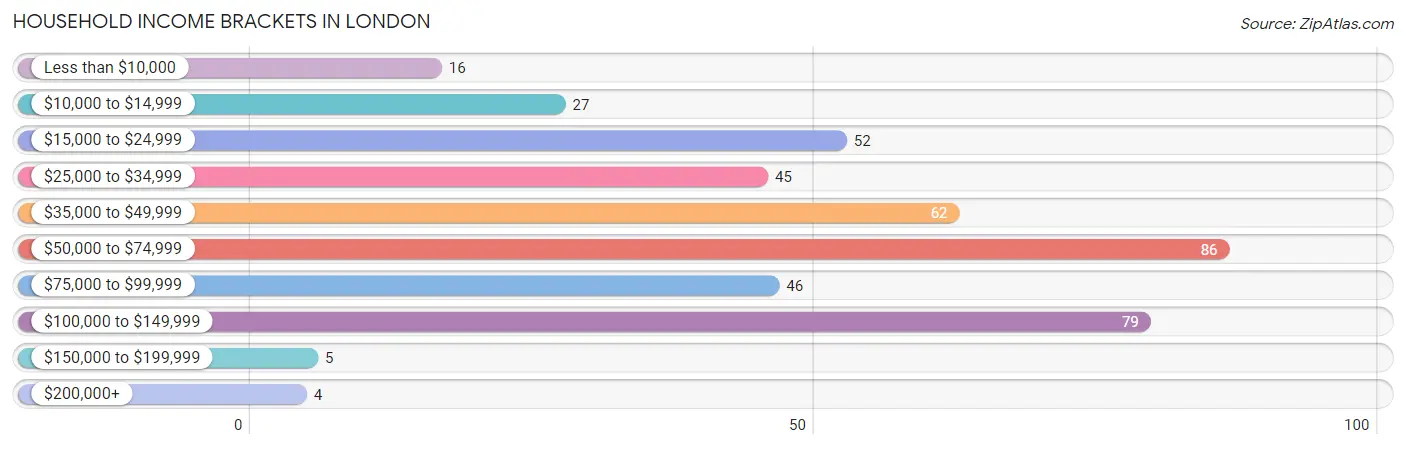
| Income Bracket | # Households | % Households |
| Less than $10,000 | 16 | 3.8% |
| $10,000 to $14,999 | 27 | 6.4% |
| $15,000 to $24,999 | 52 | 12.3% |
| $25,000 to $34,999 | 45 | 10.7% |
| $35,000 to $49,999 | 62 | 14.7% |
| $50,000 to $74,999 | 86 | 20.4% |
| $75,000 to $99,999 | 46 | 10.9% |
| $100,000 to $149,999 | 79 | 18.7% |
| $150,000 to $199,999 | 5 | 1.2% |
| $200,000+ | 4 | 0.9% |
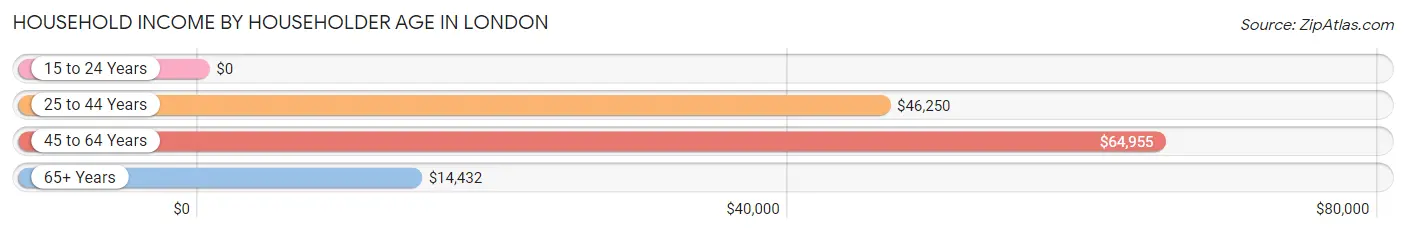
Household Income by Householder Age in London
The median household income in London is $51,324, with the highest median household income of $64,955 found in the 45 to 64 years age bracket for the primary householder. A total of 163 households (38.6%) fall into this category.
| Income Bracket | # Households | Median Income |
| 15 to 24 Years | 0 (0.0%) | $0 |
| 25 to 44 Years | 218 (51.7%) | $46,250 |
| 45 to 64 Years | 163 (38.6%) | $64,955 |
| 65+ Years | 41 (9.7%) | $14,432 |
| Total | 422 (100.0%) | $51,324 |
Poverty in London
Income Below Poverty by Sex and Age in London
With 36.8% poverty level for males and 31.2% for females among the residents of London, 15 year old males and 5 year old females are the most vulnerable to poverty, with 6 males (100.0%) and 34 females (100.0%) in their respective age groups living below the poverty level.
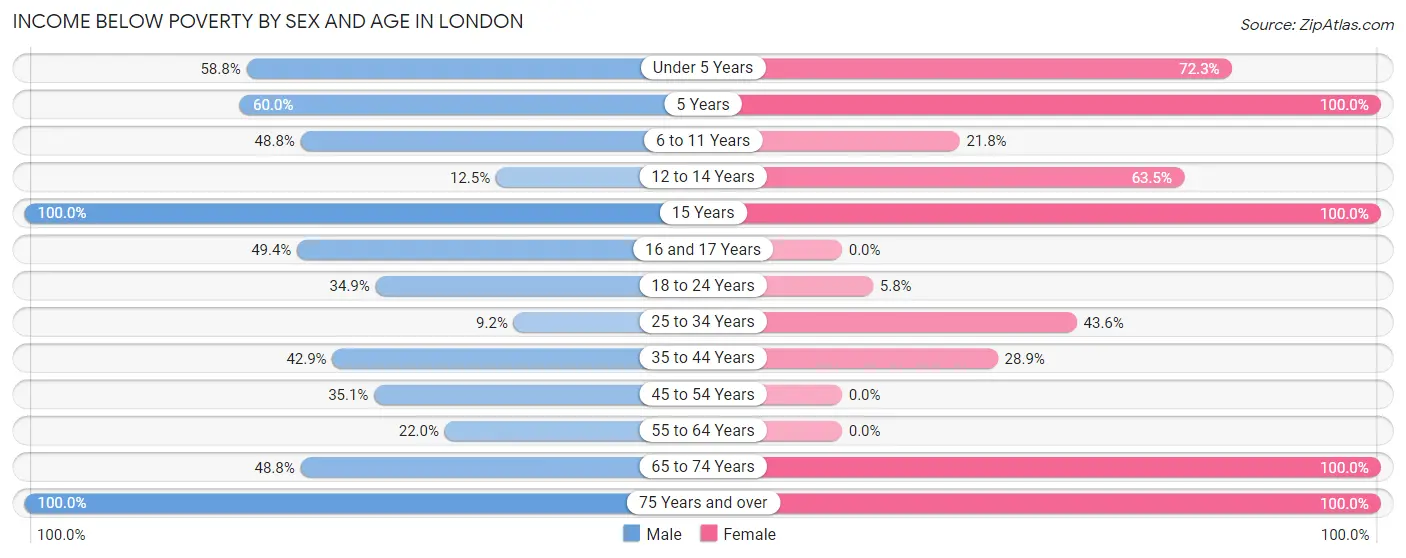
| Age Bracket | Male | Female |
| Under 5 Years | 40 (58.8%) | 47 (72.3%) |
| 5 Years | 18 (60.0%) | 34 (100.0%) |
| 6 to 11 Years | 59 (48.8%) | 19 (21.8%) |
| 12 to 14 Years | 10 (12.5%) | 33 (63.5%) |
| 15 Years | 6 (100.0%) | 11 (100.0%) |
| 16 and 17 Years | 41 (49.4%) | 0 (0.0%) |
| 18 to 24 Years | 23 (34.8%) | 6 (5.8%) |
| 25 to 34 Years | 14 (9.2%) | 51 (43.6%) |
| 35 to 44 Years | 54 (42.9%) | 46 (28.9%) |
| 45 to 54 Years | 33 (35.1%) | 0 (0.0%) |
| 55 to 64 Years | 11 (22.0%) | 0 (0.0%) |
| 65 to 74 Years | 20 (48.8%) | 7 (100.0%) |
| 75 Years and over | 13 (100.0%) | 13 (100.0%) |
| Total | 342 (36.8%) | 267 (31.2%) |
Income Above Poverty by Sex and Age in London
According to the poverty statistics in London, males aged 25 to 34 years and females aged 16 and 17 years are the age groups that are most secure financially, with 90.8% of males and 100.0% of females in these age groups living above the poverty line.
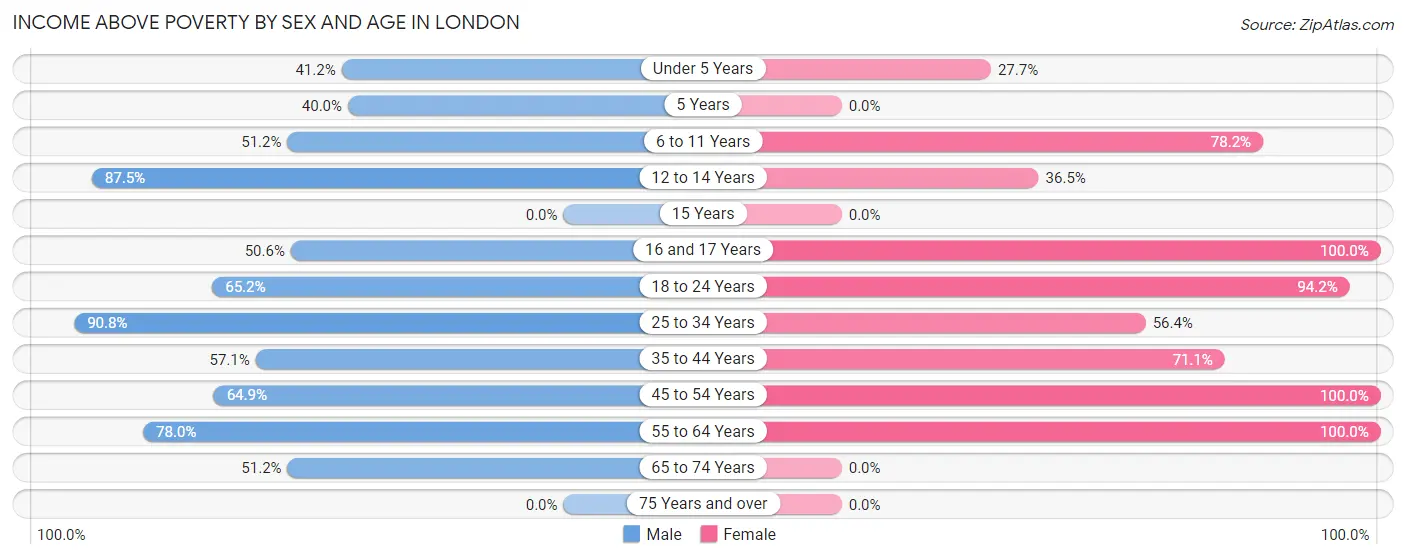
| Age Bracket | Male | Female |
| Under 5 Years | 28 (41.2%) | 18 (27.7%) |
| 5 Years | 12 (40.0%) | 0 (0.0%) |
| 6 to 11 Years | 62 (51.2%) | 68 (78.2%) |
| 12 to 14 Years | 70 (87.5%) | 19 (36.5%) |
| 15 Years | 0 (0.0%) | 0 (0.0%) |
| 16 and 17 Years | 42 (50.6%) | 41 (100.0%) |
| 18 to 24 Years | 43 (65.1%) | 98 (94.2%) |
| 25 to 34 Years | 138 (90.8%) | 66 (56.4%) |
| 35 to 44 Years | 72 (57.1%) | 113 (71.1%) |
| 45 to 54 Years | 61 (64.9%) | 84 (100.0%) |
| 55 to 64 Years | 39 (78.0%) | 81 (100.0%) |
| 65 to 74 Years | 21 (51.2%) | 0 (0.0%) |
| 75 Years and over | 0 (0.0%) | 0 (0.0%) |
| Total | 588 (63.2%) | 588 (68.8%) |
Income Below Poverty Among Married-Couple Families in London
The poverty statistics for married-couple families in London show that 43.3% or 61 of the total 141 families live below the poverty line. Families with 5 or more children have the highest poverty rate of 100.0%, comprising of 12 families. On the other hand, families with no children have the lowest poverty rate of 25.0%, which includes 8 families.
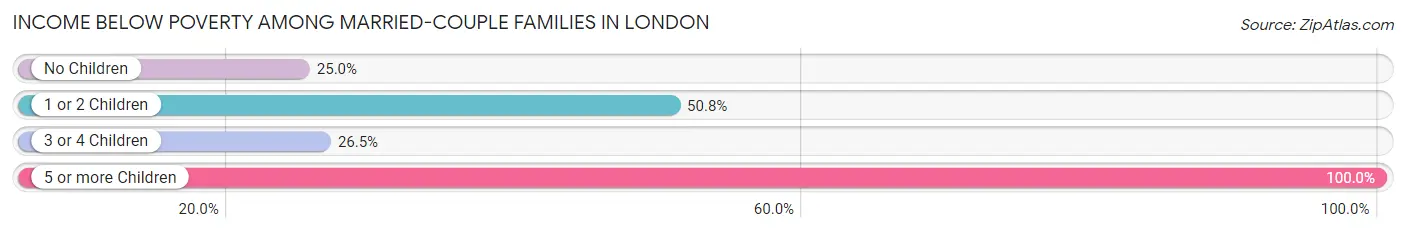
| Children | Above Poverty | Below Poverty |
| No Children | 24 (75.0%) | 8 (25.0%) |
| 1 or 2 Children | 31 (49.2%) | 32 (50.8%) |
| 3 or 4 Children | 25 (73.5%) | 9 (26.5%) |
| 5 or more Children | 0 (0.0%) | 12 (100.0%) |
| Total | 80 (56.7%) | 61 (43.3%) |
Income Below Poverty Among Single-Parent Households in London
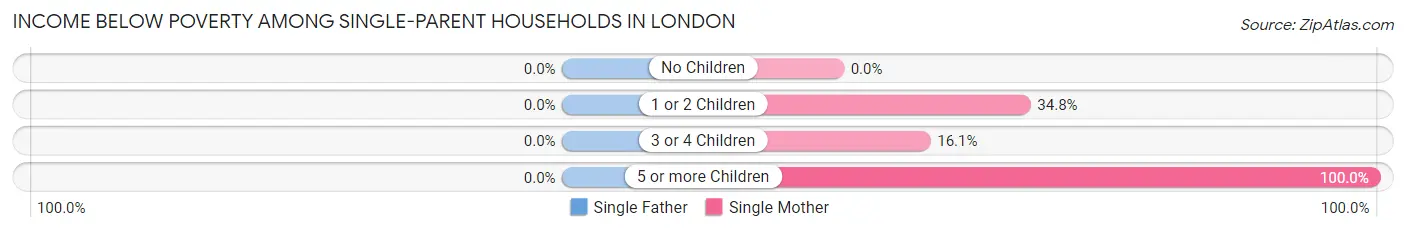
| Children | Single Father | Single Mother |
| No Children | 0 (0.0%) | 0 (0.0%) |
| 1 or 2 Children | 0 (0.0%) | 24 (34.8%) |
| 3 or 4 Children | 0 (0.0%) | 5 (16.1%) |
| 5 or more Children | 0 (0.0%) | 8 (100.0%) |
| Total | 0 (0.0%) | 37 (24.5%) |
Income Below Poverty Among Married-Couple vs Single-Parent Households in London
The poverty data for London shows that 61 of the married-couple family households (43.3%) and 37 of the single-parent households (17.2%) are living below the poverty level. Within the married-couple family households, those with 5 or more children have the highest poverty rate, with 12 households (100.0%) falling below the poverty line. Among the single-parent households, those with 5 or more children have the highest poverty rate, with 8 household (100.0%) living below poverty.
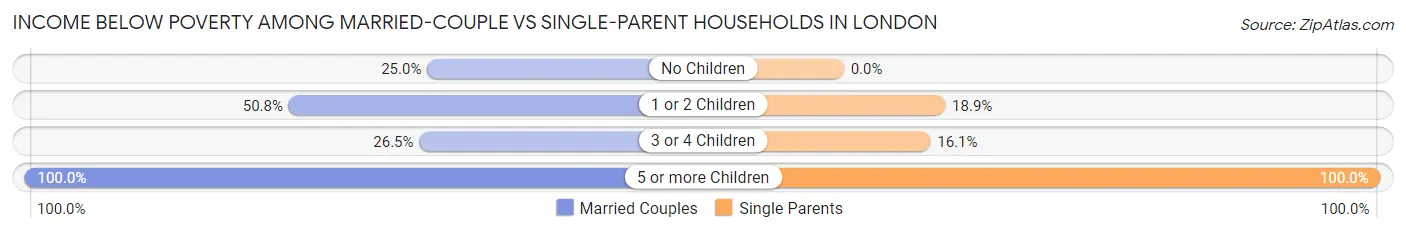
| Children | Married-Couple Families | Single-Parent Households |
| No Children | 8 (25.0%) | 0 (0.0%) |
| 1 or 2 Children | 32 (50.8%) | 24 (18.9%) |
| 3 or 4 Children | 9 (26.5%) | 5 (16.1%) |
| 5 or more Children | 12 (100.0%) | 8 (100.0%) |
| Total | 61 (43.3%) | 37 (17.2%) |
Race in London
The most populous races in London are Hispanic or Latino (1,629 | 91.3%), Some other Race (603 | 33.8%), and Two or more Races (577 | 32.3%).
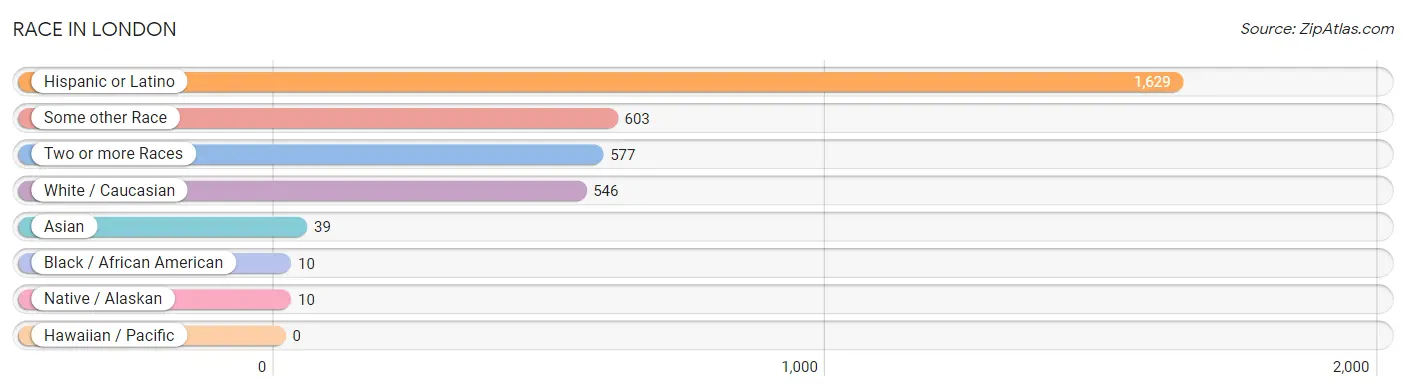
| Race | # Population | % Population |
| Asian | 39 | 2.2% |
| Black / African American | 10 | 0.6% |
| Hawaiian / Pacific | 0 | 0.0% |
| Hispanic or Latino | 1,629 | 91.3% |
| Native / Alaskan | 10 | 0.6% |
| White / Caucasian | 546 | 30.6% |
| Two or more Races | 577 | 32.3% |
| Some other Race | 603 | 33.8% |
| Total | 1,785 | 100.0% |
Ancestry in London
The most populous ancestries reported in London are Mexican (1,626 | 91.1%), Malaysian (62 | 3.5%), Scotch-Irish (15 | 0.8%), American (11 | 0.6%), and Mexican American Indian (10 | 0.6%), together accounting for 96.6% of all London residents.
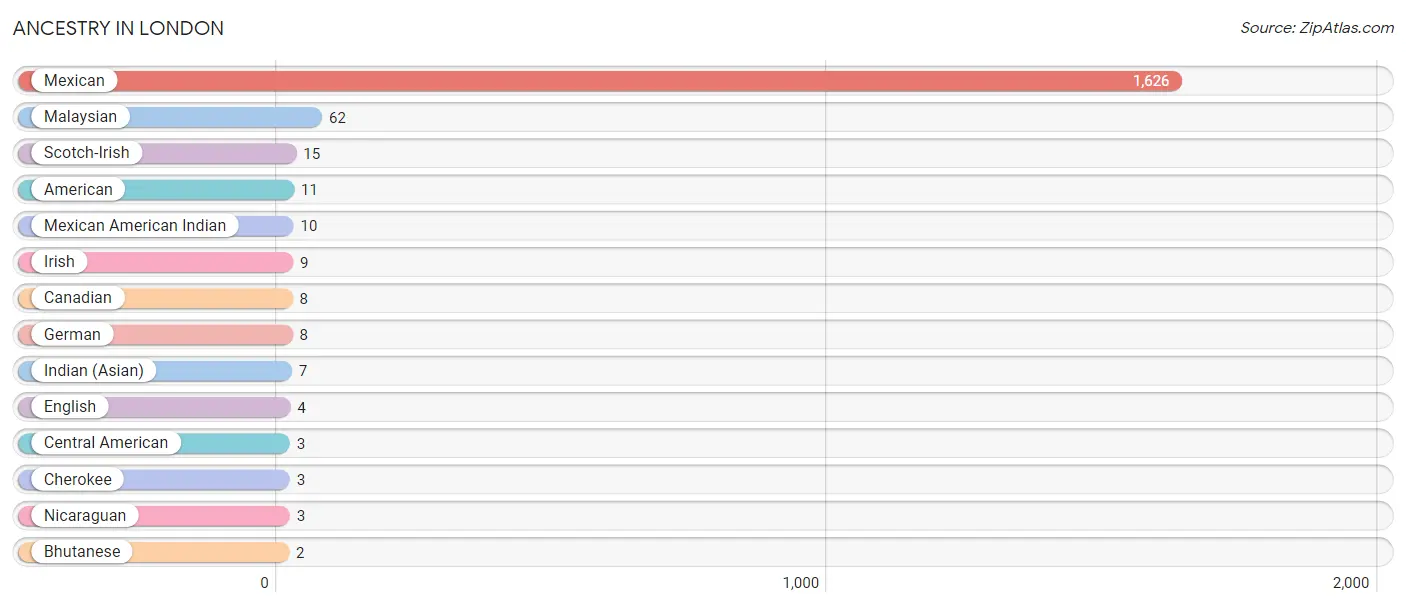
| Ancestry | # Population | % Population |
| American | 11 | 0.6% |
| Bhutanese | 2 | 0.1% |
| Canadian | 8 | 0.4% |
| Central American | 3 | 0.2% |
| Cherokee | 3 | 0.2% |
| English | 4 | 0.2% |
| German | 8 | 0.4% |
| Indian (Asian) | 7 | 0.4% |
| Irish | 9 | 0.5% |
| Malaysian | 62 | 3.5% |
| Mexican | 1,626 | 91.1% |
| Mexican American Indian | 10 | 0.6% |
| Nicaraguan | 3 | 0.2% |
| Scotch-Irish | 15 | 0.8% | View All 14 Rows |
Immigrants in London
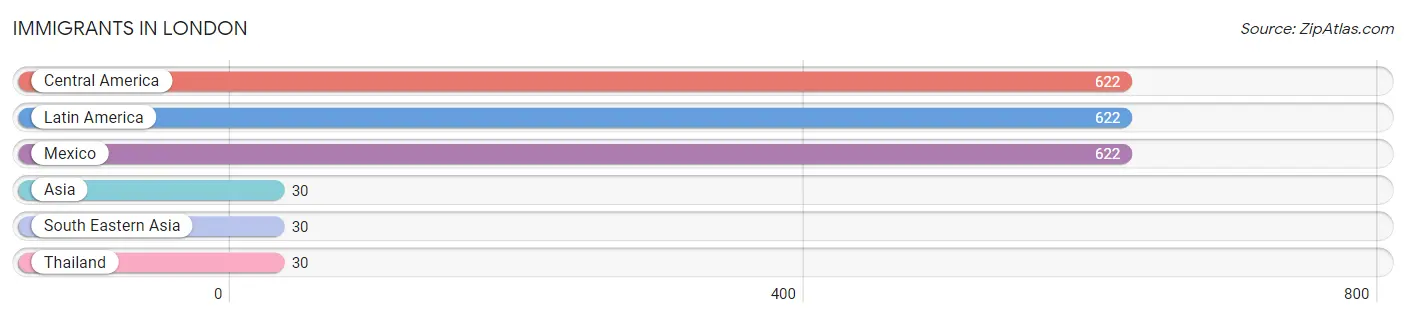
The most numerous immigrant groups reported in London came from Central America (622 | 34.8%), Latin America (622 | 34.8%), Mexico (622 | 34.8%), Asia (30 | 1.7%), and South Eastern Asia (30 | 1.7%), together accounting for 107.9% of all London residents.
| Immigration Origin | # Population | % Population |
| Asia | 30 | 1.7% |
| Central America | 622 | 34.8% |
| Latin America | 622 | 34.8% |
| Mexico | 622 | 34.8% |
| South Eastern Asia | 30 | 1.7% |
| Thailand | 30 | 1.7% | View All 6 Rows |
Sex and Age in London
Sex and Age in London
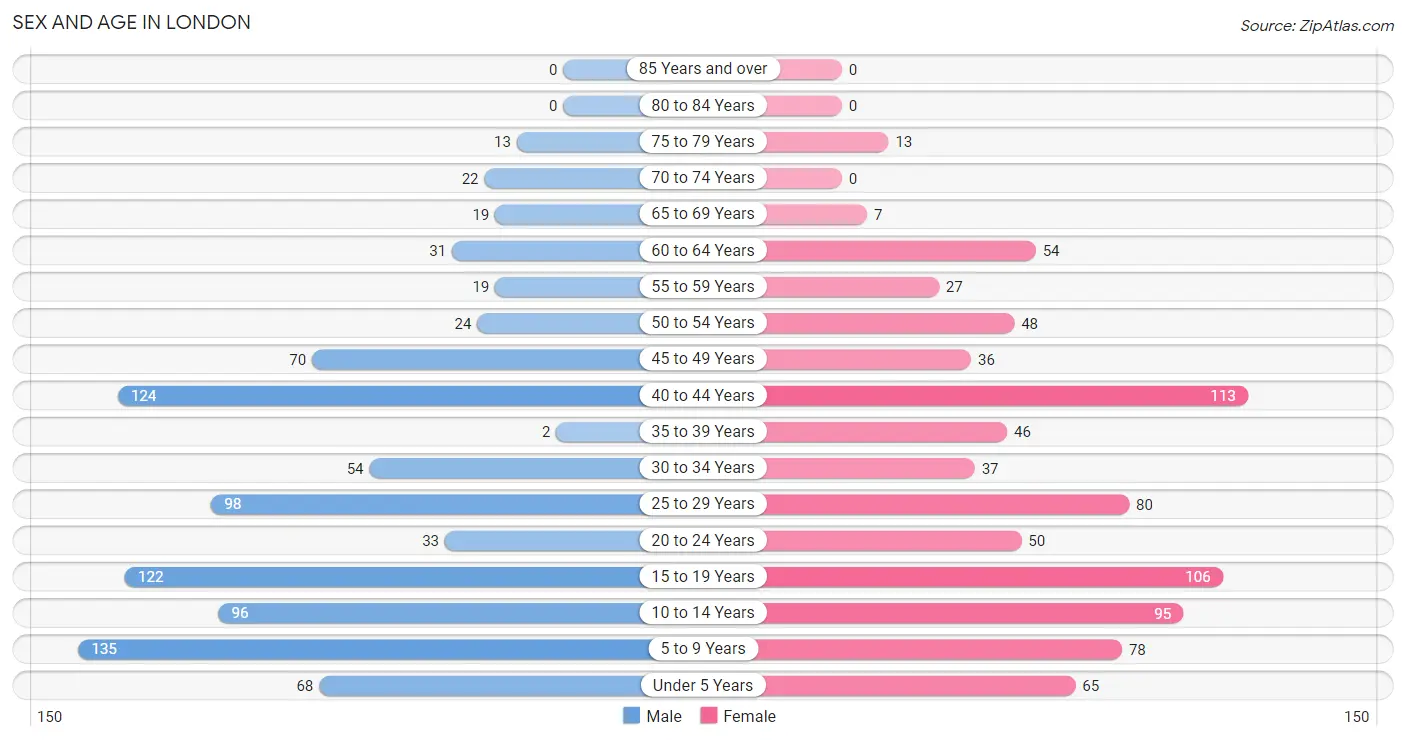
The most populous age groups in London are 5 to 9 Years (135 | 14.5%) for men and 40 to 44 Years (113 | 13.2%) for women.
| Age Bracket | Male | Female |
| Under 5 Years | 68 (7.3%) | 65 (7.6%) |
| 5 to 9 Years | 135 (14.5%) | 78 (9.1%) |
| 10 to 14 Years | 96 (10.3%) | 95 (11.1%) |
| 15 to 19 Years | 122 (13.1%) | 106 (12.4%) |
| 20 to 24 Years | 33 (3.5%) | 50 (5.9%) |
| 25 to 29 Years | 98 (10.5%) | 80 (9.4%) |
| 30 to 34 Years | 54 (5.8%) | 37 (4.3%) |
| 35 to 39 Years | 2 (0.2%) | 46 (5.4%) |
| 40 to 44 Years | 124 (13.3%) | 113 (13.2%) |
| 45 to 49 Years | 70 (7.5%) | 36 (4.2%) |
| 50 to 54 Years | 24 (2.6%) | 48 (5.6%) |
| 55 to 59 Years | 19 (2.0%) | 27 (3.2%) |
| 60 to 64 Years | 31 (3.3%) | 54 (6.3%) |
| 65 to 69 Years | 19 (2.0%) | 7 (0.8%) |
| 70 to 74 Years | 22 (2.4%) | 0 (0.0%) |
| 75 to 79 Years | 13 (1.4%) | 13 (1.5%) |
| 80 to 84 Years | 0 (0.0%) | 0 (0.0%) |
| 85 Years and over | 0 (0.0%) | 0 (0.0%) |
| Total | 930 (100.0%) | 855 (100.0%) |
Families and Households in London
Median Family Size in London
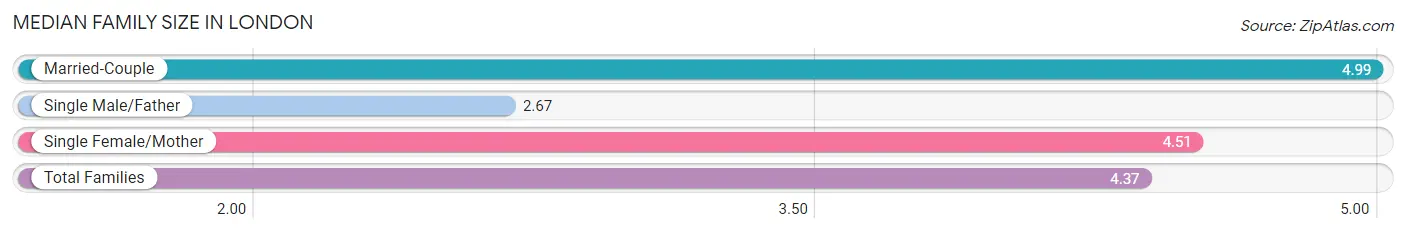
The median family size in London is 4.37 persons per family, with married-couple families (141 | 39.6%) accounting for the largest median family size of 4.99 persons per family. On the other hand, single male/father families (64 | 18.0%) represent the smallest median family size with 2.67 persons per family.
| Family Type | # Families | Family Size |
| Married-Couple | 141 (39.6%) | 4.99 |
| Single Male/Father | 64 (18.0%) | 2.67 |
| Single Female/Mother | 151 (42.4%) | 4.51 |
| Total Families | 356 (100.0%) | 4.37 |
Median Household Size in London
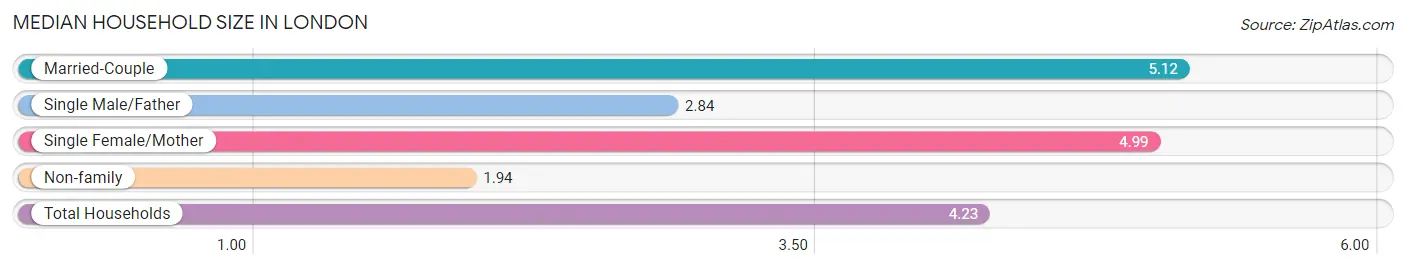
The median household size in London is 4.23 persons per household, with married-couple households (141 | 33.4%) accounting for the largest median household size of 5.12 persons per household. non-family households (66 | 15.6%) represent the smallest median household size with 1.94 persons per household.
| Household Type | # Households | Household Size |
| Married-Couple | 141 (33.4%) | 5.12 |
| Single Male/Father | 64 (15.2%) | 2.84 |
| Single Female/Mother | 151 (35.8%) | 4.99 |
| Non-family | 66 (15.6%) | 1.94 |
| Total Households | 422 (100.0%) | 4.23 |
Household Size by Marriage Status in London
Out of a total of 422 households in London, 356 (84.4%) are family households, while 66 (15.6%) are nonfamily households. The most numerous type of family households are 5-person households, comprising 90, and the most common type of nonfamily households are 1-person households, comprising 45.
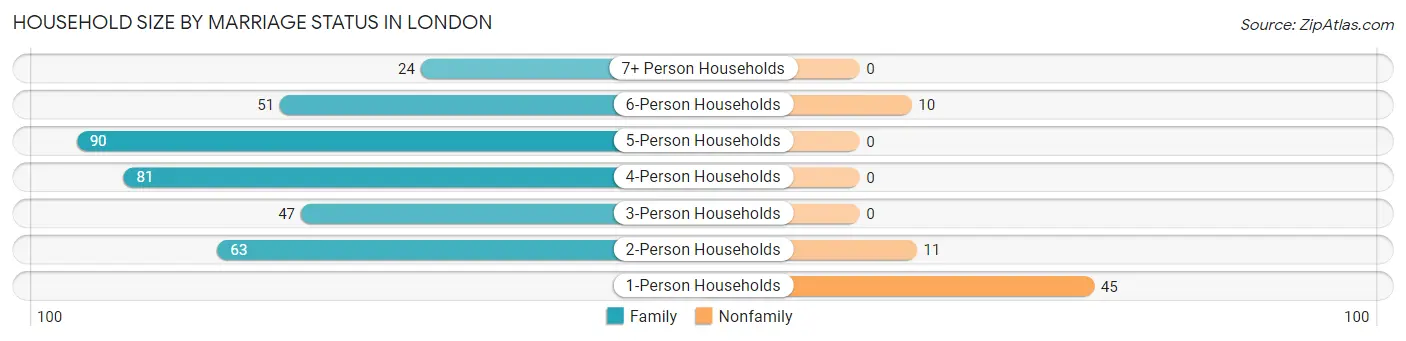
| Household Size | Family Households | Nonfamily Households |
| 1-Person Households | - | 45 (10.7%) |
| 2-Person Households | 63 (14.9%) | 11 (2.6%) |
| 3-Person Households | 47 (11.1%) | 0 (0.0%) |
| 4-Person Households | 81 (19.2%) | 0 (0.0%) |
| 5-Person Households | 90 (21.3%) | 0 (0.0%) |
| 6-Person Households | 51 (12.1%) | 10 (2.4%) |
| 7+ Person Households | 24 (5.7%) | 0 (0.0%) |
| Total | 356 (84.4%) | 66 (15.6%) |
Female Fertility in London
Fertility by Age in London
Average fertility rate in London is 37.0 births per 1,000 women. Women in the age bracket of 20 to 34 years have the highest fertility rate with 108.0 births per 1,000 women. Women in the age bracket of 20 to 34 years acount for 100.0% of all women with births.
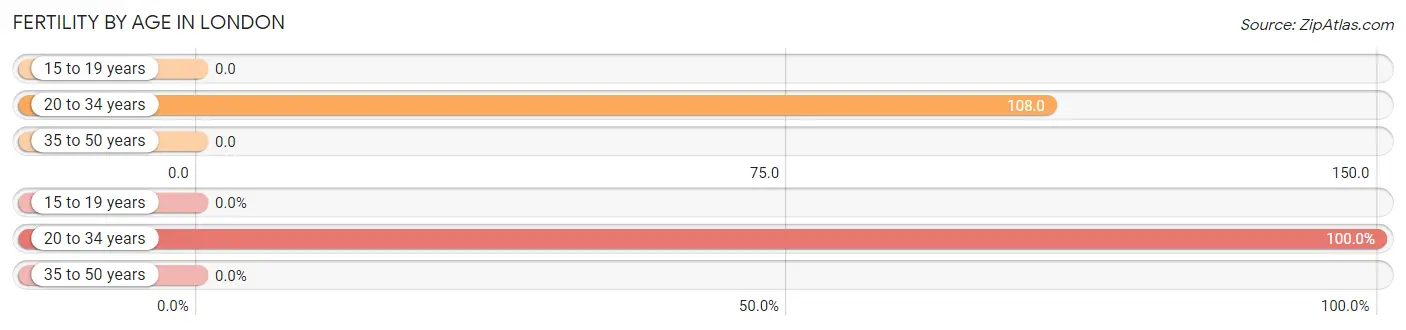
| Age Bracket | Women with Births | Births / 1,000 Women |
| 15 to 19 years | 0 (0.0%) | 0.0 |
| 20 to 34 years | 18 (100.0%) | 108.0 |
| 35 to 50 years | 0 (0.0%) | 0.0 |
| Total | 18 (100.0%) | 37.0 |
Fertility by Age by Marriage Status in London
38.9% of women with births (18) in London are married. The highest percentage of unmarried women with births falls into 20 to 34 years age bracket with 61.1% of them unmarried at the time of birth, while the lowest percentage of unmarried women with births belong to 20 to 34 years age bracket with 61.1% of them unmarried.
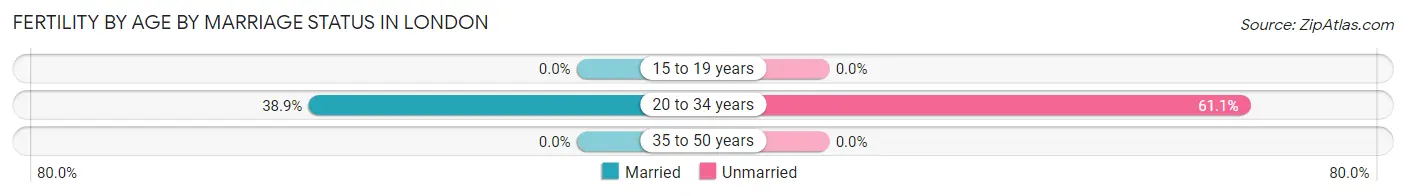
| Age Bracket | Married | Unmarried |
| 15 to 19 years | 0 (0.0%) | 0 (0.0%) |
| 20 to 34 years | 7 (38.9%) | 11 (61.1%) |
| 35 to 50 years | 0 (0.0%) | 0 (0.0%) |
| Total | 7 (38.9%) | 11 (61.1%) |
Fertility by Education in London
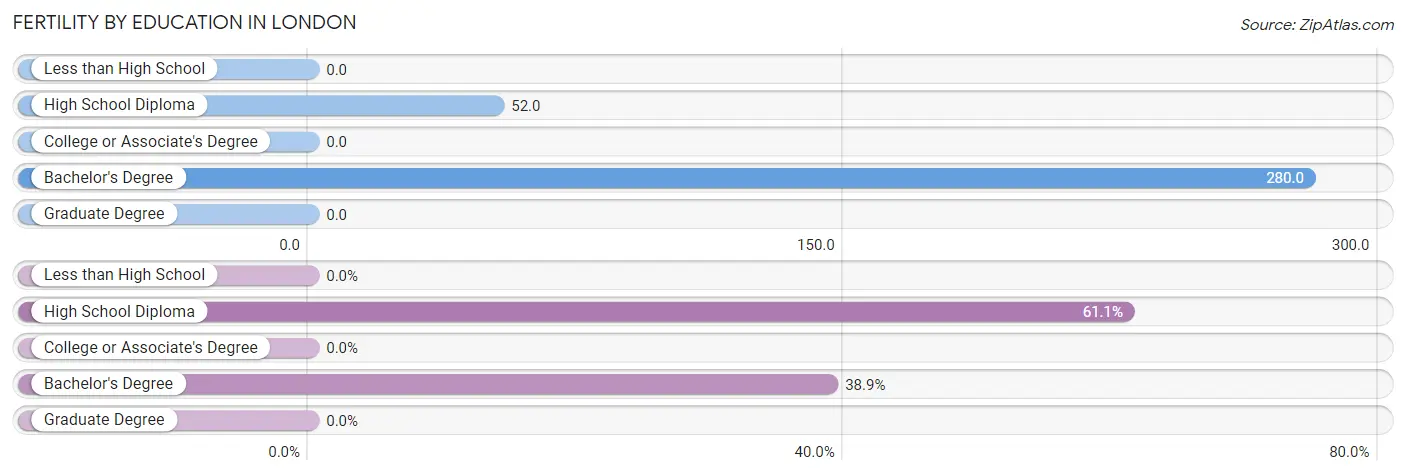
| Educational Attainment | Women with Births | Births / 1,000 Women |
| Less than High School | 0 (0.0%) | 0.0 |
| High School Diploma | 11 (61.1%) | 52.0 |
| College or Associate's Degree | 0 (0.0%) | 0.0 |
| Bachelor's Degree | 7 (38.9%) | 280.0 |
| Graduate Degree | 0 (0.0%) | 0.0 |
| Total | 18 (100.0%) | 37.0 |
Fertility by Education by Marriage Status in London
61.1% of women with births in London are unmarried. Women with the educational attainment of bachelor's degree are most likely to be married with 100.0% of them married at childbirth, while women with the educational attainment of high school diploma are least likely to be married with 100.0% of them unmarried at childbirth.
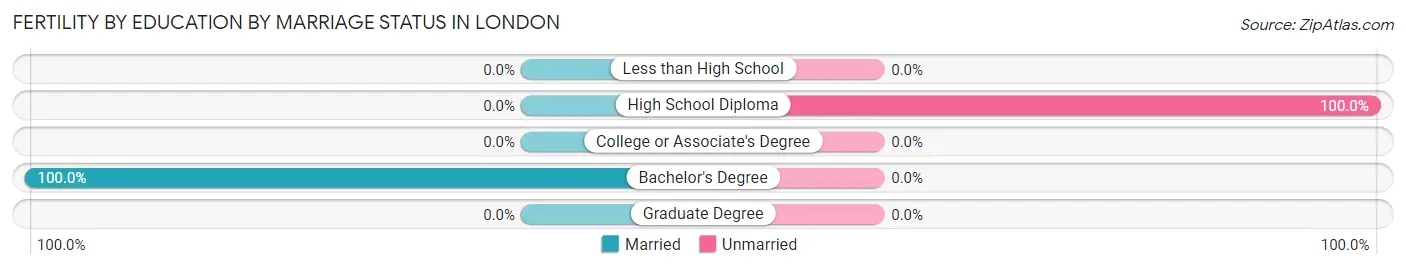
| Educational Attainment | Married | Unmarried |
| Less than High School | 0 (0.0%) | 0 (0.0%) |
| High School Diploma | 0 (0.0%) | 11 (100.0%) |
| College or Associate's Degree | 0 (0.0%) | 0 (0.0%) |
| Bachelor's Degree | 7 (100.0%) | 0 (0.0%) |
| Graduate Degree | 0 (0.0%) | 0 (0.0%) |
| Total | 7 (38.9%) | 11 (61.1%) |
Employment Characteristics in London
Employment by Class of Employer in London
Among the 599 employed individuals in London, private company employees (476 | 79.5%), local government employees (45 | 7.5%), and self-employed (not incorporated) (44 | 7.3%) make up the most common classes of employment.
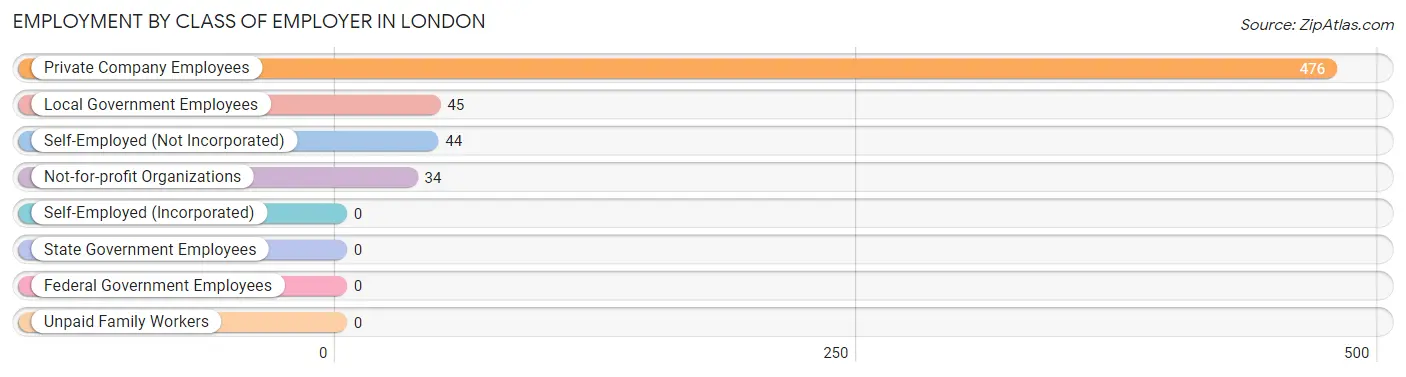
| Employer Class | # Employees | % Employees |
| Private Company Employees | 476 | 79.5% |
| Self-Employed (Incorporated) | 0 | 0.0% |
| Self-Employed (Not Incorporated) | 44 | 7.3% |
| Not-for-profit Organizations | 34 | 5.7% |
| Local Government Employees | 45 | 7.5% |
| State Government Employees | 0 | 0.0% |
| Federal Government Employees | 0 | 0.0% |
| Unpaid Family Workers | 0 | 0.0% |
| Total | 599 | 100.0% |
Employment Status by Age in London
According to the labor force statistics for London, out of the total population over 16 years of age (1,231), 56.2% or 692 individuals are in the labor force, with 10.7% or 74 of them unemployed. The age group with the highest labor force participation rate is 55 to 59 years, with 100.0% or 46 individuals in the labor force. Within the labor force, the 16 to 19 years age range has the highest percentage of unemployed individuals, with 45.8% or 22 of them being unemployed.
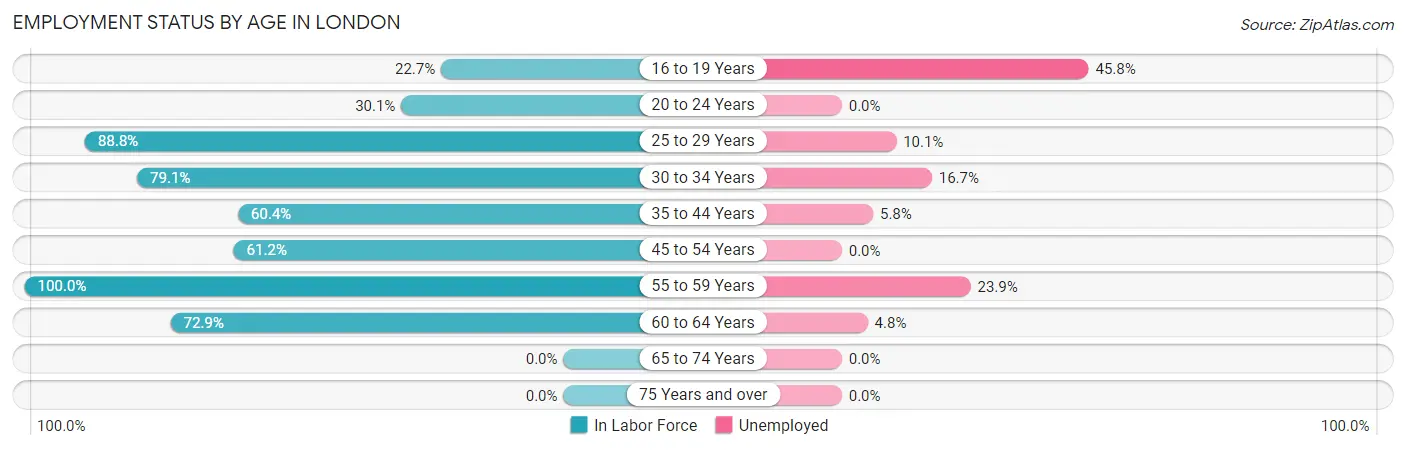
| Age Bracket | In Labor Force | Unemployed |
| 16 to 19 Years | 48 (22.7%) | 22 (45.8%) |
| 20 to 24 Years | 25 (30.1%) | 0 (0.0%) |
| 25 to 29 Years | 158 (88.8%) | 16 (10.1%) |
| 30 to 34 Years | 72 (79.1%) | 12 (16.7%) |
| 35 to 44 Years | 172 (60.4%) | 10 (5.8%) |
| 45 to 54 Years | 109 (61.2%) | 0 (0.0%) |
| 55 to 59 Years | 46 (100.0%) | 11 (23.9%) |
| 60 to 64 Years | 62 (72.9%) | 3 (4.8%) |
| 65 to 74 Years | 0 (0.0%) | 0 (0.0%) |
| 75 Years and over | 0 (0.0%) | 0 (0.0%) |
| Total | 692 (56.2%) | 74 (10.7%) |
Employment Status by Educational Attainment in London
According to labor force statistics for London, 71.7% of individuals (619) out of the total population between 25 and 64 years of age (863) are in the labor force, with 8.4% or 52 of them being unemployed. The group with the highest labor force participation rate are those with the educational attainment of bachelor's degree or higher, with 79.2% or 38 individuals in the labor force. Within the labor force, individuals with high school diploma education have the highest percentage of unemployment, with 11.9% or 25 of them being unemployed.
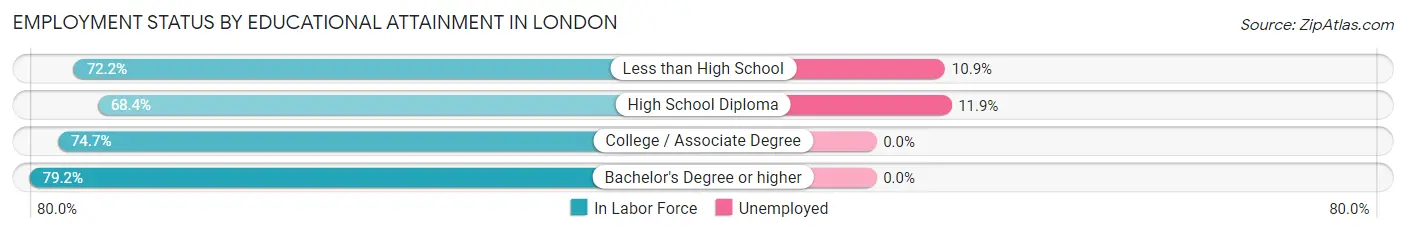
| Educational Attainment | In Labor Force | Unemployed |
| Less than High School | 247 (72.2%) | 37 (10.9%) |
| High School Diploma | 210 (68.4%) | 37 (11.9%) |
| College / Associate Degree | 124 (74.7%) | 0 (0.0%) |
| Bachelor's Degree or higher | 38 (79.2%) | 0 (0.0%) |
| Total | 619 (71.7%) | 72 (8.4%) |
Employment Occupations by Sex in London
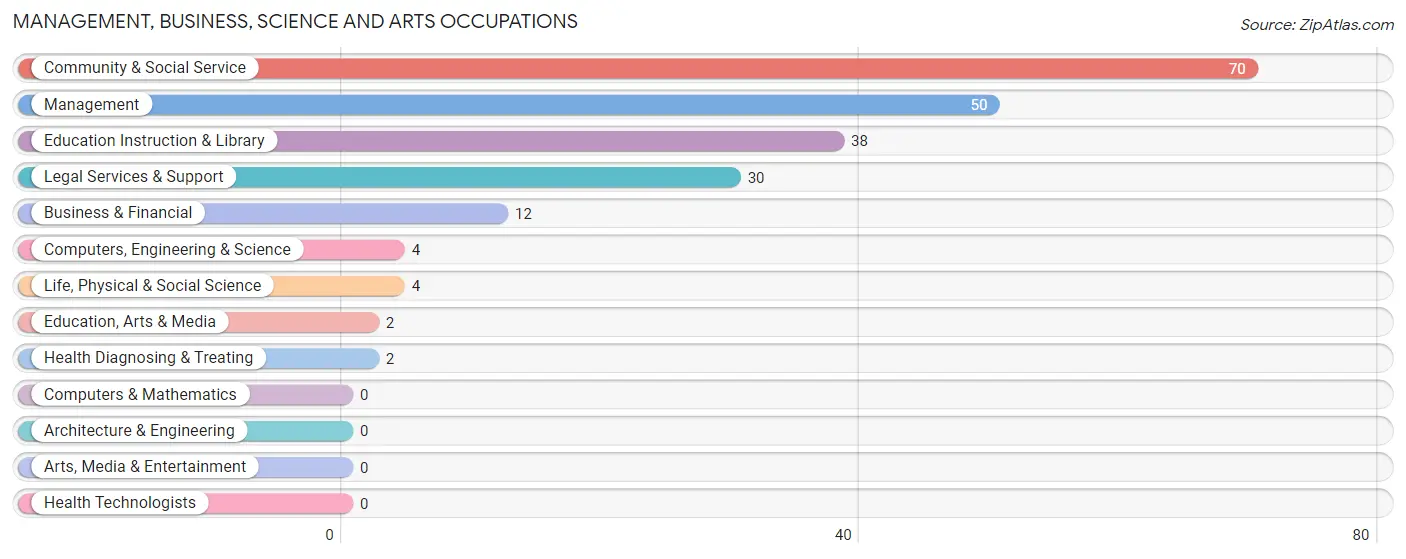
Management, Business, Science and Arts Occupations
The most common Management, Business, Science and Arts occupations in London are Community & Social Service (70 | 11.3%), Management (50 | 8.1%), Education Instruction & Library (38 | 6.1%), Legal Services & Support (30 | 4.9%), and Business & Financial (12 | 1.9%).
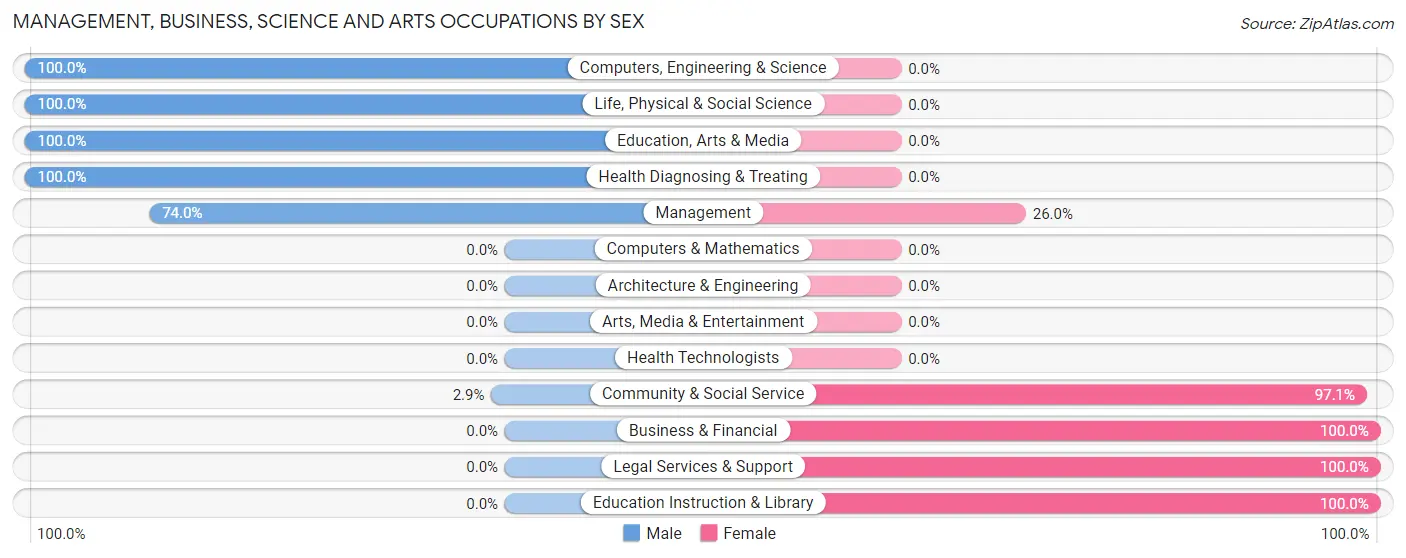
Management, Business, Science and Arts Occupations by Sex
Within the Management, Business, Science and Arts occupations in London, the most male-oriented occupations are Computers, Engineering & Science (100.0%), Life, Physical & Social Science (100.0%), and Education, Arts & Media (100.0%), while the most female-oriented occupations are Business & Financial (100.0%), Legal Services & Support (100.0%), and Education Instruction & Library (100.0%).
| Occupation | Male | Female |
| Management | 37 (74.0%) | 13 (26.0%) |
| Business & Financial | 0 (0.0%) | 12 (100.0%) |
| Computers, Engineering & Science | 4 (100.0%) | 0 (0.0%) |
| Computers & Mathematics | 0 (0.0%) | 0 (0.0%) |
| Architecture & Engineering | 0 (0.0%) | 0 (0.0%) |
| Life, Physical & Social Science | 4 (100.0%) | 0 (0.0%) |
| Community & Social Service | 2 (2.9%) | 68 (97.1%) |
| Education, Arts & Media | 2 (100.0%) | 0 (0.0%) |
| Legal Services & Support | 0 (0.0%) | 30 (100.0%) |
| Education Instruction & Library | 0 (0.0%) | 38 (100.0%) |
| Arts, Media & Entertainment | 0 (0.0%) | 0 (0.0%) |
| Health Diagnosing & Treating | 2 (100.0%) | 0 (0.0%) |
| Health Technologists | 0 (0.0%) | 0 (0.0%) |
| Total (Category) | 45 (32.6%) | 93 (67.4%) |
| Total (Overall) | 316 (51.1%) | 302 (48.9%) |
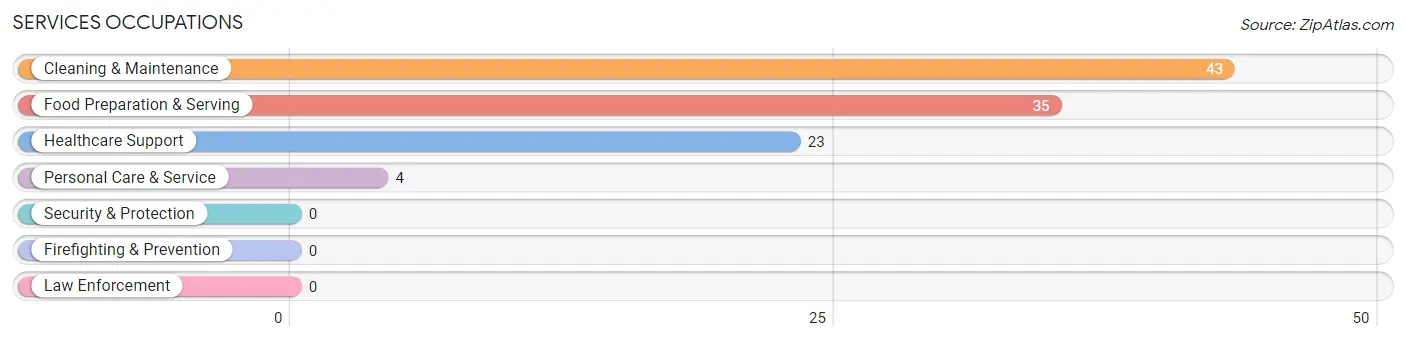
Services Occupations
The most common Services occupations in London are Cleaning & Maintenance (43 | 7.0%), Food Preparation & Serving (35 | 5.7%), Healthcare Support (23 | 3.7%), and Personal Care & Service (4 | 0.6%).
Services Occupations by Sex
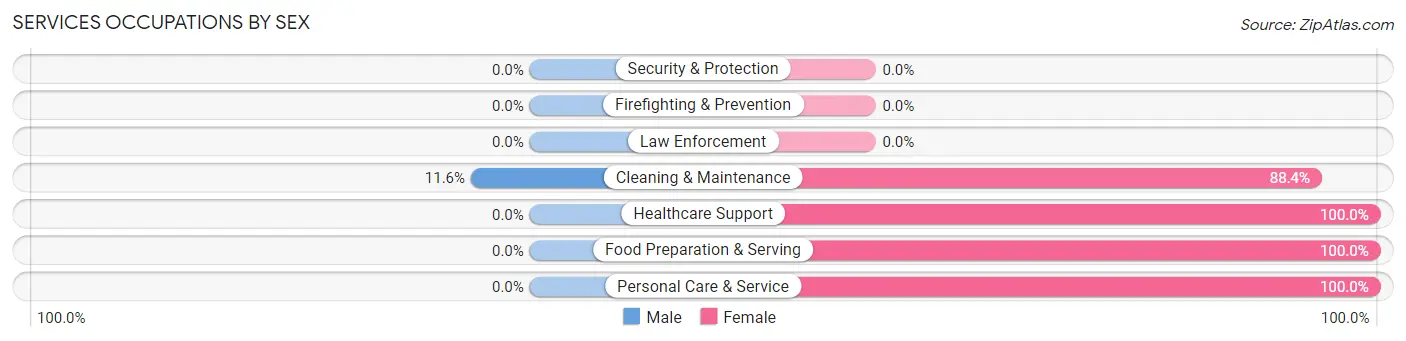
| Occupation | Male | Female |
| Healthcare Support | 0 (0.0%) | 23 (100.0%) |
| Security & Protection | 0 (0.0%) | 0 (0.0%) |
| Firefighting & Prevention | 0 (0.0%) | 0 (0.0%) |
| Law Enforcement | 0 (0.0%) | 0 (0.0%) |
| Food Preparation & Serving | 0 (0.0%) | 35 (100.0%) |
| Cleaning & Maintenance | 5 (11.6%) | 38 (88.4%) |
| Personal Care & Service | 0 (0.0%) | 4 (100.0%) |
| Total (Category) | 5 (4.8%) | 100 (95.2%) |
| Total (Overall) | 316 (51.1%) | 302 (48.9%) |
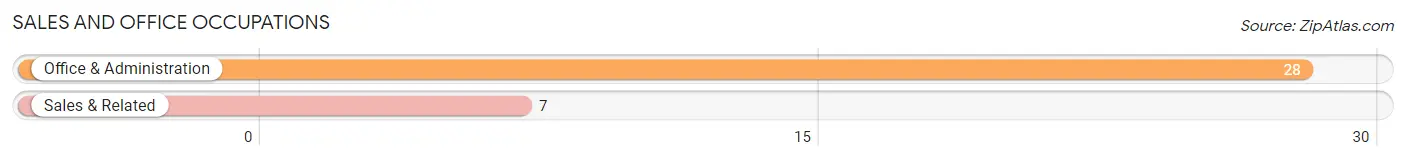
Sales and Office Occupations
The most common Sales and Office occupations in London are Office & Administration (28 | 4.5%), and Sales & Related (7 | 1.1%).
Sales and Office Occupations by Sex

| Occupation | Male | Female |
| Sales & Related | 3 (42.9%) | 4 (57.1%) |
| Office & Administration | 17 (60.7%) | 11 (39.3%) |
| Total (Category) | 20 (57.1%) | 15 (42.9%) |
| Total (Overall) | 316 (51.1%) | 302 (48.9%) |
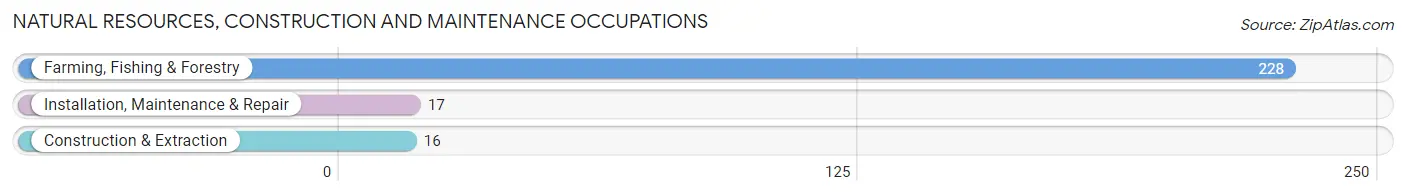
Natural Resources, Construction and Maintenance Occupations
The most common Natural Resources, Construction and Maintenance occupations in London are Farming, Fishing & Forestry (228 | 36.9%), Installation, Maintenance & Repair (17 | 2.8%), and Construction & Extraction (16 | 2.6%).
Natural Resources, Construction and Maintenance Occupations by Sex
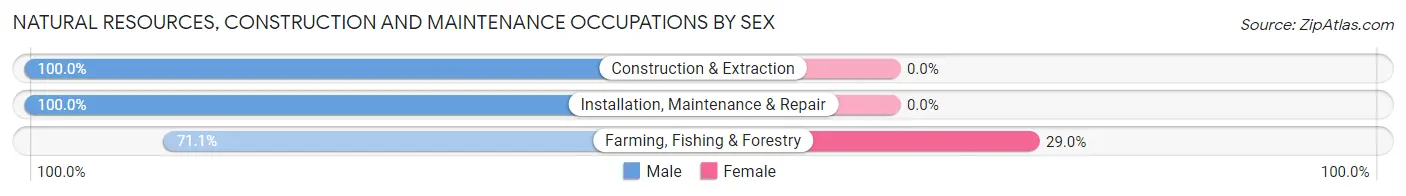
| Occupation | Male | Female |
| Farming, Fishing & Forestry | 162 (71.1%) | 66 (28.9%) |
| Construction & Extraction | 16 (100.0%) | 0 (0.0%) |
| Installation, Maintenance & Repair | 17 (100.0%) | 0 (0.0%) |
| Total (Category) | 195 (74.7%) | 66 (25.3%) |
| Total (Overall) | 316 (51.1%) | 302 (48.9%) |
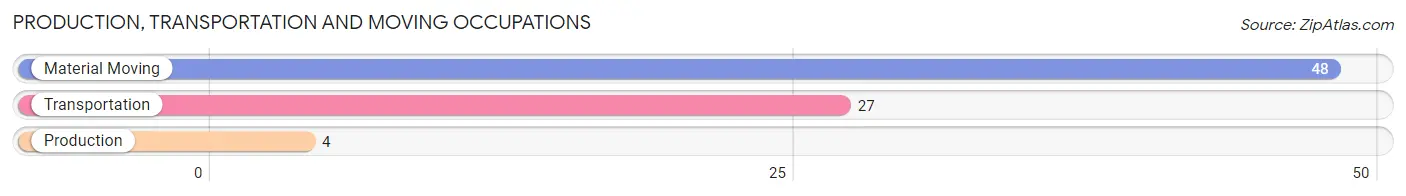
Production, Transportation and Moving Occupations
The most common Production, Transportation and Moving occupations in London are Material Moving (48 | 7.8%), Transportation (27 | 4.4%), and Production (4 | 0.6%).
Production, Transportation and Moving Occupations by Sex
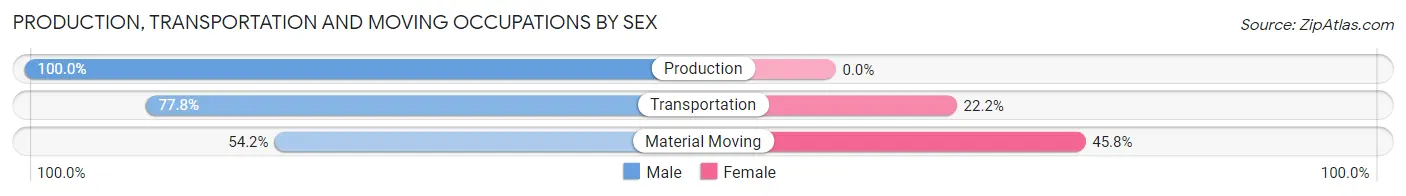
| Occupation | Male | Female |
| Production | 4 (100.0%) | 0 (0.0%) |
| Transportation | 21 (77.8%) | 6 (22.2%) |
| Material Moving | 26 (54.2%) | 22 (45.8%) |
| Total (Category) | 51 (64.6%) | 28 (35.4%) |
| Total (Overall) | 316 (51.1%) | 302 (48.9%) |
Employment Industries by Sex in London
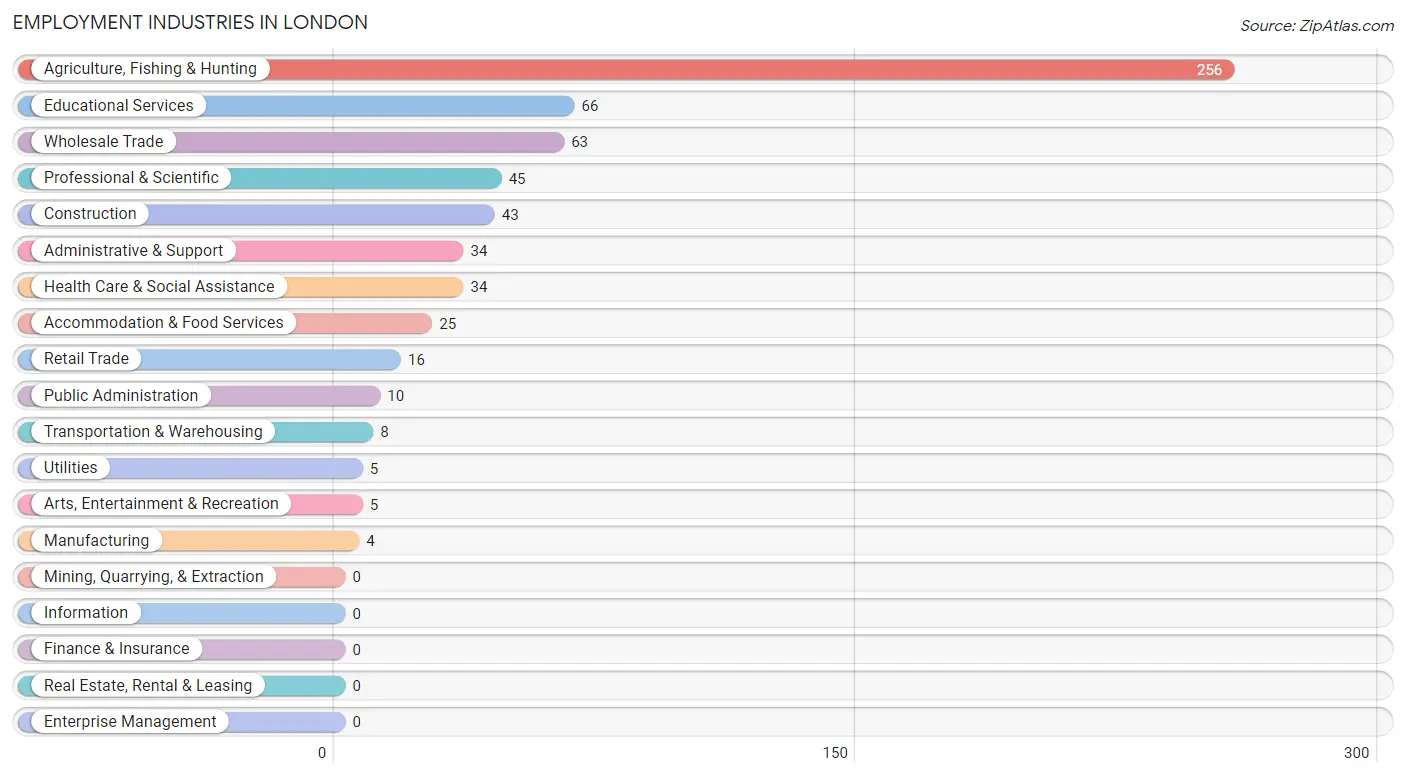
Employment Industries in London
The major employment industries in London include Agriculture, Fishing & Hunting (256 | 41.4%), Educational Services (66 | 10.7%), Wholesale Trade (63 | 10.2%), Professional & Scientific (45 | 7.3%), and Construction (43 | 7.0%).
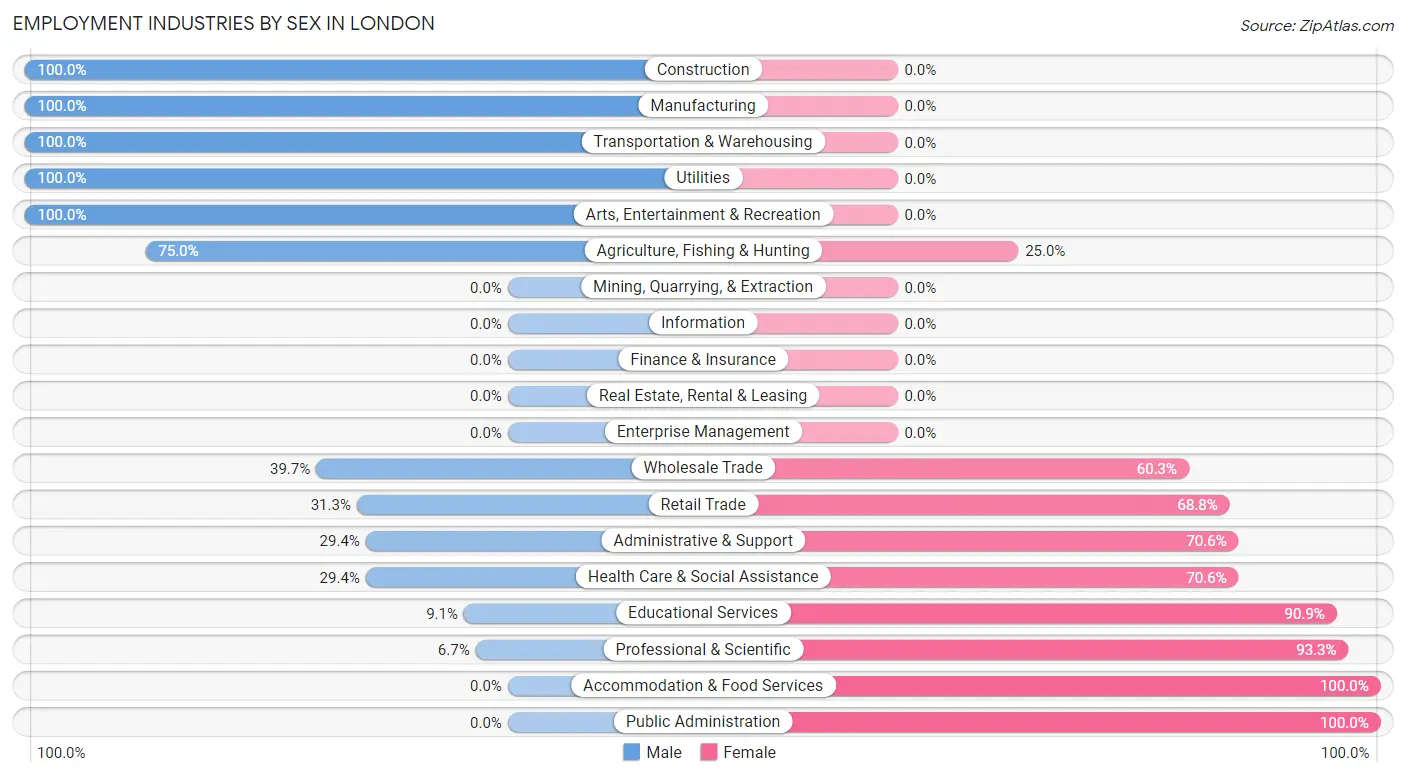
Employment Industries by Sex in London
The London industries that see more men than women are Construction (100.0%), Manufacturing (100.0%), and Transportation & Warehousing (100.0%), whereas the industries that tend to have a higher number of women are Accommodation & Food Services (100.0%), Public Administration (100.0%), and Professional & Scientific (93.3%).
| Industry | Male | Female |
| Agriculture, Fishing & Hunting | 192 (75.0%) | 64 (25.0%) |
| Mining, Quarrying, & Extraction | 0 (0.0%) | 0 (0.0%) |
| Construction | 43 (100.0%) | 0 (0.0%) |
| Manufacturing | 4 (100.0%) | 0 (0.0%) |
| Wholesale Trade | 25 (39.7%) | 38 (60.3%) |
| Retail Trade | 5 (31.2%) | 11 (68.8%) |
| Transportation & Warehousing | 8 (100.0%) | 0 (0.0%) |
| Utilities | 5 (100.0%) | 0 (0.0%) |
| Information | 0 (0.0%) | 0 (0.0%) |
| Finance & Insurance | 0 (0.0%) | 0 (0.0%) |
| Real Estate, Rental & Leasing | 0 (0.0%) | 0 (0.0%) |
| Professional & Scientific | 3 (6.7%) | 42 (93.3%) |
| Enterprise Management | 0 (0.0%) | 0 (0.0%) |
| Administrative & Support | 10 (29.4%) | 24 (70.6%) |
| Educational Services | 6 (9.1%) | 60 (90.9%) |
| Health Care & Social Assistance | 10 (29.4%) | 24 (70.6%) |
| Arts, Entertainment & Recreation | 5 (100.0%) | 0 (0.0%) |
| Accommodation & Food Services | 0 (0.0%) | 25 (100.0%) |
| Public Administration | 0 (0.0%) | 10 (100.0%) |
| Total | 316 (51.1%) | 302 (48.9%) |
Education in London
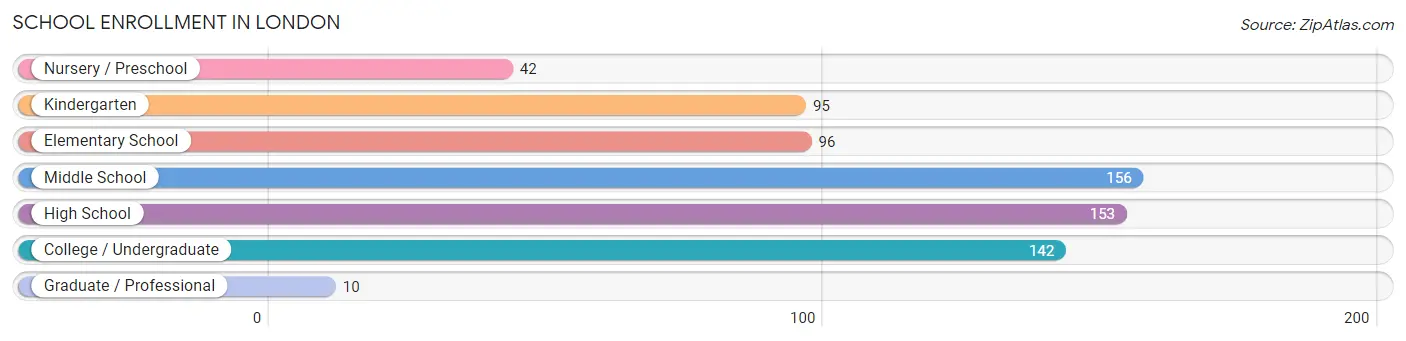
School Enrollment in London
The most common levels of schooling among the 694 students in London are middle school (156 | 22.5%), high school (153 | 22.1%), and college / undergraduate (142 | 20.5%).
| School Level | # Students | % Students |
| Nursery / Preschool | 42 | 6.0% |
| Kindergarten | 95 | 13.7% |
| Elementary School | 96 | 13.8% |
| Middle School | 156 | 22.5% |
| High School | 153 | 22.1% |
| College / Undergraduate | 142 | 20.5% |
| Graduate / Professional | 10 | 1.4% |
| Total | 694 | 100.0% |
School Enrollment by Age by Funding Source in London
Out of a total of 694 students who are enrolled in schools in London, 11 (1.6%) attend a private institution, while the remaining 683 (98.4%) are enrolled in public schools. The age group of 25 to 34 year olds has the highest likelihood of being enrolled in private schools, with 11 (27.5% in the age bracket) enrolled. Conversely, the age group of 3 to 4 year olds has the lowest likelihood of being enrolled in a private school, with 42 (100.0% in the age bracket) attending a public institution.
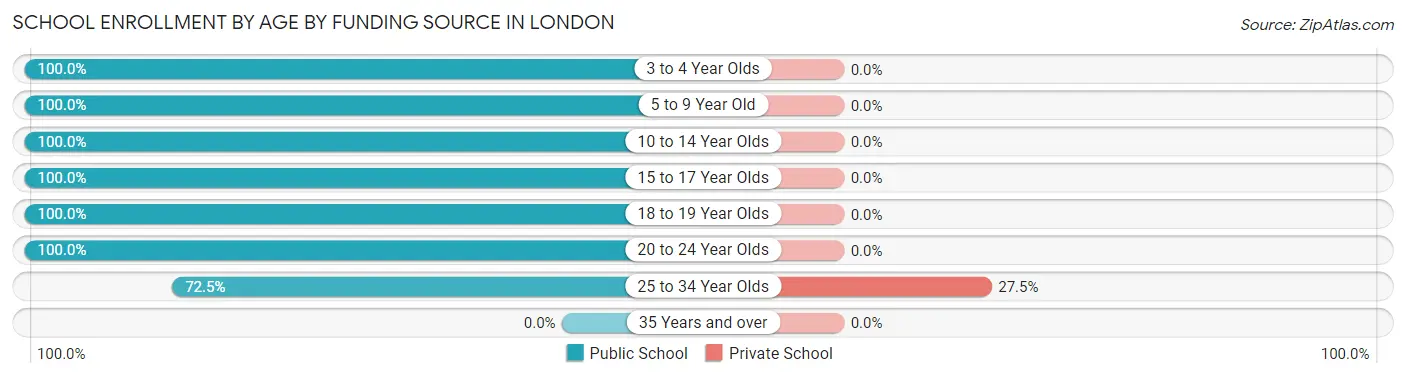
| Age Bracket | Public School | Private School |
| 3 to 4 Year Olds | 42 (100.0%) | 0 (0.0%) |
| 5 to 9 Year Old | 191 (100.0%) | 0 (0.0%) |
| 10 to 14 Year Olds | 180 (100.0%) | 0 (0.0%) |
| 15 to 17 Year Olds | 123 (100.0%) | 0 (0.0%) |
| 18 to 19 Year Olds | 44 (100.0%) | 0 (0.0%) |
| 20 to 24 Year Olds | 74 (100.0%) | 0 (0.0%) |
| 25 to 34 Year Olds | 29 (72.5%) | 11 (27.5%) |
| 35 Years and over | 0 (0.0%) | 0 (0.0%) |
| Total | 683 (98.4%) | 11 (1.6%) |
Educational Attainment by Field of Study in London
Business (20 | 41.7%), social sciences (14 | 29.2%), education (5 | 10.4%), psychology (4 | 8.3%), and bio, nature & agricultural (3 | 6.2%) are the most common fields of study among 48 individuals in London who have obtained a bachelor's degree or higher.
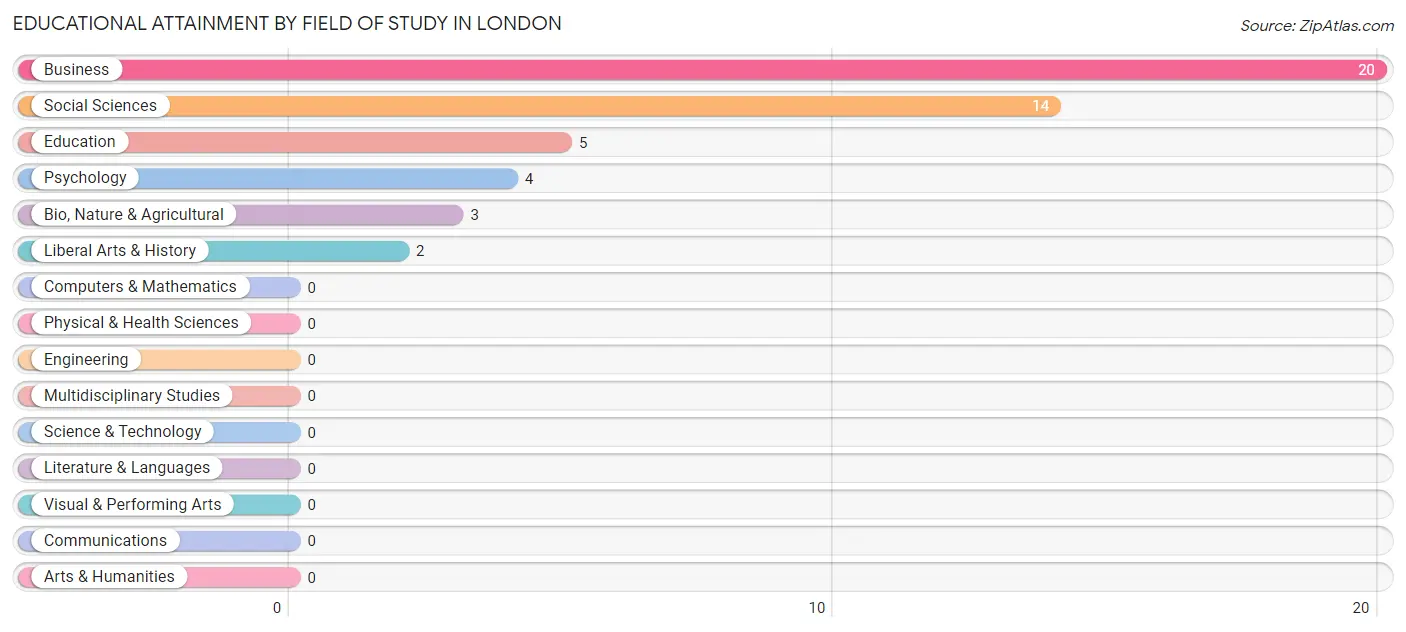
| Field of Study | # Graduates | % Graduates |
| Computers & Mathematics | 0 | 0.0% |
| Bio, Nature & Agricultural | 3 | 6.2% |
| Physical & Health Sciences | 0 | 0.0% |
| Psychology | 4 | 8.3% |
| Social Sciences | 14 | 29.2% |
| Engineering | 0 | 0.0% |
| Multidisciplinary Studies | 0 | 0.0% |
| Science & Technology | 0 | 0.0% |
| Business | 20 | 41.7% |
| Education | 5 | 10.4% |
| Literature & Languages | 0 | 0.0% |
| Liberal Arts & History | 2 | 4.2% |
| Visual & Performing Arts | 0 | 0.0% |
| Communications | 0 | 0.0% |
| Arts & Humanities | 0 | 0.0% |
| Total | 48 | 100.0% |
Transportation & Commute in London
Vehicle Availability by Sex in London
The most prevalent vehicle ownership categories in London are males with 2 vehicles (147, accounting for 47.6%) and females with 2 vehicles (67, making up 50.7%).
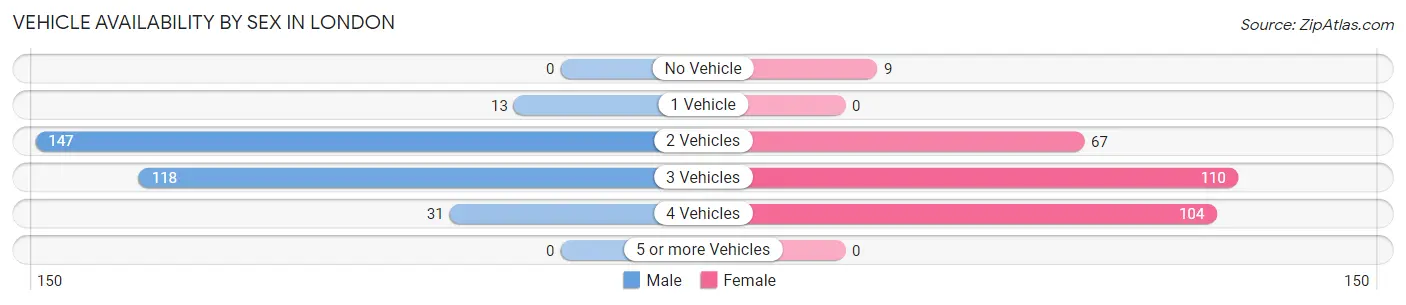
| Vehicles Available | Male | Female |
| No Vehicle | 0 (0.0%) | 9 (3.1%) |
| 1 Vehicle | 13 (4.2%) | 0 (0.0%) |
| 2 Vehicles | 147 (47.6%) | 67 (23.1%) |
| 3 Vehicles | 118 (38.2%) | 110 (37.9%) |
| 4 Vehicles | 31 (10.0%) | 104 (35.9%) |
| 5 or more Vehicles | 0 (0.0%) | 0 (0.0%) |
| Total | 309 (100.0%) | 290 (100.0%) |
Commute Time in London
The most frequently occuring commute durations in London are 25 to 29 minutes (124 commuters, 20.9%), 15 to 19 minutes (96 commuters, 16.2%), and 30 to 34 minutes (88 commuters, 14.8%).
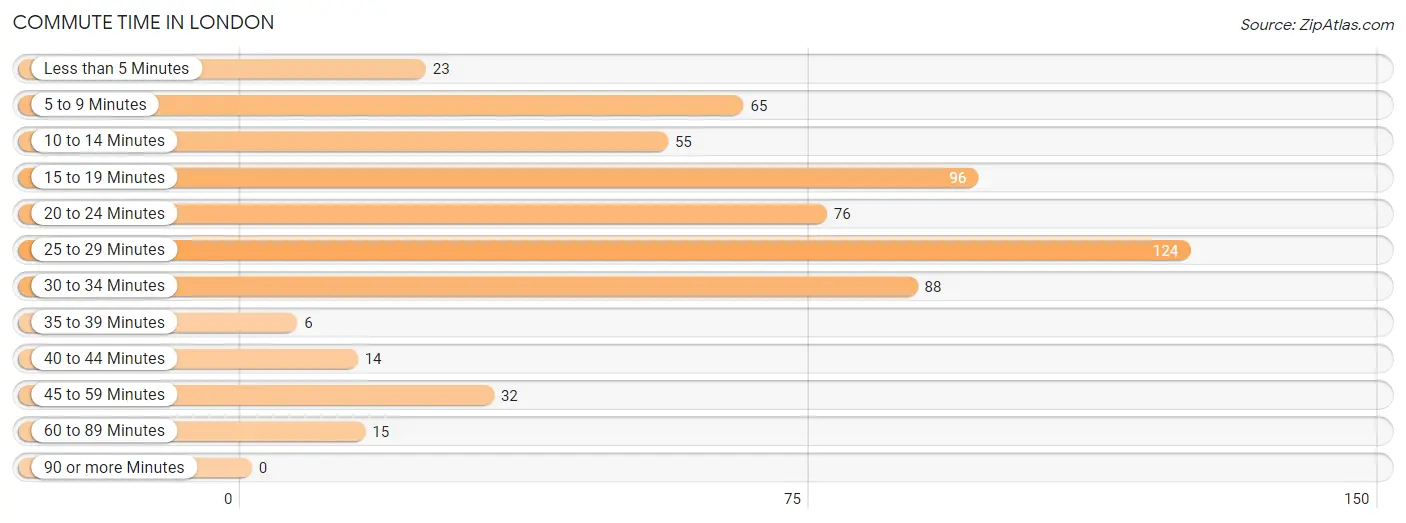
| Commute Time | # Commuters | % Commuters |
| Less than 5 Minutes | 23 | 3.9% |
| 5 to 9 Minutes | 65 | 10.9% |
| 10 to 14 Minutes | 55 | 9.3% |
| 15 to 19 Minutes | 96 | 16.2% |
| 20 to 24 Minutes | 76 | 12.8% |
| 25 to 29 Minutes | 124 | 20.9% |
| 30 to 34 Minutes | 88 | 14.8% |
| 35 to 39 Minutes | 6 | 1.0% |
| 40 to 44 Minutes | 14 | 2.4% |
| 45 to 59 Minutes | 32 | 5.4% |
| 60 to 89 Minutes | 15 | 2.5% |
| 90 or more Minutes | 0 | 0.0% |
Commute Time by Sex in London
The most common commute times in London are 30 to 34 minutes (83 commuters, 27.3%) for males and 25 to 29 minutes (114 commuters, 39.3%) for females.
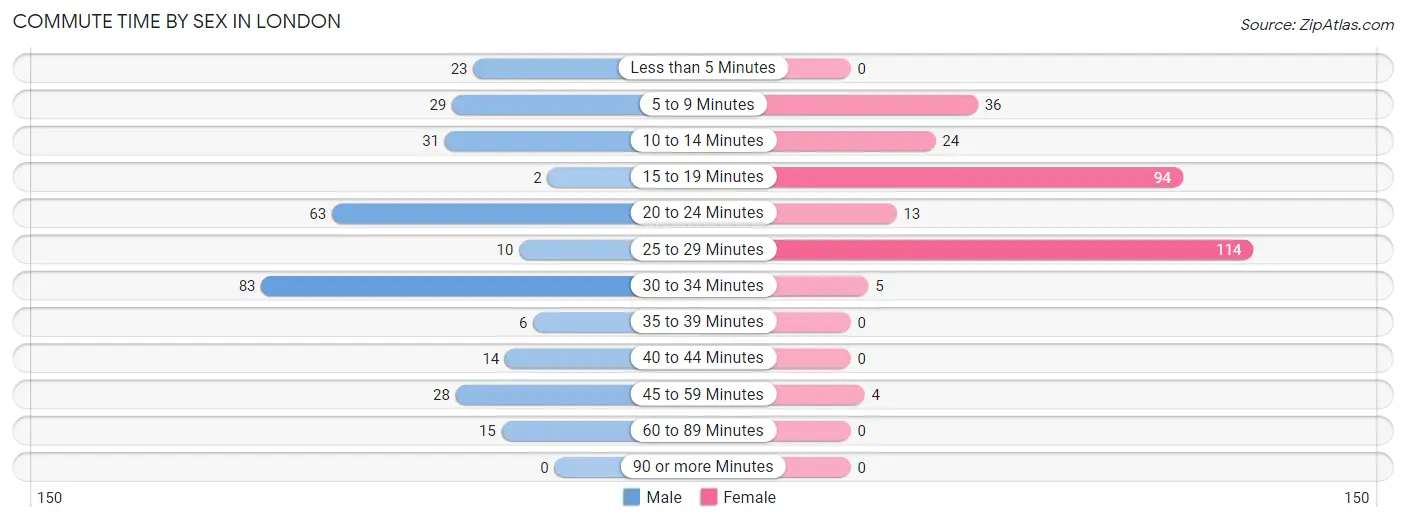
| Commute Time | Male | Female |
| Less than 5 Minutes | 23 (7.6%) | 0 (0.0%) |
| 5 to 9 Minutes | 29 (9.5%) | 36 (12.4%) |
| 10 to 14 Minutes | 31 (10.2%) | 24 (8.3%) |
| 15 to 19 Minutes | 2 (0.7%) | 94 (32.4%) |
| 20 to 24 Minutes | 63 (20.7%) | 13 (4.5%) |
| 25 to 29 Minutes | 10 (3.3%) | 114 (39.3%) |
| 30 to 34 Minutes | 83 (27.3%) | 5 (1.7%) |
| 35 to 39 Minutes | 6 (2.0%) | 0 (0.0%) |
| 40 to 44 Minutes | 14 (4.6%) | 0 (0.0%) |
| 45 to 59 Minutes | 28 (9.2%) | 4 (1.4%) |
| 60 to 89 Minutes | 15 (4.9%) | 0 (0.0%) |
| 90 or more Minutes | 0 (0.0%) | 0 (0.0%) |
Time of Departure to Work by Sex in London
The most frequent times of departure to work in London are 5:30 AM to 5:59 AM (78, 25.7%) for males and 6:30 AM to 6:59 AM (66, 22.8%) for females.
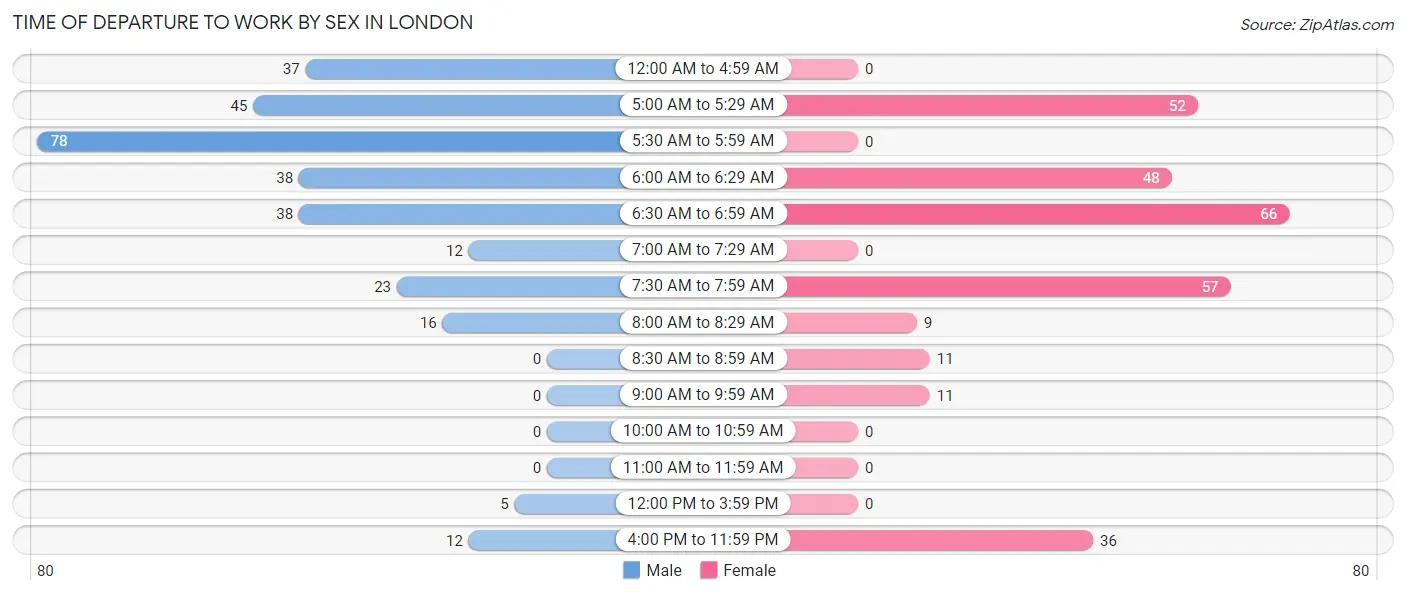
| Time of Departure | Male | Female |
| 12:00 AM to 4:59 AM | 37 (12.2%) | 0 (0.0%) |
| 5:00 AM to 5:29 AM | 45 (14.8%) | 52 (17.9%) |
| 5:30 AM to 5:59 AM | 78 (25.7%) | 0 (0.0%) |
| 6:00 AM to 6:29 AM | 38 (12.5%) | 48 (16.6%) |
| 6:30 AM to 6:59 AM | 38 (12.5%) | 66 (22.8%) |
| 7:00 AM to 7:29 AM | 12 (4.0%) | 0 (0.0%) |
| 7:30 AM to 7:59 AM | 23 (7.6%) | 57 (19.7%) |
| 8:00 AM to 8:29 AM | 16 (5.3%) | 9 (3.1%) |
| 8:30 AM to 8:59 AM | 0 (0.0%) | 11 (3.8%) |
| 9:00 AM to 9:59 AM | 0 (0.0%) | 11 (3.8%) |
| 10:00 AM to 10:59 AM | 0 (0.0%) | 0 (0.0%) |
| 11:00 AM to 11:59 AM | 0 (0.0%) | 0 (0.0%) |
| 12:00 PM to 3:59 PM | 5 (1.6%) | 0 (0.0%) |
| 4:00 PM to 11:59 PM | 12 (4.0%) | 36 (12.4%) |
| Total | 304 (100.0%) | 290 (100.0%) |
Housing Occupancy in London
Occupancy by Ownership in London
Of the total 422 dwellings in London, owner-occupied units account for 150 (35.5%), while renter-occupied units make up 272 (64.4%).
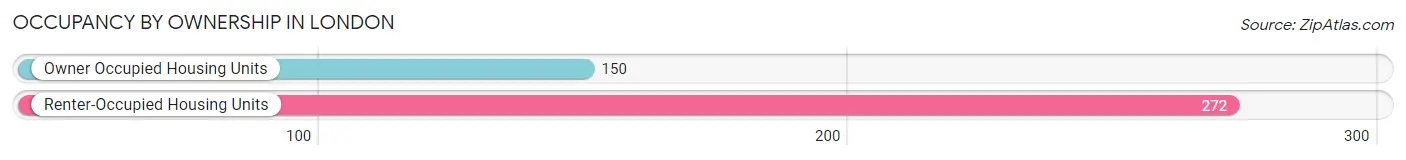
| Occupancy | # Housing Units | % Housing Units |
| Owner Occupied Housing Units | 150 | 35.5% |
| Renter-Occupied Housing Units | 272 | 64.4% |
| Total Occupied Housing Units | 422 | 100.0% |
Occupancy by Household Size in London
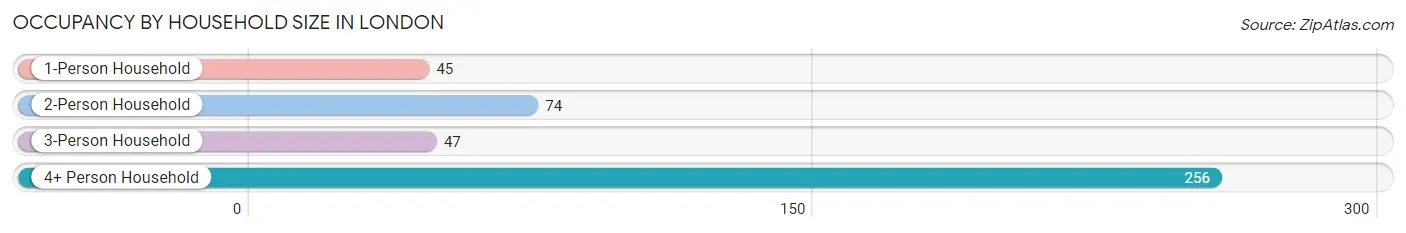
| Household Size | # Housing Units | % Housing Units |
| 1-Person Household | 45 | 10.7% |
| 2-Person Household | 74 | 17.5% |
| 3-Person Household | 47 | 11.1% |
| 4+ Person Household | 256 | 60.7% |
| Total Housing Units | 422 | 100.0% |
Occupancy by Ownership by Household Size in London
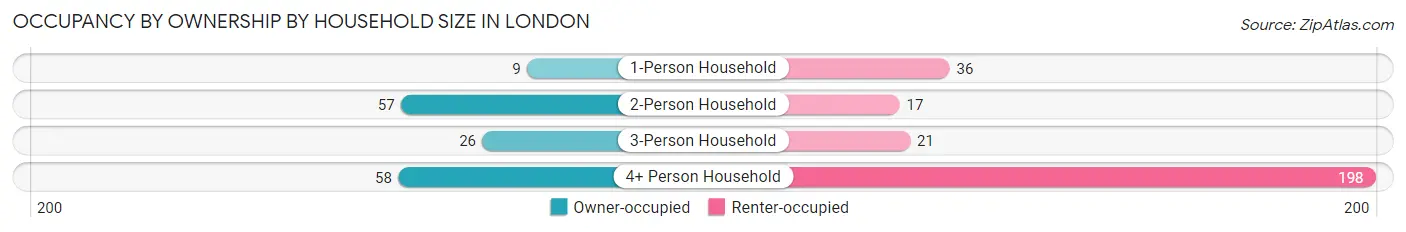
| Household Size | Owner-occupied | Renter-occupied |
| 1-Person Household | 9 (20.0%) | 36 (80.0%) |
| 2-Person Household | 57 (77.0%) | 17 (23.0%) |
| 3-Person Household | 26 (55.3%) | 21 (44.7%) |
| 4+ Person Household | 58 (22.7%) | 198 (77.3%) |
| Total Housing Units | 150 (35.5%) | 272 (64.4%) |
Occupancy by Educational Attainment in London
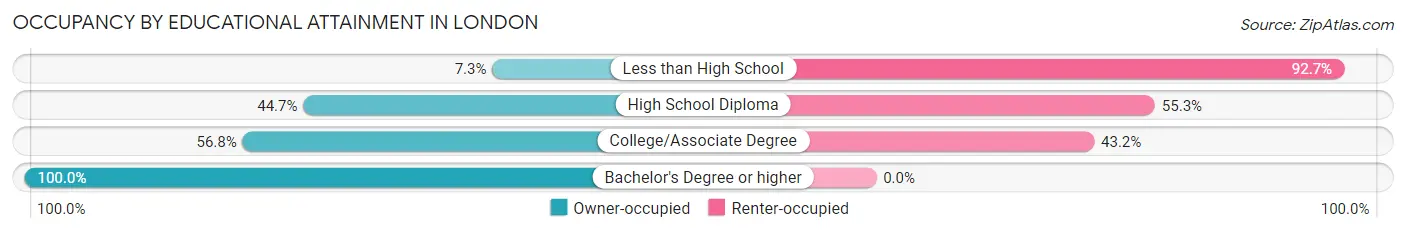
| Household Size | Owner-occupied | Renter-occupied |
| Less than High School | 12 (7.3%) | 153 (92.7%) |
| High School Diploma | 68 (44.7%) | 84 (55.3%) |
| College/Associate Degree | 46 (56.8%) | 35 (43.2%) |
| Bachelor's Degree or higher | 24 (100.0%) | 0 (0.0%) |
Occupancy by Age of Householder in London
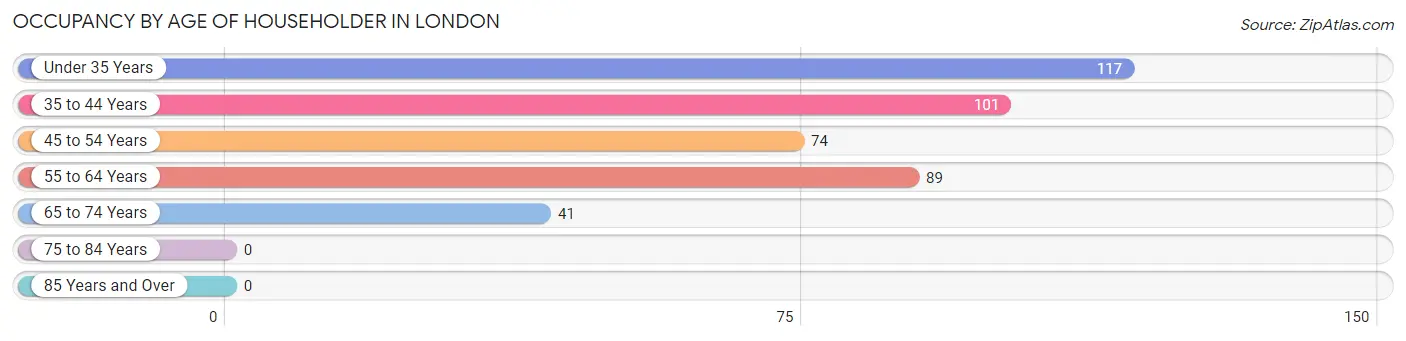
| Age Bracket | # Households | % Households |
| Under 35 Years | 117 | 27.7% |
| 35 to 44 Years | 101 | 23.9% |
| 45 to 54 Years | 74 | 17.5% |
| 55 to 64 Years | 89 | 21.1% |
| 65 to 74 Years | 41 | 9.7% |
| 75 to 84 Years | 0 | 0.0% |
| 85 Years and Over | 0 | 0.0% |
| Total | 422 | 100.0% |
Housing Finances in London
Median Income by Occupancy in London
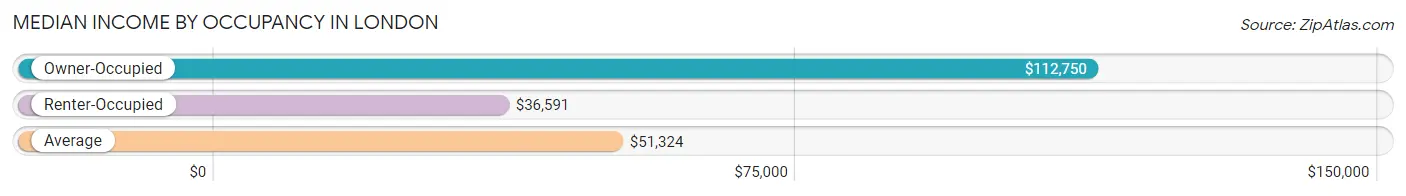
| Occupancy Type | # Households | Median Income |
| Owner-Occupied | 150 (35.5%) | $112,750 |
| Renter-Occupied | 272 (64.4%) | $36,591 |
| Average | 422 (100.0%) | $51,324 |
Occupancy by Householder Income Bracket in London
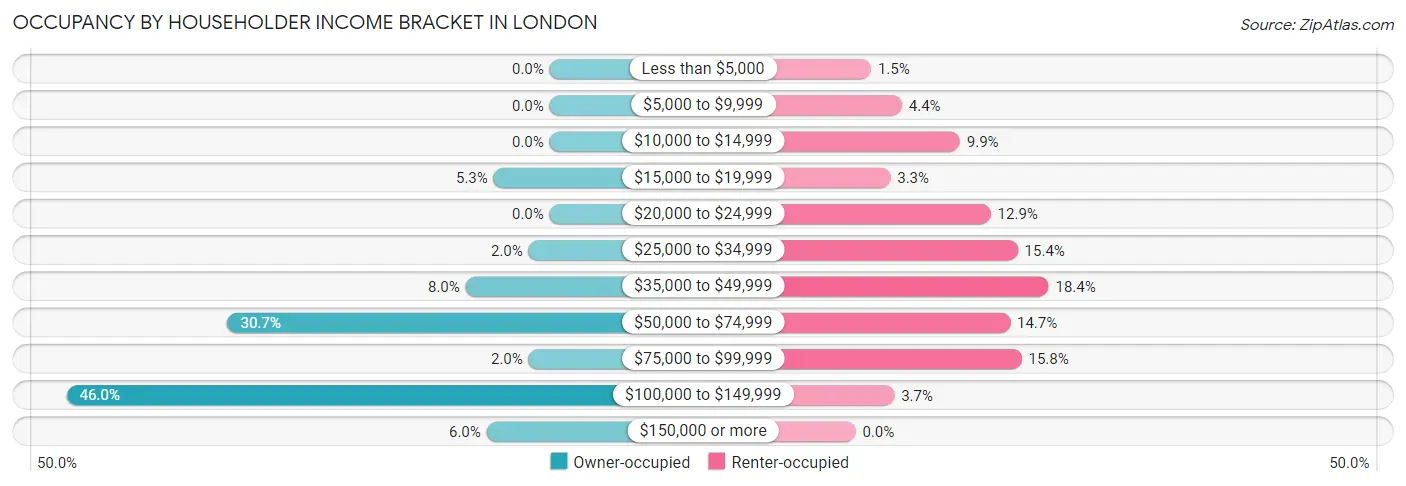
| Income Bracket | Owner-occupied | Renter-occupied |
| Less than $5,000 | 0 (0.0%) | 4 (1.5%) |
| $5,000 to $9,999 | 0 (0.0%) | 12 (4.4%) |
| $10,000 to $14,999 | 0 (0.0%) | 27 (9.9%) |
| $15,000 to $19,999 | 8 (5.3%) | 9 (3.3%) |
| $20,000 to $24,999 | 0 (0.0%) | 35 (12.9%) |
| $25,000 to $34,999 | 3 (2.0%) | 42 (15.4%) |
| $35,000 to $49,999 | 12 (8.0%) | 50 (18.4%) |
| $50,000 to $74,999 | 46 (30.7%) | 40 (14.7%) |
| $75,000 to $99,999 | 3 (2.0%) | 43 (15.8%) |
| $100,000 to $149,999 | 69 (46.0%) | 10 (3.7%) |
| $150,000 or more | 9 (6.0%) | 0 (0.0%) |
| Total | 150 (100.0%) | 272 (100.0%) |
Monthly Housing Cost Tiers in London
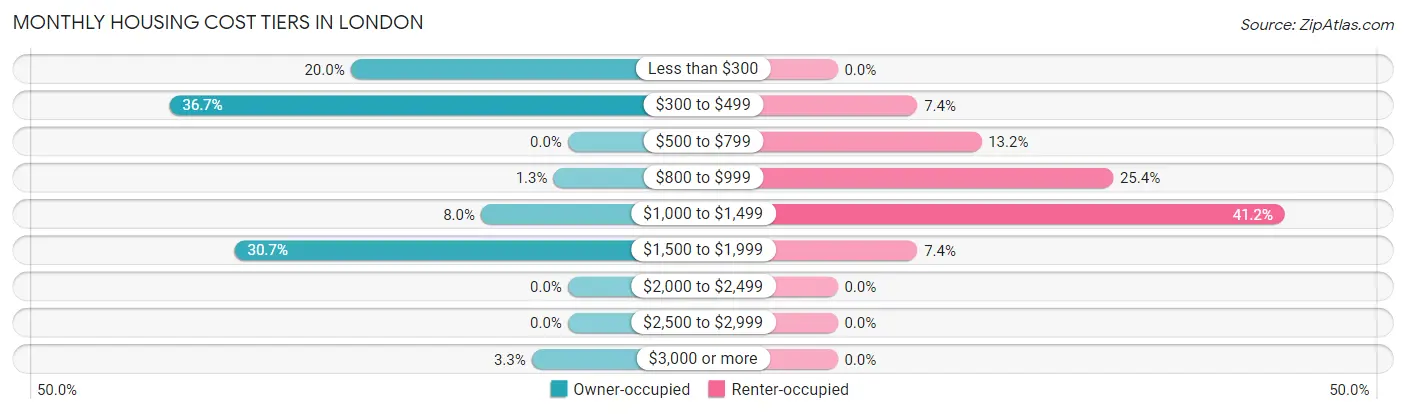
| Monthly Cost | Owner-occupied | Renter-occupied |
| Less than $300 | 30 (20.0%) | 0 (0.0%) |
| $300 to $499 | 55 (36.7%) | 20 (7.3%) |
| $500 to $799 | 0 (0.0%) | 36 (13.2%) |
| $800 to $999 | 2 (1.3%) | 69 (25.4%) |
| $1,000 to $1,499 | 12 (8.0%) | 112 (41.2%) |
| $1,500 to $1,999 | 46 (30.7%) | 20 (7.3%) |
| $2,000 to $2,499 | 0 (0.0%) | 0 (0.0%) |
| $2,500 to $2,999 | 0 (0.0%) | 0 (0.0%) |
| $3,000 or more | 5 (3.3%) | 0 (0.0%) |
| Total | 150 (100.0%) | 272 (100.0%) |
Physical Housing Characteristics in London
Housing Structures in London
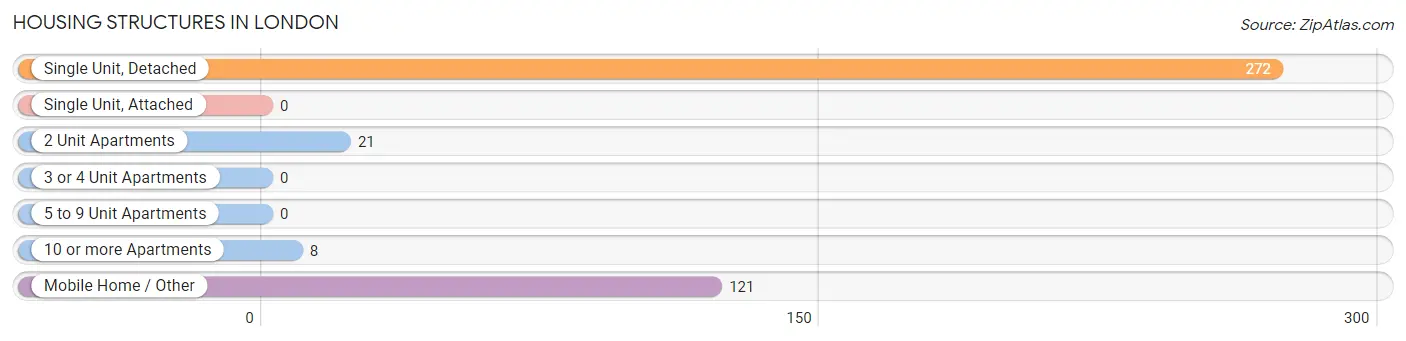
| Structure Type | # Housing Units | % Housing Units |
| Single Unit, Detached | 272 | 64.4% |
| Single Unit, Attached | 0 | 0.0% |
| 2 Unit Apartments | 21 | 5.0% |
| 3 or 4 Unit Apartments | 0 | 0.0% |
| 5 to 9 Unit Apartments | 0 | 0.0% |
| 10 or more Apartments | 8 | 1.9% |
| Mobile Home / Other | 121 | 28.7% |
| Total | 422 | 100.0% |
Housing Structures by Occupancy in London
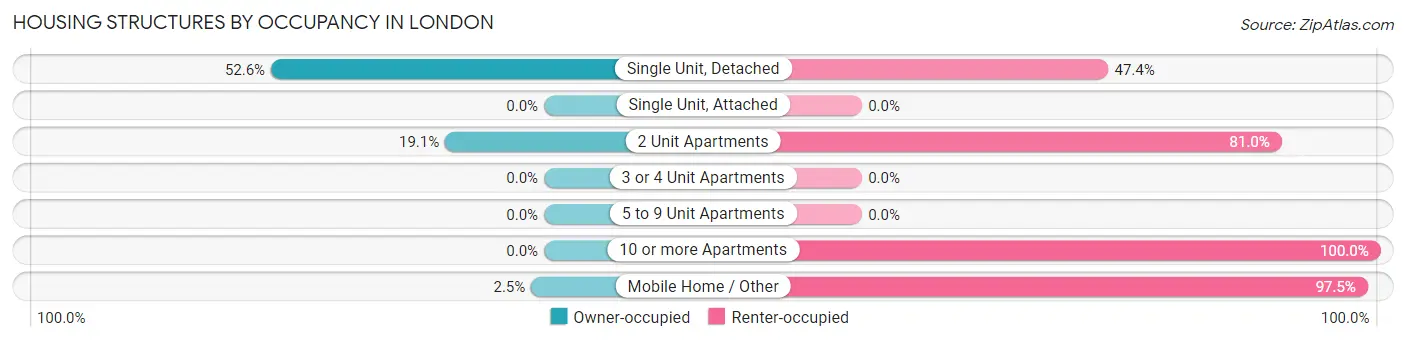
| Structure Type | Owner-occupied | Renter-occupied |
| Single Unit, Detached | 143 (52.6%) | 129 (47.4%) |
| Single Unit, Attached | 0 (0.0%) | 0 (0.0%) |
| 2 Unit Apartments | 4 (19.1%) | 17 (80.9%) |
| 3 or 4 Unit Apartments | 0 (0.0%) | 0 (0.0%) |
| 5 to 9 Unit Apartments | 0 (0.0%) | 0 (0.0%) |
| 10 or more Apartments | 0 (0.0%) | 8 (100.0%) |
| Mobile Home / Other | 3 (2.5%) | 118 (97.5%) |
| Total | 150 (35.5%) | 272 (64.4%) |
Housing Structures by Number of Rooms in London
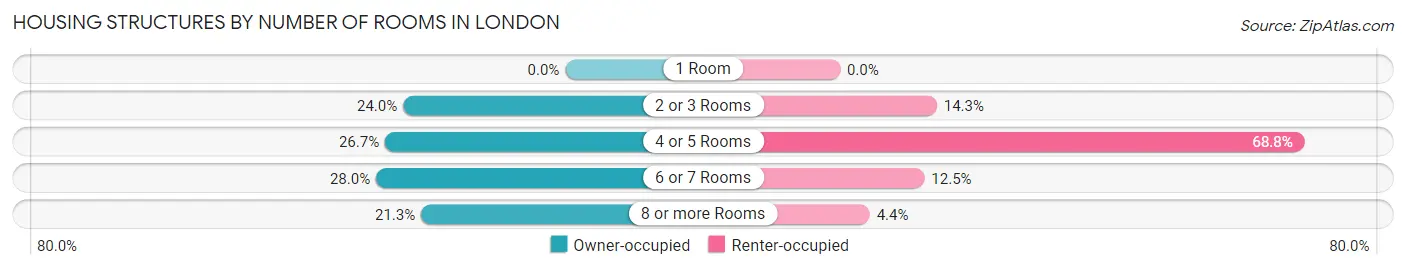
| Number of Rooms | Owner-occupied | Renter-occupied |
| 1 Room | 0 (0.0%) | 0 (0.0%) |
| 2 or 3 Rooms | 36 (24.0%) | 39 (14.3%) |
| 4 or 5 Rooms | 40 (26.7%) | 187 (68.8%) |
| 6 or 7 Rooms | 42 (28.0%) | 34 (12.5%) |
| 8 or more Rooms | 32 (21.3%) | 12 (4.4%) |
| Total | 150 (100.0%) | 272 (100.0%) |
Housing Structure by Heating Type in London
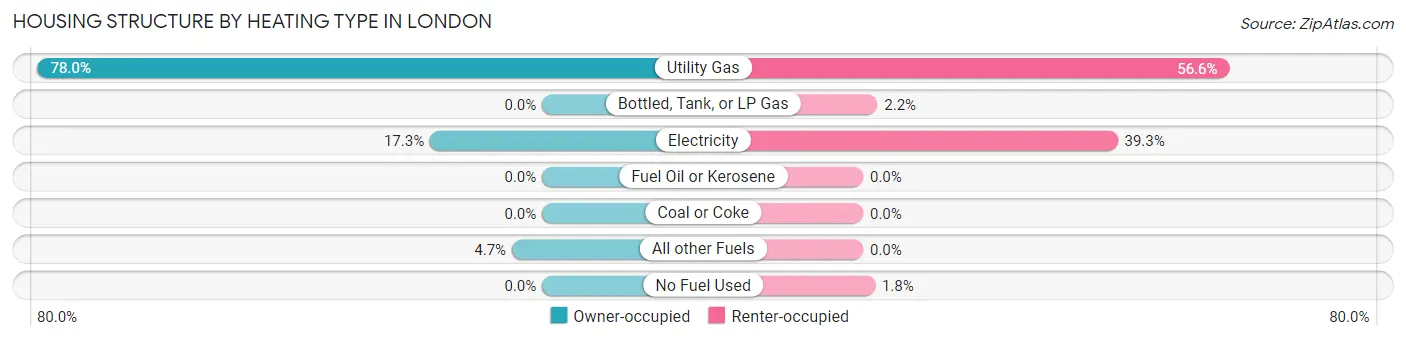
| Heating Type | Owner-occupied | Renter-occupied |
| Utility Gas | 117 (78.0%) | 154 (56.6%) |
| Bottled, Tank, or LP Gas | 0 (0.0%) | 6 (2.2%) |
| Electricity | 26 (17.3%) | 107 (39.3%) |
| Fuel Oil or Kerosene | 0 (0.0%) | 0 (0.0%) |
| Coal or Coke | 0 (0.0%) | 0 (0.0%) |
| All other Fuels | 7 (4.7%) | 0 (0.0%) |
| No Fuel Used | 0 (0.0%) | 5 (1.8%) |
| Total | 150 (100.0%) | 272 (100.0%) |
Household Vehicle Usage in London
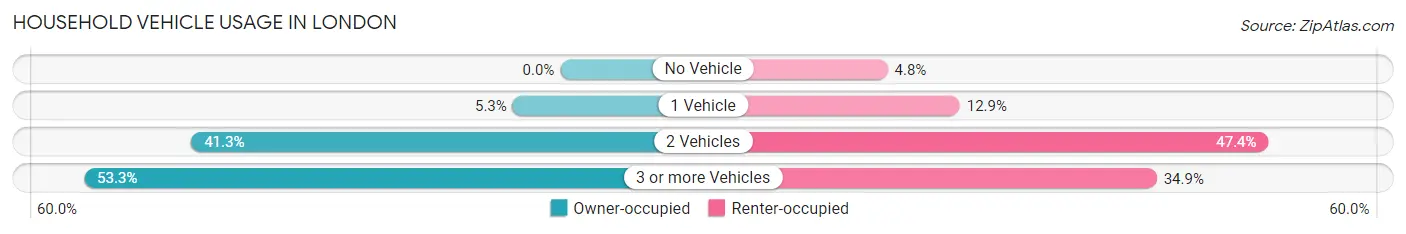
| Vehicles per Household | Owner-occupied | Renter-occupied |
| No Vehicle | 0 (0.0%) | 13 (4.8%) |
| 1 Vehicle | 8 (5.3%) | 35 (12.9%) |
| 2 Vehicles | 62 (41.3%) | 129 (47.4%) |
| 3 or more Vehicles | 80 (53.3%) | 95 (34.9%) |
| Total | 150 (100.0%) | 272 (100.0%) |
Real Estate & Mortgages in London
Real Estate and Mortgage Overview in London
| Characteristic | Without Mortgage | With Mortgage |
| Housing Units | 81 | 69 |
| Median Property Value | - | - |
| Median Household Income | $112,625 | $9 |
| Monthly Housing Costs | $410 | $5 |
| Real Estate Taxes | $458 | $0 |
Property Value by Mortgage Status in London
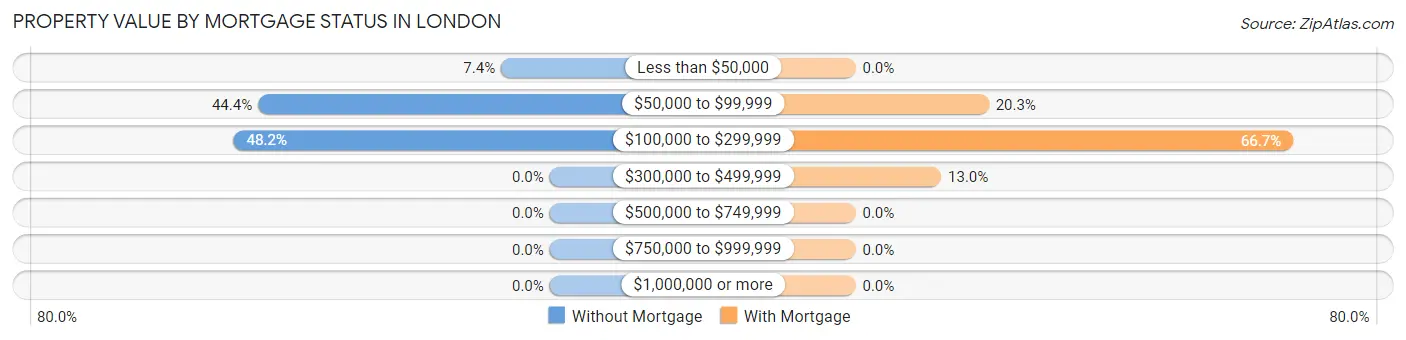
| Property Value | Without Mortgage | With Mortgage |
| Less than $50,000 | 6 (7.4%) | 0 (0.0%) |
| $50,000 to $99,999 | 36 (44.4%) | 14 (20.3%) |
| $100,000 to $299,999 | 39 (48.1%) | 46 (66.7%) |
| $300,000 to $499,999 | 0 (0.0%) | 9 (13.0%) |
| $500,000 to $749,999 | 0 (0.0%) | 0 (0.0%) |
| $750,000 to $999,999 | 0 (0.0%) | 0 (0.0%) |
| $1,000,000 or more | 0 (0.0%) | 0 (0.0%) |
| Total | 81 (100.0%) | 69 (100.0%) |
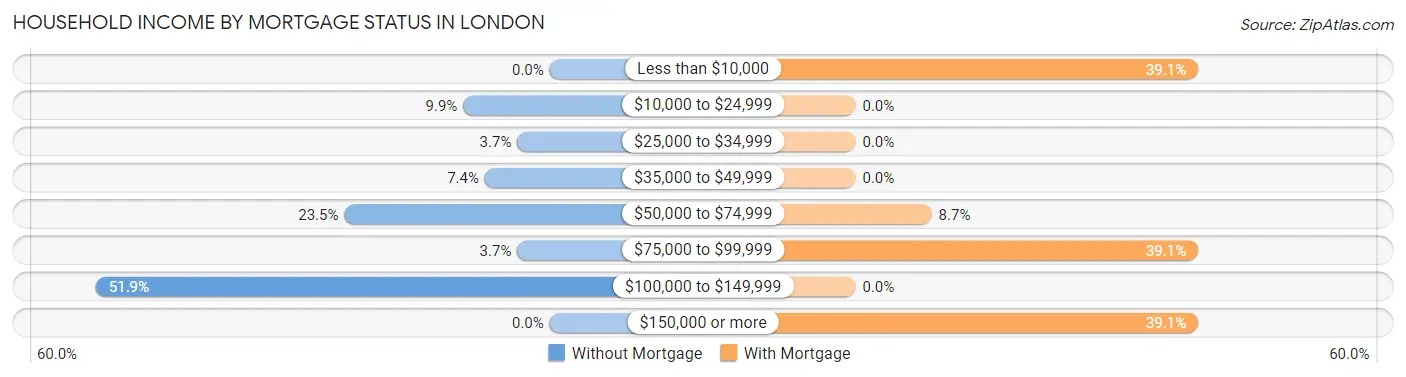
Household Income by Mortgage Status in London
| Household Income | Without Mortgage | With Mortgage |
| Less than $10,000 | 0 (0.0%) | 27 (39.1%) |
| $10,000 to $24,999 | 8 (9.9%) | 0 (0.0%) |
| $25,000 to $34,999 | 3 (3.7%) | 0 (0.0%) |
| $35,000 to $49,999 | 6 (7.4%) | 0 (0.0%) |
| $50,000 to $74,999 | 19 (23.5%) | 6 (8.7%) |
| $75,000 to $99,999 | 3 (3.7%) | 27 (39.1%) |
| $100,000 to $149,999 | 42 (51.8%) | 0 (0.0%) |
| $150,000 or more | 0 (0.0%) | 27 (39.1%) |
| Total | 81 (100.0%) | 69 (100.0%) |
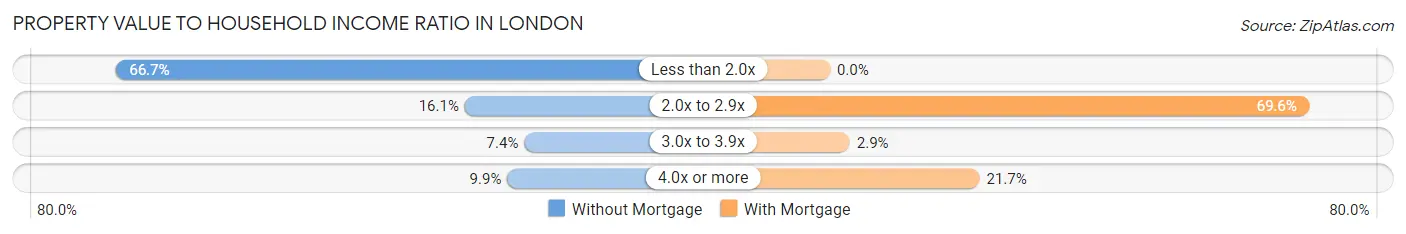
Property Value to Household Income Ratio in London
| Value-to-Income Ratio | Without Mortgage | With Mortgage |
| Less than 2.0x | 54 (66.7%) | 0 (0.0%) |
| 2.0x to 2.9x | 13 (16.1%) | 48 (69.6%) |
| 3.0x to 3.9x | 6 (7.4%) | 2 (2.9%) |
| 4.0x or more | 8 (9.9%) | 15 (21.7%) |
| Total | 81 (100.0%) | 69 (100.0%) |
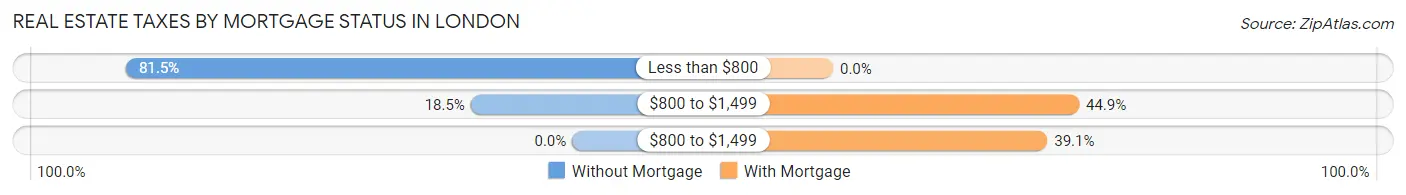
Real Estate Taxes by Mortgage Status in London
| Property Taxes | Without Mortgage | With Mortgage |
| Less than $800 | 66 (81.5%) | 0 (0.0%) |
| $800 to $1,499 | 15 (18.5%) | 31 (44.9%) |
| $800 to $1,499 | 0 (0.0%) | 27 (39.1%) |
| Total | 81 (100.0%) | 69 (100.0%) |
Health & Disability in London
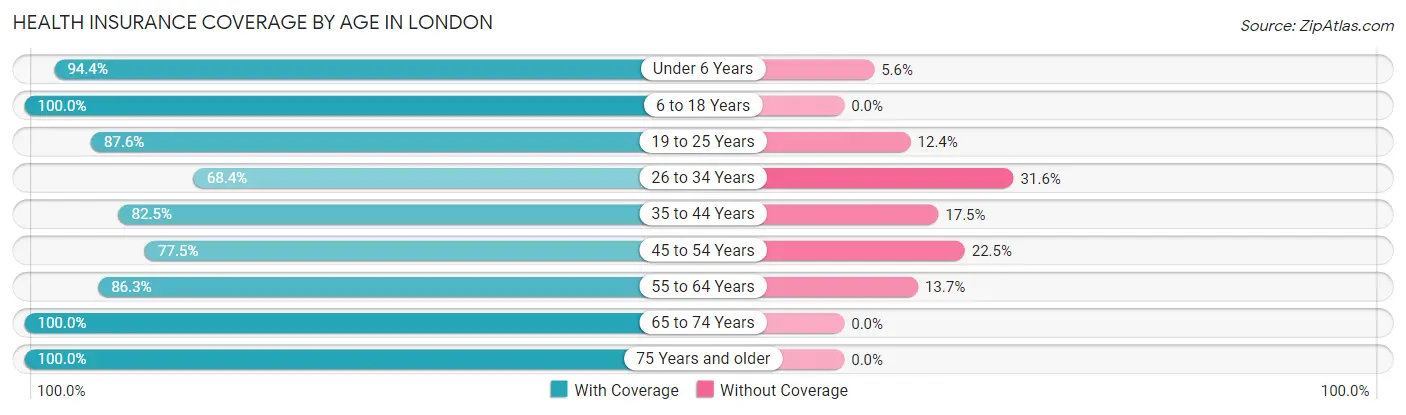
Health Insurance Coverage by Age in London
| Age Bracket | With Coverage | Without Coverage |
| Under 6 Years | 186 (94.4%) | 11 (5.6%) |
| 6 to 18 Years | 487 (100.0%) | 0 (0.0%) |
| 19 to 25 Years | 163 (87.6%) | 23 (12.4%) |
| 26 to 34 Years | 169 (68.4%) | 78 (31.6%) |
| 35 to 44 Years | 235 (82.5%) | 50 (17.5%) |
| 45 to 54 Years | 138 (77.5%) | 40 (22.5%) |
| 55 to 64 Years | 113 (86.3%) | 18 (13.7%) |
| 65 to 74 Years | 48 (100.0%) | 0 (0.0%) |
| 75 Years and older | 26 (100.0%) | 0 (0.0%) |
| Total | 1,565 (87.7%) | 220 (12.3%) |
Health Insurance Coverage by Citizenship Status in London
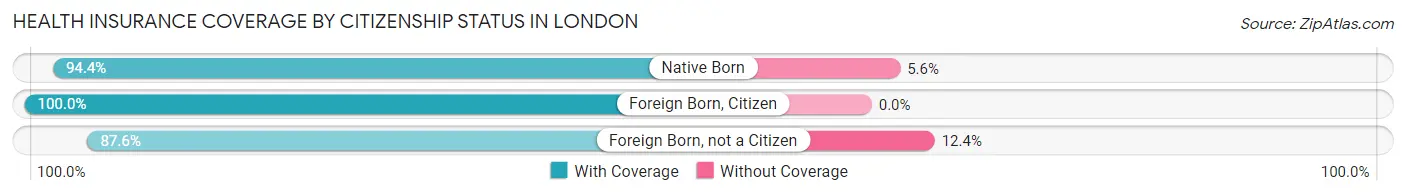
| Citizenship Status | With Coverage | Without Coverage |
| Native Born | 186 (94.4%) | 11 (5.6%) |
| Foreign Born, Citizen | 487 (100.0%) | 0 (0.0%) |
| Foreign Born, not a Citizen | 163 (87.6%) | 23 (12.4%) |
Health Insurance Coverage by Household Income in London
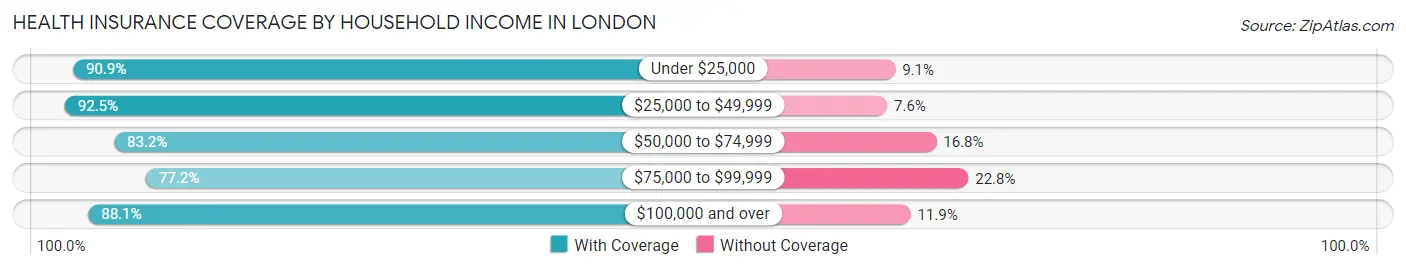
| Household Income | With Coverage | Without Coverage |
| Under $25,000 | 341 (90.9%) | 34 (9.1%) |
| $25,000 to $49,999 | 453 (92.4%) | 37 (7.5%) |
| $50,000 to $74,999 | 298 (83.2%) | 60 (16.8%) |
| $75,000 to $99,999 | 156 (77.2%) | 46 (22.8%) |
| $100,000 and over | 317 (88.1%) | 43 (11.9%) |
Public vs Private Health Insurance Coverage by Age in London
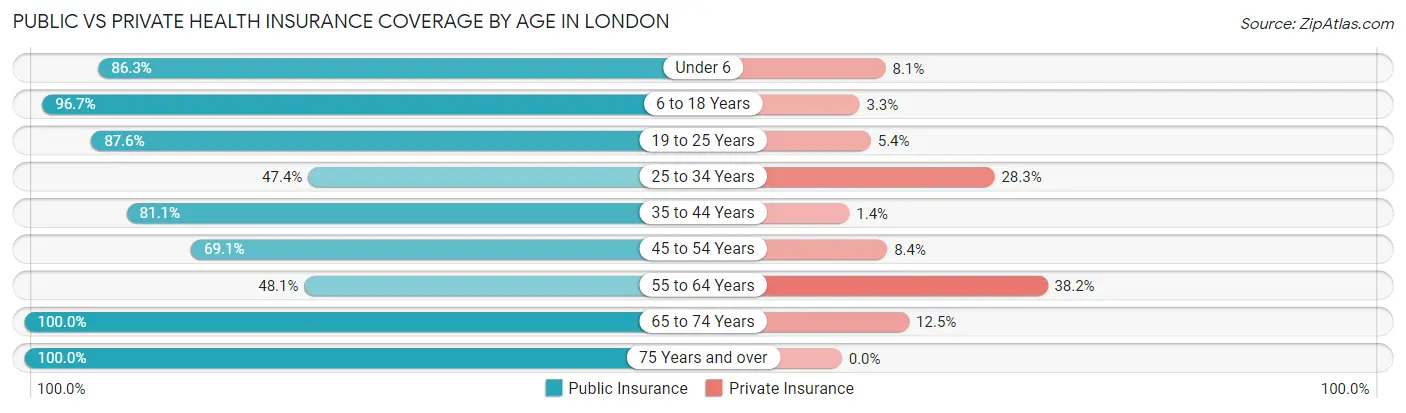
| Age Bracket | Public Insurance | Private Insurance |
| Under 6 | 170 (86.3%) | 16 (8.1%) |
| 6 to 18 Years | 471 (96.7%) | 16 (3.3%) |
| 19 to 25 Years | 163 (87.6%) | 10 (5.4%) |
| 25 to 34 Years | 117 (47.4%) | 70 (28.3%) |
| 35 to 44 Years | 231 (81.0%) | 4 (1.4%) |
| 45 to 54 Years | 123 (69.1%) | 15 (8.4%) |
| 55 to 64 Years | 63 (48.1%) | 50 (38.2%) |
| 65 to 74 Years | 48 (100.0%) | 6 (12.5%) |
| 75 Years and over | 26 (100.0%) | 0 (0.0%) |
| Total | 1,412 (79.1%) | 187 (10.5%) |
Disability Status by Sex by Age in London
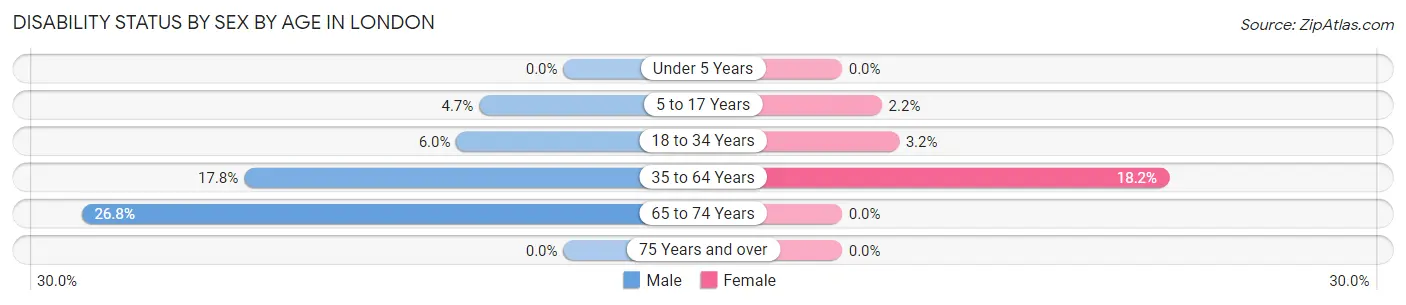
| Age Bracket | Male | Female |
| Under 5 Years | 0 (0.0%) | 0 (0.0%) |
| 5 to 17 Years | 15 (4.7%) | 5 (2.2%) |
| 18 to 34 Years | 13 (6.0%) | 7 (3.2%) |
| 35 to 64 Years | 48 (17.8%) | 59 (18.2%) |
| 65 to 74 Years | 11 (26.8%) | 0 (0.0%) |
| 75 Years and over | 0 (0.0%) | 0 (0.0%) |
Disability Class by Sex by Age in London
Disability Class: Hearing Difficulty
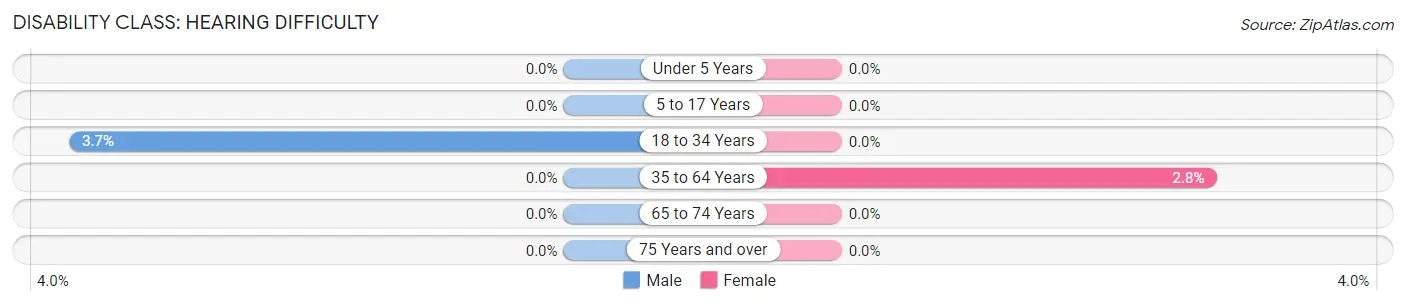
| Age Bracket | Male | Female |
| Under 5 Years | 0 (0.0%) | 0 (0.0%) |
| 5 to 17 Years | 0 (0.0%) | 0 (0.0%) |
| 18 to 34 Years | 8 (3.7%) | 0 (0.0%) |
| 35 to 64 Years | 0 (0.0%) | 9 (2.8%) |
| 65 to 74 Years | 0 (0.0%) | 0 (0.0%) |
| 75 Years and over | 0 (0.0%) | 0 (0.0%) |
Disability Class: Vision Difficulty
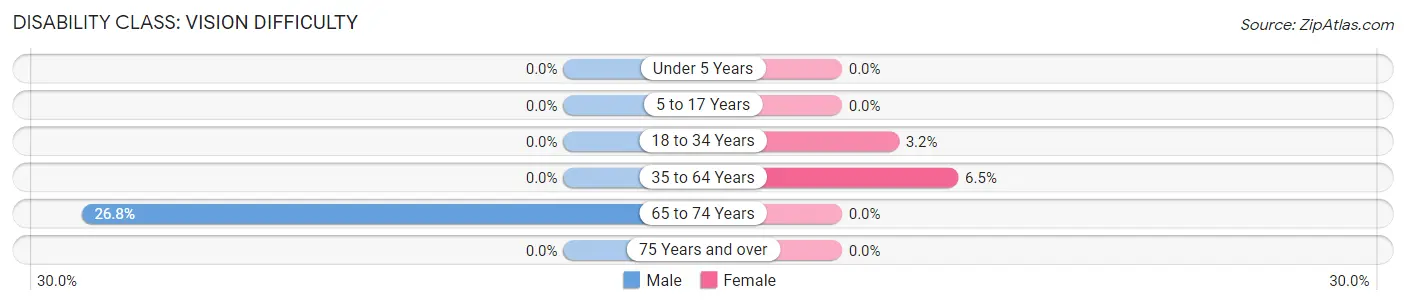
| Age Bracket | Male | Female |
| Under 5 Years | 0 (0.0%) | 0 (0.0%) |
| 5 to 17 Years | 0 (0.0%) | 0 (0.0%) |
| 18 to 34 Years | 0 (0.0%) | 7 (3.2%) |
| 35 to 64 Years | 0 (0.0%) | 21 (6.5%) |
| 65 to 74 Years | 11 (26.8%) | 0 (0.0%) |
| 75 Years and over | 0 (0.0%) | 0 (0.0%) |
Disability Class: Cognitive Difficulty
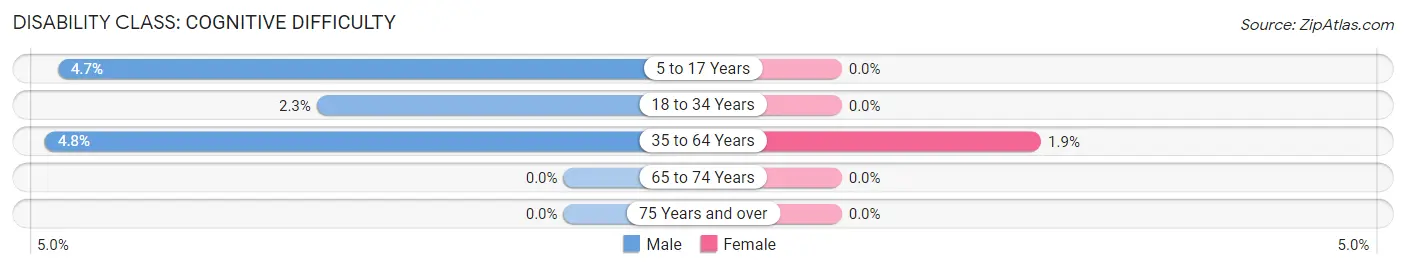
| Age Bracket | Male | Female |
| 5 to 17 Years | 15 (4.7%) | 0 (0.0%) |
| 18 to 34 Years | 5 (2.3%) | 0 (0.0%) |
| 35 to 64 Years | 13 (4.8%) | 6 (1.8%) |
| 65 to 74 Years | 0 (0.0%) | 0 (0.0%) |
| 75 Years and over | 0 (0.0%) | 0 (0.0%) |
Disability Class: Ambulatory Difficulty
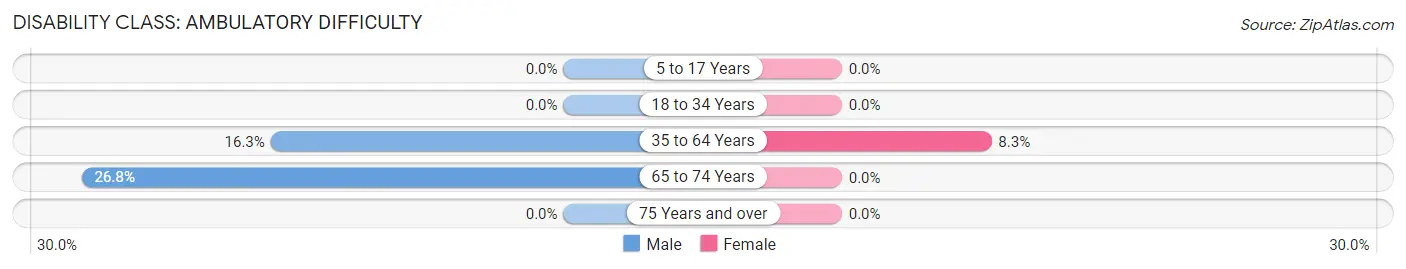
| Age Bracket | Male | Female |
| 5 to 17 Years | 0 (0.0%) | 0 (0.0%) |
| 18 to 34 Years | 0 (0.0%) | 0 (0.0%) |
| 35 to 64 Years | 44 (16.3%) | 27 (8.3%) |
| 65 to 74 Years | 11 (26.8%) | 0 (0.0%) |
| 75 Years and over | 0 (0.0%) | 0 (0.0%) |
Disability Class: Self-Care Difficulty
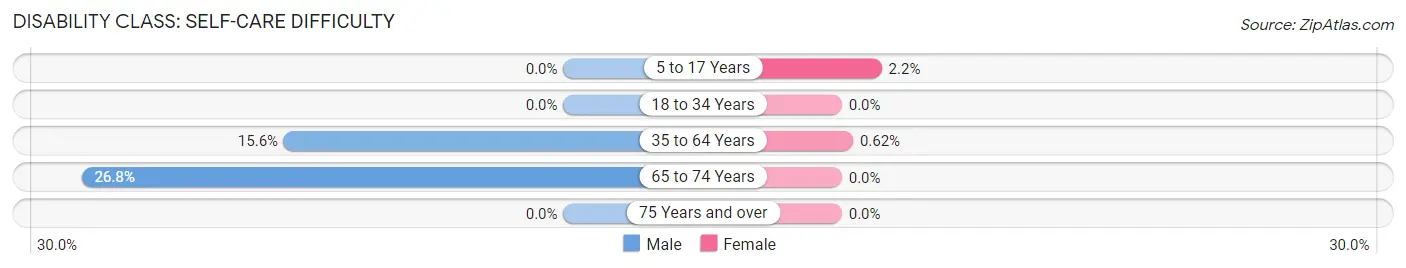
| Age Bracket | Male | Female |
| 5 to 17 Years | 0 (0.0%) | 5 (2.2%) |
| 18 to 34 Years | 0 (0.0%) | 0 (0.0%) |
| 35 to 64 Years | 42 (15.6%) | 2 (0.6%) |
| 65 to 74 Years | 11 (26.8%) | 0 (0.0%) |
| 75 Years and over | 0 (0.0%) | 0 (0.0%) |
Technology Access in London
Computing Device Access in London
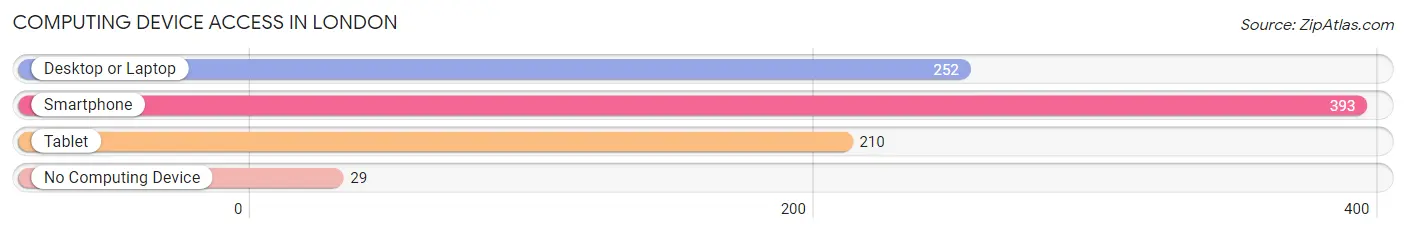
| Device Type | # Households | % Households |
| Desktop or Laptop | 252 | 59.7% |
| Smartphone | 393 | 93.1% |
| Tablet | 210 | 49.8% |
| No Computing Device | 29 | 6.9% |
| Total | 422 | 100.0% |
Internet Access in London
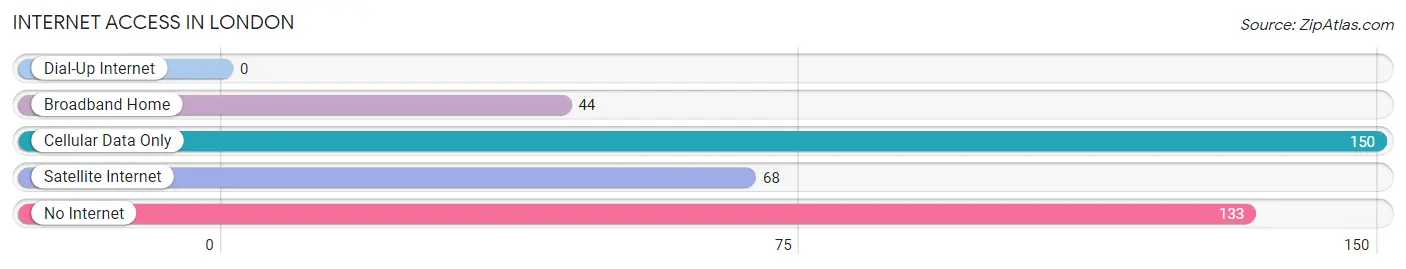
| Internet Type | # Households | % Households |
| Dial-Up Internet | 0 | 0.0% |
| Broadband Home | 44 | 10.4% |
| Cellular Data Only | 150 | 35.5% |
| Satellite Internet | 68 | 16.1% |
| No Internet | 133 | 31.5% |
| Total | 422 | 100.0% |
London Summary
London, Ontario is a city located in Southwestern Ontario, Canada. It is the 11th largest city in Canada and the largest city in Southwestern Ontario. London is situated along the Thames River, approximately halfway between Toronto and Detroit. The city has a population of 383,822 as of the 2016 Canadian census, making it the 11th largest city in Canada and the largest city in Southwestern Ontario.
History
The area around London has been inhabited for thousands of years by various Indigenous peoples. The first European settlers arrived in the area in the late 1700s, and the city was officially founded in 1826. The city was named after the British capital of London, England.
In the mid-1800s, London became an important railway hub, connecting the city to other parts of Canada and the United States. This led to a period of rapid growth and development, and by the early 1900s, London had become an important industrial centre.
In the 1950s and 1960s, London experienced a period of suburbanization, as many people moved from the city centre to the suburbs. This led to a period of decline in the city centre, but in the late 1980s and early 1990s, the city began to experience a period of revitalization.
Geography
London is located in Southwestern Ontario, approximately halfway between Toronto and Detroit. The city is situated along the Thames River, and is surrounded by the municipalities of Middlesex County. The city has an area of 467.25 square kilometres, and is located at an elevation of 243 metres above sea level.
The city is located in a temperate climate zone, and experiences four distinct seasons. The average temperature in the summer is 22°C, and the average temperature in the winter is -3°C.
Economy
London is an important economic centre in Southwestern Ontario. The city is home to a number of large employers, including 3M Canada, Labatt Brewing Company, and the University of Western Ontario. The city is also home to a number of smaller businesses, including manufacturing, technology, and financial services.
The city is also home to a number of cultural and educational institutions, including the London Public Library, the London Regional Children's Museum, and the Museum of Ontario Archaeology.
Demographics
As of the 2016 Canadian census, London had a population of 383,822. The city has a diverse population, with the largest ethnic groups being English (25.2%), Canadian (19.2%), Scottish (14.2%), Irish (13.2%), and German (10.2%).
The city also has a large immigrant population, with the largest immigrant groups being from India (4.2%), China (3.2%), the Philippines (2.2%), and the United Kingdom (2.2%).
The median age in London is 38.7 years, and the median household income is $71,845. The city has a higher than average rate of post-secondary education, with 43.2% of the population having a post-secondary degree or diploma.
Common Questions
What is Per Capita Income in London?
Per Capita income in London is $15,182.
What is the Median Family Income in London?
Median Family Income in London is $51,471.
What is the Median Household income in London?
Median Household Income in London is $51,324.
What is Income or Wage Gap in London?
Income or Wage Gap in London is 5.8%.
Women in London earn 94.2 cents for every dollar earned by a man.
What is Family Income Deficit in London?
Family Income Deficit in London is $11,472.
Families that are below poverty line in London earn $11,472 less on average than the poverty threshold level.
What is Inequality or Gini Index in London?
Inequality or Gini Index in London is 0.40.
What is the Total Population of London?
Total Population of London is 1,785.
What is the Total Male Population of London?
Total Male Population of London is 930.
What is the Total Female Population of London?
Total Female Population of London is 855.
What is the Ratio of Males per 100 Females in London?
There are 108.77 Males per 100 Females in London.
What is the Ratio of Females per 100 Males in London?
There are 91.94 Females per 100 Males in London.
What is the Median Population Age in London?
Median Population Age in London is 26.4 Years.
What is the Average Family Size in London
Average Family Size in London is 4.4 People.
What is the Average Household Size in London
Average Household Size in London is 4.2 People.
How Large is the Labor Force in London?
There are 692 People in the Labor Forcein in London.
What is the Percentage of People in the Labor Force in London?
56.2% of People are in the Labor Force in London.
What is the Unemployment Rate in London?
Unemployment Rate in London is 10.7%.