Rio Oso, CA Map & Demographics
Rio Oso Map
Rio Oso Overview
$47,931
PER CAPITA INCOME
$174,167
AVG FAMILY INCOME
$174,583
AVG HOUSEHOLD INCOME
53.2%
WAGE / INCOME GAP [ % ]
46.8¢/ $1
WAGE / INCOME GAP [ $ ]
0.35
INEQUALITY / GINI INDEX
368
TOTAL POPULATION
186
MALE POPULATION
182
FEMALE POPULATION
102.20
MALES / 100 FEMALES
97.85
FEMALES / 100 MALES
36.4
MEDIAN AGE
3.6
AVG FAMILY SIZE
3.3
AVG HOUSEHOLD SIZE
154
LABOR FORCE [ PEOPLE ]
57.9%
PERCENT IN LABOR FORCE
2.6%
UNEMPLOYMENT RATE
Rio Oso Zip Codes
Rio Oso Area Codes
Income in Rio Oso
Income Overview in Rio Oso
Per Capita Income in Rio Oso is $47,931, while median incomes of families and households are $174,167 and $174,583 respectively.
| Characteristic | Number | Measure |
| Per Capita Income | 368 | $47,931 |
| Median Family Income | 94 | $174,167 |
| Mean Family Income | 94 | $177,451 |
| Median Household Income | 111 | $174,583 |
| Mean Household Income | 111 | $167,448 |
| Income Deficit | 94 | $0 |
| Wage / Income Gap (%) | 368 | 53.17% |
| Wage / Income Gap ($) | 368 | 46.83¢ per $1 |
| Gini / Inequality Index | 368 | 0.35 |
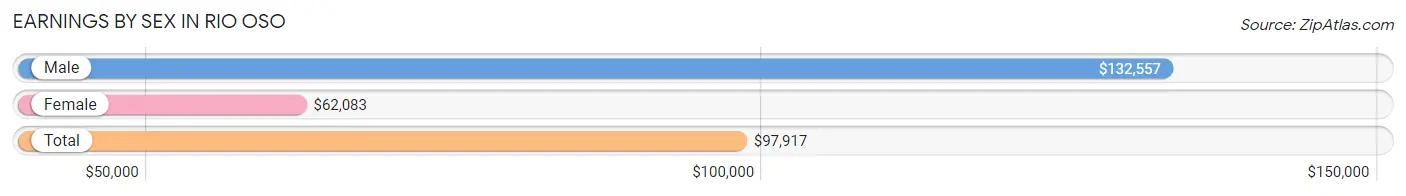
Earnings by Sex in Rio Oso
Average Earnings in Rio Oso are $97,917, $132,557 for men and $62,083 for women, a difference of 53.2%.
| Sex | Number | Average Earnings |
| Male | 99 (60.7%) | $132,557 |
| Female | 64 (39.3%) | $62,083 |
| Total | 163 (100.0%) | $97,917 |
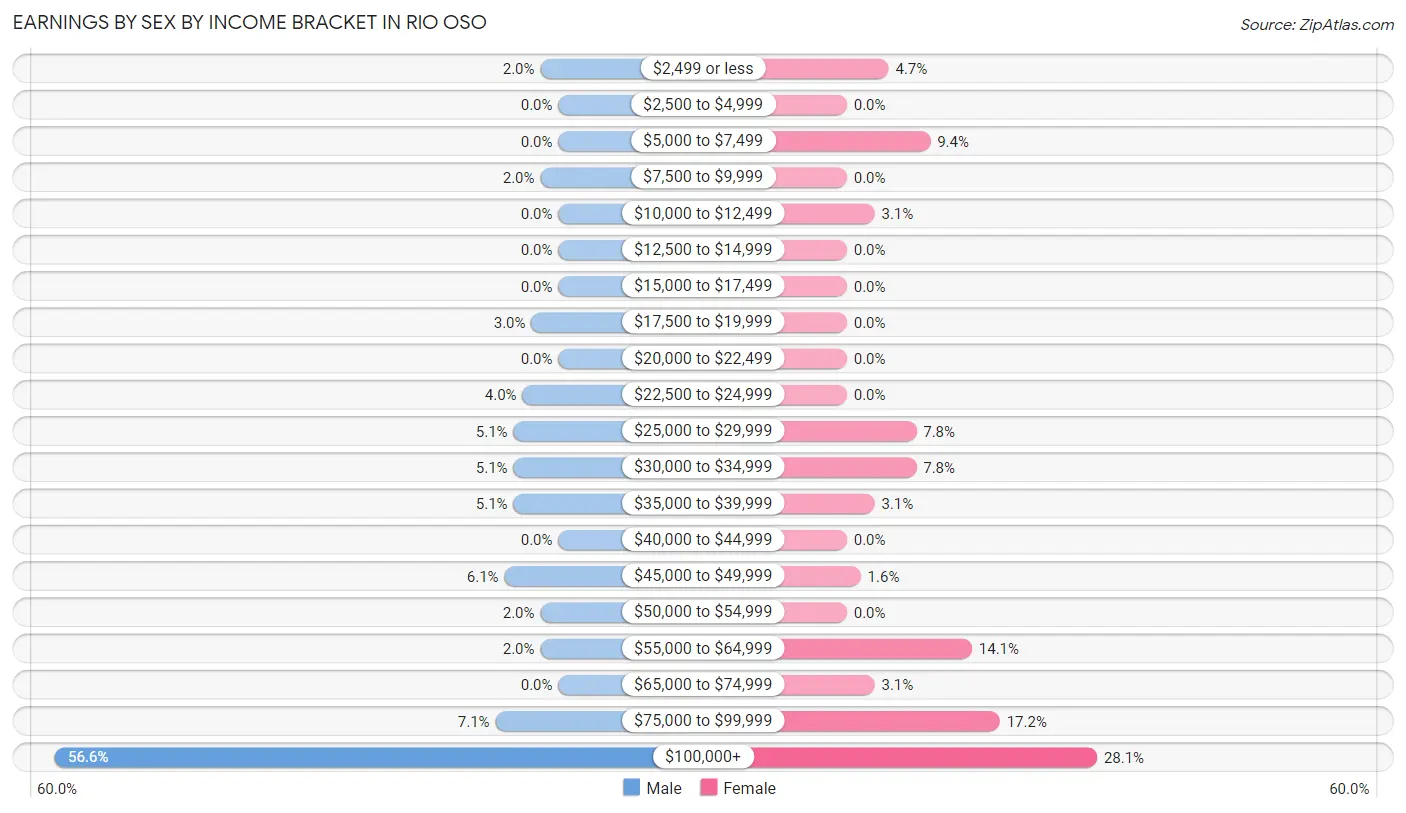
Earnings by Sex by Income Bracket in Rio Oso
The most common earnings brackets in Rio Oso are $100,000+ for men (56 | 56.6%) and $100,000+ for women (18 | 28.1%).
| Income | Male | Female |
| $2,499 or less | 2 (2.0%) | 3 (4.7%) |
| $2,500 to $4,999 | 0 (0.0%) | 0 (0.0%) |
| $5,000 to $7,499 | 0 (0.0%) | 6 (9.4%) |
| $7,500 to $9,999 | 2 (2.0%) | 0 (0.0%) |
| $10,000 to $12,499 | 0 (0.0%) | 2 (3.1%) |
| $12,500 to $14,999 | 0 (0.0%) | 0 (0.0%) |
| $15,000 to $17,499 | 0 (0.0%) | 0 (0.0%) |
| $17,500 to $19,999 | 3 (3.0%) | 0 (0.0%) |
| $20,000 to $22,499 | 0 (0.0%) | 0 (0.0%) |
| $22,500 to $24,999 | 4 (4.0%) | 0 (0.0%) |
| $25,000 to $29,999 | 5 (5.1%) | 5 (7.8%) |
| $30,000 to $34,999 | 5 (5.1%) | 5 (7.8%) |
| $35,000 to $39,999 | 5 (5.1%) | 2 (3.1%) |
| $40,000 to $44,999 | 0 (0.0%) | 0 (0.0%) |
| $45,000 to $49,999 | 6 (6.1%) | 1 (1.6%) |
| $50,000 to $54,999 | 2 (2.0%) | 0 (0.0%) |
| $55,000 to $64,999 | 2 (2.0%) | 9 (14.1%) |
| $65,000 to $74,999 | 0 (0.0%) | 2 (3.1%) |
| $75,000 to $99,999 | 7 (7.1%) | 11 (17.2%) |
| $100,000+ | 56 (56.6%) | 18 (28.1%) |
| Total | 99 (100.0%) | 64 (100.0%) |
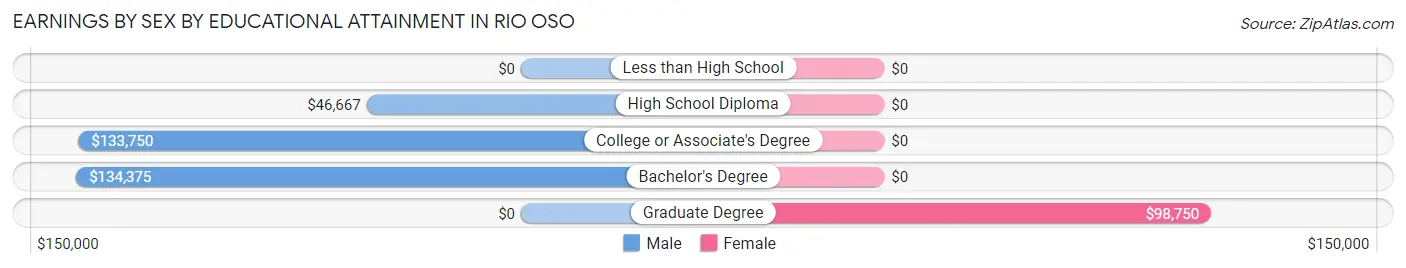
Earnings by Sex by Educational Attainment in Rio Oso
Average earnings in Rio Oso are $132,784 for men and $73,750 for women, a difference of 44.5%. Men with an educational attainment of bachelor's degree enjoy the highest average annual earnings of $134,375, while those with high school diploma education earn the least with $46,667. Women with an educational attainment of graduate degree earn the most with the average annual earnings of $98,750, while those with graduate degree education have the smallest earnings of $98,750.
| Educational Attainment | Male Income | Female Income |
| Less than High School | - | - |
| High School Diploma | $46,667 | $0 |
| College or Associate's Degree | $133,750 | $0 |
| Bachelor's Degree | $134,375 | $0 |
| Graduate Degree | - | - |
| Total | $132,784 | $73,750 |
Family Income in Rio Oso
Family Income Brackets in Rio Oso
According to the Rio Oso family income data, there are 39 families falling into the $200,000+ income range, which is the most common income bracket and makes up 41.5% of all families.
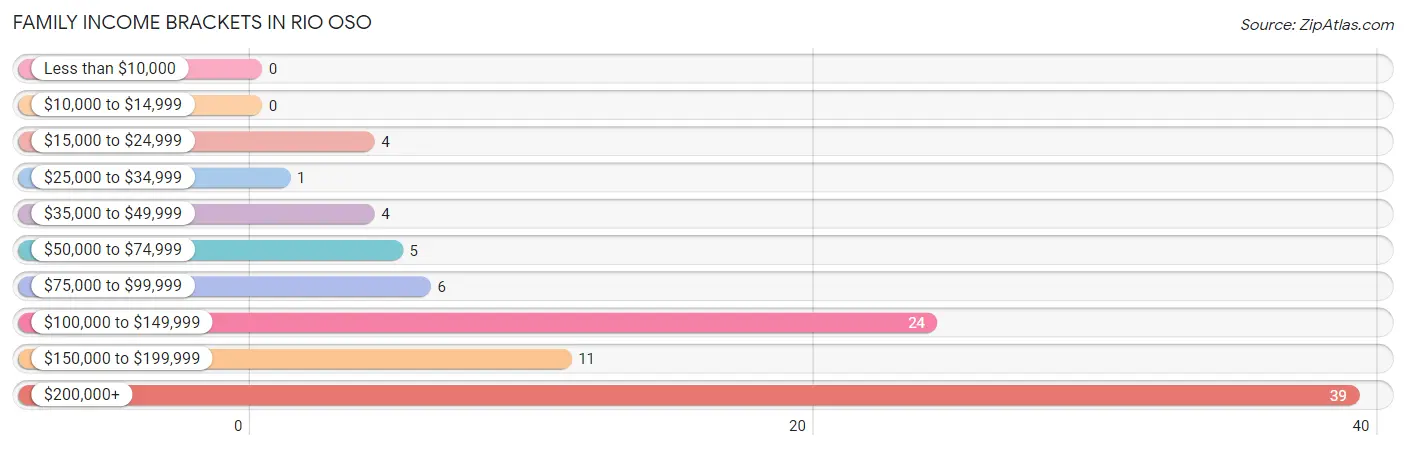
| Income Bracket | # Families | % Families |
| Less than $10,000 | 0 | 0.0% |
| $10,000 to $14,999 | 0 | 0.0% |
| $15,000 to $24,999 | 4 | 4.3% |
| $25,000 to $34,999 | 1 | 1.1% |
| $35,000 to $49,999 | 4 | 4.3% |
| $50,000 to $74,999 | 5 | 5.3% |
| $75,000 to $99,999 | 6 | 6.4% |
| $100,000 to $149,999 | 24 | 25.5% |
| $150,000 to $199,999 | 11 | 11.7% |
| $200,000+ | 39 | 41.5% |
Family Income by Famaliy Size in Rio Oso
4-person families (19 | 20.2%) account for the highest median family income in Rio Oso with $184,107 per family, while 2-person families (26 | 27.7%) have the highest median income of $48,125 per family member.
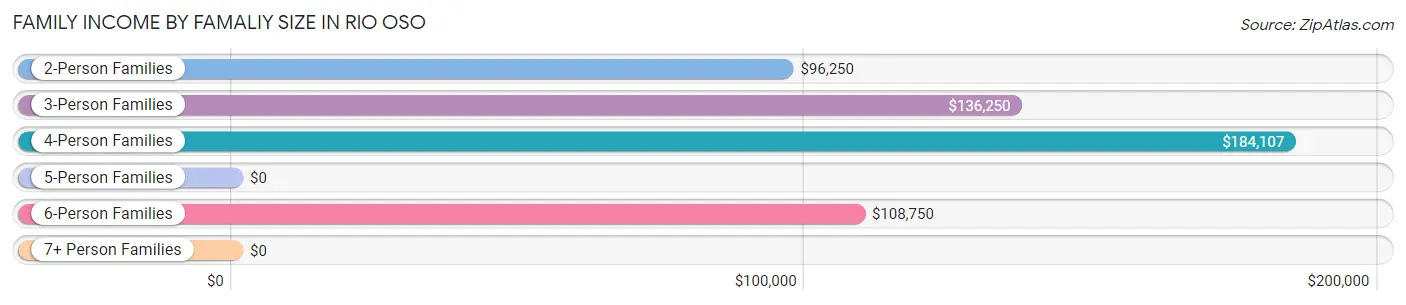
| Income Bracket | # Families | Median Income |
| 2-Person Families | 26 (27.7%) | $96,250 |
| 3-Person Families | 16 (17.0%) | $136,250 |
| 4-Person Families | 19 (20.2%) | $184,107 |
| 5-Person Families | 23 (24.5%) | $0 |
| 6-Person Families | 10 (10.6%) | $108,750 |
| 7+ Person Families | 0 (0.0%) | $0 |
| Total | 94 (100.0%) | $174,167 |
Family Income by Number of Earners in Rio Oso
The median family income in Rio Oso is $174,167, with families comprising 2 earners (42) having the highest median family income of $250,001, while families with no earners (7) have the lowest median family income of $84,375, accounting for 44.7% and 7.4% of families, respectively.
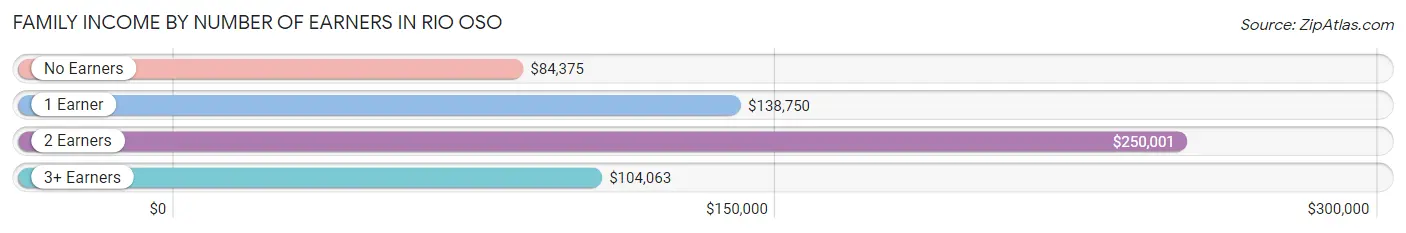
| Number of Earners | # Families | Median Income |
| No Earners | 7 (7.4%) | $84,375 |
| 1 Earner | 30 (31.9%) | $138,750 |
| 2 Earners | 42 (44.7%) | $250,001 |
| 3+ Earners | 15 (16.0%) | $104,063 |
| Total | 94 (100.0%) | $174,167 |
Household Income in Rio Oso
Household Income Brackets in Rio Oso
With 47 households falling in the category, the $200,000+ income range is the most frequent in Rio Oso, accounting for 42.3% of all households.
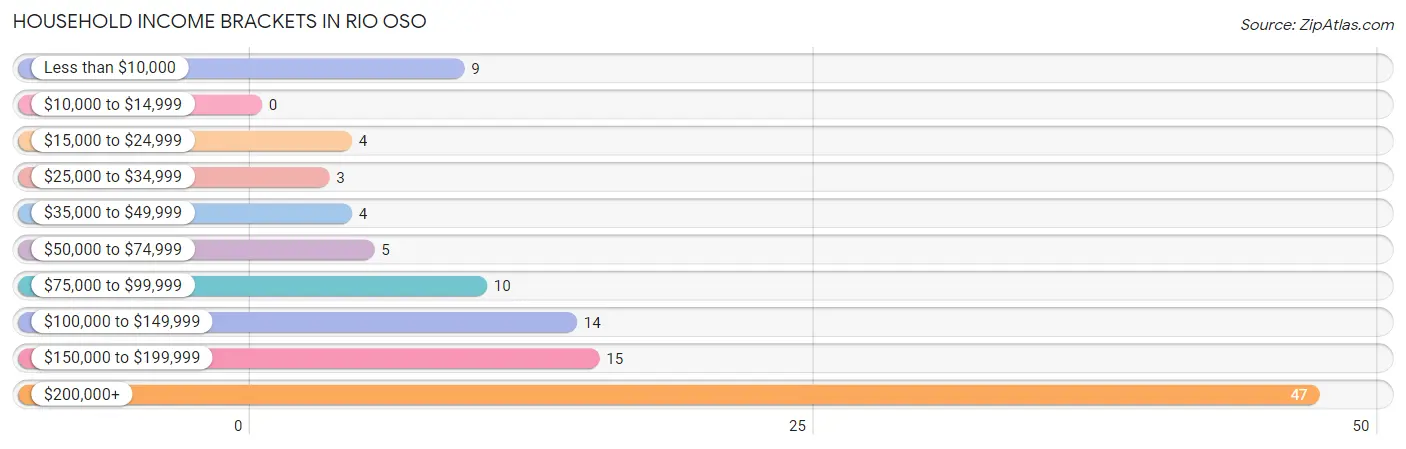
| Income Bracket | # Households | % Households |
| Less than $10,000 | 9 | 8.1% |
| $10,000 to $14,999 | 0 | 0.0% |
| $15,000 to $24,999 | 4 | 3.6% |
| $25,000 to $34,999 | 3 | 2.7% |
| $35,000 to $49,999 | 4 | 3.6% |
| $50,000 to $74,999 | 5 | 4.5% |
| $75,000 to $99,999 | 10 | 9.0% |
| $100,000 to $149,999 | 14 | 12.6% |
| $150,000 to $199,999 | 15 | 13.5% |
| $200,000+ | 47 | 42.3% |
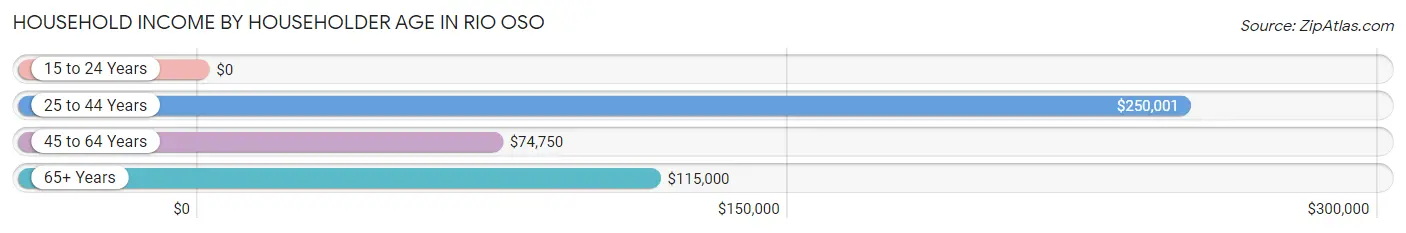
Household Income by Householder Age in Rio Oso
The median household income in Rio Oso is $174,583, with the highest median household income of $250,001 found in the 25 to 44 years age bracket for the primary householder. A total of 53 households (47.7%) fall into this category. Meanwhile, the 15 to 24 years age bracket for the primary householder has the lowest median household income of $0, with 1 households (0.9%) in this group.
| Income Bracket | # Households | Median Income |
| 15 to 24 Years | 1 (0.9%) | $0 |
| 25 to 44 Years | 53 (47.7%) | $250,001 |
| 45 to 64 Years | 21 (18.9%) | $74,750 |
| 65+ Years | 36 (32.4%) | $115,000 |
| Total | 111 (100.0%) | $174,583 |
Poverty in Rio Oso
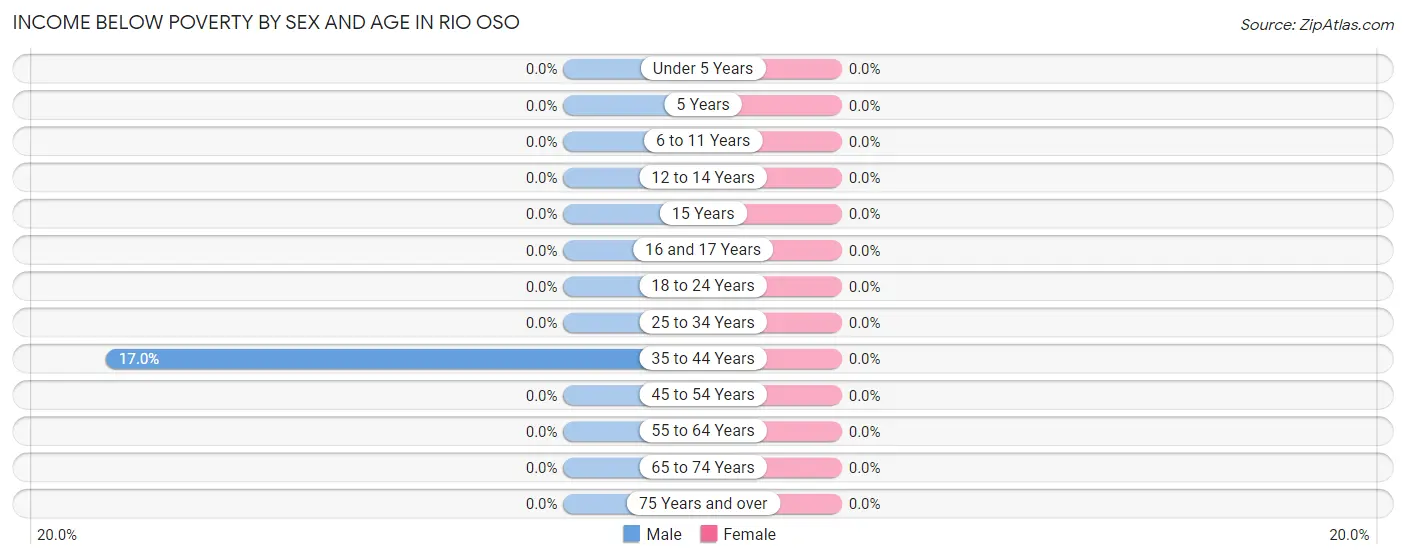
Income Below Poverty by Sex and Age in Rio Oso
| Age Bracket | Male | Female |
| Under 5 Years | 0 (0.0%) | 0 (0.0%) |
| 5 Years | 0 (0.0%) | 0 (0.0%) |
| 6 to 11 Years | 0 (0.0%) | 0 (0.0%) |
| 12 to 14 Years | 0 (0.0%) | 0 (0.0%) |
| 15 Years | 0 (0.0%) | 0 (0.0%) |
| 16 and 17 Years | 0 (0.0%) | 0 (0.0%) |
| 18 to 24 Years | 0 (0.0%) | 0 (0.0%) |
| 25 to 34 Years | 0 (0.0%) | 0 (0.0%) |
| 35 to 44 Years | 9 (17.0%) | 0 (0.0%) |
| 45 to 54 Years | 0 (0.0%) | 0 (0.0%) |
| 55 to 64 Years | 0 (0.0%) | 0 (0.0%) |
| 65 to 74 Years | 0 (0.0%) | 0 (0.0%) |
| 75 Years and over | 0 (0.0%) | 0 (0.0%) |
| Total | 9 (4.8%) | 0 (0.0%) |
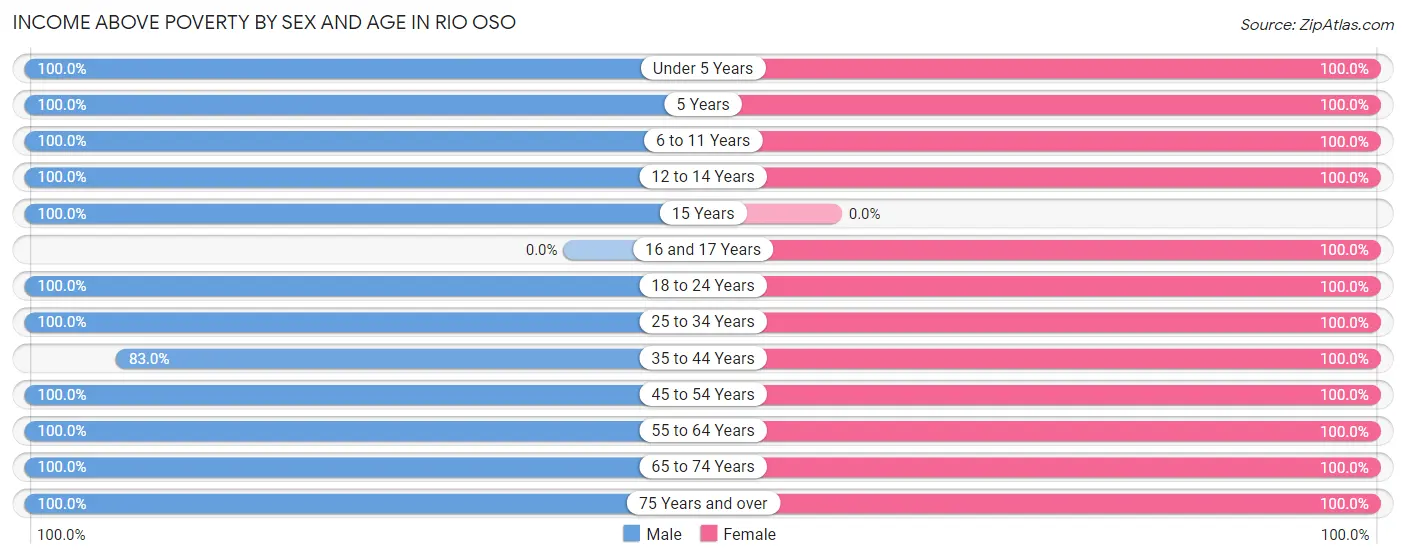
Income Above Poverty by Sex and Age in Rio Oso
According to the poverty statistics in Rio Oso, males aged under 5 years and females aged under 5 years are the age groups that are most secure financially, with 100.0% of males and 100.0% of females in these age groups living above the poverty line.
| Age Bracket | Male | Female |
| Under 5 Years | 5 (100.0%) | 13 (100.0%) |
| 5 Years | 2 (100.0%) | 11 (100.0%) |
| 6 to 11 Years | 34 (100.0%) | 13 (100.0%) |
| 12 to 14 Years | 12 (100.0%) | 9 (100.0%) |
| 15 Years | 3 (100.0%) | 0 (0.0%) |
| 16 and 17 Years | 0 (0.0%) | 34 (100.0%) |
| 18 to 24 Years | 4 (100.0%) | 8 (100.0%) |
| 25 to 34 Years | 11 (100.0%) | 10 (100.0%) |
| 35 to 44 Years | 44 (83.0%) | 21 (100.0%) |
| 45 to 54 Years | 10 (100.0%) | 14 (100.0%) |
| 55 to 64 Years | 11 (100.0%) | 17 (100.0%) |
| 65 to 74 Years | 25 (100.0%) | 24 (100.0%) |
| 75 Years and over | 16 (100.0%) | 8 (100.0%) |
| Total | 177 (95.2%) | 182 (100.0%) |
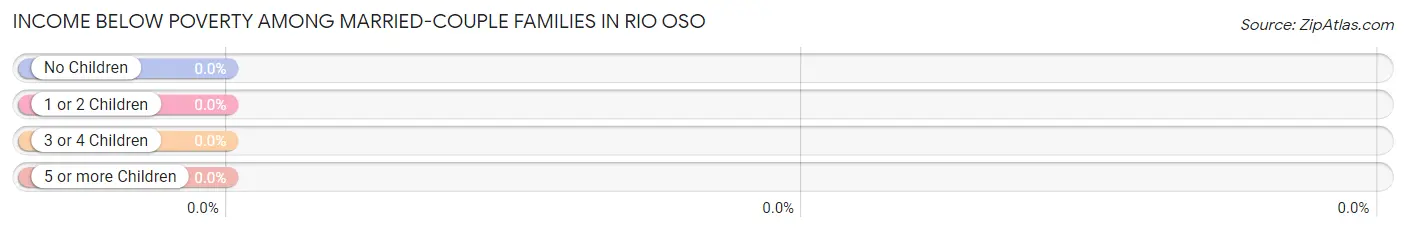
Income Below Poverty Among Married-Couple Families in Rio Oso
| Children | Above Poverty | Below Poverty |
| No Children | 29 (100.0%) | 0 (0.0%) |
| 1 or 2 Children | 21 (100.0%) | 0 (0.0%) |
| 3 or 4 Children | 3 (100.0%) | 0 (0.0%) |
| 5 or more Children | 0 (0.0%) | 0 (0.0%) |
| Total | 53 (100.0%) | 0 (0.0%) |
Income Below Poverty Among Single-Parent Households in Rio Oso
| Children | Single Father | Single Mother |
| No Children | 0 (0.0%) | 0 (0.0%) |
| 1 or 2 Children | 0 (0.0%) | 0 (0.0%) |
| 3 or 4 Children | 0 (0.0%) | 0 (0.0%) |
| 5 or more Children | 0 (0.0%) | 0 (0.0%) |
| Total | 0 (0.0%) | 0 (0.0%) |
Income Below Poverty Among Married-Couple vs Single-Parent Households in Rio Oso
| Children | Married-Couple Families | Single-Parent Households |
| No Children | 0 (0.0%) | 0 (0.0%) |
| 1 or 2 Children | 0 (0.0%) | 0 (0.0%) |
| 3 or 4 Children | 0 (0.0%) | 0 (0.0%) |
| 5 or more Children | 0 (0.0%) | 0 (0.0%) |
| Total | 0 (0.0%) | 0 (0.0%) |
Race in Rio Oso
The most populous races in Rio Oso are White / Caucasian (300 | 81.5%), Asian (32 | 8.7%), and Hispanic or Latino (24 | 6.5%).
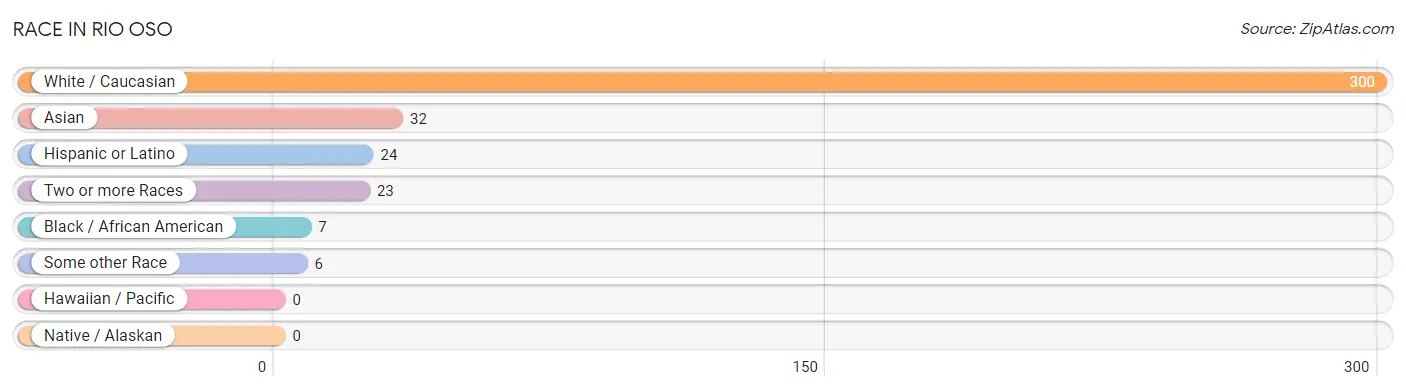
| Race | # Population | % Population |
| Asian | 32 | 8.7% |
| Black / African American | 7 | 1.9% |
| Hawaiian / Pacific | 0 | 0.0% |
| Hispanic or Latino | 24 | 6.5% |
| Native / Alaskan | 0 | 0.0% |
| White / Caucasian | 300 | 81.5% |
| Two or more Races | 23 | 6.2% |
| Some other Race | 6 | 1.6% |
| Total | 368 | 100.0% |
Ancestry in Rio Oso
The most populous ancestries reported in Rio Oso are American (58 | 15.8%), German (49 | 13.3%), English (45 | 12.2%), British (37 | 10.1%), and Mexican (24 | 6.5%), together accounting for 57.9% of all Rio Oso residents.
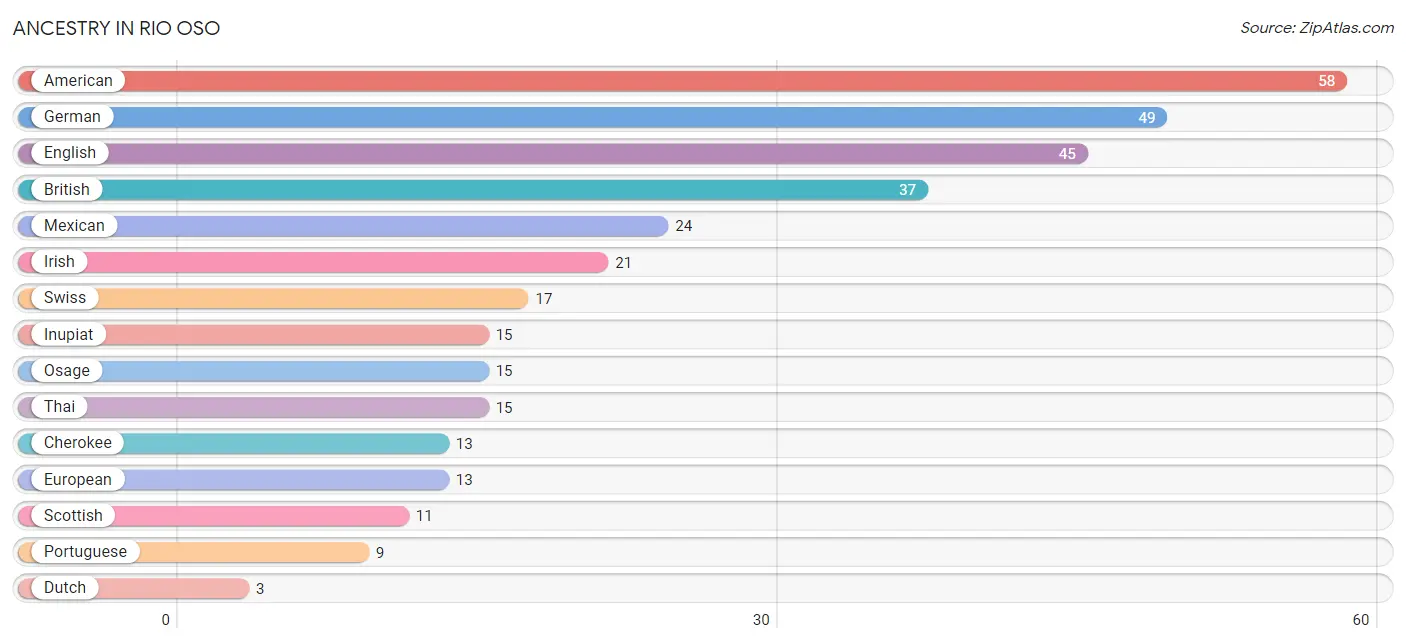
| Ancestry | # Population | % Population |
| American | 58 | 15.8% |
| British | 37 | 10.1% |
| Cherokee | 13 | 3.5% |
| Choctaw | 2 | 0.5% |
| Dutch | 3 | 0.8% |
| English | 45 | 12.2% |
| European | 13 | 3.5% |
| German | 49 | 13.3% |
| Greek | 2 | 0.5% |
| Inupiat | 15 | 4.1% |
| Irish | 21 | 5.7% |
| Italian | 2 | 0.5% |
| Mexican | 24 | 6.5% |
| Norwegian | 3 | 0.8% |
| Osage | 15 | 4.1% |
| Portuguese | 9 | 2.5% |
| Scottish | 11 | 3.0% |
| Swiss | 17 | 4.6% |
| Thai | 15 | 4.1% |
| Welsh | 1 | 0.3% | View All 20 Rows |
Immigrants in Rio Oso
The most numerous immigrant groups reported in Rio Oso came from Asia (26 | 7.1%), South Central Asia (26 | 7.1%), India (24 | 6.5%), Europe (4 | 1.1%), and Germany (4 | 1.1%), together accounting for 22.8% of all Rio Oso residents.
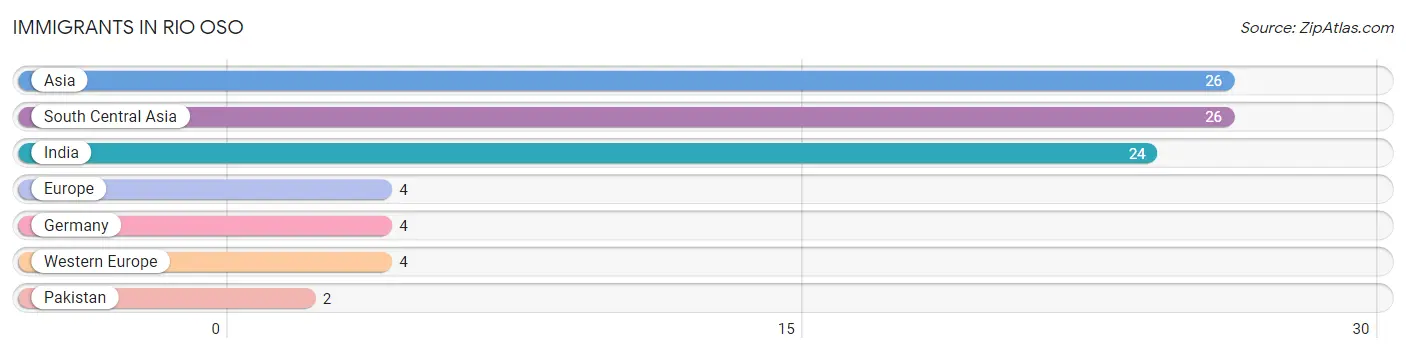
| Immigration Origin | # Population | % Population |
| Asia | 26 | 7.1% |
| Europe | 4 | 1.1% |
| Germany | 4 | 1.1% |
| India | 24 | 6.5% |
| Pakistan | 2 | 0.5% |
| South Central Asia | 26 | 7.1% |
| Western Europe | 4 | 1.1% | View All 7 Rows |
Sex and Age in Rio Oso
Sex and Age in Rio Oso
The most populous age groups in Rio Oso are 10 to 14 Years (40 | 21.5%) for men and 15 to 19 Years (34 | 18.7%) for women.
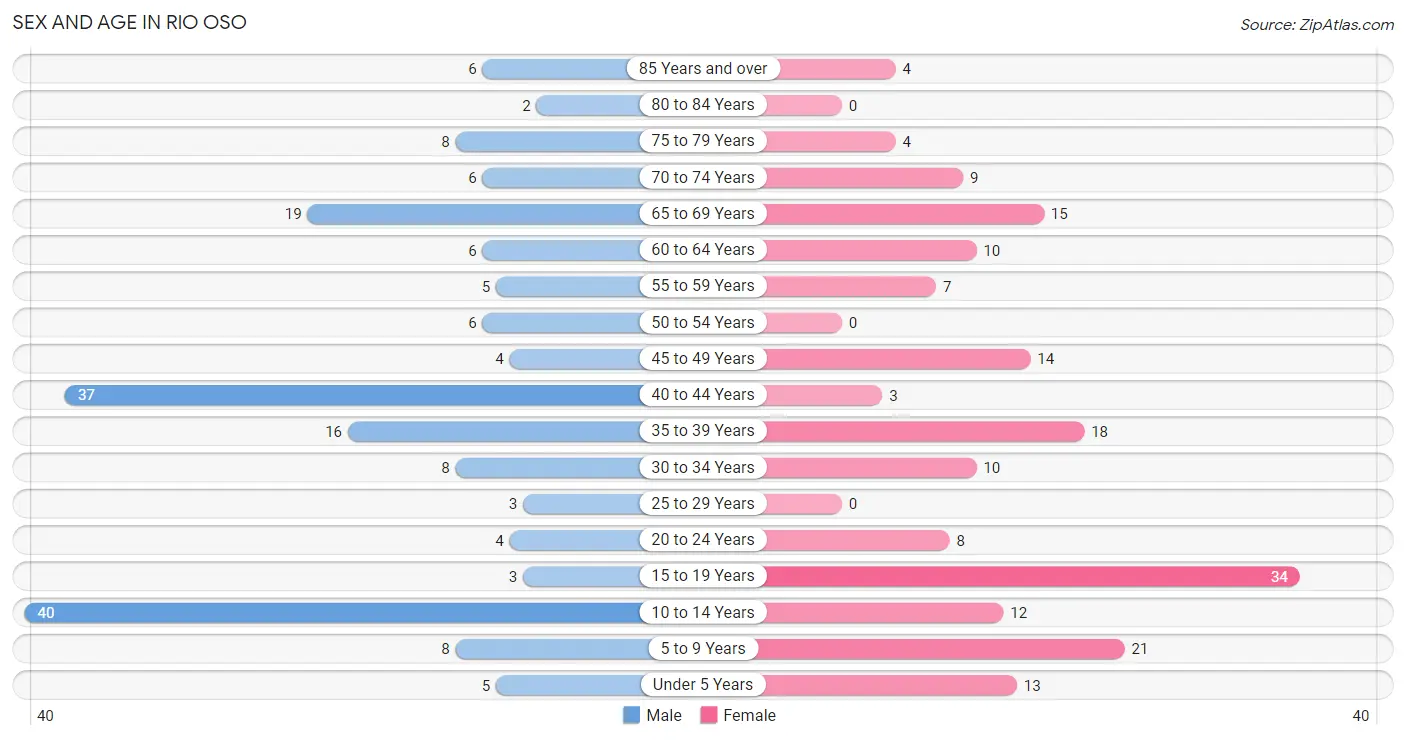
| Age Bracket | Male | Female |
| Under 5 Years | 5 (2.7%) | 13 (7.1%) |
| 5 to 9 Years | 8 (4.3%) | 21 (11.5%) |
| 10 to 14 Years | 40 (21.5%) | 12 (6.6%) |
| 15 to 19 Years | 3 (1.6%) | 34 (18.7%) |
| 20 to 24 Years | 4 (2.1%) | 8 (4.4%) |
| 25 to 29 Years | 3 (1.6%) | 0 (0.0%) |
| 30 to 34 Years | 8 (4.3%) | 10 (5.5%) |
| 35 to 39 Years | 16 (8.6%) | 18 (9.9%) |
| 40 to 44 Years | 37 (19.9%) | 3 (1.7%) |
| 45 to 49 Years | 4 (2.1%) | 14 (7.7%) |
| 50 to 54 Years | 6 (3.2%) | 0 (0.0%) |
| 55 to 59 Years | 5 (2.7%) | 7 (3.8%) |
| 60 to 64 Years | 6 (3.2%) | 10 (5.5%) |
| 65 to 69 Years | 19 (10.2%) | 15 (8.2%) |
| 70 to 74 Years | 6 (3.2%) | 9 (5.0%) |
| 75 to 79 Years | 8 (4.3%) | 4 (2.2%) |
| 80 to 84 Years | 2 (1.1%) | 0 (0.0%) |
| 85 Years and over | 6 (3.2%) | 4 (2.2%) |
| Total | 186 (100.0%) | 182 (100.0%) |
Families and Households in Rio Oso
Median Family Size in Rio Oso
The median family size in Rio Oso is 3.61 persons per family, with single male/father families (24 | 25.5%) accounting for the largest median family size of 4.13 persons per family. On the other hand, married-couple families (53 | 56.4%) represent the smallest median family size with 3.28 persons per family.
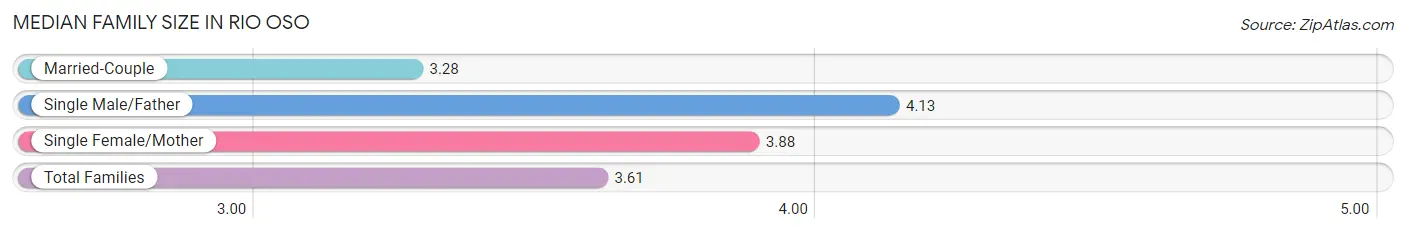
| Family Type | # Families | Family Size |
| Married-Couple | 53 (56.4%) | 3.28 |
| Single Male/Father | 24 (25.5%) | 4.13 |
| Single Female/Mother | 17 (18.1%) | 3.88 |
| Total Families | 94 (100.0%) | 3.61 |
Median Household Size in Rio Oso
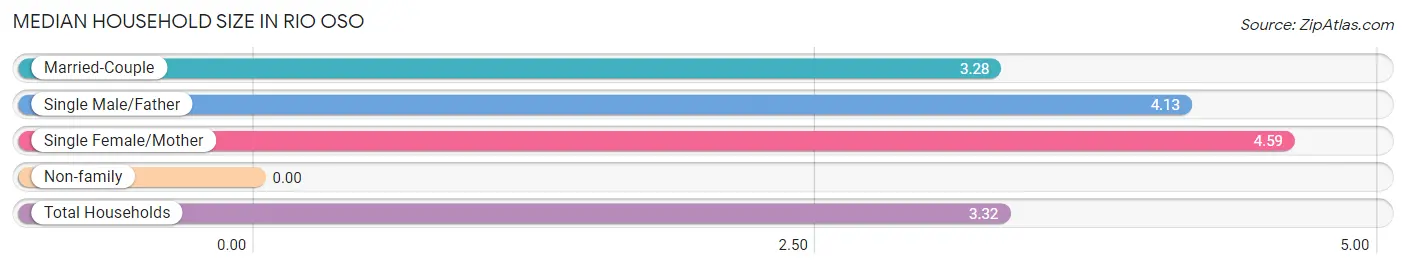
| Household Type | # Households | Household Size |
| Married-Couple | 53 (47.7%) | 3.28 |
| Single Male/Father | 24 (21.6%) | 4.13 |
| Single Female/Mother | 17 (15.3%) | 4.59 |
| Non-family | 17 (15.3%) | - |
| Total Households | 111 (100.0%) | 3.32 |
Household Size by Marriage Status in Rio Oso
Out of a total of 111 households in Rio Oso, 94 (84.7%) are family households, while 17 (15.3%) are nonfamily households. The most numerous type of family households are 2-person households, comprising 26, and the most common type of nonfamily households are 1-person households, comprising 17.
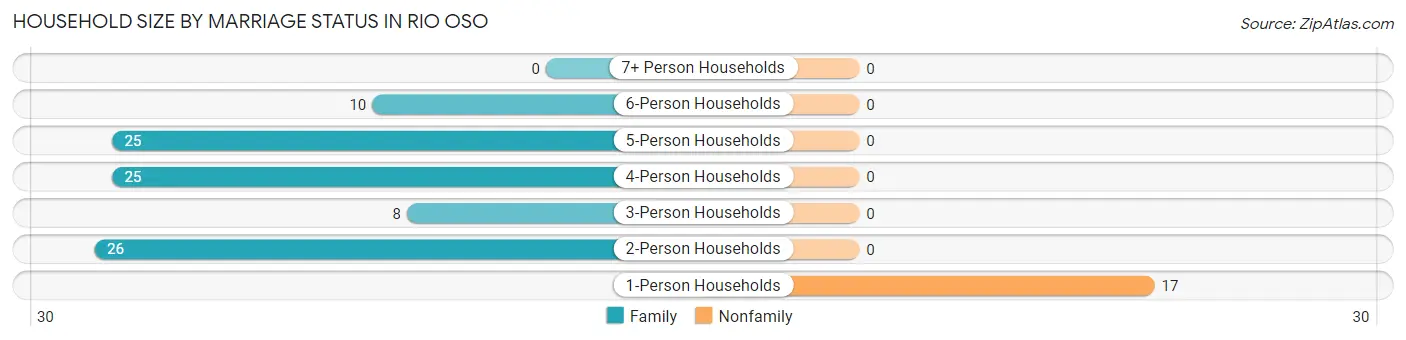
| Household Size | Family Households | Nonfamily Households |
| 1-Person Households | - | 17 (15.3%) |
| 2-Person Households | 26 (23.4%) | 0 (0.0%) |
| 3-Person Households | 8 (7.2%) | 0 (0.0%) |
| 4-Person Households | 25 (22.5%) | 0 (0.0%) |
| 5-Person Households | 25 (22.5%) | 0 (0.0%) |
| 6-Person Households | 10 (9.0%) | 0 (0.0%) |
| 7+ Person Households | 0 (0.0%) | 0 (0.0%) |
| Total | 94 (84.7%) | 17 (15.3%) |
Female Fertility in Rio Oso
Fertility by Age in Rio Oso
Average fertility rate in Rio Oso is 57.0 births per 1,000 women. Women in the age bracket of 20 to 34 years have the highest fertility rate with 278.0 births per 1,000 women. Women in the age bracket of 20 to 34 years acount for 100.0% of all women with births.
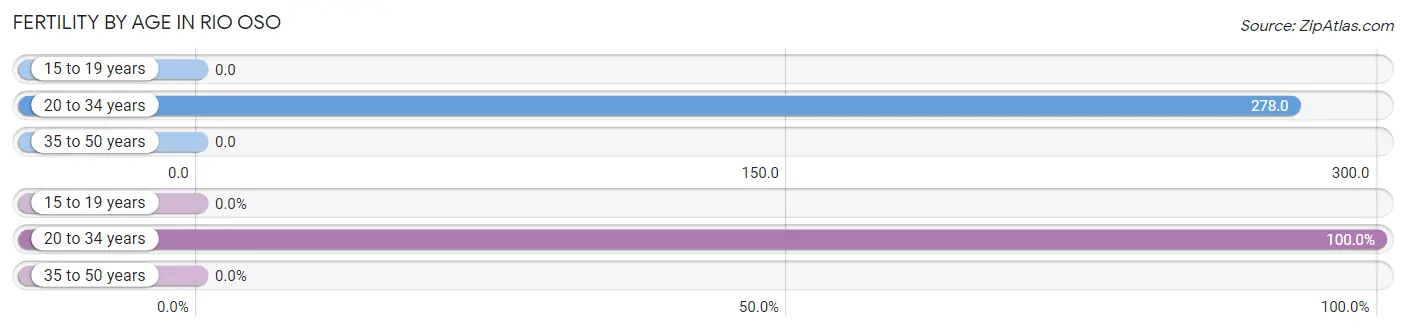
| Age Bracket | Women with Births | Births / 1,000 Women |
| 15 to 19 years | 0 (0.0%) | 0.0 |
| 20 to 34 years | 5 (100.0%) | 278.0 |
| 35 to 50 years | 0 (0.0%) | 0.0 |
| Total | 5 (100.0%) | 57.0 |
Fertility by Age by Marriage Status in Rio Oso
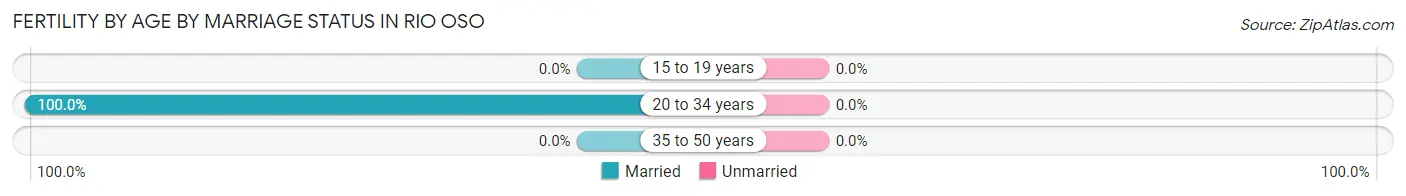
| Age Bracket | Married | Unmarried |
| 15 to 19 years | 0 (0.0%) | 0 (0.0%) |
| 20 to 34 years | 5 (100.0%) | 0 (0.0%) |
| 35 to 50 years | 0 (0.0%) | 0 (0.0%) |
| Total | 5 (100.0%) | 0 (0.0%) |
Fertility by Education in Rio Oso
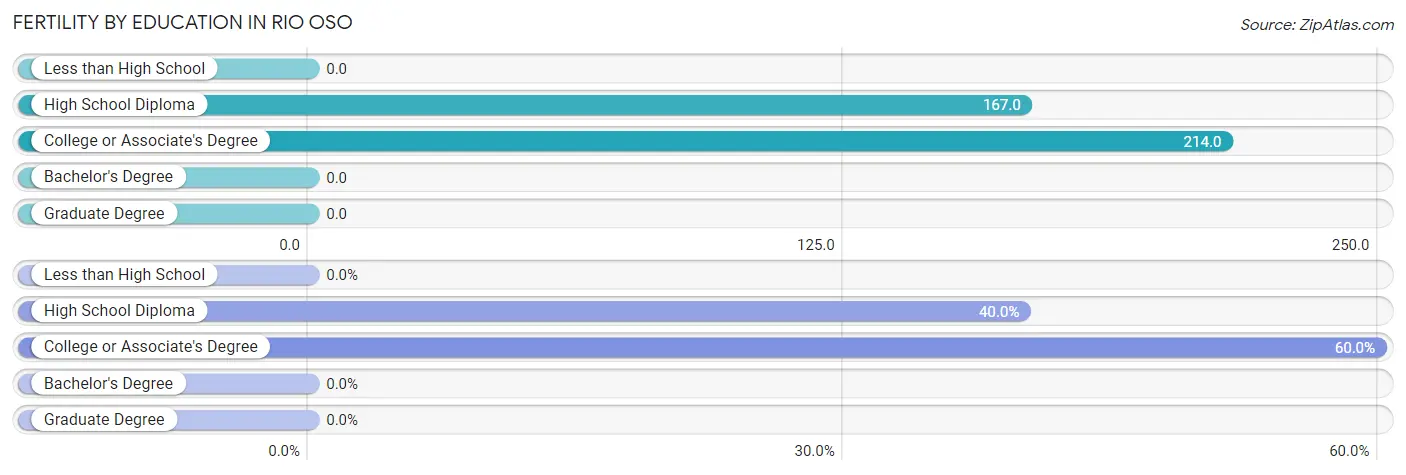
| Educational Attainment | Women with Births | Births / 1,000 Women |
| Less than High School | 0 (0.0%) | 0.0 |
| High School Diploma | 2 (40.0%) | 167.0 |
| College or Associate's Degree | 3 (60.0%) | 214.0 |
| Bachelor's Degree | 0 (0.0%) | 0.0 |
| Graduate Degree | 0 (0.0%) | 0.0 |
| Total | 5 (100.0%) | 57.0 |
Fertility by Education by Marriage Status in Rio Oso
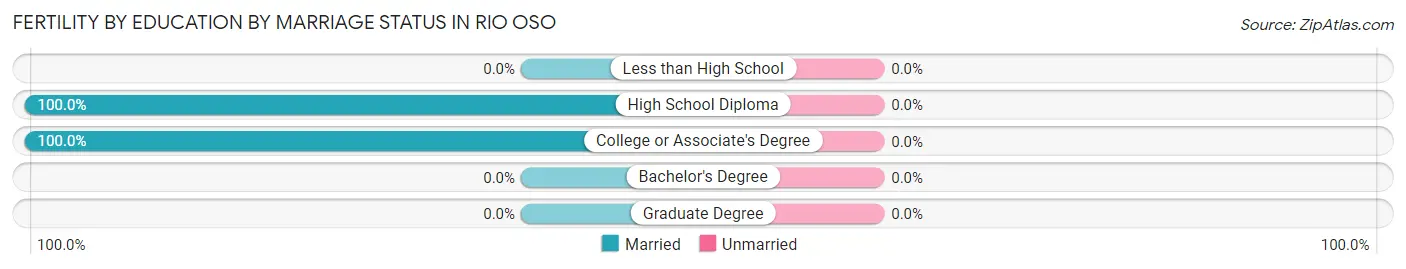
| Educational Attainment | Married | Unmarried |
| Less than High School | 0 (0.0%) | 0 (0.0%) |
| High School Diploma | 2 (100.0%) | 0 (0.0%) |
| College or Associate's Degree | 3 (100.0%) | 0 (0.0%) |
| Bachelor's Degree | 0 (0.0%) | 0 (0.0%) |
| Graduate Degree | 0 (0.0%) | 0 (0.0%) |
| Total | 5 (100.0%) | 0 (0.0%) |
Employment Characteristics in Rio Oso
Employment by Class of Employer in Rio Oso
Among the 147 employed individuals in Rio Oso, private company employees (97 | 66.0%), state government employees (24 | 16.3%), and local government employees (10 | 6.8%) make up the most common classes of employment.
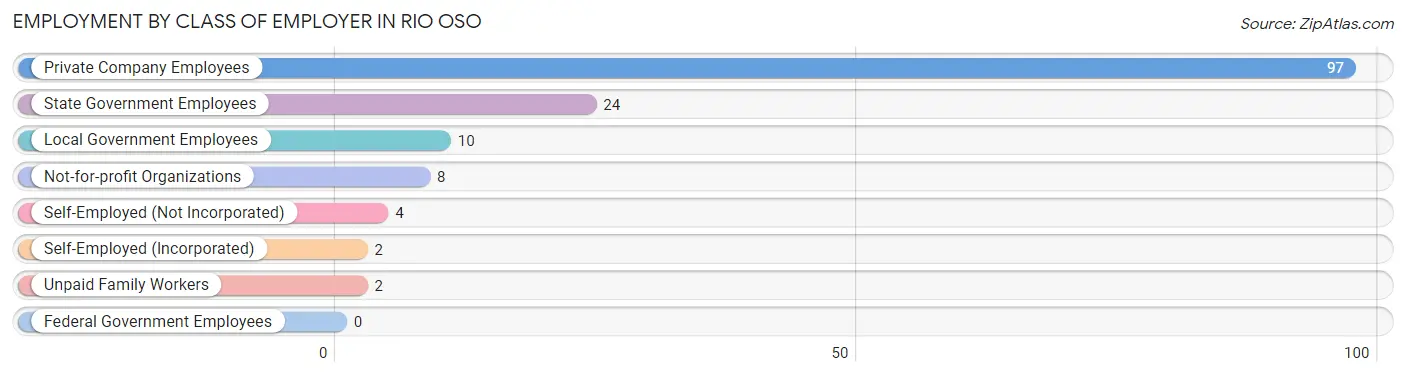
| Employer Class | # Employees | % Employees |
| Private Company Employees | 97 | 66.0% |
| Self-Employed (Incorporated) | 2 | 1.4% |
| Self-Employed (Not Incorporated) | 4 | 2.7% |
| Not-for-profit Organizations | 8 | 5.4% |
| Local Government Employees | 10 | 6.8% |
| State Government Employees | 24 | 16.3% |
| Federal Government Employees | 0 | 0.0% |
| Unpaid Family Workers | 2 | 1.4% |
| Total | 147 | 100.0% |
Employment Status by Age in Rio Oso
According to the labor force statistics for Rio Oso, out of the total population over 16 years of age (266), 57.9% or 154 individuals are in the labor force, with 2.6% or 4 of them unemployed. The age group with the highest labor force participation rate is 25 to 29 years, with 100.0% or 3 individuals in the labor force. Within the labor force, the 45 to 54 years age range has the highest percentage of unemployed individuals, with 16.7% or 4 of them being unemployed.
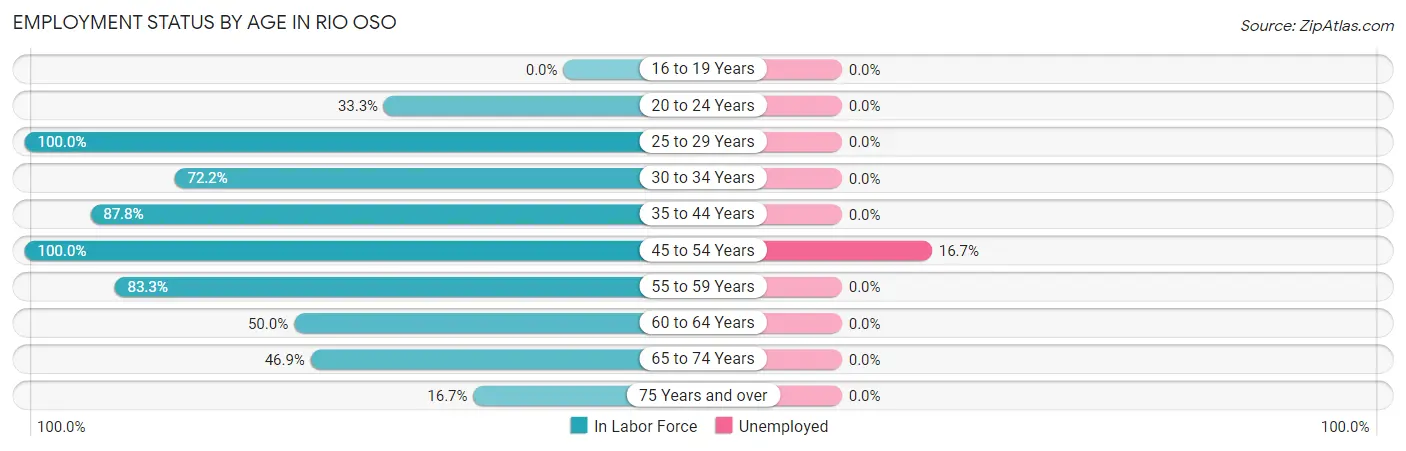
| Age Bracket | In Labor Force | Unemployed |
| 16 to 19 Years | 0 (0.0%) | 0 (0.0%) |
| 20 to 24 Years | 4 (33.3%) | 0 (0.0%) |
| 25 to 29 Years | 3 (100.0%) | 0 (0.0%) |
| 30 to 34 Years | 13 (72.2%) | 0 (0.0%) |
| 35 to 44 Years | 65 (87.8%) | 0 (0.0%) |
| 45 to 54 Years | 24 (100.0%) | 4 (16.7%) |
| 55 to 59 Years | 10 (83.3%) | 0 (0.0%) |
| 60 to 64 Years | 8 (50.0%) | 0 (0.0%) |
| 65 to 74 Years | 23 (46.9%) | 0 (0.0%) |
| 75 Years and over | 4 (16.7%) | 0 (0.0%) |
| Total | 154 (57.9%) | 4 (2.6%) |
Employment Status by Educational Attainment in Rio Oso
According to labor force statistics for Rio Oso, 83.7% of individuals (123) out of the total population between 25 and 64 years of age (147) are in the labor force, with 3.3% or 4 of them being unemployed. The group with the highest labor force participation rate are those with the educational attainment of bachelor's degree or higher, with 95.7% or 45 individuals in the labor force. Within the labor force, individuals with college / associate degree education have the highest percentage of unemployment, with 6.9% or 4 of them being unemployed.
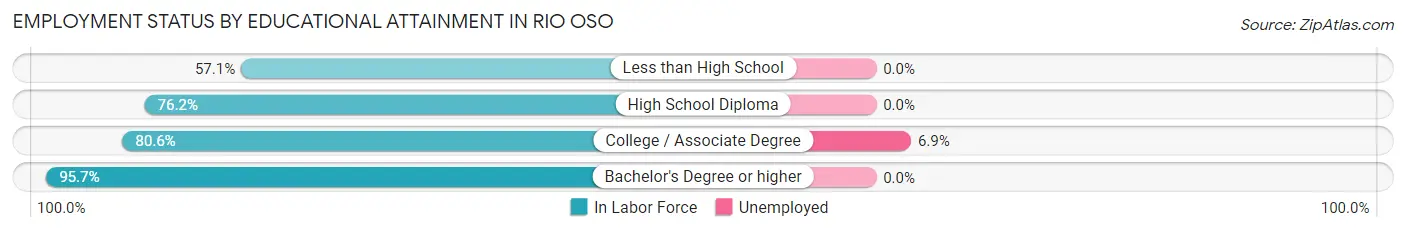
| Educational Attainment | In Labor Force | Unemployed |
| Less than High School | 4 (57.1%) | 0 (0.0%) |
| High School Diploma | 16 (76.2%) | 0 (0.0%) |
| College / Associate Degree | 58 (80.6%) | 5 (6.9%) |
| Bachelor's Degree or higher | 45 (95.7%) | 0 (0.0%) |
| Total | 123 (83.7%) | 5 (3.3%) |
Employment Occupations by Sex in Rio Oso
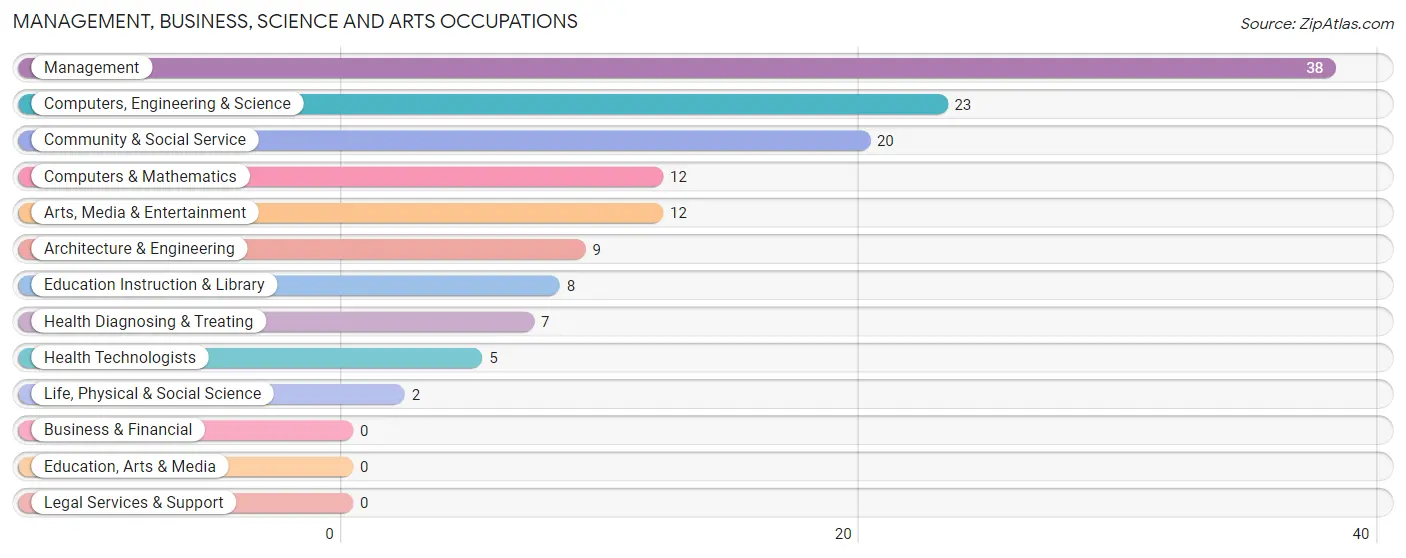
Management, Business, Science and Arts Occupations
The most common Management, Business, Science and Arts occupations in Rio Oso are Management (38 | 25.3%), Computers, Engineering & Science (23 | 15.3%), Community & Social Service (20 | 13.3%), Computers & Mathematics (12 | 8.0%), and Arts, Media & Entertainment (12 | 8.0%).
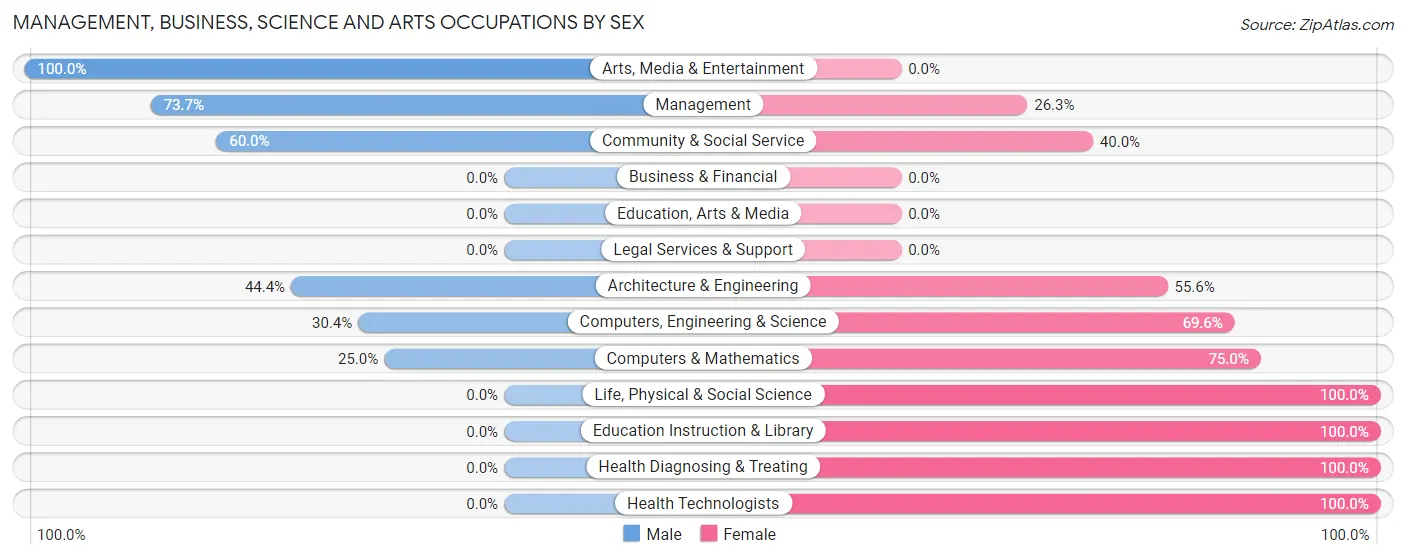
Management, Business, Science and Arts Occupations by Sex
Within the Management, Business, Science and Arts occupations in Rio Oso, the most male-oriented occupations are Arts, Media & Entertainment (100.0%), Management (73.7%), and Community & Social Service (60.0%), while the most female-oriented occupations are Life, Physical & Social Science (100.0%), Education Instruction & Library (100.0%), and Health Diagnosing & Treating (100.0%).
| Occupation | Male | Female |
| Management | 28 (73.7%) | 10 (26.3%) |
| Business & Financial | 0 (0.0%) | 0 (0.0%) |
| Computers, Engineering & Science | 7 (30.4%) | 16 (69.6%) |
| Computers & Mathematics | 3 (25.0%) | 9 (75.0%) |
| Architecture & Engineering | 4 (44.4%) | 5 (55.6%) |
| Life, Physical & Social Science | 0 (0.0%) | 2 (100.0%) |
| Community & Social Service | 12 (60.0%) | 8 (40.0%) |
| Education, Arts & Media | 0 (0.0%) | 0 (0.0%) |
| Legal Services & Support | 0 (0.0%) | 0 (0.0%) |
| Education Instruction & Library | 0 (0.0%) | 8 (100.0%) |
| Arts, Media & Entertainment | 12 (100.0%) | 0 (0.0%) |
| Health Diagnosing & Treating | 0 (0.0%) | 7 (100.0%) |
| Health Technologists | 0 (0.0%) | 5 (100.0%) |
| Total (Category) | 47 (53.4%) | 41 (46.6%) |
| Total (Overall) | 95 (63.3%) | 55 (36.7%) |
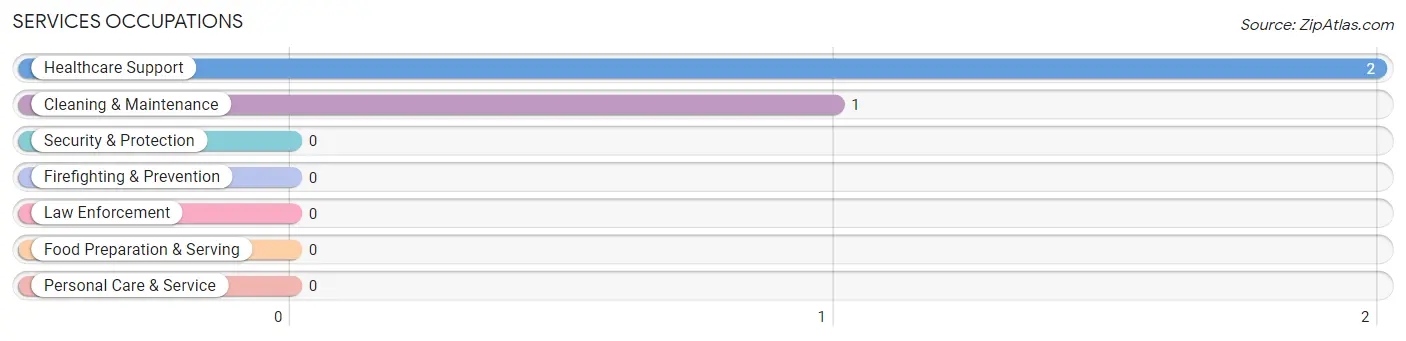
Services Occupations
The most common Services occupations in Rio Oso are Healthcare Support (2 | 1.3%), and Cleaning & Maintenance (1 | 0.7%).
Services Occupations by Sex
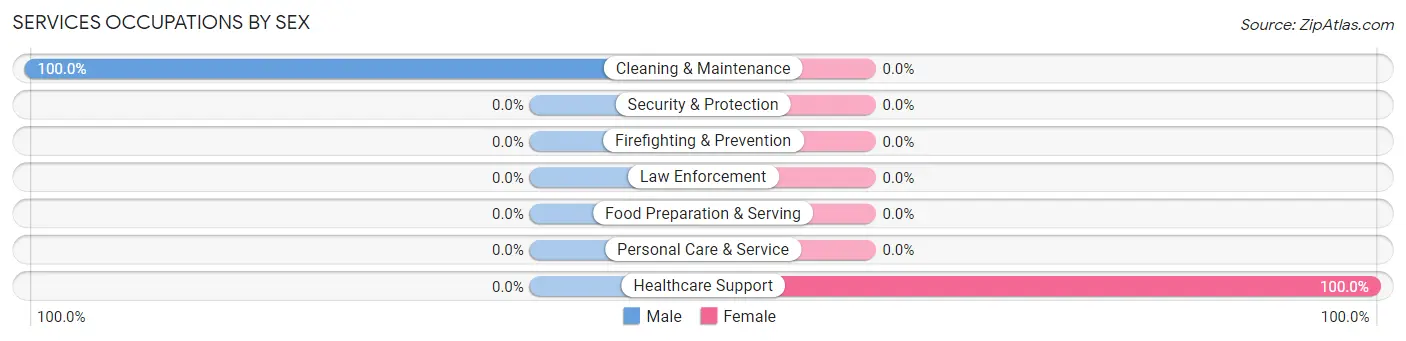
| Occupation | Male | Female |
| Healthcare Support | 0 (0.0%) | 2 (100.0%) |
| Security & Protection | 0 (0.0%) | 0 (0.0%) |
| Firefighting & Prevention | 0 (0.0%) | 0 (0.0%) |
| Law Enforcement | 0 (0.0%) | 0 (0.0%) |
| Food Preparation & Serving | 0 (0.0%) | 0 (0.0%) |
| Cleaning & Maintenance | 1 (100.0%) | 0 (0.0%) |
| Personal Care & Service | 0 (0.0%) | 0 (0.0%) |
| Total (Category) | 1 (33.3%) | 2 (66.7%) |
| Total (Overall) | 95 (63.3%) | 55 (36.7%) |
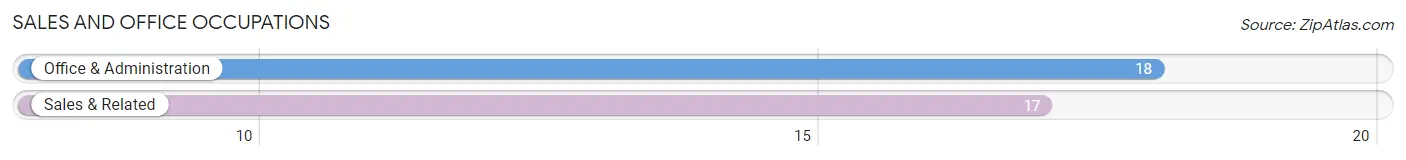
Sales and Office Occupations
The most common Sales and Office occupations in Rio Oso are Office & Administration (18 | 12.0%), and Sales & Related (17 | 11.3%).
Sales and Office Occupations by Sex
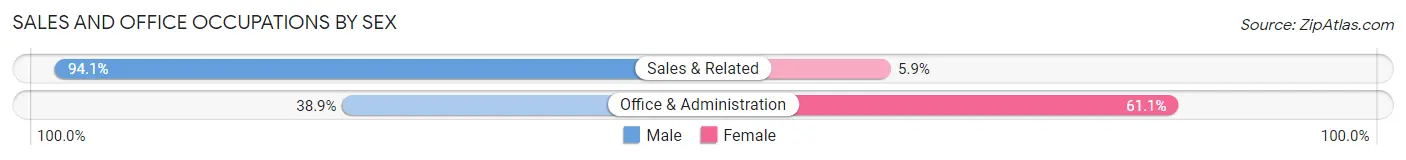
| Occupation | Male | Female |
| Sales & Related | 16 (94.1%) | 1 (5.9%) |
| Office & Administration | 7 (38.9%) | 11 (61.1%) |
| Total (Category) | 23 (65.7%) | 12 (34.3%) |
| Total (Overall) | 95 (63.3%) | 55 (36.7%) |
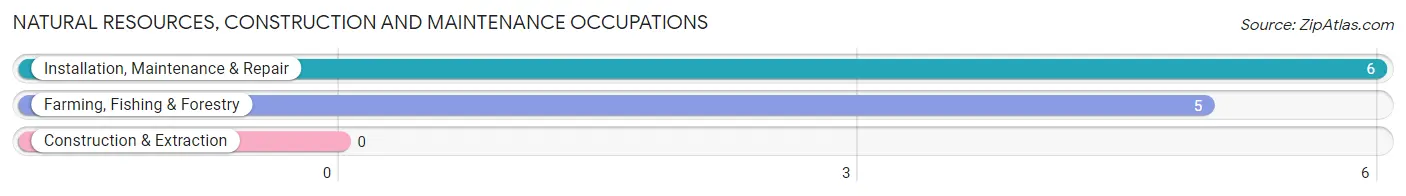
Natural Resources, Construction and Maintenance Occupations
The most common Natural Resources, Construction and Maintenance occupations in Rio Oso are Installation, Maintenance & Repair (6 | 4.0%), and Farming, Fishing & Forestry (5 | 3.3%).
Natural Resources, Construction and Maintenance Occupations by Sex
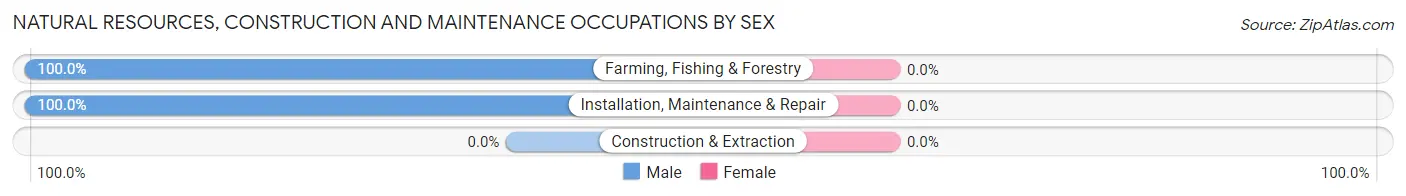
| Occupation | Male | Female |
| Farming, Fishing & Forestry | 5 (100.0%) | 0 (0.0%) |
| Construction & Extraction | 0 (0.0%) | 0 (0.0%) |
| Installation, Maintenance & Repair | 6 (100.0%) | 0 (0.0%) |
| Total (Category) | 11 (100.0%) | 0 (0.0%) |
| Total (Overall) | 95 (63.3%) | 55 (36.7%) |
Production, Transportation and Moving Occupations
The most common Production, Transportation and Moving occupations in Rio Oso are Transportation (7 | 4.7%), Production (4 | 2.7%), and Material Moving (2 | 1.3%).
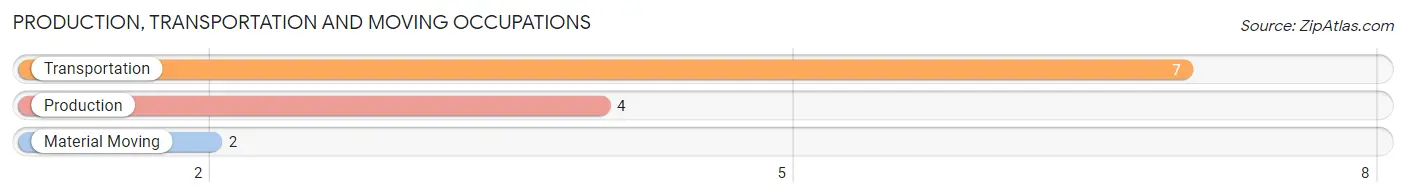
Production, Transportation and Moving Occupations by Sex
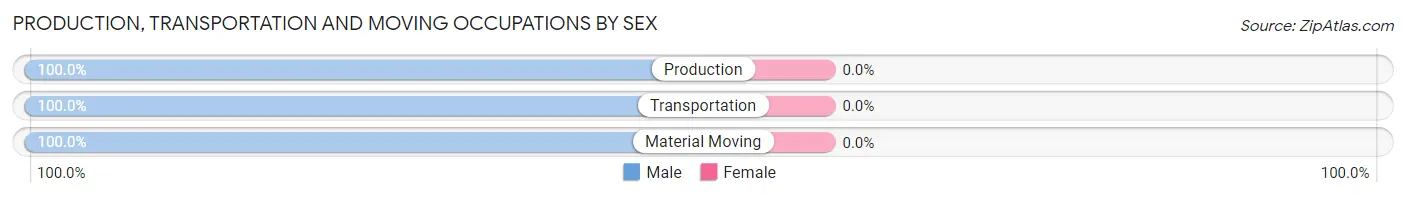
| Occupation | Male | Female |
| Production | 4 (100.0%) | 0 (0.0%) |
| Transportation | 7 (100.0%) | 0 (0.0%) |
| Material Moving | 2 (100.0%) | 0 (0.0%) |
| Total (Category) | 13 (100.0%) | 0 (0.0%) |
| Total (Overall) | 95 (63.3%) | 55 (36.7%) |
Employment Industries by Sex in Rio Oso
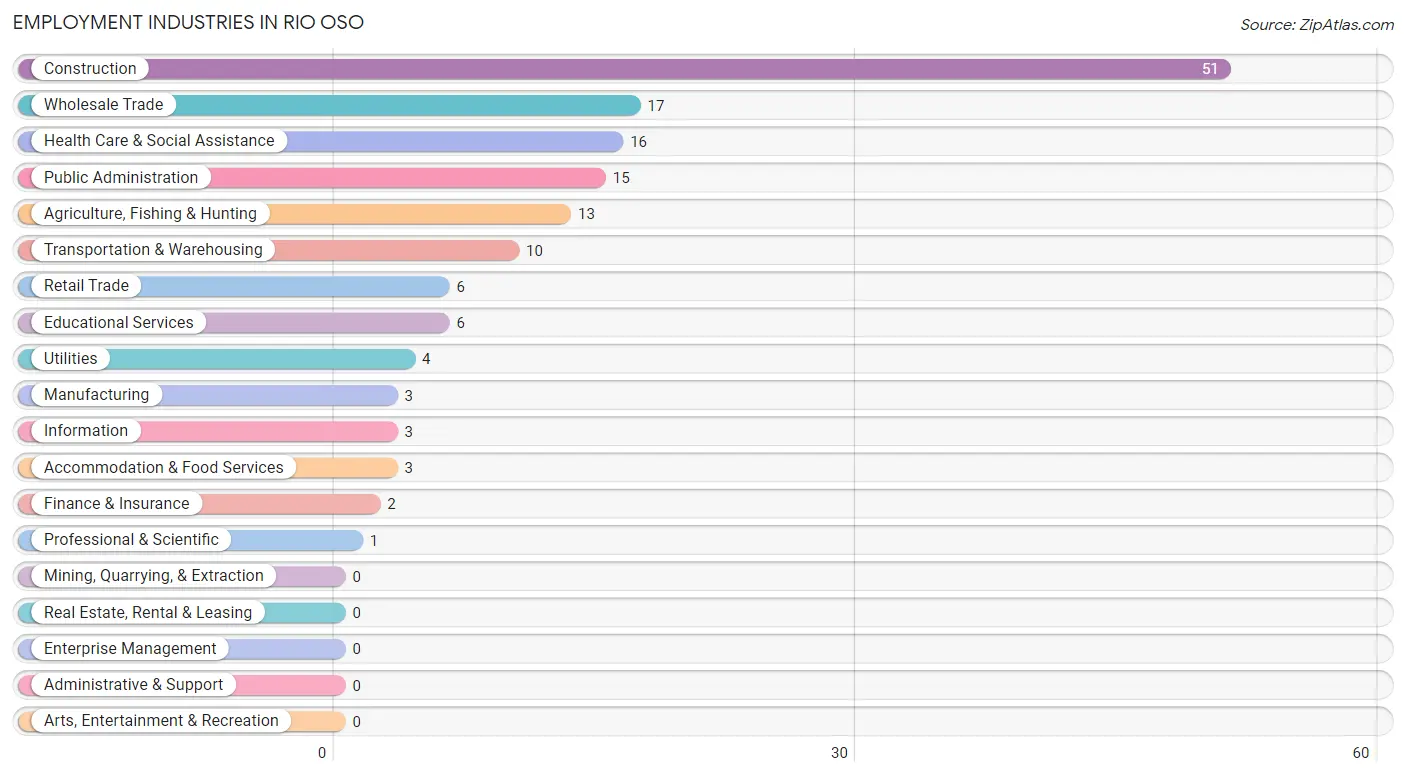
Employment Industries in Rio Oso
The major employment industries in Rio Oso include Construction (51 | 34.0%), Wholesale Trade (17 | 11.3%), Health Care & Social Assistance (16 | 10.7%), Public Administration (15 | 10.0%), and Agriculture, Fishing & Hunting (13 | 8.7%).
Employment Industries by Sex in Rio Oso
The Rio Oso industries that see more men than women are Manufacturing (100.0%), Wholesale Trade (100.0%), and Utilities (100.0%), whereas the industries that tend to have a higher number of women are Educational Services (100.0%), Health Care & Social Assistance (100.0%), and Accommodation & Food Services (100.0%).
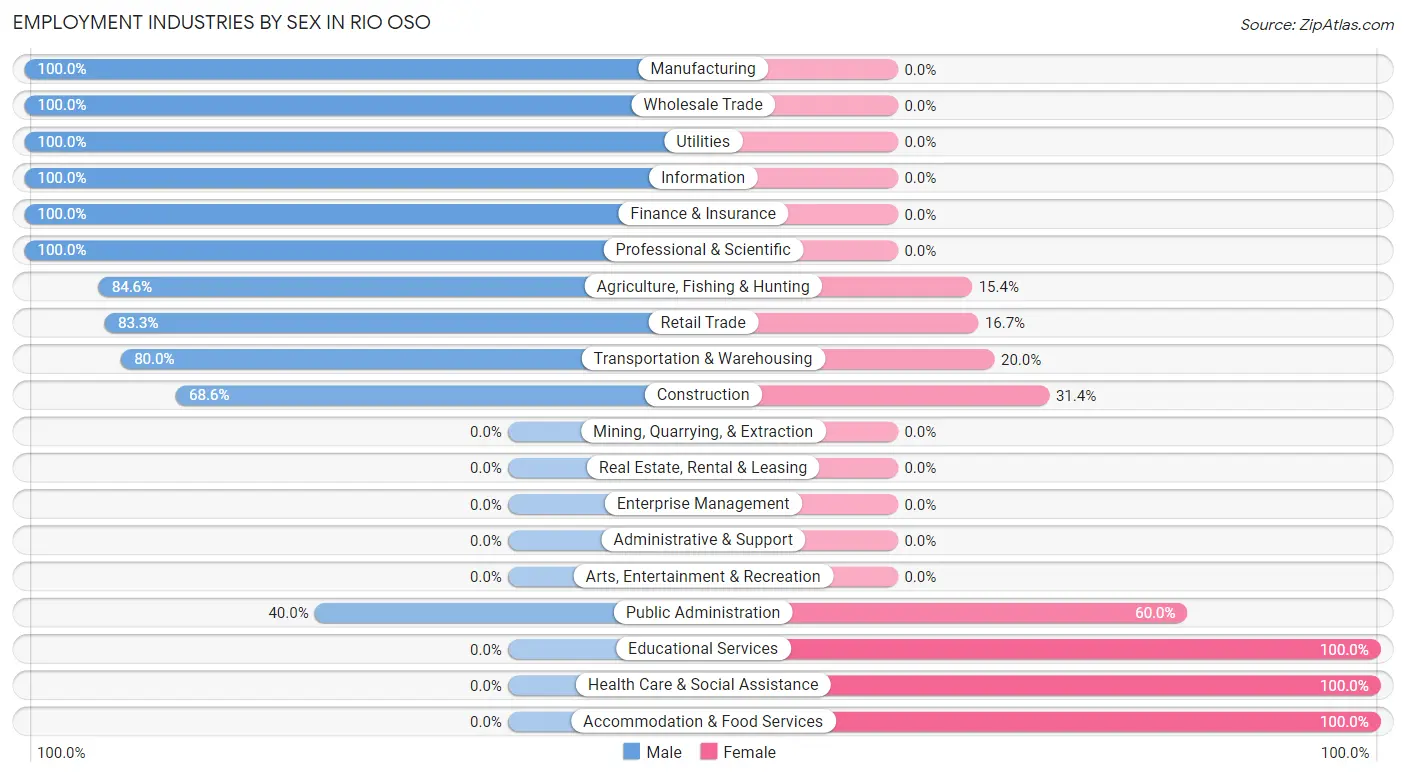
| Industry | Male | Female |
| Agriculture, Fishing & Hunting | 11 (84.6%) | 2 (15.4%) |
| Mining, Quarrying, & Extraction | 0 (0.0%) | 0 (0.0%) |
| Construction | 35 (68.6%) | 16 (31.4%) |
| Manufacturing | 3 (100.0%) | 0 (0.0%) |
| Wholesale Trade | 17 (100.0%) | 0 (0.0%) |
| Retail Trade | 5 (83.3%) | 1 (16.7%) |
| Transportation & Warehousing | 8 (80.0%) | 2 (20.0%) |
| Utilities | 4 (100.0%) | 0 (0.0%) |
| Information | 3 (100.0%) | 0 (0.0%) |
| Finance & Insurance | 2 (100.0%) | 0 (0.0%) |
| Real Estate, Rental & Leasing | 0 (0.0%) | 0 (0.0%) |
| Professional & Scientific | 1 (100.0%) | 0 (0.0%) |
| Enterprise Management | 0 (0.0%) | 0 (0.0%) |
| Administrative & Support | 0 (0.0%) | 0 (0.0%) |
| Educational Services | 0 (0.0%) | 6 (100.0%) |
| Health Care & Social Assistance | 0 (0.0%) | 16 (100.0%) |
| Arts, Entertainment & Recreation | 0 (0.0%) | 0 (0.0%) |
| Accommodation & Food Services | 0 (0.0%) | 3 (100.0%) |
| Public Administration | 6 (40.0%) | 9 (60.0%) |
| Total | 95 (63.3%) | 55 (36.7%) |
Education in Rio Oso
School Enrollment in Rio Oso
The most common levels of schooling among the 132 students in Rio Oso are elementary school (44 | 33.3%), high school (40 | 30.3%), and middle school (18 | 13.6%).
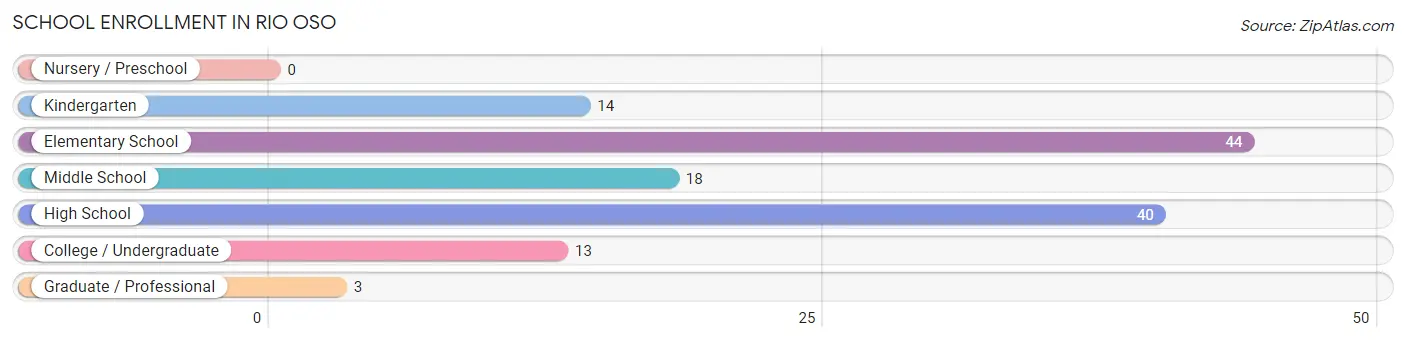
| School Level | # Students | % Students |
| Nursery / Preschool | 0 | 0.0% |
| Kindergarten | 14 | 10.6% |
| Elementary School | 44 | 33.3% |
| Middle School | 18 | 13.6% |
| High School | 40 | 30.3% |
| College / Undergraduate | 13 | 9.9% |
| Graduate / Professional | 3 | 2.3% |
| Total | 132 | 100.0% |
School Enrollment by Age by Funding Source in Rio Oso
Out of a total of 132 students who are enrolled in schools in Rio Oso, 15 (11.4%) attend a private institution, while the remaining 117 (88.6%) are enrolled in public schools. The age group of 20 to 24 year olds has the highest likelihood of being enrolled in private schools, with 6 (100.0% in the age bracket) enrolled. Conversely, the age group of 5 to 9 year old has the lowest likelihood of being enrolled in a private school, with 27 (100.0% in the age bracket) attending a public institution.
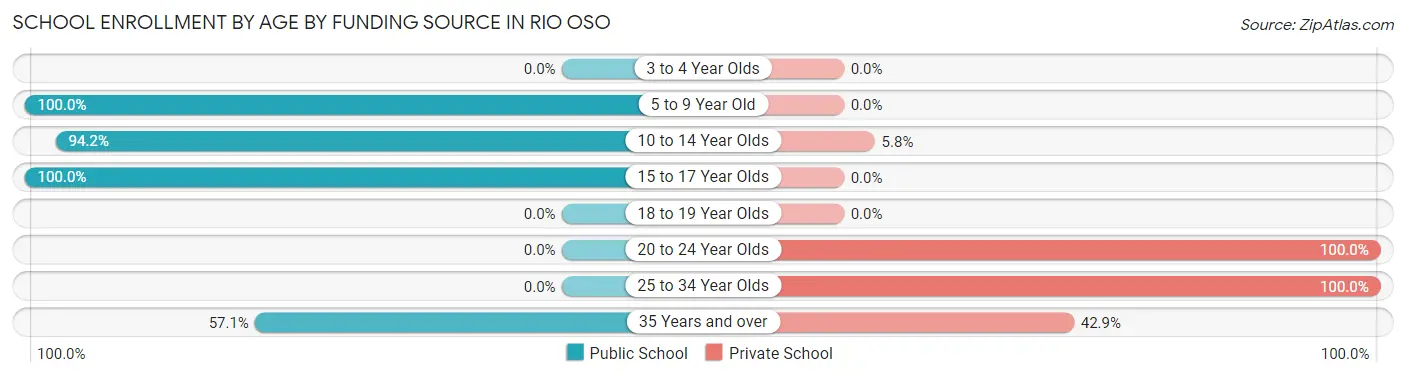
| Age Bracket | Public School | Private School |
| 3 to 4 Year Olds | 0 (0.0%) | 0 (0.0%) |
| 5 to 9 Year Old | 27 (100.0%) | 0 (0.0%) |
| 10 to 14 Year Olds | 49 (94.2%) | 3 (5.8%) |
| 15 to 17 Year Olds | 37 (100.0%) | 0 (0.0%) |
| 18 to 19 Year Olds | 0 (0.0%) | 0 (0.0%) |
| 20 to 24 Year Olds | 0 (0.0%) | 6 (100.0%) |
| 25 to 34 Year Olds | 0 (0.0%) | 3 (100.0%) |
| 35 Years and over | 4 (57.1%) | 3 (42.9%) |
| Total | 117 (88.6%) | 15 (11.4%) |
Educational Attainment by Field of Study in Rio Oso
Bio, nature & agricultural (11 | 17.7%), arts & humanities (10 | 16.1%), social sciences (9 | 14.5%), computers & mathematics (6 | 9.7%), and psychology (5 | 8.1%) are the most common fields of study among 62 individuals in Rio Oso who have obtained a bachelor's degree or higher.
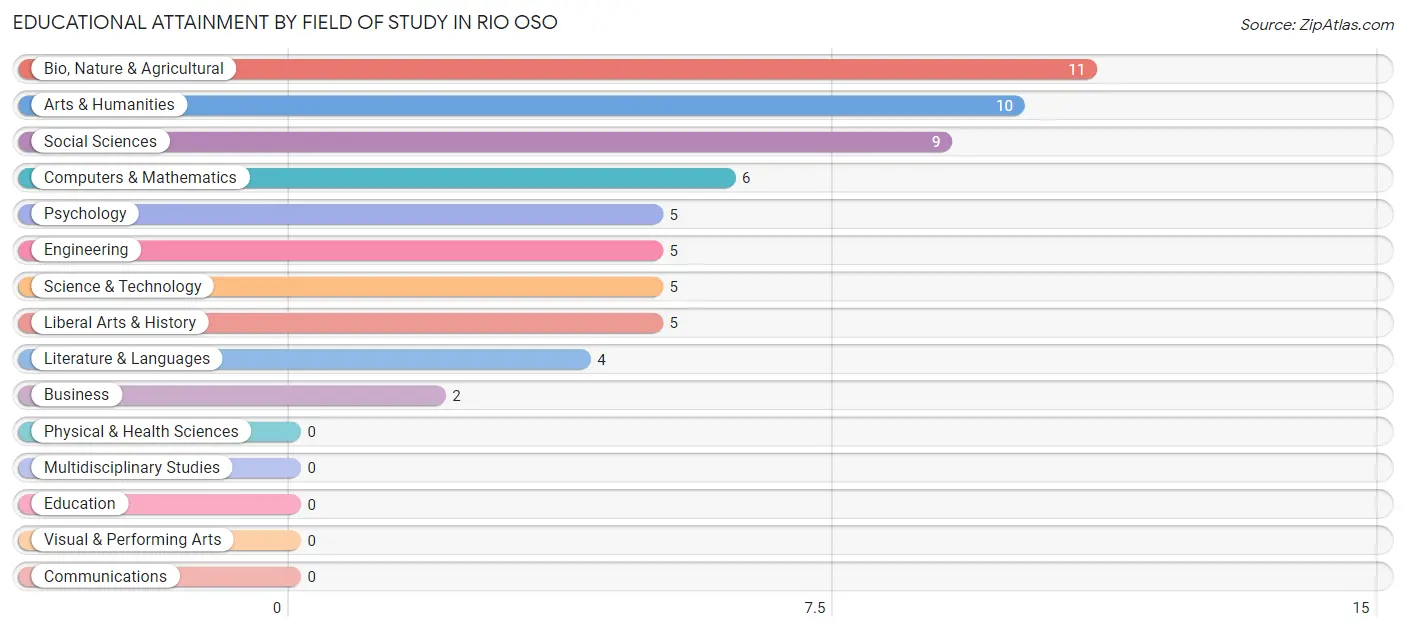
| Field of Study | # Graduates | % Graduates |
| Computers & Mathematics | 6 | 9.7% |
| Bio, Nature & Agricultural | 11 | 17.7% |
| Physical & Health Sciences | 0 | 0.0% |
| Psychology | 5 | 8.1% |
| Social Sciences | 9 | 14.5% |
| Engineering | 5 | 8.1% |
| Multidisciplinary Studies | 0 | 0.0% |
| Science & Technology | 5 | 8.1% |
| Business | 2 | 3.2% |
| Education | 0 | 0.0% |
| Literature & Languages | 4 | 6.5% |
| Liberal Arts & History | 5 | 8.1% |
| Visual & Performing Arts | 0 | 0.0% |
| Communications | 0 | 0.0% |
| Arts & Humanities | 10 | 16.1% |
| Total | 62 | 100.0% |
Transportation & Commute in Rio Oso
Vehicle Availability by Sex in Rio Oso
The most prevalent vehicle ownership categories in Rio Oso are males with 5 or more vehicles (43, accounting for 45.3%) and females with 5 or more vehicles (6, making up 82.7%).
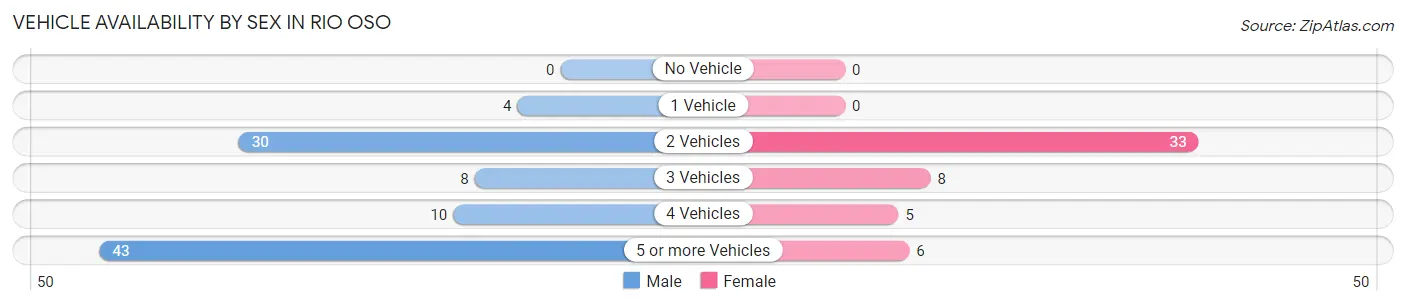
| Vehicles Available | Male | Female |
| No Vehicle | 0 (0.0%) | 0 (0.0%) |
| 1 Vehicle | 4 (4.2%) | 0 (0.0%) |
| 2 Vehicles | 30 (31.6%) | 33 (63.5%) |
| 3 Vehicles | 8 (8.4%) | 8 (15.4%) |
| 4 Vehicles | 10 (10.5%) | 5 (9.6%) |
| 5 or more Vehicles | 43 (45.3%) | 6 (11.5%) |
| Total | 95 (100.0%) | 52 (100.0%) |
Commute Time in Rio Oso
The most frequently occuring commute durations in Rio Oso are 30 to 34 minutes (38 commuters, 28.8%), 45 to 59 minutes (20 commuters, 15.1%), and 20 to 24 minutes (18 commuters, 13.6%).
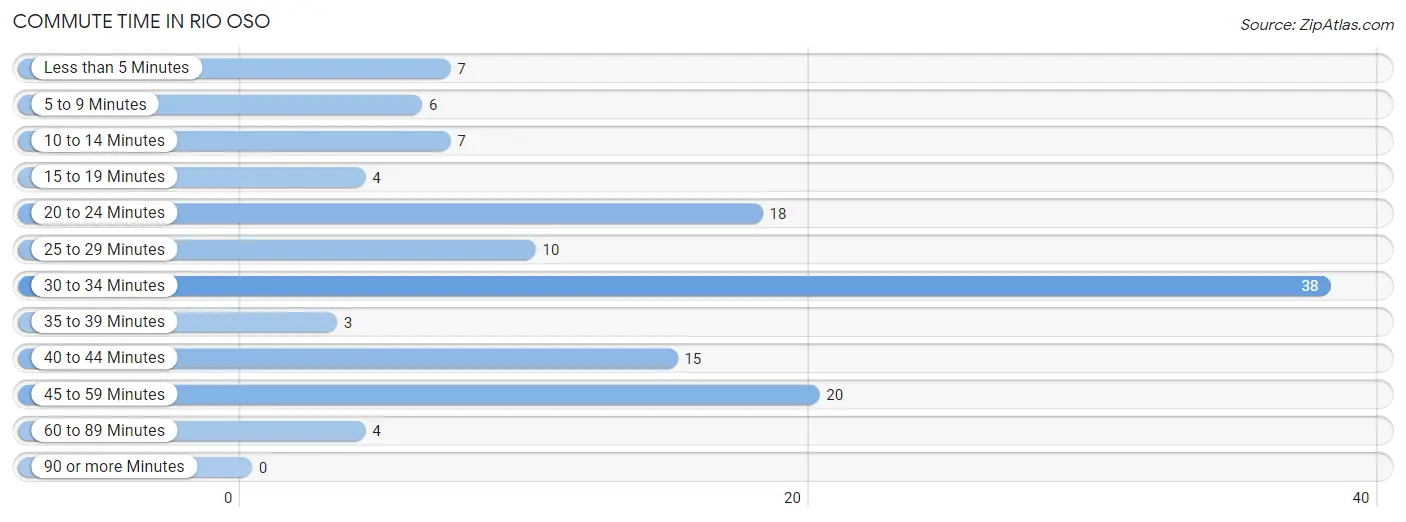
| Commute Time | # Commuters | % Commuters |
| Less than 5 Minutes | 7 | 5.3% |
| 5 to 9 Minutes | 6 | 4.5% |
| 10 to 14 Minutes | 7 | 5.3% |
| 15 to 19 Minutes | 4 | 3.0% |
| 20 to 24 Minutes | 18 | 13.6% |
| 25 to 29 Minutes | 10 | 7.6% |
| 30 to 34 Minutes | 38 | 28.8% |
| 35 to 39 Minutes | 3 | 2.3% |
| 40 to 44 Minutes | 15 | 11.4% |
| 45 to 59 Minutes | 20 | 15.1% |
| 60 to 89 Minutes | 4 | 3.0% |
| 90 or more Minutes | 0 | 0.0% |
Commute Time by Sex in Rio Oso
The most common commute times in Rio Oso are 30 to 34 minutes (37 commuters, 41.6%) for males and 45 to 59 minutes (14 commuters, 32.6%) for females.
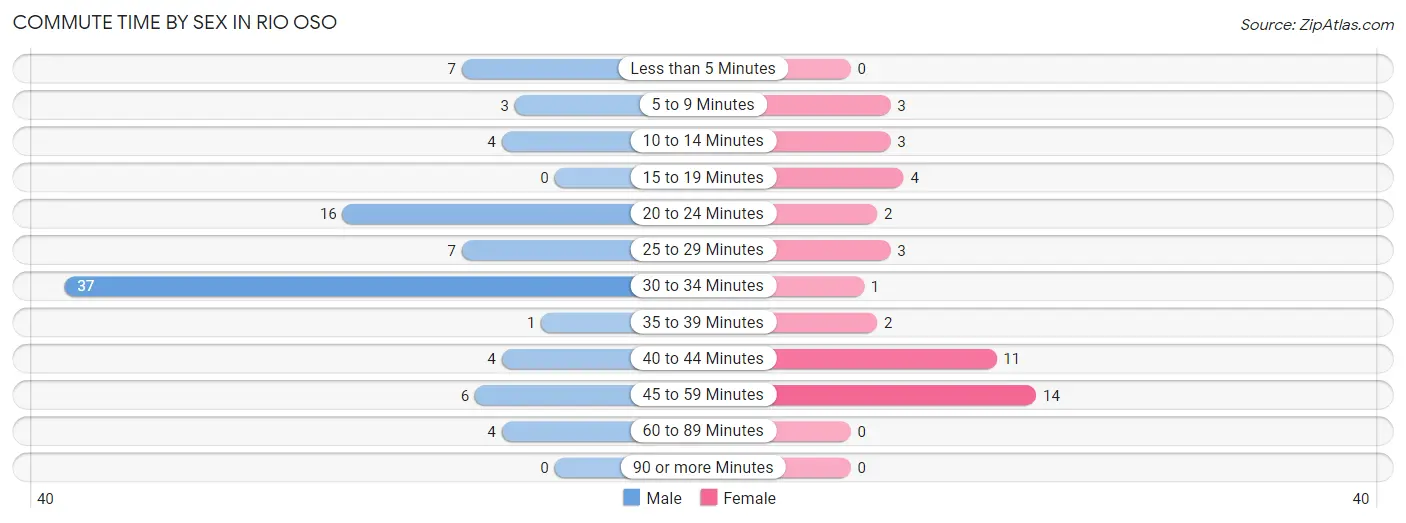
| Commute Time | Male | Female |
| Less than 5 Minutes | 7 (7.9%) | 0 (0.0%) |
| 5 to 9 Minutes | 3 (3.4%) | 3 (7.0%) |
| 10 to 14 Minutes | 4 (4.5%) | 3 (7.0%) |
| 15 to 19 Minutes | 0 (0.0%) | 4 (9.3%) |
| 20 to 24 Minutes | 16 (18.0%) | 2 (4.6%) |
| 25 to 29 Minutes | 7 (7.9%) | 3 (7.0%) |
| 30 to 34 Minutes | 37 (41.6%) | 1 (2.3%) |
| 35 to 39 Minutes | 1 (1.1%) | 2 (4.6%) |
| 40 to 44 Minutes | 4 (4.5%) | 11 (25.6%) |
| 45 to 59 Minutes | 6 (6.7%) | 14 (32.6%) |
| 60 to 89 Minutes | 4 (4.5%) | 0 (0.0%) |
| 90 or more Minutes | 0 (0.0%) | 0 (0.0%) |
Time of Departure to Work by Sex in Rio Oso
The most frequent times of departure to work in Rio Oso are 6:30 AM to 6:59 AM (45, 50.6%) for males and 7:00 AM to 7:29 AM (19, 44.2%) for females.
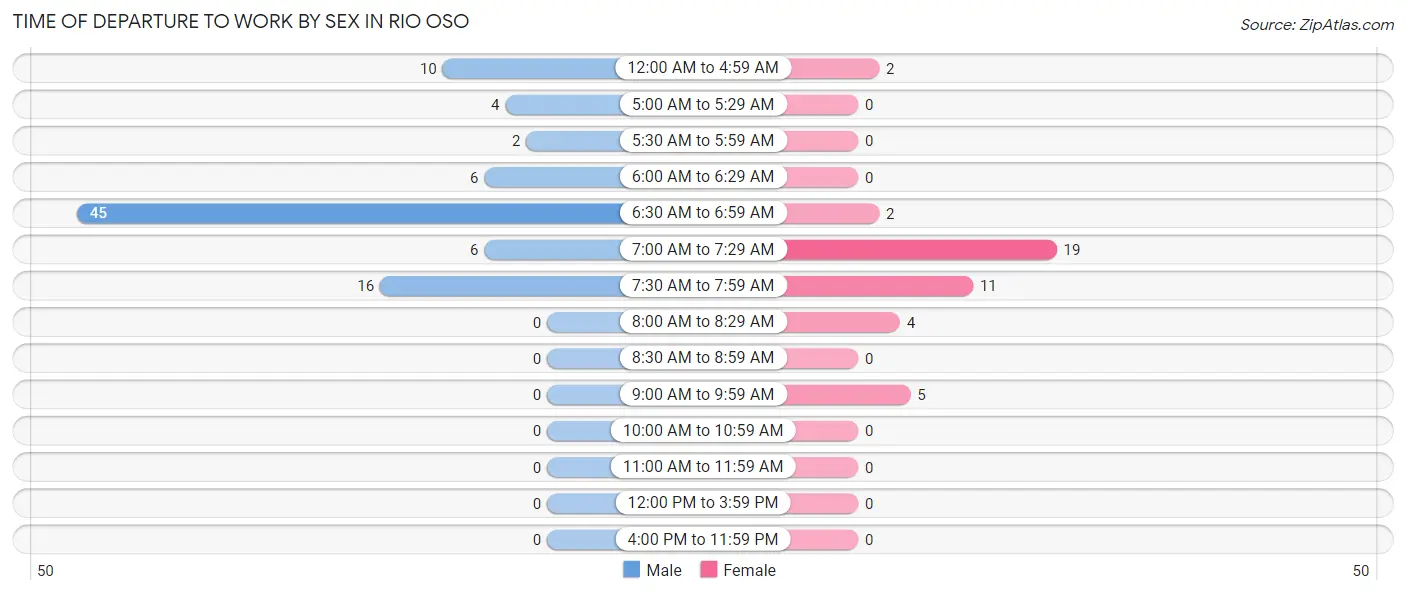
| Time of Departure | Male | Female |
| 12:00 AM to 4:59 AM | 10 (11.2%) | 2 (4.6%) |
| 5:00 AM to 5:29 AM | 4 (4.5%) | 0 (0.0%) |
| 5:30 AM to 5:59 AM | 2 (2.2%) | 0 (0.0%) |
| 6:00 AM to 6:29 AM | 6 (6.7%) | 0 (0.0%) |
| 6:30 AM to 6:59 AM | 45 (50.6%) | 2 (4.6%) |
| 7:00 AM to 7:29 AM | 6 (6.7%) | 19 (44.2%) |
| 7:30 AM to 7:59 AM | 16 (18.0%) | 11 (25.6%) |
| 8:00 AM to 8:29 AM | 0 (0.0%) | 4 (9.3%) |
| 8:30 AM to 8:59 AM | 0 (0.0%) | 0 (0.0%) |
| 9:00 AM to 9:59 AM | 0 (0.0%) | 5 (11.6%) |
| 10:00 AM to 10:59 AM | 0 (0.0%) | 0 (0.0%) |
| 11:00 AM to 11:59 AM | 0 (0.0%) | 0 (0.0%) |
| 12:00 PM to 3:59 PM | 0 (0.0%) | 0 (0.0%) |
| 4:00 PM to 11:59 PM | 0 (0.0%) | 0 (0.0%) |
| Total | 89 (100.0%) | 43 (100.0%) |
Housing Occupancy in Rio Oso
Occupancy by Ownership in Rio Oso
Of the total 111 dwellings in Rio Oso, owner-occupied units account for 92 (82.9%), while renter-occupied units make up 19 (17.1%).
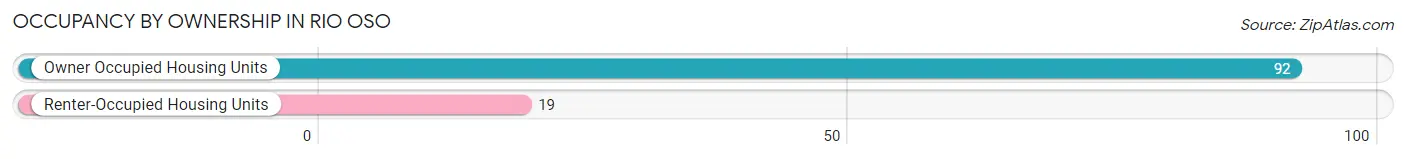
| Occupancy | # Housing Units | % Housing Units |
| Owner Occupied Housing Units | 92 | 82.9% |
| Renter-Occupied Housing Units | 19 | 17.1% |
| Total Occupied Housing Units | 111 | 100.0% |
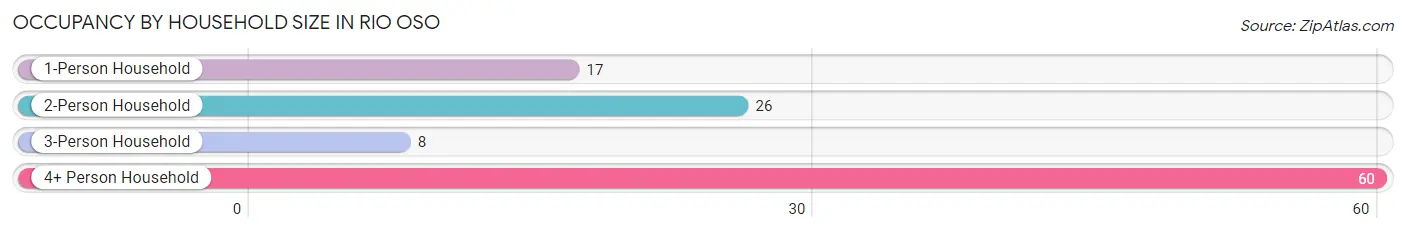
Occupancy by Household Size in Rio Oso
| Household Size | # Housing Units | % Housing Units |
| 1-Person Household | 17 | 15.3% |
| 2-Person Household | 26 | 23.4% |
| 3-Person Household | 8 | 7.2% |
| 4+ Person Household | 60 | 54.0% |
| Total Housing Units | 111 | 100.0% |
Occupancy by Ownership by Household Size in Rio Oso
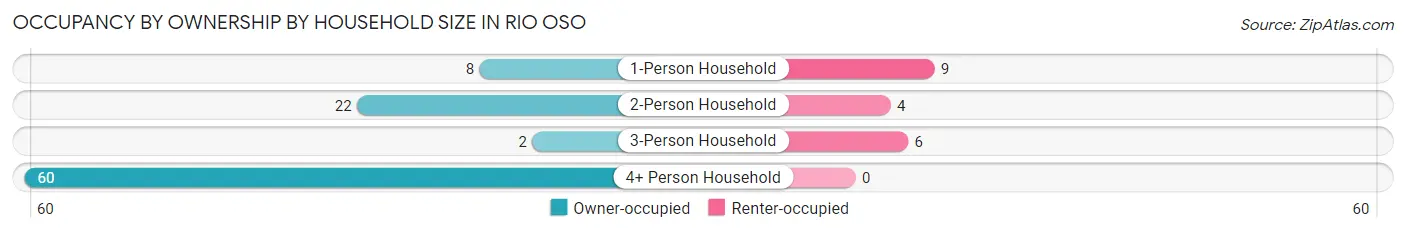
| Household Size | Owner-occupied | Renter-occupied |
| 1-Person Household | 8 (47.1%) | 9 (52.9%) |
| 2-Person Household | 22 (84.6%) | 4 (15.4%) |
| 3-Person Household | 2 (25.0%) | 6 (75.0%) |
| 4+ Person Household | 60 (100.0%) | 0 (0.0%) |
| Total Housing Units | 92 (82.9%) | 19 (17.1%) |
Occupancy by Educational Attainment in Rio Oso
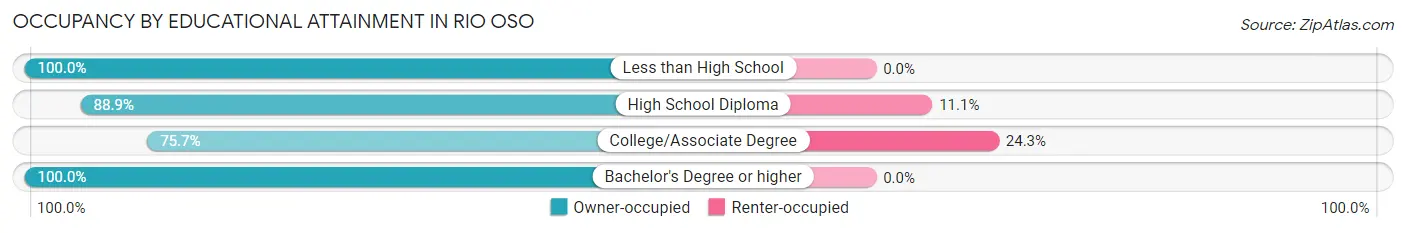
| Household Size | Owner-occupied | Renter-occupied |
| Less than High School | 10 (100.0%) | 0 (0.0%) |
| High School Diploma | 8 (88.9%) | 1 (11.1%) |
| College/Associate Degree | 56 (75.7%) | 18 (24.3%) |
| Bachelor's Degree or higher | 18 (100.0%) | 0 (0.0%) |
Occupancy by Age of Householder in Rio Oso
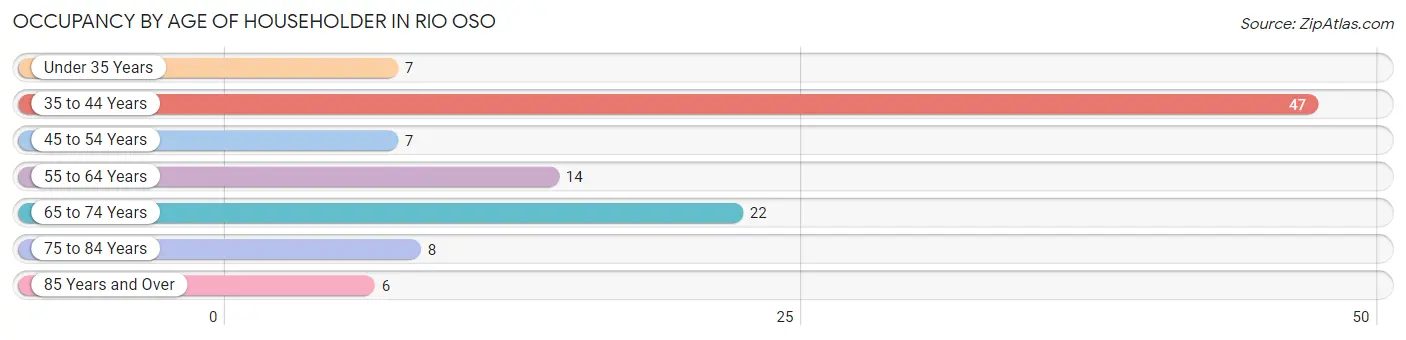
| Age Bracket | # Households | % Households |
| Under 35 Years | 7 | 6.3% |
| 35 to 44 Years | 47 | 42.3% |
| 45 to 54 Years | 7 | 6.3% |
| 55 to 64 Years | 14 | 12.6% |
| 65 to 74 Years | 22 | 19.8% |
| 75 to 84 Years | 8 | 7.2% |
| 85 Years and Over | 6 | 5.4% |
| Total | 111 | 100.0% |
Housing Finances in Rio Oso
Median Income by Occupancy in Rio Oso
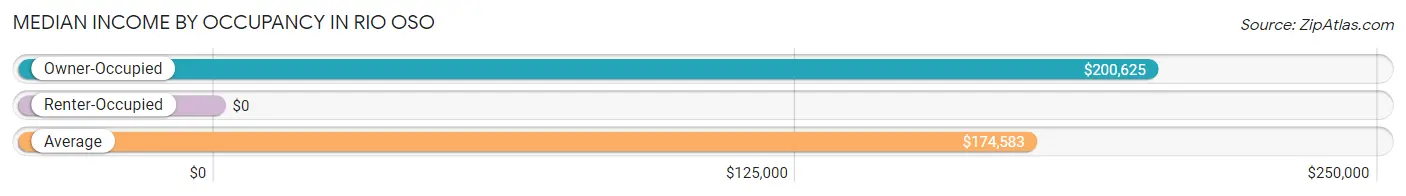
| Occupancy Type | # Households | Median Income |
| Owner-Occupied | 92 (82.9%) | $200,625 |
| Renter-Occupied | 19 (17.1%) | $0 |
| Average | 111 (100.0%) | $174,583 |
Occupancy by Householder Income Bracket in Rio Oso
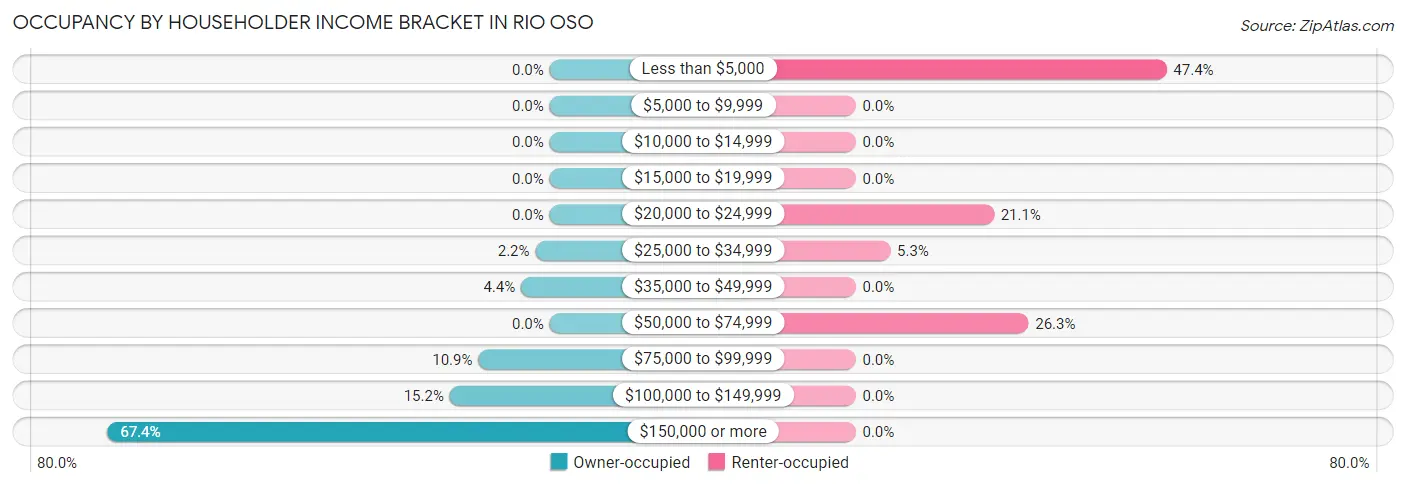
| Income Bracket | Owner-occupied | Renter-occupied |
| Less than $5,000 | 0 (0.0%) | 9 (47.4%) |
| $5,000 to $9,999 | 0 (0.0%) | 0 (0.0%) |
| $10,000 to $14,999 | 0 (0.0%) | 0 (0.0%) |
| $15,000 to $19,999 | 0 (0.0%) | 0 (0.0%) |
| $20,000 to $24,999 | 0 (0.0%) | 4 (21.0%) |
| $25,000 to $34,999 | 2 (2.2%) | 1 (5.3%) |
| $35,000 to $49,999 | 4 (4.3%) | 0 (0.0%) |
| $50,000 to $74,999 | 0 (0.0%) | 5 (26.3%) |
| $75,000 to $99,999 | 10 (10.9%) | 0 (0.0%) |
| $100,000 to $149,999 | 14 (15.2%) | 0 (0.0%) |
| $150,000 or more | 62 (67.4%) | 0 (0.0%) |
| Total | 92 (100.0%) | 19 (100.0%) |
Monthly Housing Cost Tiers in Rio Oso
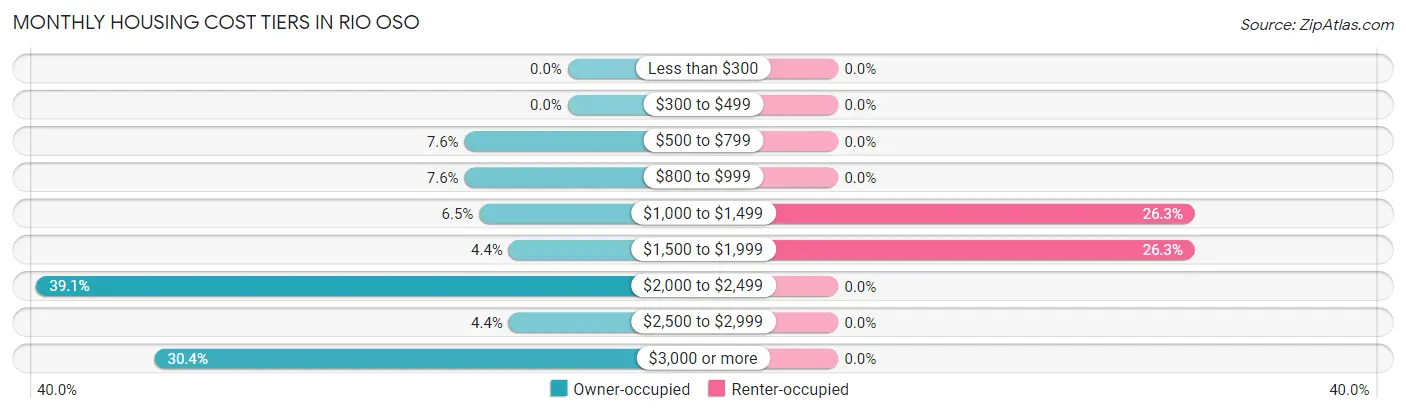
| Monthly Cost | Owner-occupied | Renter-occupied |
| Less than $300 | 0 (0.0%) | 0 (0.0%) |
| $300 to $499 | 0 (0.0%) | 0 (0.0%) |
| $500 to $799 | 7 (7.6%) | 0 (0.0%) |
| $800 to $999 | 7 (7.6%) | 0 (0.0%) |
| $1,000 to $1,499 | 6 (6.5%) | 5 (26.3%) |
| $1,500 to $1,999 | 4 (4.3%) | 5 (26.3%) |
| $2,000 to $2,499 | 36 (39.1%) | 0 (0.0%) |
| $2,500 to $2,999 | 4 (4.3%) | 0 (0.0%) |
| $3,000 or more | 28 (30.4%) | 0 (0.0%) |
| Total | 92 (100.0%) | 19 (100.0%) |
Physical Housing Characteristics in Rio Oso
Housing Structures in Rio Oso
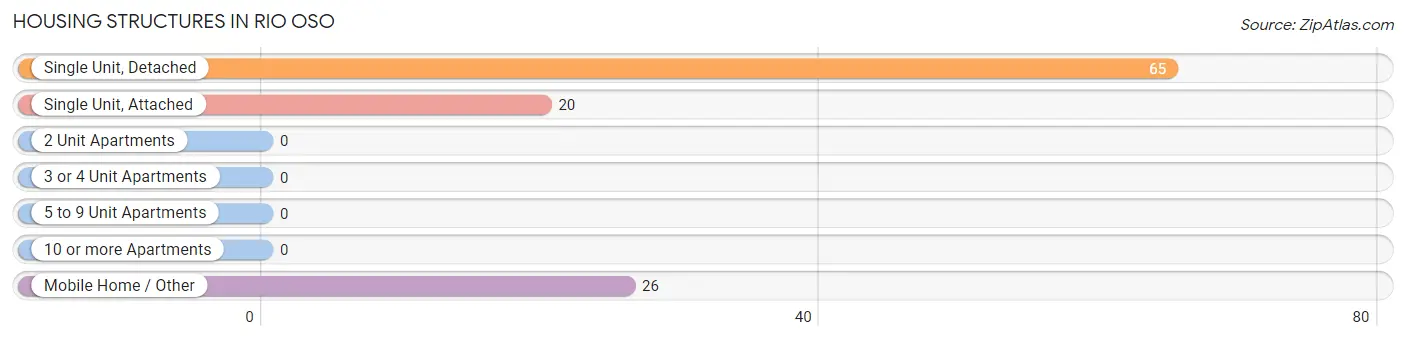
| Structure Type | # Housing Units | % Housing Units |
| Single Unit, Detached | 65 | 58.6% |
| Single Unit, Attached | 20 | 18.0% |
| 2 Unit Apartments | 0 | 0.0% |
| 3 or 4 Unit Apartments | 0 | 0.0% |
| 5 to 9 Unit Apartments | 0 | 0.0% |
| 10 or more Apartments | 0 | 0.0% |
| Mobile Home / Other | 26 | 23.4% |
| Total | 111 | 100.0% |
Housing Structures by Occupancy in Rio Oso
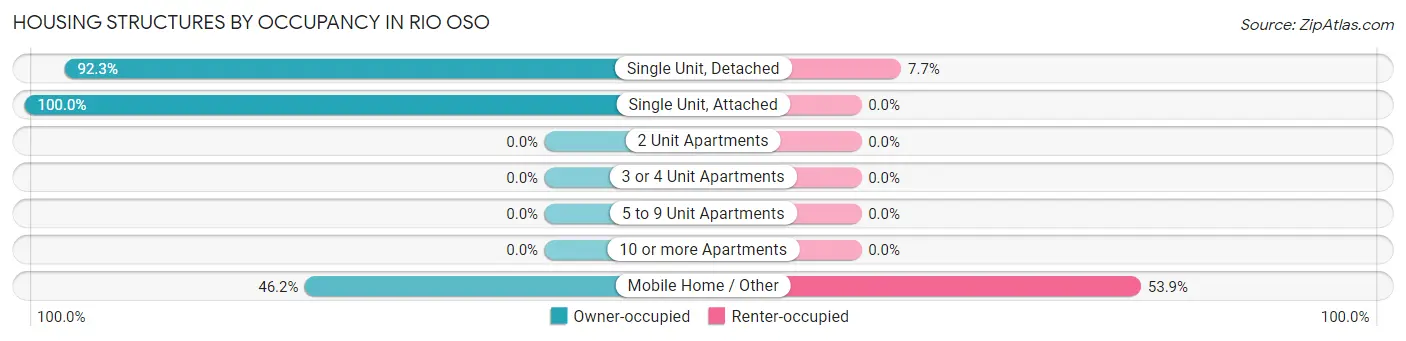
| Structure Type | Owner-occupied | Renter-occupied |
| Single Unit, Detached | 60 (92.3%) | 5 (7.7%) |
| Single Unit, Attached | 20 (100.0%) | 0 (0.0%) |
| 2 Unit Apartments | 0 (0.0%) | 0 (0.0%) |
| 3 or 4 Unit Apartments | 0 (0.0%) | 0 (0.0%) |
| 5 to 9 Unit Apartments | 0 (0.0%) | 0 (0.0%) |
| 10 or more Apartments | 0 (0.0%) | 0 (0.0%) |
| Mobile Home / Other | 12 (46.2%) | 14 (53.8%) |
| Total | 92 (82.9%) | 19 (17.1%) |
Housing Structures by Number of Rooms in Rio Oso
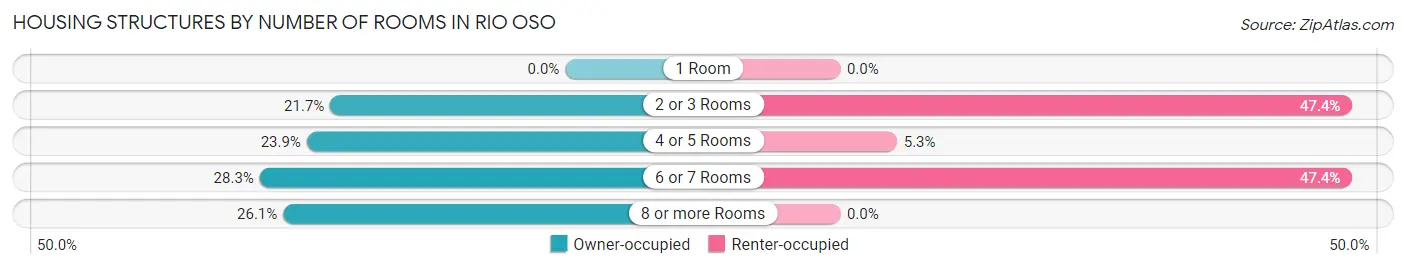
| Number of Rooms | Owner-occupied | Renter-occupied |
| 1 Room | 0 (0.0%) | 0 (0.0%) |
| 2 or 3 Rooms | 20 (21.7%) | 9 (47.4%) |
| 4 or 5 Rooms | 22 (23.9%) | 1 (5.3%) |
| 6 or 7 Rooms | 26 (28.3%) | 9 (47.4%) |
| 8 or more Rooms | 24 (26.1%) | 0 (0.0%) |
| Total | 92 (100.0%) | 19 (100.0%) |
Housing Structure by Heating Type in Rio Oso
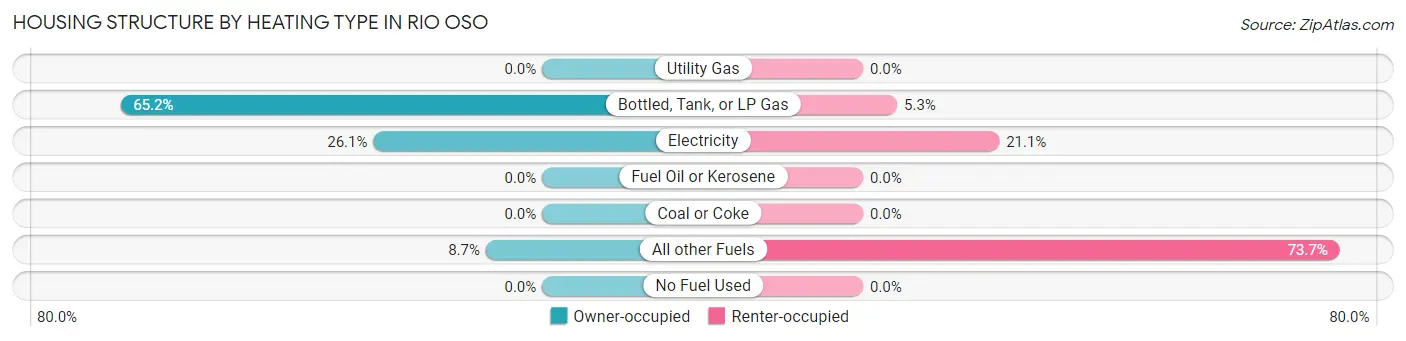
| Heating Type | Owner-occupied | Renter-occupied |
| Utility Gas | 0 (0.0%) | 0 (0.0%) |
| Bottled, Tank, or LP Gas | 60 (65.2%) | 1 (5.3%) |
| Electricity | 24 (26.1%) | 4 (21.0%) |
| Fuel Oil or Kerosene | 0 (0.0%) | 0 (0.0%) |
| Coal or Coke | 0 (0.0%) | 0 (0.0%) |
| All other Fuels | 8 (8.7%) | 14 (73.7%) |
| No Fuel Used | 0 (0.0%) | 0 (0.0%) |
| Total | 92 (100.0%) | 19 (100.0%) |
Household Vehicle Usage in Rio Oso
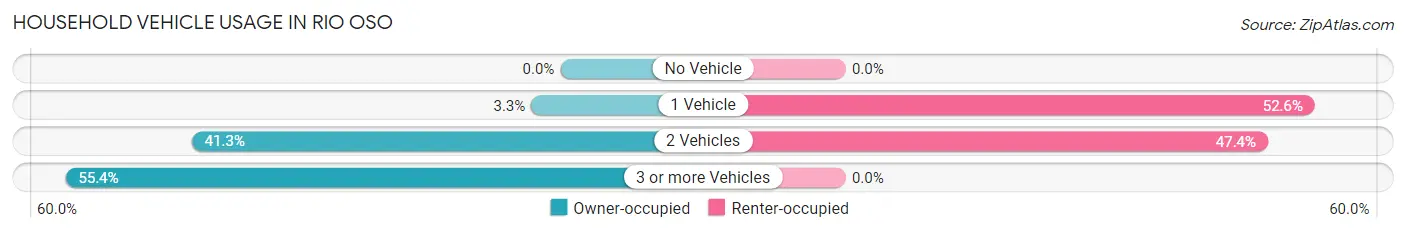
| Vehicles per Household | Owner-occupied | Renter-occupied |
| No Vehicle | 0 (0.0%) | 0 (0.0%) |
| 1 Vehicle | 3 (3.3%) | 10 (52.6%) |
| 2 Vehicles | 38 (41.3%) | 9 (47.4%) |
| 3 or more Vehicles | 51 (55.4%) | 0 (0.0%) |
| Total | 92 (100.0%) | 19 (100.0%) |
Real Estate & Mortgages in Rio Oso
Real Estate and Mortgage Overview in Rio Oso
| Characteristic | Without Mortgage | With Mortgage |
| Housing Units | 19 | 73 |
| Median Property Value | $562,500 | $483,300 |
| Median Household Income | $84,688 | $57 |
| Monthly Housing Costs | $863 | $28 |
| Real Estate Taxes | - | - |
Property Value by Mortgage Status in Rio Oso
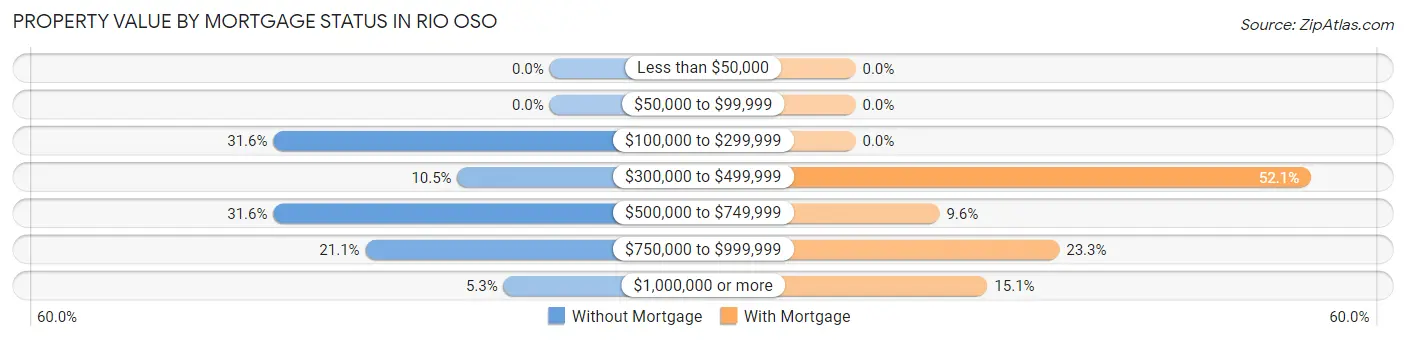
| Property Value | Without Mortgage | With Mortgage |
| Less than $50,000 | 0 (0.0%) | 0 (0.0%) |
| $50,000 to $99,999 | 0 (0.0%) | 0 (0.0%) |
| $100,000 to $299,999 | 6 (31.6%) | 0 (0.0%) |
| $300,000 to $499,999 | 2 (10.5%) | 38 (52.0%) |
| $500,000 to $749,999 | 6 (31.6%) | 7 (9.6%) |
| $750,000 to $999,999 | 4 (21.0%) | 17 (23.3%) |
| $1,000,000 or more | 1 (5.3%) | 11 (15.1%) |
| Total | 19 (100.0%) | 73 (100.0%) |
Household Income by Mortgage Status in Rio Oso
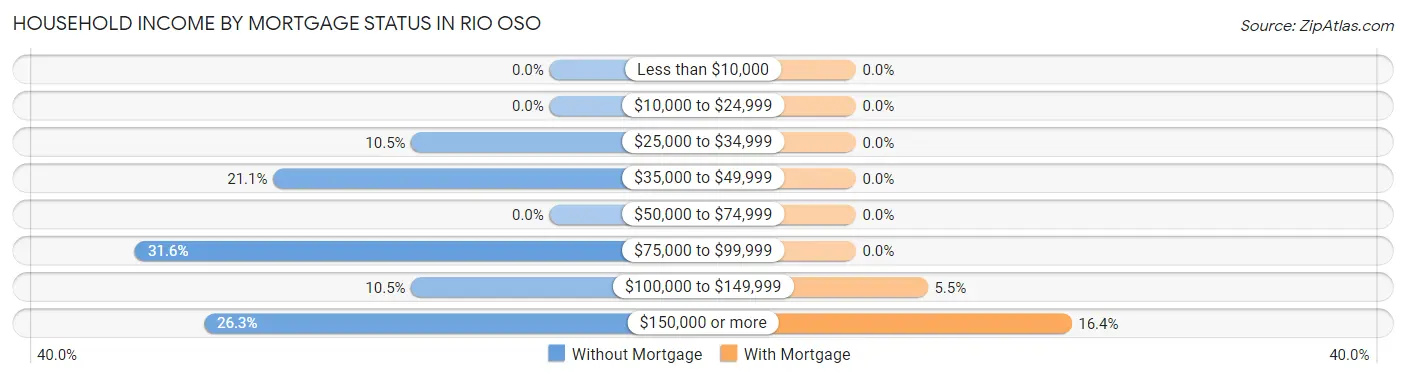
| Household Income | Without Mortgage | With Mortgage |
| Less than $10,000 | 0 (0.0%) | 0 (0.0%) |
| $10,000 to $24,999 | 0 (0.0%) | 0 (0.0%) |
| $25,000 to $34,999 | 2 (10.5%) | 0 (0.0%) |
| $35,000 to $49,999 | 4 (21.0%) | 0 (0.0%) |
| $50,000 to $74,999 | 0 (0.0%) | 0 (0.0%) |
| $75,000 to $99,999 | 6 (31.6%) | 0 (0.0%) |
| $100,000 to $149,999 | 2 (10.5%) | 4 (5.5%) |
| $150,000 or more | 5 (26.3%) | 12 (16.4%) |
| Total | 19 (100.0%) | 73 (100.0%) |
Property Value to Household Income Ratio in Rio Oso
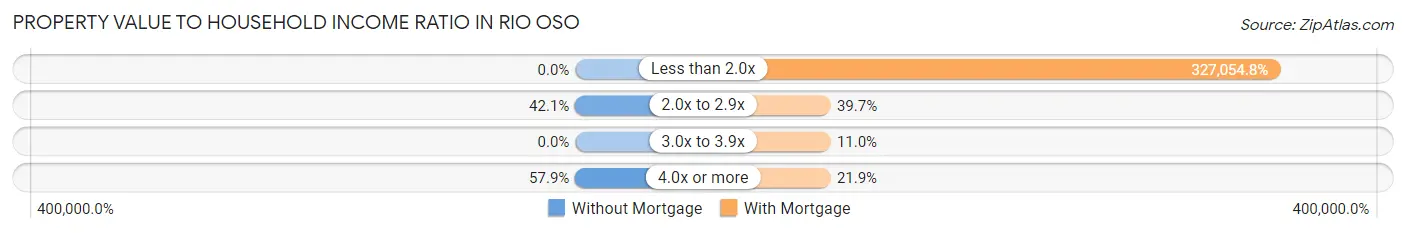
| Value-to-Income Ratio | Without Mortgage | With Mortgage |
| Less than 2.0x | 0 (0.0%) | 238,750 (327,054.8%) |
| 2.0x to 2.9x | 8 (42.1%) | 29 (39.7%) |
| 3.0x to 3.9x | 0 (0.0%) | 8 (11.0%) |
| 4.0x or more | 11 (57.9%) | 16 (21.9%) |
| Total | 19 (100.0%) | 73 (100.0%) |
Real Estate Taxes by Mortgage Status in Rio Oso
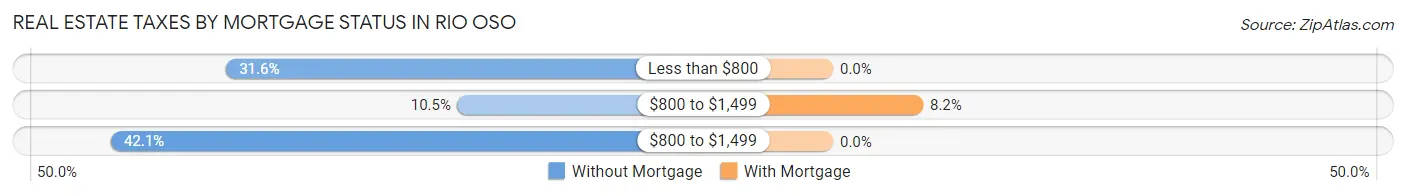
| Property Taxes | Without Mortgage | With Mortgage |
| Less than $800 | 6 (31.6%) | 0 (0.0%) |
| $800 to $1,499 | 2 (10.5%) | 6 (8.2%) |
| $800 to $1,499 | 8 (42.1%) | 0 (0.0%) |
| Total | 19 (100.0%) | 73 (100.0%) |
Health & Disability in Rio Oso
Health Insurance Coverage by Age in Rio Oso
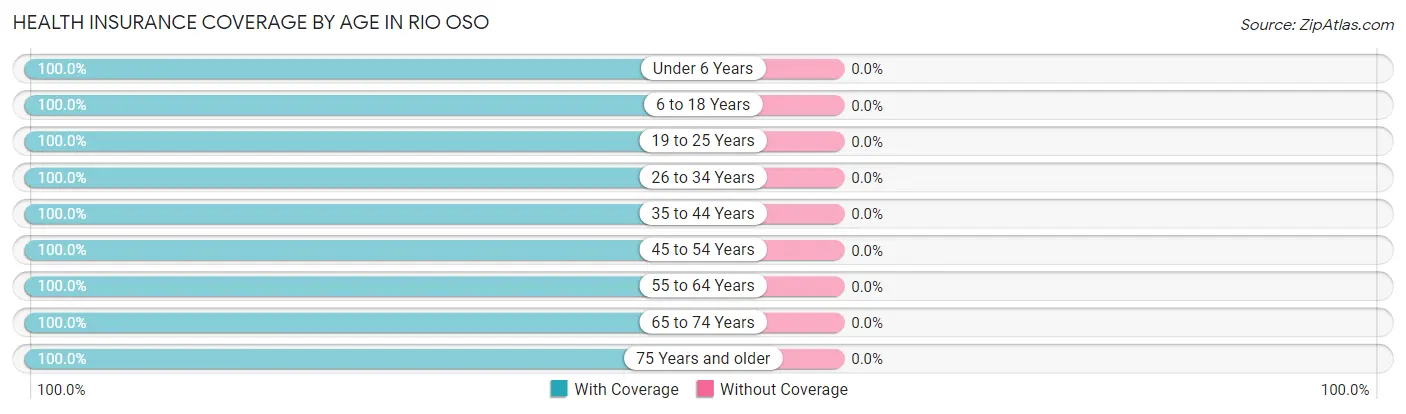
| Age Bracket | With Coverage | Without Coverage |
| Under 6 Years | 31 (100.0%) | 0 (0.0%) |
| 6 to 18 Years | 105 (100.0%) | 0 (0.0%) |
| 19 to 25 Years | 12 (100.0%) | 0 (0.0%) |
| 26 to 34 Years | 21 (100.0%) | 0 (0.0%) |
| 35 to 44 Years | 74 (100.0%) | 0 (0.0%) |
| 45 to 54 Years | 24 (100.0%) | 0 (0.0%) |
| 55 to 64 Years | 28 (100.0%) | 0 (0.0%) |
| 65 to 74 Years | 49 (100.0%) | 0 (0.0%) |
| 75 Years and older | 24 (100.0%) | 0 (0.0%) |
| Total | 368 (100.0%) | 0 (0.0%) |
Health Insurance Coverage by Citizenship Status in Rio Oso
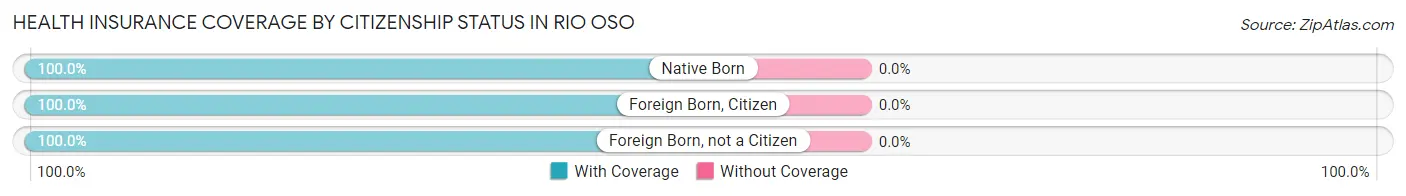
| Citizenship Status | With Coverage | Without Coverage |
| Native Born | 31 (100.0%) | 0 (0.0%) |
| Foreign Born, Citizen | 105 (100.0%) | 0 (0.0%) |
| Foreign Born, not a Citizen | 12 (100.0%) | 0 (0.0%) |
Health Insurance Coverage by Household Income in Rio Oso
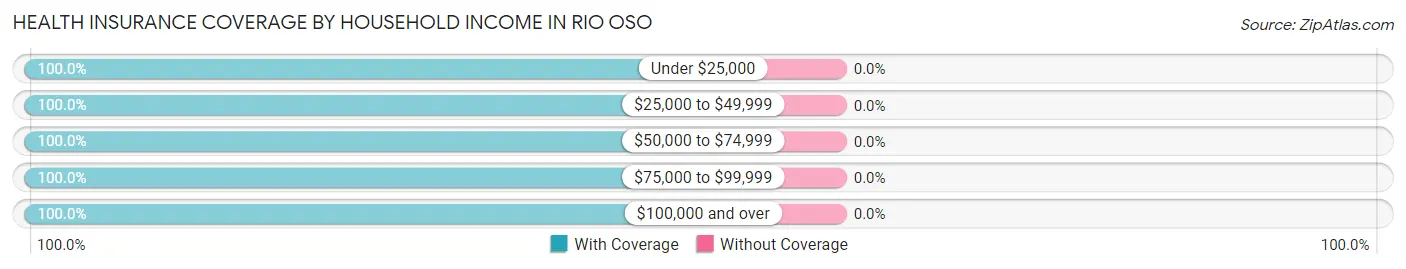
| Household Income | With Coverage | Without Coverage |
| Under $25,000 | 16 (100.0%) | 0 (0.0%) |
| $25,000 to $49,999 | 16 (100.0%) | 0 (0.0%) |
| $50,000 to $74,999 | 15 (100.0%) | 0 (0.0%) |
| $75,000 to $99,999 | 15 (100.0%) | 0 (0.0%) |
| $100,000 and over | 306 (100.0%) | 0 (0.0%) |
Public vs Private Health Insurance Coverage by Age in Rio Oso
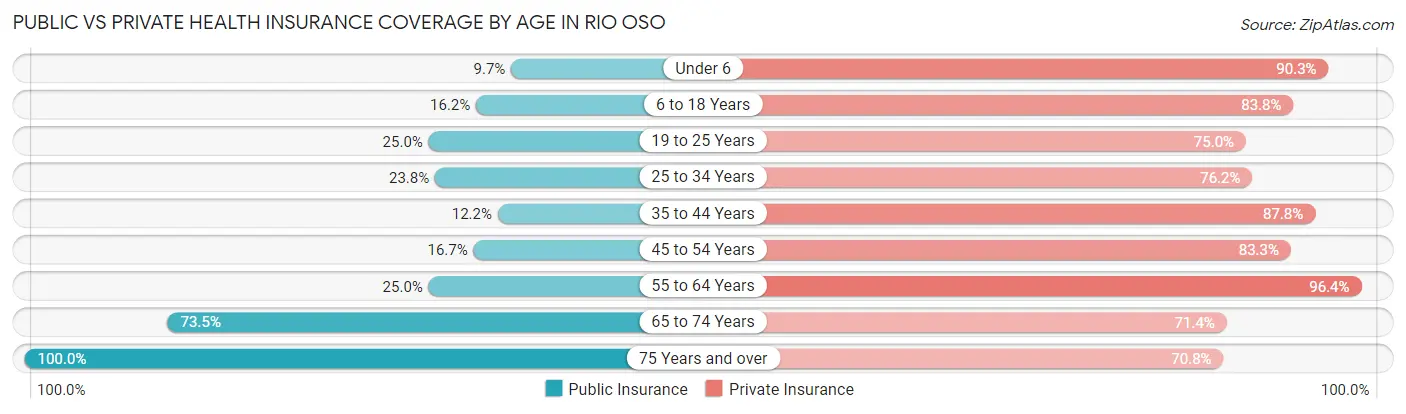
| Age Bracket | Public Insurance | Private Insurance |
| Under 6 | 3 (9.7%) | 28 (90.3%) |
| 6 to 18 Years | 17 (16.2%) | 88 (83.8%) |
| 19 to 25 Years | 3 (25.0%) | 9 (75.0%) |
| 25 to 34 Years | 5 (23.8%) | 16 (76.2%) |
| 35 to 44 Years | 9 (12.2%) | 65 (87.8%) |
| 45 to 54 Years | 4 (16.7%) | 20 (83.3%) |
| 55 to 64 Years | 7 (25.0%) | 27 (96.4%) |
| 65 to 74 Years | 36 (73.5%) | 35 (71.4%) |
| 75 Years and over | 24 (100.0%) | 17 (70.8%) |
| Total | 108 (29.3%) | 305 (82.9%) |
Disability Status by Sex by Age in Rio Oso
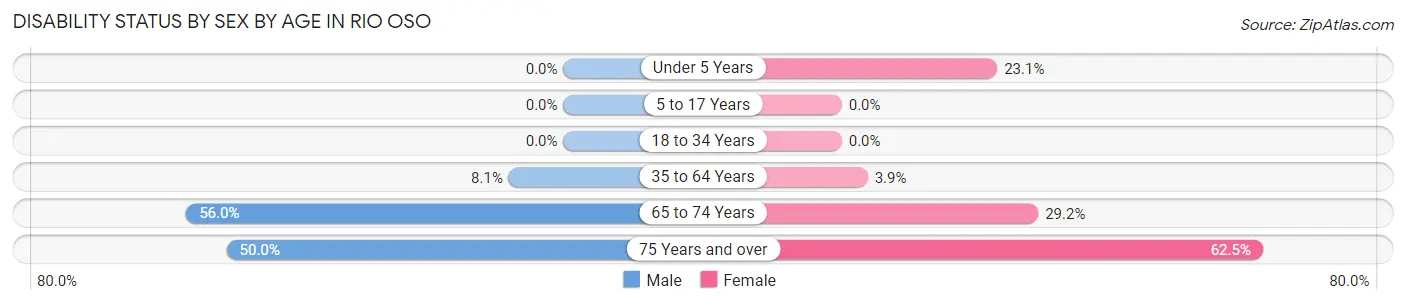
| Age Bracket | Male | Female |
| Under 5 Years | 0 (0.0%) | 3 (23.1%) |
| 5 to 17 Years | 0 (0.0%) | 0 (0.0%) |
| 18 to 34 Years | 0 (0.0%) | 0 (0.0%) |
| 35 to 64 Years | 6 (8.1%) | 2 (3.8%) |
| 65 to 74 Years | 14 (56.0%) | 7 (29.2%) |
| 75 Years and over | 8 (50.0%) | 5 (62.5%) |
Disability Class by Sex by Age in Rio Oso
Disability Class: Hearing Difficulty
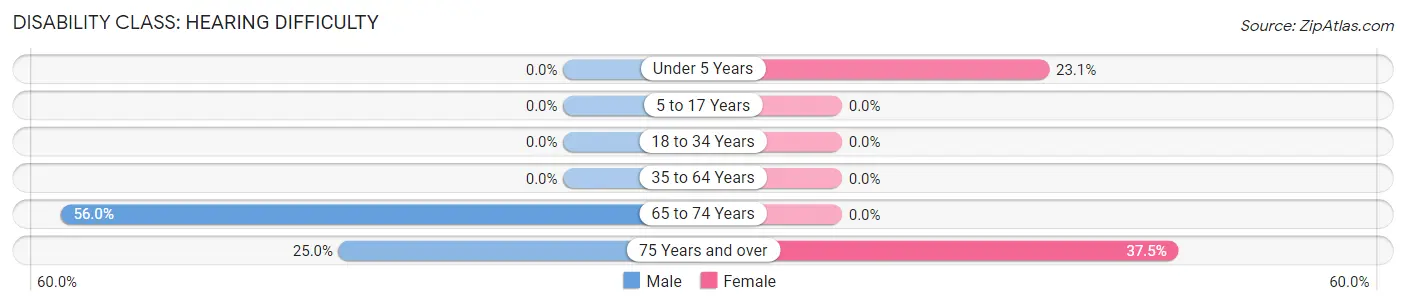
| Age Bracket | Male | Female |
| Under 5 Years | 0 (0.0%) | 3 (23.1%) |
| 5 to 17 Years | 0 (0.0%) | 0 (0.0%) |
| 18 to 34 Years | 0 (0.0%) | 0 (0.0%) |
| 35 to 64 Years | 0 (0.0%) | 0 (0.0%) |
| 65 to 74 Years | 14 (56.0%) | 0 (0.0%) |
| 75 Years and over | 4 (25.0%) | 3 (37.5%) |
Disability Class: Vision Difficulty
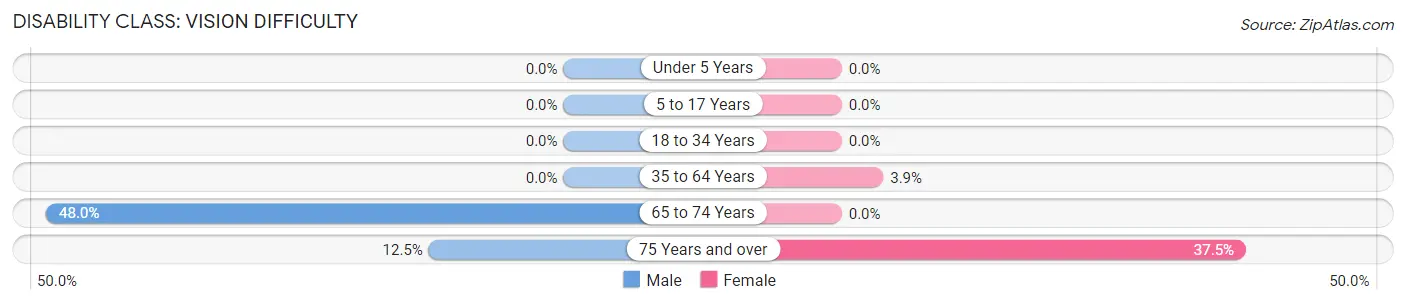
| Age Bracket | Male | Female |
| Under 5 Years | 0 (0.0%) | 0 (0.0%) |
| 5 to 17 Years | 0 (0.0%) | 0 (0.0%) |
| 18 to 34 Years | 0 (0.0%) | 0 (0.0%) |
| 35 to 64 Years | 0 (0.0%) | 2 (3.8%) |
| 65 to 74 Years | 12 (48.0%) | 0 (0.0%) |
| 75 Years and over | 2 (12.5%) | 3 (37.5%) |
Disability Class: Cognitive Difficulty
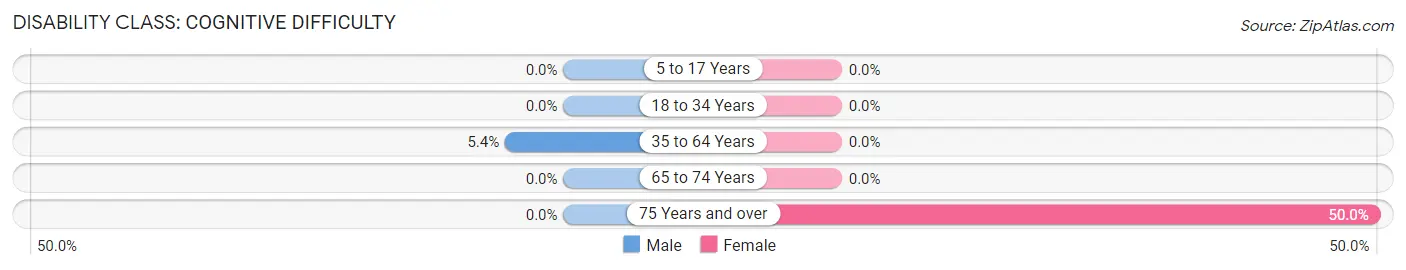
| Age Bracket | Male | Female |
| 5 to 17 Years | 0 (0.0%) | 0 (0.0%) |
| 18 to 34 Years | 0 (0.0%) | 0 (0.0%) |
| 35 to 64 Years | 4 (5.4%) | 0 (0.0%) |
| 65 to 74 Years | 0 (0.0%) | 0 (0.0%) |
| 75 Years and over | 0 (0.0%) | 4 (50.0%) |
Disability Class: Ambulatory Difficulty
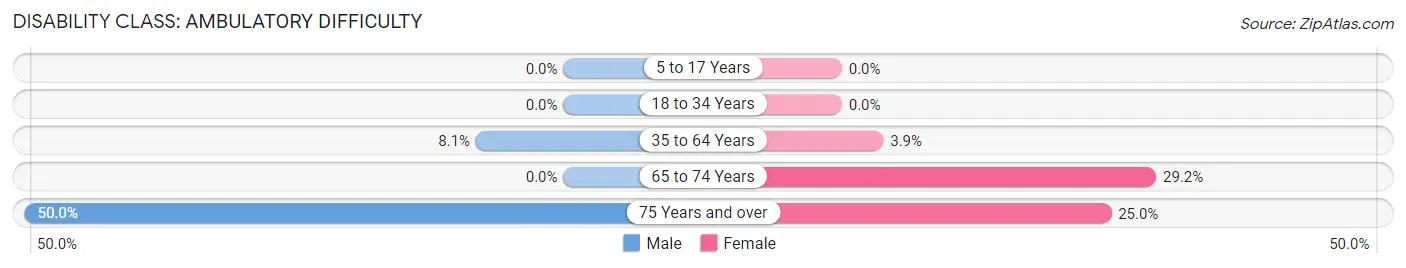
| Age Bracket | Male | Female |
| 5 to 17 Years | 0 (0.0%) | 0 (0.0%) |
| 18 to 34 Years | 0 (0.0%) | 0 (0.0%) |
| 35 to 64 Years | 6 (8.1%) | 2 (3.8%) |
| 65 to 74 Years | 0 (0.0%) | 7 (29.2%) |
| 75 Years and over | 8 (50.0%) | 2 (25.0%) |
Disability Class: Self-Care Difficulty
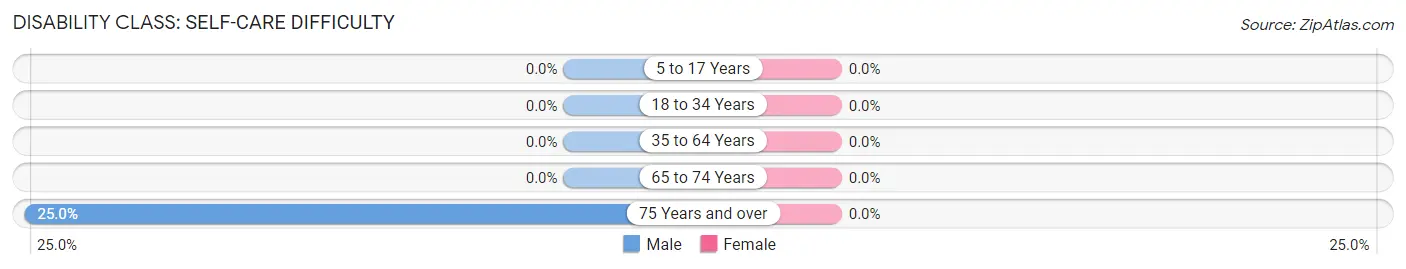
| Age Bracket | Male | Female |
| 5 to 17 Years | 0 (0.0%) | 0 (0.0%) |
| 18 to 34 Years | 0 (0.0%) | 0 (0.0%) |
| 35 to 64 Years | 0 (0.0%) | 0 (0.0%) |
| 65 to 74 Years | 0 (0.0%) | 0 (0.0%) |
| 75 Years and over | 4 (25.0%) | 0 (0.0%) |
Technology Access in Rio Oso
Computing Device Access in Rio Oso
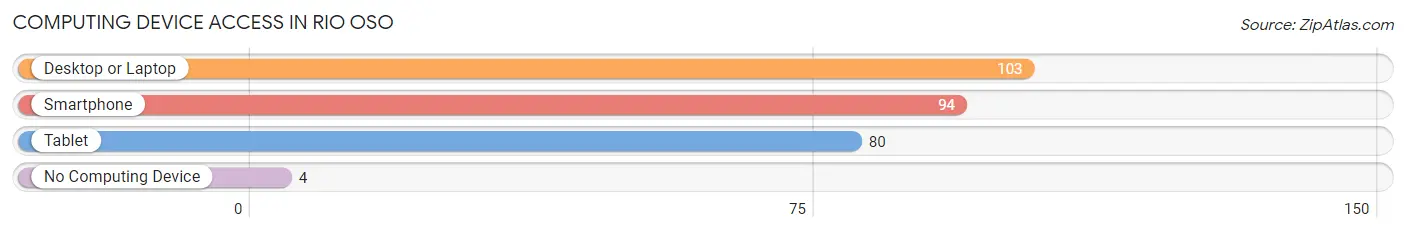
| Device Type | # Households | % Households |
| Desktop or Laptop | 103 | 92.8% |
| Smartphone | 94 | 84.7% |
| Tablet | 80 | 72.1% |
| No Computing Device | 4 | 3.6% |
| Total | 111 | 100.0% |
Internet Access in Rio Oso
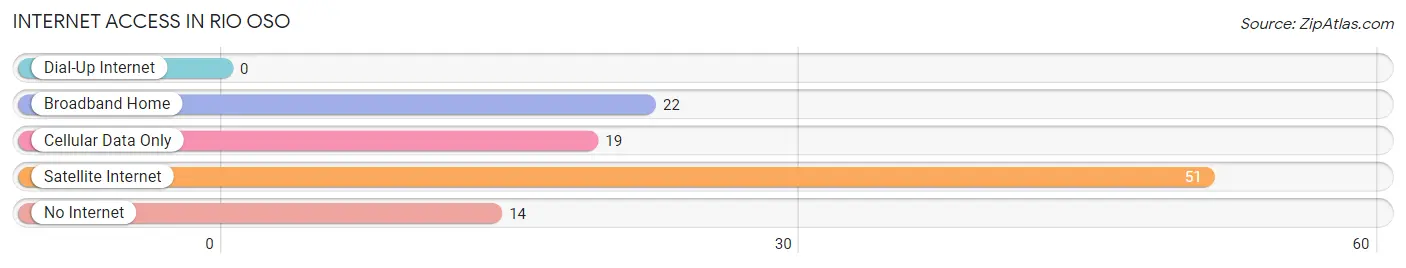
| Internet Type | # Households | % Households |
| Dial-Up Internet | 0 | 0.0% |
| Broadband Home | 22 | 19.8% |
| Cellular Data Only | 19 | 17.1% |
| Satellite Internet | 51 | 46.0% |
| No Internet | 14 | 12.6% |
| Total | 111 | 100.0% |
Rio Oso Summary
Rio Oso is a small unincorporated community located in Sutter County, California. It is situated in the Sacramento Valley, approximately 20 miles north of the city of Sacramento. The population of Rio Oso was estimated to be 1,093 in 2019.
History
Rio Oso was originally inhabited by the Maidu Native American tribe. The first European settlers arrived in the area in the mid-1800s. The town was founded in 1854 by William and Mary Ann Smith, who named it after the nearby Rio Oso Creek. The Smiths built a hotel and a store, and the town quickly grew.
In the late 1800s, the town was a major stop on the stagecoach route between Sacramento and Marysville. The town also had a post office, a blacksmith shop, and a school.
In the early 1900s, the town was a major agricultural center, with many farms and ranches in the area. The town also had a cannery, a creamery, and a lumber mill.
Geography
Rio Oso is located in the Sacramento Valley, approximately 20 miles north of the city of Sacramento. The town is situated on the banks of the Rio Oso Creek, which flows through the town and into the Feather River. The town is surrounded by rolling hills and farmland.
The climate in Rio Oso is mild and temperate, with hot summers and cool winters. The average annual temperature is around 60°F (15°C). The average annual precipitation is around 20 inches (51 cm).
Economy
The economy of Rio Oso is largely based on agriculture. The town is home to several farms and ranches, which produce a variety of crops, including wheat, corn, and hay. The town also has a few small businesses, including a gas station, a grocery store, and a restaurant.
Demographics
As of 2019, the population of Rio Oso was estimated to be 1,093. The racial makeup of the town was 94.3% White, 0.9% African American, 0.7% Native American, 0.7% Asian, 0.2% Pacific Islander, and 2.2% from other races. The median household income was $50,000, and the median age was 44.
Rio Oso is a small, rural community with a close-knit population. The town is known for its friendly atmosphere and its strong sense of community. The town is home to several churches, a volunteer fire department, and a community center. The town also hosts several annual events, including a Fourth of July parade and a Christmas tree lighting ceremony.
Common Questions
What is Per Capita Income in Rio Oso?
Per Capita income in Rio Oso is $47,931.
What is the Median Family Income in Rio Oso?
Median Family Income in Rio Oso is $174,167.
What is the Median Household income in Rio Oso?
Median Household Income in Rio Oso is $174,583.
What is Income or Wage Gap in Rio Oso?
Income or Wage Gap in Rio Oso is 53.2%.
Women in Rio Oso earn 46.8 cents for every dollar earned by a man.
What is Inequality or Gini Index in Rio Oso?
Inequality or Gini Index in Rio Oso is 0.35.
What is the Total Population of Rio Oso?
Total Population of Rio Oso is 368.
What is the Total Male Population of Rio Oso?
Total Male Population of Rio Oso is 186.
What is the Total Female Population of Rio Oso?
Total Female Population of Rio Oso is 182.
What is the Ratio of Males per 100 Females in Rio Oso?
There are 102.20 Males per 100 Females in Rio Oso.
What is the Ratio of Females per 100 Males in Rio Oso?
There are 97.85 Females per 100 Males in Rio Oso.
What is the Median Population Age in Rio Oso?
Median Population Age in Rio Oso is 36.4 Years.
What is the Average Family Size in Rio Oso
Average Family Size in Rio Oso is 3.6 People.
What is the Average Household Size in Rio Oso
Average Household Size in Rio Oso is 3.3 People.
How Large is the Labor Force in Rio Oso?
There are 154 People in the Labor Forcein in Rio Oso.
What is the Percentage of People in the Labor Force in Rio Oso?
57.9% of People are in the Labor Force in Rio Oso.
What is the Unemployment Rate in Rio Oso?
Unemployment Rate in Rio Oso is 2.6%.