Cities with the Highest Percentage of Population Employed in Architecture & Engineering in Oregon
RELATED REPORTS & OPTIONS
Architecture & Engineering
Oregon
Compare Cities
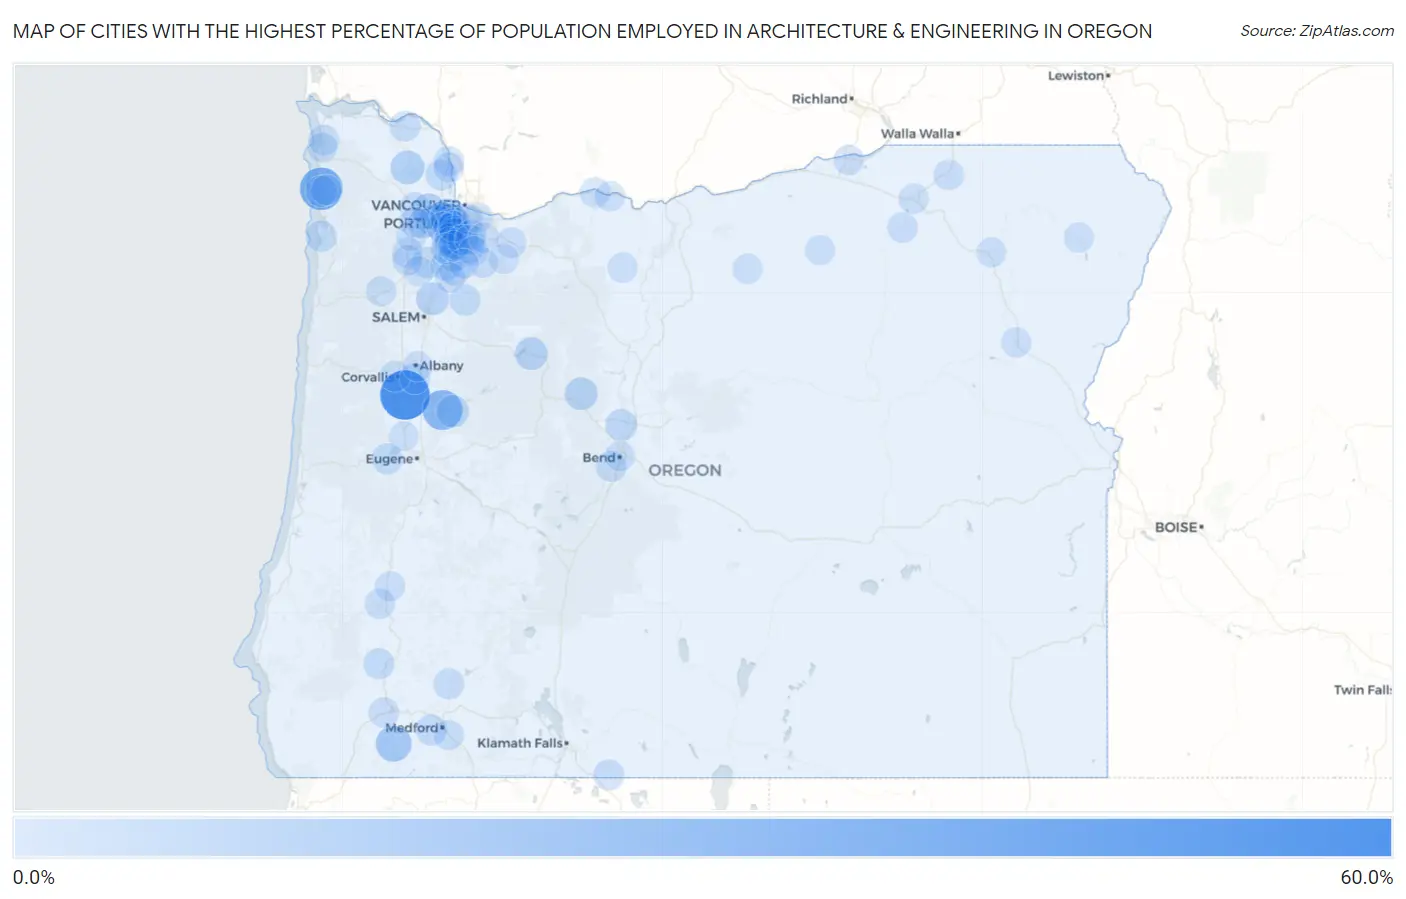
Map of Cities with the Highest Percentage of Population Employed in Architecture & Engineering in Oregon
0.0%
60.0%
Cities with the Highest Percentage of Population Employed in Architecture & Engineering in Oregon
| City | % Employed | vs State | vs National | |
| 1. | Peoria | 56.2% | 2.8%(+53.4)#1 | 2.1%(+54.1)#20 |
| 2. | Neahkahnie | 36.4% | 2.8%(+33.6)#2 | 2.1%(+34.3)#44 |
| 3. | Green Meadows | 35.8% | 2.8%(+32.9)#3 | 2.1%(+33.6)#46 |
| 4. | Crawfordsville | 28.6% | 2.8%(+25.8)#4 | 2.1%(+26.5)#64 |
| 5. | Williams | 17.7% | 2.8%(+14.9)#5 | 2.1%(+15.6)#163 |
| 6. | Jasper | 16.8% | 2.8%(+14.0)#6 | 2.1%(+14.7)#183 |
| 7. | Bethany | 14.8% | 2.8%(+12.0)#7 | 2.1%(+12.7)#236 |
| 8. | Vernonia | 11.8% | 2.8%(+9.02)#8 | 2.1%(+9.69)#366 |
| 9. | Hillsboro | 11.2% | 2.8%(+8.34)#9 | 2.1%(+9.01)#406 |
| 10. | Cherry Grove | 10.5% | 2.8%(+7.68)#10 | 2.1%(+8.35)#453 |
| 11. | North Plains | 10.4% | 2.8%(+7.63)#11 | 2.1%(+8.30)#456 |
| 12. | Brooks | 9.8% | 2.8%(+6.97)#12 | 2.1%(+7.63)#516 |
| 13. | Cedar Mill | 9.6% | 2.8%(+6.79)#13 | 2.1%(+7.46)#527 |
| 14. | Camp Sherman | 9.1% | 2.8%(+6.28)#14 | 2.1%(+6.94)#562 |
| 15. | Idanha | 9.1% | 2.8%(+6.28)#15 | 2.1%(+6.94)#567 |
| 16. | Holley | 8.3% | 2.8%(+5.44)#16 | 2.1%(+6.11)#672 |
| 17. | Oak Hills | 7.7% | 2.8%(+4.84)#17 | 2.1%(+5.50)#781 |
| 18. | Bull Mountain | 7.1% | 2.8%(+4.32)#18 | 2.1%(+4.98)#903 |
| 19. | Eagle Crest | 6.9% | 2.8%(+4.11)#19 | 2.1%(+4.77)#951 |
| 20. | West Haven Sylvan | 6.5% | 2.8%(+3.67)#20 | 2.1%(+4.34)#1,052 |
| 21. | Dundee | 6.2% | 2.8%(+3.43)#21 | 2.1%(+4.09)#1,145 |
| 22. | Manzanita | 6.0% | 2.8%(+3.19)#22 | 2.1%(+3.85)#1,240 |
| 23. | Cedar Hills | 6.0% | 2.8%(+3.14)#23 | 2.1%(+3.81)#1,260 |
| 24. | Butteville | 5.6% | 2.8%(+2.79)#24 | 2.1%(+3.46)#1,438 |
| 25. | Rockcreek | 5.6% | 2.8%(+2.79)#25 | 2.1%(+3.46)#1,439 |
| 26. | Aloha | 5.6% | 2.8%(+2.77)#26 | 2.1%(+3.44)#1,458 |
| 27. | Aurora | 5.5% | 2.8%(+2.67)#27 | 2.1%(+3.34)#1,515 |
| 28. | Netarts | 5.4% | 2.8%(+2.56)#28 | 2.1%(+3.22)#1,576 |
| 29. | West Linn | 5.4% | 2.8%(+2.54)#29 | 2.1%(+3.20)#1,596 |
| 30. | Wilsonville | 5.3% | 2.8%(+2.51)#30 | 2.1%(+3.18)#1,611 |
| 31. | Warren | 5.2% | 2.8%(+2.40)#31 | 2.1%(+3.07)#1,683 |
| 32. | Dilley | 5.2% | 2.8%(+2.37)#32 | 2.1%(+3.04)#1,704 |
| 33. | Jacksonville | 5.2% | 2.8%(+2.36)#33 | 2.1%(+3.02)#1,719 |
| 34. | Scotts Mills | 5.1% | 2.8%(+2.24)#34 | 2.1%(+2.91)#1,794 |
| 35. | Garden Home Whitford | 5.0% | 2.8%(+2.20)#35 | 2.1%(+2.87)#1,821 |
| 36. | Tigard | 5.0% | 2.8%(+2.17)#36 | 2.1%(+2.83)#1,849 |
| 37. | Rivergrove | 5.0% | 2.8%(+2.16)#37 | 2.1%(+2.83)#1,855 |
| 38. | Bayshore | 5.0% | 2.8%(+2.14)#38 | 2.1%(+2.80)#1,867 |
| 39. | Durham | 4.8% | 2.8%(+1.95)#39 | 2.1%(+2.61)#2,003 |
| 40. | Veneta | 4.7% | 2.8%(+1.93)#40 | 2.1%(+2.60)#2,019 |
| 41. | Metzger | 4.7% | 2.8%(+1.89)#41 | 2.1%(+2.56)#2,051 |
| 42. | Glendale | 4.7% | 2.8%(+1.85)#42 | 2.1%(+2.52)#2,087 |
| 43. | Shady Cove | 4.6% | 2.8%(+1.75)#43 | 2.1%(+2.41)#2,171 |
| 44. | Beaverton | 4.5% | 2.8%(+1.66)#44 | 2.1%(+2.32)#2,249 |
| 45. | Clatskanie | 4.4% | 2.8%(+1.58)#45 | 2.1%(+2.25)#2,315 |
| 46. | Seventh Mountain | 4.4% | 2.8%(+1.58)#46 | 2.1%(+2.24)#2,324 |
| 47. | Gearhart | 4.4% | 2.8%(+1.56)#47 | 2.1%(+2.23)#2,340 |
| 48. | Yamhill | 4.3% | 2.8%(+1.53)#48 | 2.1%(+2.19)#2,375 |
| 49. | King City | 4.3% | 2.8%(+1.47)#49 | 2.1%(+2.14)#2,415 |
| 50. | Banks | 4.3% | 2.8%(+1.47)#50 | 2.1%(+2.14)#2,416 |
| 51. | Forest Grove | 4.2% | 2.8%(+1.36)#51 | 2.1%(+2.03)#2,551 |
| 52. | Sherwood | 4.1% | 2.8%(+1.32)#52 | 2.1%(+1.98)#2,612 |
| 53. | Corvallis | 4.1% | 2.8%(+1.25)#53 | 2.1%(+1.91)#2,698 |
| 54. | Ochoco West | 4.0% | 2.8%(+1.23)#54 | 2.1%(+1.89)#2,729 |
| 55. | Malin | 4.0% | 2.8%(+1.21)#55 | 2.1%(+1.88)#2,747 |
| 56. | West Slope | 3.9% | 2.8%(+1.12)#56 | 2.1%(+1.79)#2,845 |
| 57. | Tualatin | 3.8% | 2.8%(+0.949)#57 | 2.1%(+1.61)#3,071 |
| 58. | Tangent | 3.7% | 2.8%(+0.872)#58 | 2.1%(+1.54)#3,199 |
| 59. | Knappa | 3.5% | 2.8%(+0.661)#59 | 2.1%(+1.33)#3,571 |
| 60. | Keno | 3.4% | 2.8%(+0.634)#60 | 2.1%(+1.30)#3,609 |
| 61. | Pilot Rock | 3.4% | 2.8%(+0.603)#61 | 2.1%(+1.27)#3,690 |
| 62. | Redwood | 3.3% | 2.8%(+0.534)#62 | 2.1%(+1.20)#3,822 |
| 63. | Hood River | 3.3% | 2.8%(+0.521)#63 | 2.1%(+1.19)#3,840 |
| 64. | Portland | 3.3% | 2.8%(+0.503)#64 | 2.1%(+1.17)#3,878 |
| 65. | Beavercreek | 3.3% | 2.8%(+0.490)#65 | 2.1%(+1.16)#3,897 |
| 66. | Umatilla | 3.2% | 2.8%(+0.411)#66 | 2.1%(+1.08)#4,042 |
| 67. | Weston | 3.2% | 2.8%(+0.360)#67 | 2.1%(+1.03)#4,162 |
| 68. | Milwaukie | 3.1% | 2.8%(+0.319)#68 | 2.1%(+0.984)#4,253 |
| 69. | Nehalem | 3.1% | 2.8%(+0.310)#69 | 2.1%(+0.976)#4,279 |
| 70. | Winston | 3.1% | 2.8%(+0.243)#70 | 2.1%(+0.908)#4,432 |
| 71. | Columbia City | 3.1% | 2.8%(+0.239)#71 | 2.1%(+0.904)#4,442 |
| 72. | Lake Oswego | 3.1% | 2.8%(+0.238)#72 | 2.1%(+0.903)#4,445 |
| 73. | Albany | 3.0% | 2.8%(+0.202)#73 | 2.1%(+0.867)#4,549 |
| 74. | Carlton | 3.0% | 2.8%(+0.153)#74 | 2.1%(+0.818)#4,663 |
| 75. | Sheridan | 2.9% | 2.8%(+0.127)#75 | 2.1%(+0.792)#4,724 |
| 76. | Phoenix | 2.9% | 2.8%(+0.037)#76 | 2.1%(+0.702)#4,982 |
| 77. | St Helens | 2.8% | 2.8%(+0.031)#77 | 2.1%(+0.696)#4,997 |
| 78. | Sandy | 2.8% | 2.8%(+0.006)#78 | 2.1%(+0.672)#5,053 |
| 79. | Oak Grove | 2.8% | 2.8%(-0.009)#79 | 2.1%(+0.656)#5,105 |
| 80. | Gopher Flats | 2.8% | 2.8%(-0.017)#80 | 2.1%(+0.648)#5,127 |
| 81. | Maywood Park | 2.8% | 2.8%(-0.047)#81 | 2.1%(+0.618)#5,212 |
| 82. | Happy Valley | 2.8% | 2.8%(-0.058)#82 | 2.1%(+0.607)#5,253 |
| 83. | Hubbard | 2.7% | 2.8%(-0.097)#83 | 2.1%(+0.568)#5,377 |
| 84. | Gaston | 2.7% | 2.8%(-0.112)#84 | 2.1%(+0.553)#5,415 |
| 85. | Dayton | 2.7% | 2.8%(-0.133)#85 | 2.1%(+0.532)#5,493 |
| 86. | Baker City | 2.7% | 2.8%(-0.157)#86 | 2.1%(+0.508)#5,556 |
| 87. | Oregon City | 2.6% | 2.8%(-0.204)#87 | 2.1%(+0.462)#5,696 |
| 88. | Condon | 2.6% | 2.8%(-0.250)#88 | 2.1%(+0.415)#5,838 |
| 89. | Bend | 2.5% | 2.8%(-0.281)#89 | 2.1%(+0.384)#5,941 |
| 90. | Enterprise | 2.5% | 2.8%(-0.282)#90 | 2.1%(+0.384)#5,943 |
| 91. | Pine Hollow | 2.5% | 2.8%(-0.283)#91 | 2.1%(+0.382)#5,950 |
| 92. | Estacada | 2.5% | 2.8%(-0.296)#92 | 2.1%(+0.370)#5,989 |
| 93. | Roseburg | 2.5% | 2.8%(-0.305)#93 | 2.1%(+0.360)#6,016 |
| 94. | Cornelius | 2.5% | 2.8%(-0.306)#94 | 2.1%(+0.360)#6,021 |
| 95. | Heppner | 2.5% | 2.8%(-0.310)#95 | 2.1%(+0.356)#6,031 |
| 96. | Island City | 2.5% | 2.8%(-0.320)#96 | 2.1%(+0.346)#6,059 |
| 97. | Seaside | 2.5% | 2.8%(-0.347)#97 | 2.1%(+0.318)#6,135 |
| 98. | Canby | 2.4% | 2.8%(-0.382)#98 | 2.1%(+0.283)#6,251 |
| 99. | Mosier | 2.4% | 2.8%(-0.462)#99 | 2.1%(+0.204)#6,543 |
| 100. | Junction City | 2.3% | 2.8%(-0.467)#100 | 2.1%(+0.198)#6,564 |
Common Questions
What are the Top 10 Cities with the Highest Percentage of Population Employed in Architecture & Engineering in Oregon?
Top 10 Cities with the Highest Percentage of Population Employed in Architecture & Engineering in Oregon are:
#1
56.2%
#2
36.4%
#3
28.6%
#4
17.7%
#5
14.8%
#6
11.8%
#7
11.2%
#8
10.4%
#9
9.8%
#10
9.6%
What city has the Highest Percentage of Population Employed in Architecture & Engineering in Oregon?
Peoria has the Highest Percentage of Population Employed in Architecture & Engineering in Oregon with 56.2%.
What is the Percentage of Population Employed in Architecture & Engineering in the State of Oregon?
Percentage of Population Employed in Architecture & Engineering in Oregon is 2.8%.
What is the Percentage of Population Employed in Architecture & Engineering in the United States?
Percentage of Population Employed in Architecture & Engineering in the United States is 2.1%.