Bodega Bay, CA Map & Demographics
Bodega Bay Map
Bodega Bay Overview
$67,901
PER CAPITA INCOME
$172,045
AVG FAMILY INCOME
$157,391
AVG HOUSEHOLD INCOME
0.38
INEQUALITY / GINI INDEX
1,186
TOTAL POPULATION
727
MALE POPULATION
459
FEMALE POPULATION
158.39
MALES / 100 FEMALES
63.14
FEMALES / 100 MALES
53.1
MEDIAN AGE
2.9
AVG FAMILY SIZE
2.3
AVG HOUSEHOLD SIZE
691
LABOR FORCE [ PEOPLE ]
59.1%
PERCENT IN LABOR FORCE
19.0%
UNEMPLOYMENT RATE
Bodega Bay Zip Codes
Bodega Bay Area Codes
Income in Bodega Bay
Income Overview in Bodega Bay
Per Capita Income in Bodega Bay is $67,901, while median incomes of families and households are $172,045 and $157,391 respectively.
| Characteristic | Number | Measure |
| Per Capita Income | 1,186 | $67,901 |
| Median Family Income | 308 | $172,045 |
| Mean Family Income | 308 | $180,012 |
| Median Household Income | 488 | $157,391 |
| Mean Household Income | 488 | $157,943 |
| Income Deficit | 308 | $0 |
| Wage / Income Gap (%) | 1,186 | 0.00% |
| Wage / Income Gap ($) | 1,186 | 100.00¢ per $1 |
| Gini / Inequality Index | 1,186 | 0.38 |
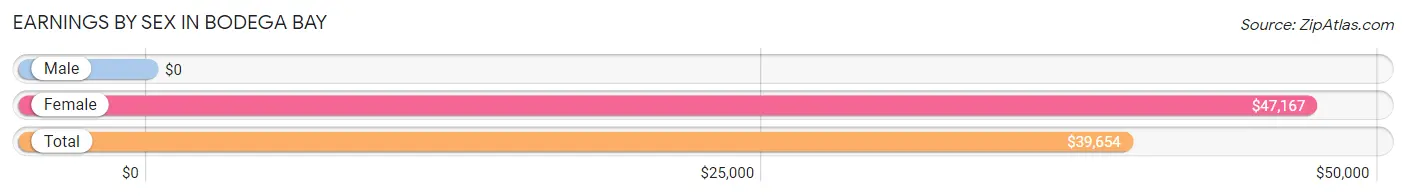
Earnings by Sex in Bodega Bay
| Sex | Number | Average Earnings |
| Male | 500 (67.2%) | $0 |
| Female | 244 (32.8%) | $47,167 |
| Total | 744 (100.0%) | $39,654 |
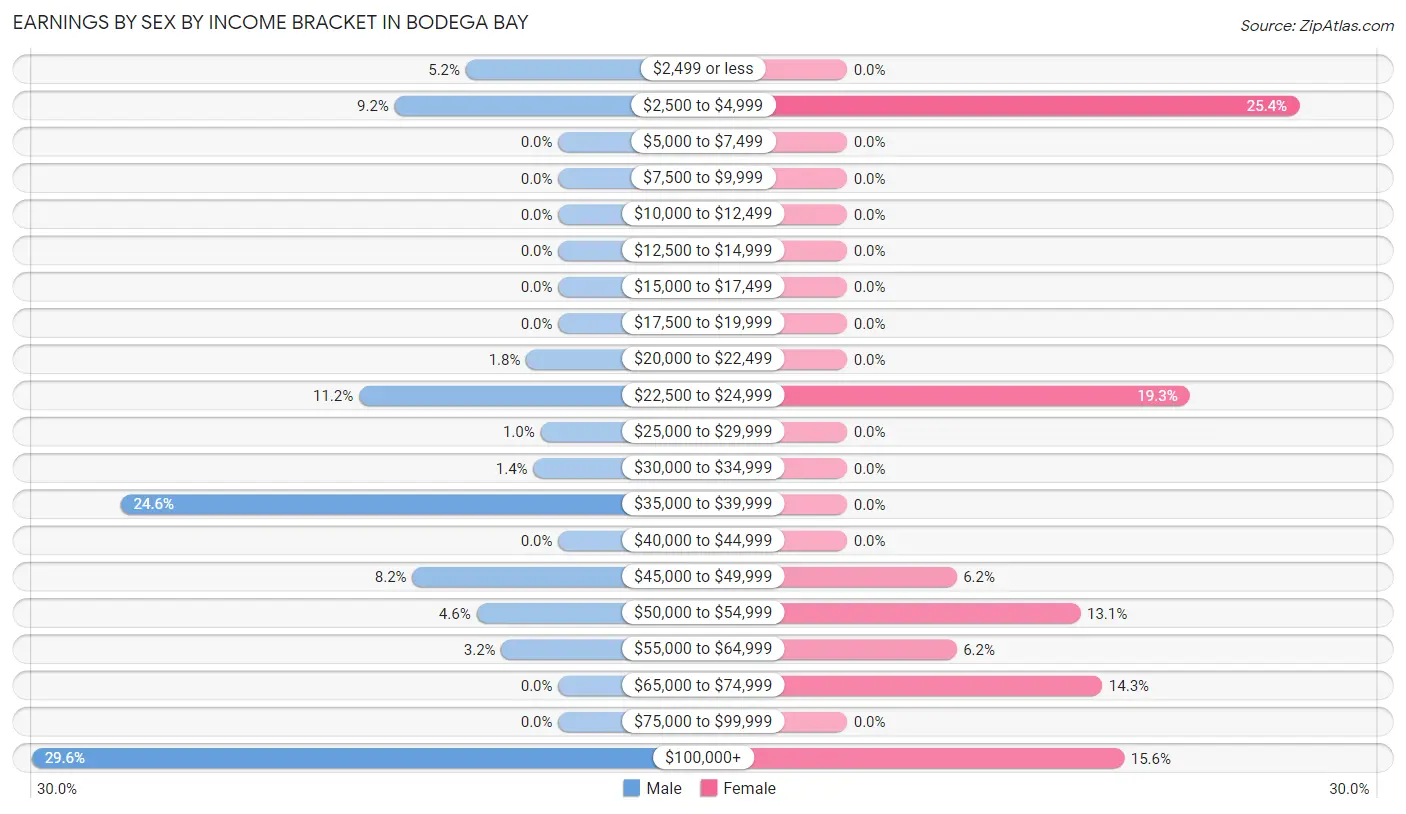
Earnings by Sex by Income Bracket in Bodega Bay
The most common earnings brackets in Bodega Bay are $100,000+ for men (148 | 29.6%) and $2,500 to $4,999 for women (62 | 25.4%).
| Income | Male | Female |
| $2,499 or less | 26 (5.2%) | 0 (0.0%) |
| $2,500 to $4,999 | 46 (9.2%) | 62 (25.4%) |
| $5,000 to $7,499 | 0 (0.0%) | 0 (0.0%) |
| $7,500 to $9,999 | 0 (0.0%) | 0 (0.0%) |
| $10,000 to $12,499 | 0 (0.0%) | 0 (0.0%) |
| $12,500 to $14,999 | 0 (0.0%) | 0 (0.0%) |
| $15,000 to $17,499 | 0 (0.0%) | 0 (0.0%) |
| $17,500 to $19,999 | 0 (0.0%) | 0 (0.0%) |
| $20,000 to $22,499 | 9 (1.8%) | 0 (0.0%) |
| $22,500 to $24,999 | 56 (11.2%) | 47 (19.3%) |
| $25,000 to $29,999 | 5 (1.0%) | 0 (0.0%) |
| $30,000 to $34,999 | 7 (1.4%) | 0 (0.0%) |
| $35,000 to $39,999 | 123 (24.6%) | 0 (0.0%) |
| $40,000 to $44,999 | 0 (0.0%) | 0 (0.0%) |
| $45,000 to $49,999 | 41 (8.2%) | 15 (6.1%) |
| $50,000 to $54,999 | 23 (4.6%) | 32 (13.1%) |
| $55,000 to $64,999 | 16 (3.2%) | 15 (6.1%) |
| $65,000 to $74,999 | 0 (0.0%) | 35 (14.3%) |
| $75,000 to $99,999 | 0 (0.0%) | 0 (0.0%) |
| $100,000+ | 148 (29.6%) | 38 (15.6%) |
| Total | 500 (100.0%) | 244 (100.0%) |
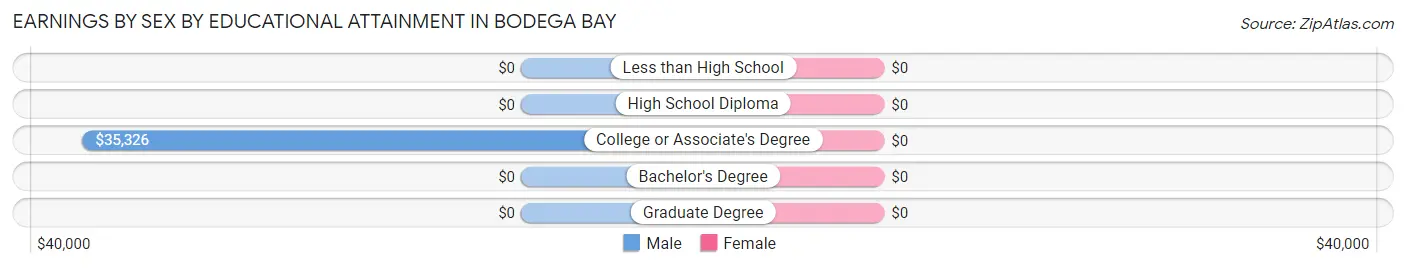
Earnings by Sex by Educational Attainment in Bodega Bay
| Educational Attainment | Male Income | Female Income |
| Less than High School | - | - |
| High School Diploma | - | - |
| College or Associate's Degree | $35,326 | $0 |
| Bachelor's Degree | - | - |
| Graduate Degree | - | - |
| Total | - | - |
Family Income in Bodega Bay
Family Income Brackets in Bodega Bay
According to the Bodega Bay family income data, there are 104 families falling into the $150,000 to $199,999 income range, which is the most common income bracket and makes up 33.8% of all families.
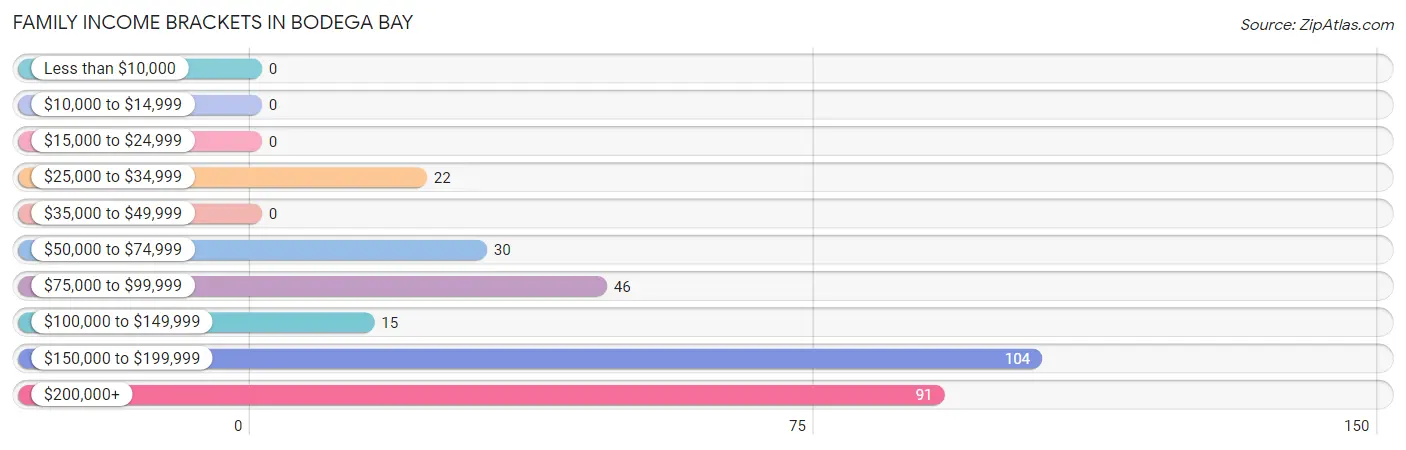
| Income Bracket | # Families | % Families |
| Less than $10,000 | 0 | 0.0% |
| $10,000 to $14,999 | 0 | 0.0% |
| $15,000 to $24,999 | 0 | 0.0% |
| $25,000 to $34,999 | 22 | 7.1% |
| $35,000 to $49,999 | 0 | 0.0% |
| $50,000 to $74,999 | 30 | 9.7% |
| $75,000 to $99,999 | 46 | 14.9% |
| $100,000 to $149,999 | 15 | 4.9% |
| $150,000 to $199,999 | 104 | 33.8% |
| $200,000+ | 91 | 29.5% |
Family Income by Famaliy Size in Bodega Bay
2-person families (209 | 67.9%) account for the highest median family income in Bodega Bay with $173,051 per family, while 2-person families (209 | 67.9%) have the highest median income of $86,526 per family member.
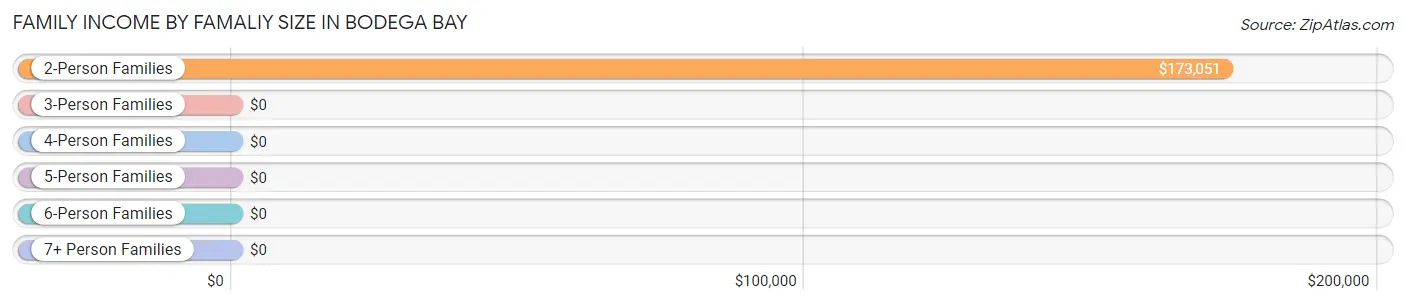
| Income Bracket | # Families | Median Income |
| 2-Person Families | 209 (67.9%) | $173,051 |
| 3-Person Families | 53 (17.2%) | $0 |
| 4-Person Families | 0 (0.0%) | $0 |
| 5-Person Families | 46 (14.9%) | $0 |
| 6-Person Families | 0 (0.0%) | $0 |
| 7+ Person Families | 0 (0.0%) | $0 |
| Total | 308 (100.0%) | $172,045 |
Family Income by Number of Earners in Bodega Bay
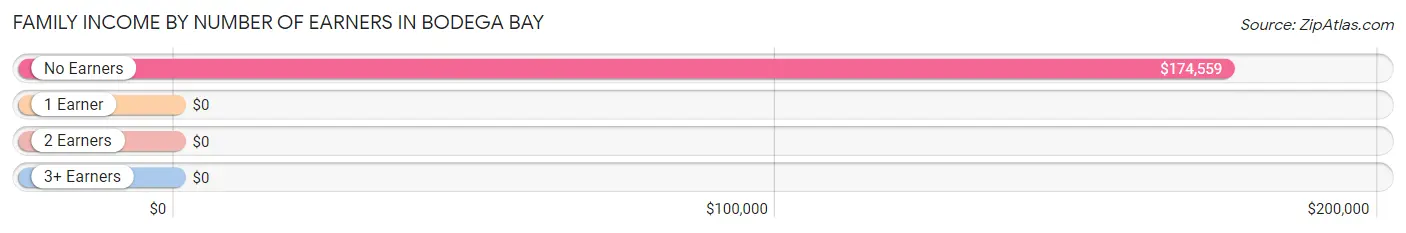
| Number of Earners | # Families | Median Income |
| No Earners | 100 (32.5%) | $174,559 |
| 1 Earner | 86 (27.9%) | $0 |
| 2 Earners | 38 (12.3%) | $0 |
| 3+ Earners | 84 (27.3%) | $0 |
| Total | 308 (100.0%) | $172,045 |
Household Income in Bodega Bay
Household Income Brackets in Bodega Bay
With 134 households falling in the category, the $150,000 to $199,999 income range is the most frequent in Bodega Bay, accounting for 27.5% of all households.
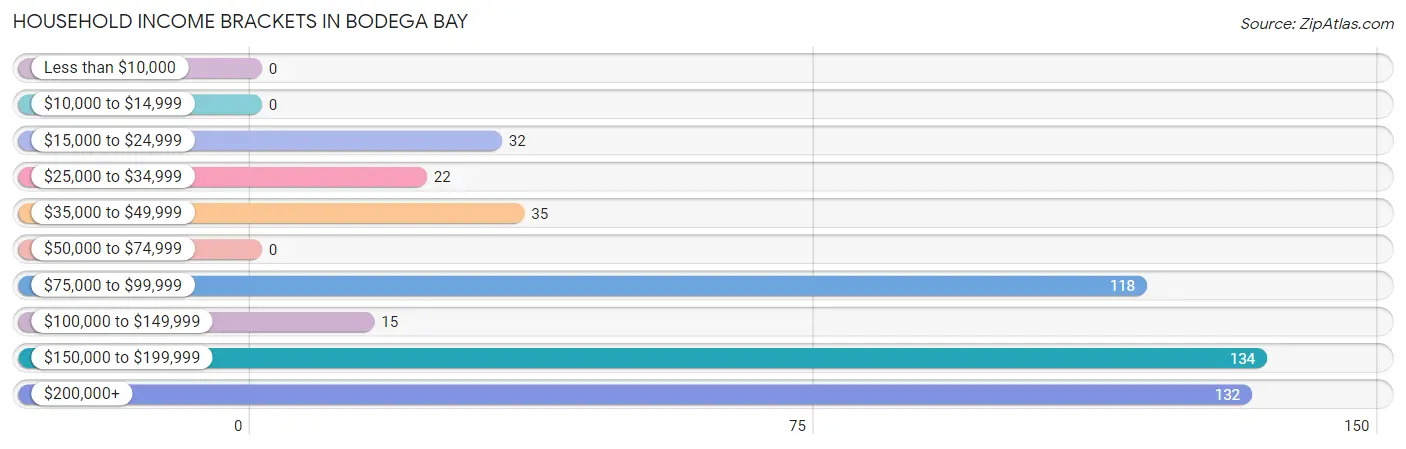
| Income Bracket | # Households | % Households |
| Less than $10,000 | 0 | 0.0% |
| $10,000 to $14,999 | 0 | 0.0% |
| $15,000 to $24,999 | 32 | 6.6% |
| $25,000 to $34,999 | 22 | 4.5% |
| $35,000 to $49,999 | 35 | 7.2% |
| $50,000 to $74,999 | 0 | 0.0% |
| $75,000 to $99,999 | 118 | 24.2% |
| $100,000 to $149,999 | 15 | 3.1% |
| $150,000 to $199,999 | 134 | 27.5% |
| $200,000+ | 132 | 27.0% |
Household Income by Householder Age in Bodega Bay
The median household income in Bodega Bay is $157,391, with the highest median household income of $237,757 found in the 45 to 64 years age bracket for the primary householder. A total of 143 households (29.3%) fall into this category.
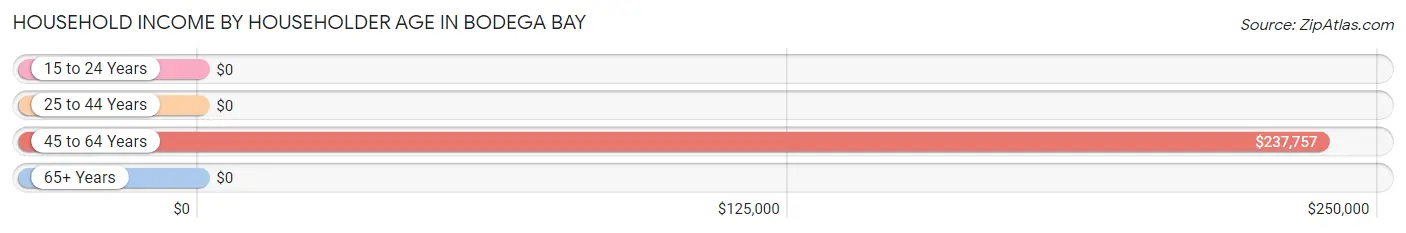
| Income Bracket | # Households | Median Income |
| 15 to 24 Years | 0 (0.0%) | $0 |
| 25 to 44 Years | 119 (24.4%) | $0 |
| 45 to 64 Years | 143 (29.3%) | $237,757 |
| 65+ Years | 226 (46.3%) | $0 |
| Total | 488 (100.0%) | $157,391 |
Poverty in Bodega Bay
Income Below Poverty by Sex and Age in Bodega Bay
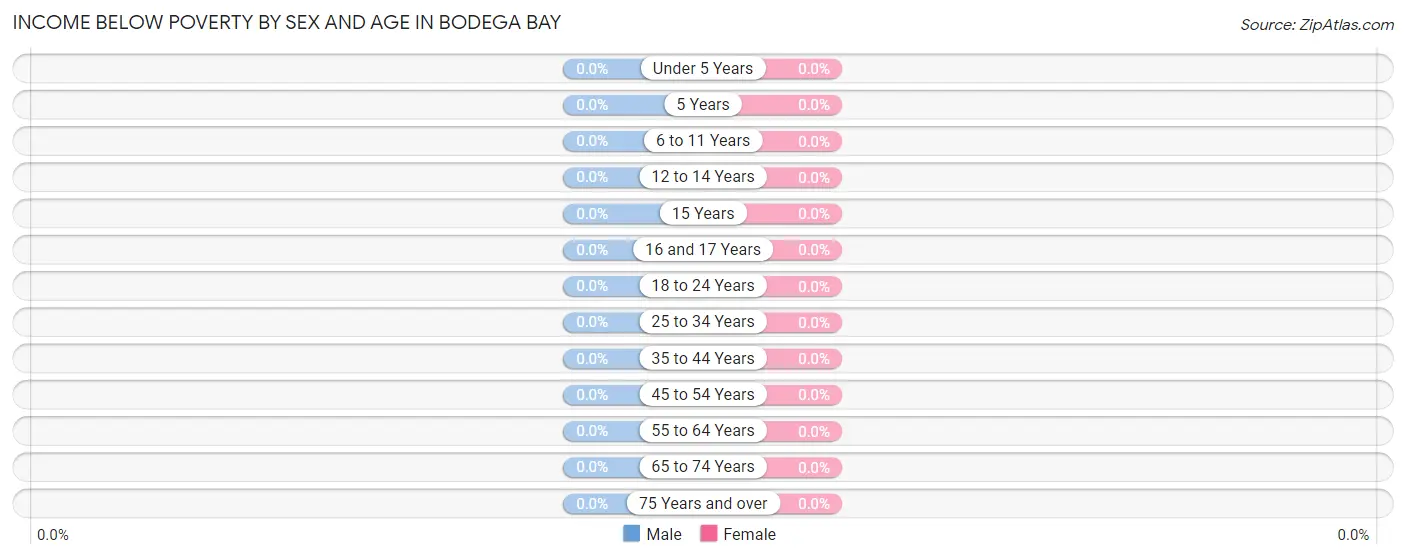
| Age Bracket | Male | Female |
| Under 5 Years | 0 (0.0%) | 0 (0.0%) |
| 5 Years | 0 (0.0%) | 0 (0.0%) |
| 6 to 11 Years | 0 (0.0%) | 0 (0.0%) |
| 12 to 14 Years | 0 (0.0%) | 0 (0.0%) |
| 15 Years | 0 (0.0%) | 0 (0.0%) |
| 16 and 17 Years | 0 (0.0%) | 0 (0.0%) |
| 18 to 24 Years | 0 (0.0%) | 0 (0.0%) |
| 25 to 34 Years | 0 (0.0%) | 0 (0.0%) |
| 35 to 44 Years | 0 (0.0%) | 0 (0.0%) |
| 45 to 54 Years | 0 (0.0%) | 0 (0.0%) |
| 55 to 64 Years | 0 (0.0%) | 0 (0.0%) |
| 65 to 74 Years | 0 (0.0%) | 0 (0.0%) |
| 75 Years and over | 0 (0.0%) | 0 (0.0%) |
| Total | 0 (0.0%) | 0 (0.0%) |
Income Above Poverty by Sex and Age in Bodega Bay
According to the poverty statistics in Bodega Bay, males aged 16 and 17 years and females aged 6 to 11 years are the age groups that are most secure financially, with 100.0% of males and 100.0% of females in these age groups living above the poverty line.
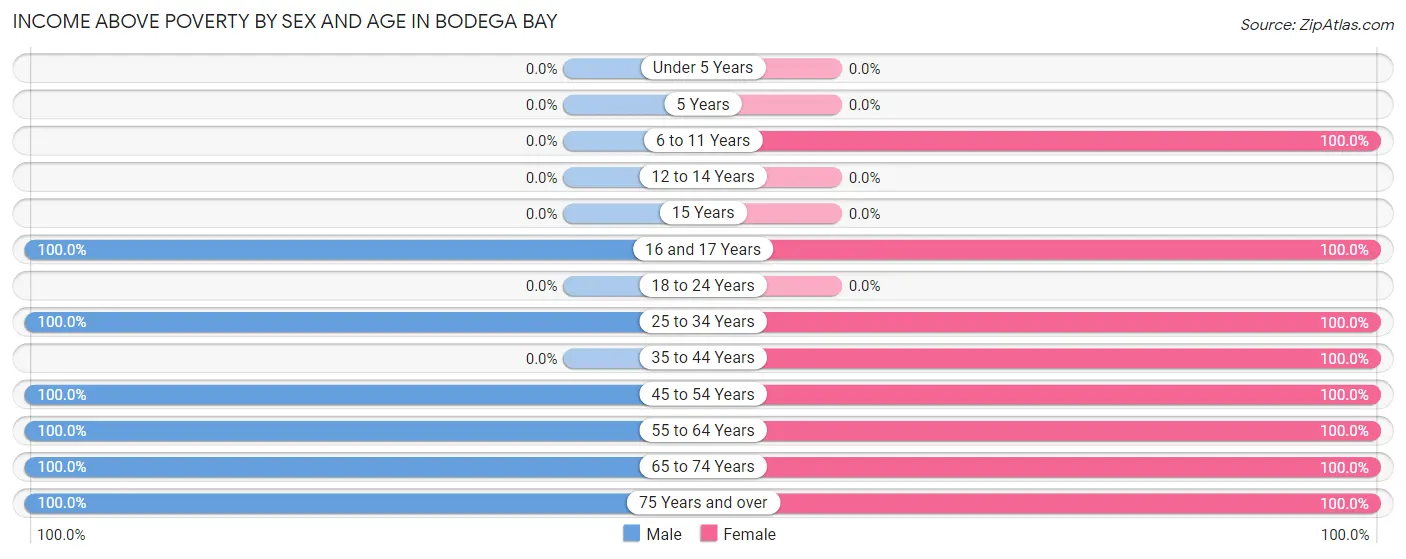
| Age Bracket | Male | Female |
| Under 5 Years | 0 (0.0%) | 0 (0.0%) |
| 5 Years | 0 (0.0%) | 0 (0.0%) |
| 6 to 11 Years | 0 (0.0%) | 16 (100.0%) |
| 12 to 14 Years | 0 (0.0%) | 0 (0.0%) |
| 15 Years | 0 (0.0%) | 0 (0.0%) |
| 16 and 17 Years | 74 (100.0%) | 39 (100.0%) |
| 18 to 24 Years | 0 (0.0%) | 0 (0.0%) |
| 25 to 34 Years | 137 (100.0%) | 35 (100.0%) |
| 35 to 44 Years | 0 (0.0%) | 38 (100.0%) |
| 45 to 54 Years | 188 (100.0%) | 96 (100.0%) |
| 55 to 64 Years | 87 (100.0%) | 30 (100.0%) |
| 65 to 74 Years | 56 (100.0%) | 148 (100.0%) |
| 75 Years and over | 138 (100.0%) | 42 (100.0%) |
| Total | 680 (100.0%) | 444 (100.0%) |
Income Below Poverty Among Married-Couple Families in Bodega Bay
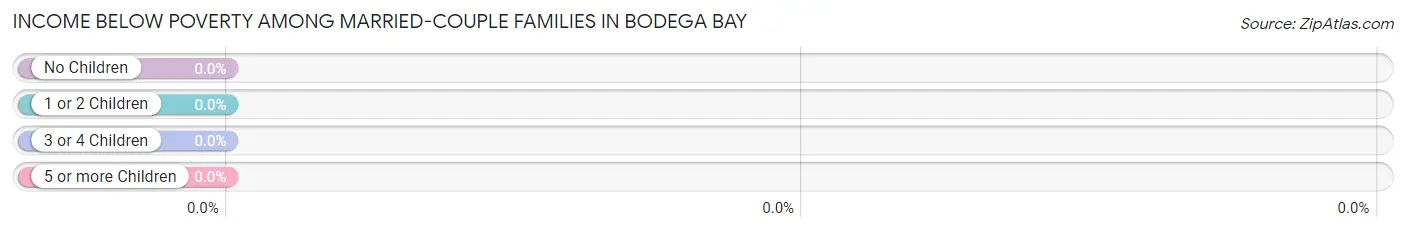
| Children | Above Poverty | Below Poverty |
| No Children | 179 (100.0%) | 0 (0.0%) |
| 1 or 2 Children | 53 (100.0%) | 0 (0.0%) |
| 3 or 4 Children | 0 (0.0%) | 0 (0.0%) |
| 5 or more Children | 0 (0.0%) | 0 (0.0%) |
| Total | 232 (100.0%) | 0 (0.0%) |
Income Below Poverty Among Single-Parent Households in Bodega Bay
| Children | Single Father | Single Mother |
| No Children | 0 (0.0%) | 0 (0.0%) |
| 1 or 2 Children | 0 (0.0%) | 0 (0.0%) |
| 3 or 4 Children | 0 (0.0%) | 0 (0.0%) |
| 5 or more Children | 0 (0.0%) | 0 (0.0%) |
| Total | 0 (0.0%) | 0 (0.0%) |
Income Below Poverty Among Married-Couple vs Single-Parent Households in Bodega Bay
| Children | Married-Couple Families | Single-Parent Households |
| No Children | 0 (0.0%) | 0 (0.0%) |
| 1 or 2 Children | 0 (0.0%) | 0 (0.0%) |
| 3 or 4 Children | 0 (0.0%) | 0 (0.0%) |
| 5 or more Children | 0 (0.0%) | 0 (0.0%) |
| Total | 0 (0.0%) | 0 (0.0%) |
Race in Bodega Bay
The most populous races in Bodega Bay are White / Caucasian (883 | 74.5%), Hispanic or Latino (321 | 27.1%), and Some other Race (288 | 24.3%).
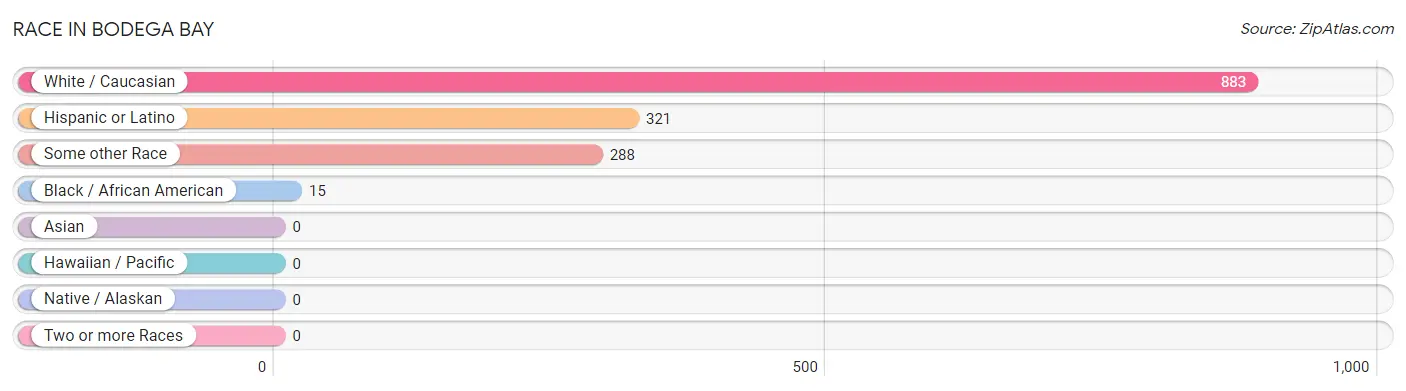
| Race | # Population | % Population |
| Asian | 0 | 0.0% |
| Black / African American | 15 | 1.3% |
| Hawaiian / Pacific | 0 | 0.0% |
| Hispanic or Latino | 321 | 27.1% |
| Native / Alaskan | 0 | 0.0% |
| White / Caucasian | 883 | 74.5% |
| Two or more Races | 0 | 0.0% |
| Some other Race | 288 | 24.3% |
| Total | 1,186 | 100.0% |
Ancestry in Bodega Bay
The most populous ancestries reported in Bodega Bay are Mexican (309 | 26.1%), English (304 | 25.6%), German (220 | 18.5%), European (181 | 15.3%), and Irish (119 | 10.0%), together accounting for 95.5% of all Bodega Bay residents.
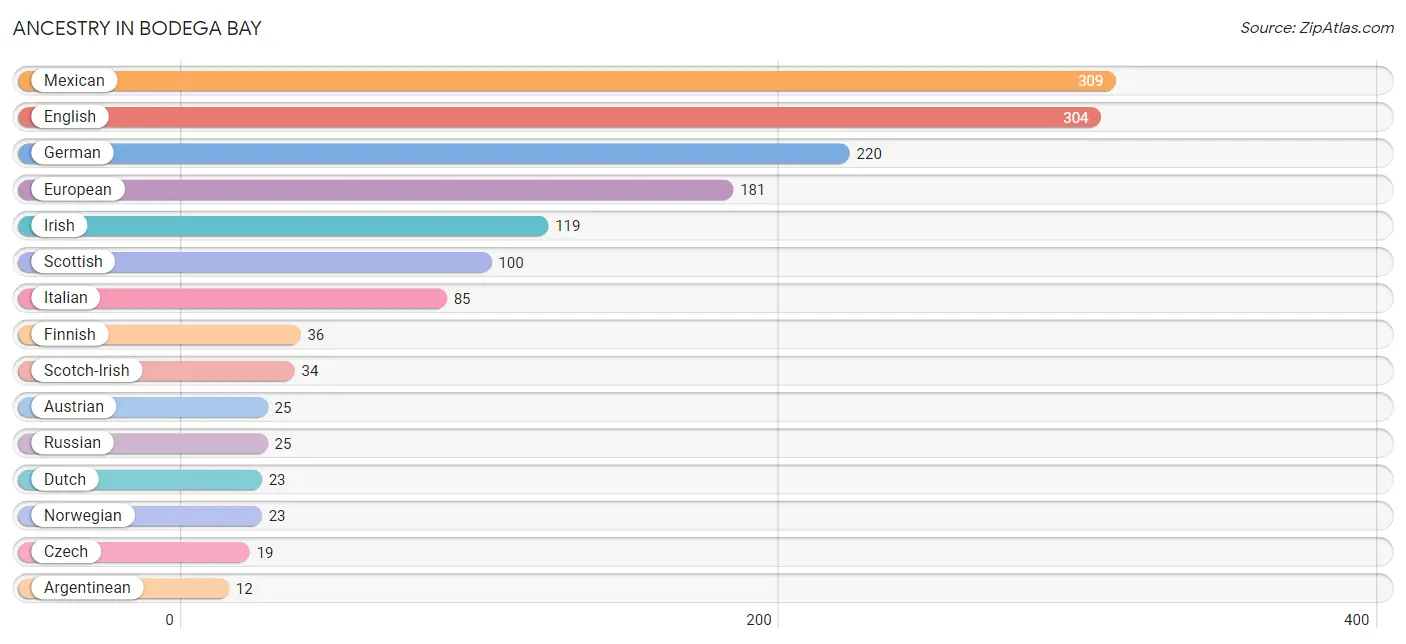
| Ancestry | # Population | % Population |
| Argentinean | 12 | 1.0% |
| Austrian | 25 | 2.1% |
| Czech | 19 | 1.6% |
| Dutch | 23 | 1.9% |
| English | 304 | 25.6% |
| European | 181 | 15.3% |
| Finnish | 36 | 3.0% |
| German | 220 | 18.5% |
| Irish | 119 | 10.0% |
| Italian | 85 | 7.2% |
| Mexican | 309 | 26.1% |
| Norwegian | 23 | 1.9% |
| Russian | 25 | 2.1% |
| Scotch-Irish | 34 | 2.9% |
| Scottish | 100 | 8.4% |
| South American | 12 | 1.0% |
| Swedish | 9 | 0.8% | View All 17 Rows |
Immigrants in Bodega Bay
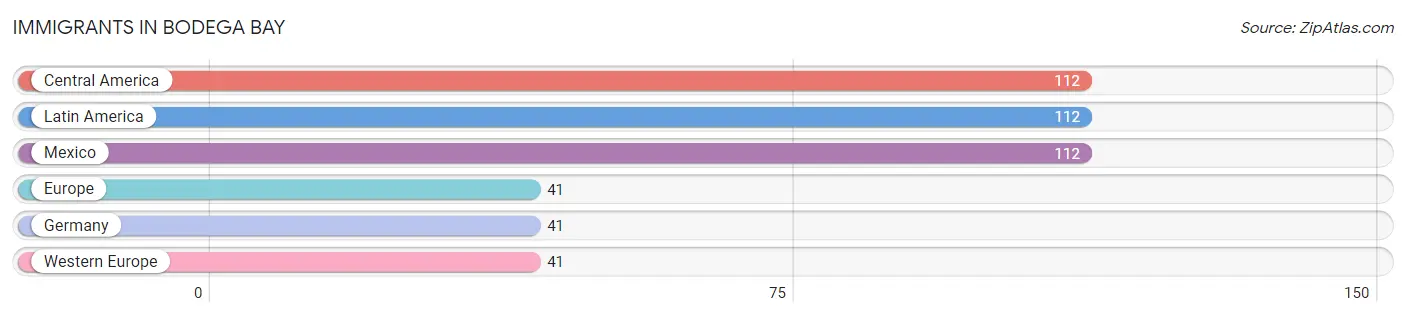
The most numerous immigrant groups reported in Bodega Bay came from Central America (112 | 9.4%), Latin America (112 | 9.4%), Mexico (112 | 9.4%), Europe (41 | 3.5%), and Germany (41 | 3.5%), together accounting for 35.2% of all Bodega Bay residents.
| Immigration Origin | # Population | % Population |
| Central America | 112 | 9.4% |
| Europe | 41 | 3.5% |
| Germany | 41 | 3.5% |
| Latin America | 112 | 9.4% |
| Mexico | 112 | 9.4% |
| Western Europe | 41 | 3.5% | View All 6 Rows |
Sex and Age in Bodega Bay
Sex and Age in Bodega Bay
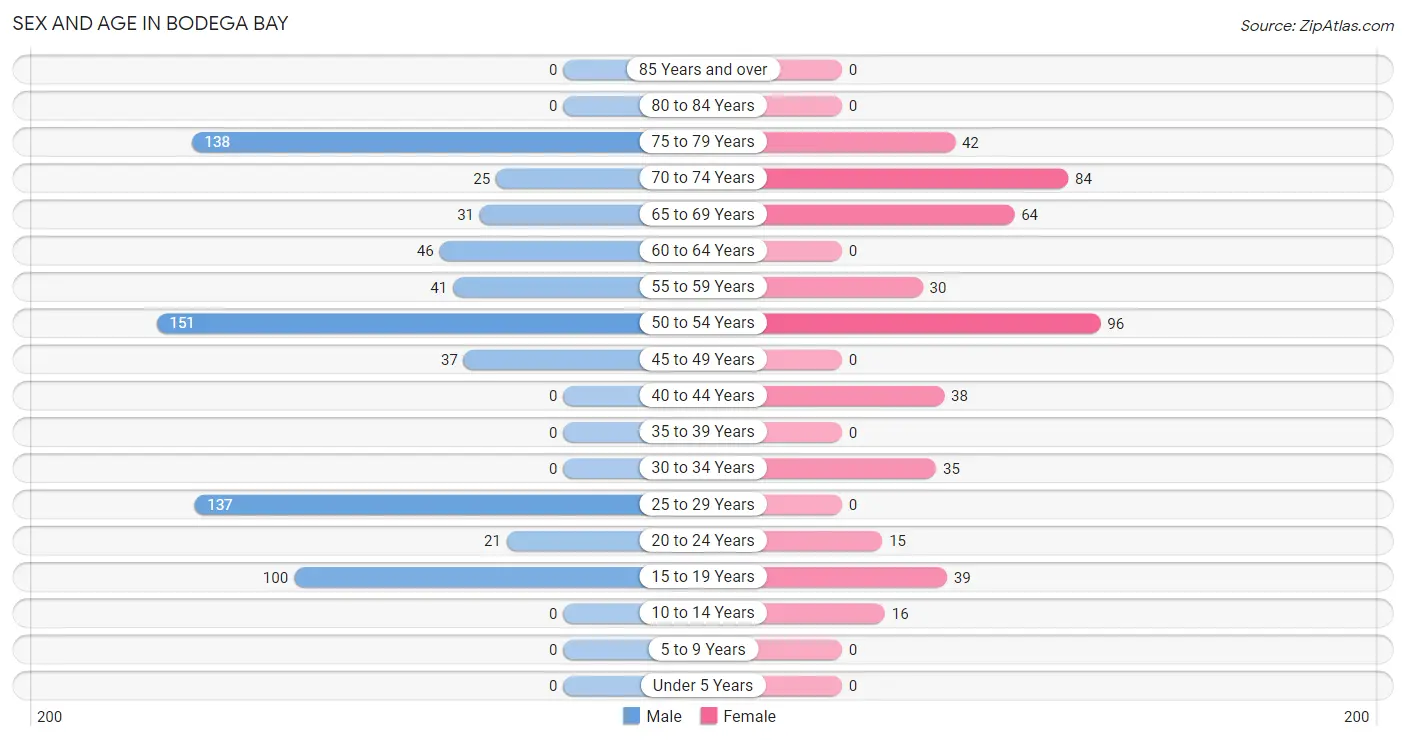
The most populous age groups in Bodega Bay are 50 to 54 Years (151 | 20.8%) for men and 50 to 54 Years (96 | 20.9%) for women.
| Age Bracket | Male | Female |
| Under 5 Years | 0 (0.0%) | 0 (0.0%) |
| 5 to 9 Years | 0 (0.0%) | 0 (0.0%) |
| 10 to 14 Years | 0 (0.0%) | 16 (3.5%) |
| 15 to 19 Years | 100 (13.8%) | 39 (8.5%) |
| 20 to 24 Years | 21 (2.9%) | 15 (3.3%) |
| 25 to 29 Years | 137 (18.8%) | 0 (0.0%) |
| 30 to 34 Years | 0 (0.0%) | 35 (7.6%) |
| 35 to 39 Years | 0 (0.0%) | 0 (0.0%) |
| 40 to 44 Years | 0 (0.0%) | 38 (8.3%) |
| 45 to 49 Years | 37 (5.1%) | 0 (0.0%) |
| 50 to 54 Years | 151 (20.8%) | 96 (20.9%) |
| 55 to 59 Years | 41 (5.6%) | 30 (6.5%) |
| 60 to 64 Years | 46 (6.3%) | 0 (0.0%) |
| 65 to 69 Years | 31 (4.3%) | 64 (13.9%) |
| 70 to 74 Years | 25 (3.4%) | 84 (18.3%) |
| 75 to 79 Years | 138 (19.0%) | 42 (9.1%) |
| 80 to 84 Years | 0 (0.0%) | 0 (0.0%) |
| 85 Years and over | 0 (0.0%) | 0 (0.0%) |
| Total | 727 (100.0%) | 459 (100.0%) |
Families and Households in Bodega Bay
Median Family Size in Bodega Bay
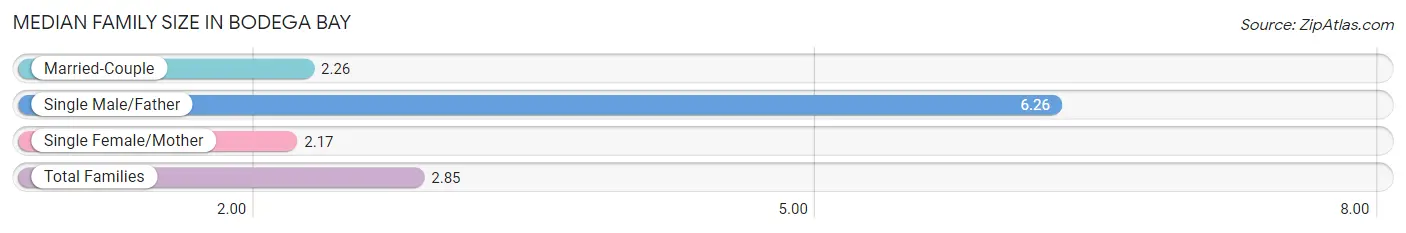
The median family size in Bodega Bay is 2.85 persons per family, with single male/father families (46 | 14.9%) accounting for the largest median family size of 6.26 persons per family. On the other hand, single female/mother families (30 | 9.7%) represent the smallest median family size with 2.17 persons per family.
| Family Type | # Families | Family Size |
| Married-Couple | 232 (75.3%) | 2.26 |
| Single Male/Father | 46 (14.9%) | 6.26 |
| Single Female/Mother | 30 (9.7%) | 2.17 |
| Total Families | 308 (100.0%) | 2.85 |
Median Household Size in Bodega Bay
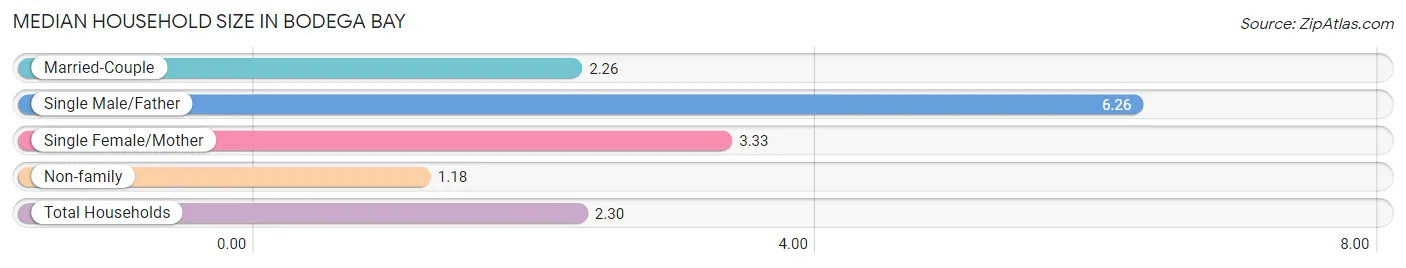
The median household size in Bodega Bay is 2.30 persons per household, with single male/father households (46 | 9.4%) accounting for the largest median household size of 6.26 persons per household. non-family households (180 | 36.9%) represent the smallest median household size with 1.18 persons per household.
| Household Type | # Households | Household Size |
| Married-Couple | 232 (47.5%) | 2.26 |
| Single Male/Father | 46 (9.4%) | 6.26 |
| Single Female/Mother | 30 (6.1%) | 3.33 |
| Non-family | 180 (36.9%) | 1.18 |
| Total Households | 488 (100.0%) | 2.30 |
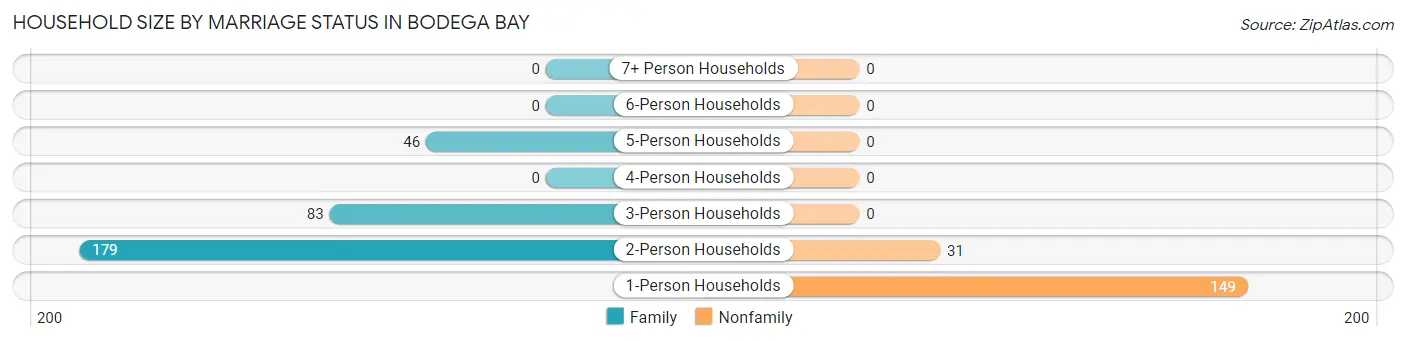
Household Size by Marriage Status in Bodega Bay
Out of a total of 488 households in Bodega Bay, 308 (63.1%) are family households, while 180 (36.9%) are nonfamily households. The most numerous type of family households are 2-person households, comprising 179, and the most common type of nonfamily households are 1-person households, comprising 149.
| Household Size | Family Households | Nonfamily Households |
| 1-Person Households | - | 149 (30.5%) |
| 2-Person Households | 179 (36.7%) | 31 (6.4%) |
| 3-Person Households | 83 (17.0%) | 0 (0.0%) |
| 4-Person Households | 0 (0.0%) | 0 (0.0%) |
| 5-Person Households | 46 (9.4%) | 0 (0.0%) |
| 6-Person Households | 0 (0.0%) | 0 (0.0%) |
| 7+ Person Households | 0 (0.0%) | 0 (0.0%) |
| Total | 308 (63.1%) | 180 (36.9%) |
Female Fertility in Bodega Bay
Fertility by Age in Bodega Bay
| Age Bracket | Women with Births | Births / 1,000 Women |
| 15 to 19 years | 0 (0.0%) | 0.0 |
| 20 to 34 years | 0 (0.0%) | 0.0 |
| 35 to 50 years | 0 (0.0%) | 0.0 |
| Total | 0 (0.0%) | 0.0 |
Fertility by Age by Marriage Status in Bodega Bay
| Age Bracket | Married | Unmarried |
| 15 to 19 years | 0 (0.0%) | 0 (0.0%) |
| 20 to 34 years | 0 (0.0%) | 0 (0.0%) |
| 35 to 50 years | 0 (0.0%) | 0 (0.0%) |
| Total | 0 (0.0%) | 0 (0.0%) |
Fertility by Education in Bodega Bay
| Educational Attainment | Women with Births | Births / 1,000 Women |
| Less than High School | 0 (0.0%) | 0.0 |
| High School Diploma | 0 (0.0%) | 0.0 |
| College or Associate's Degree | 0 (0.0%) | 0.0 |
| Bachelor's Degree | 0 (0.0%) | 0.0 |
| Graduate Degree | 0 (0.0%) | 0.0 |
| Total | 0 (0.0%) | 0.0 |
Fertility by Education by Marriage Status in Bodega Bay
| Educational Attainment | Married | Unmarried |
| Less than High School | 0 (0.0%) | 0 (0.0%) |
| High School Diploma | 0 (0.0%) | 0 (0.0%) |
| College or Associate's Degree | 0 (0.0%) | 0 (0.0%) |
| Bachelor's Degree | 0 (0.0%) | 0 (0.0%) |
| Graduate Degree | 0 (0.0%) | 0 (0.0%) |
| Total | 0 (0.0%) | 0 (0.0%) |
Employment Characteristics in Bodega Bay
Employment by Class of Employer in Bodega Bay
Among the 517 employed individuals in Bodega Bay, private company employees (340 | 65.8%), not-for-profit organizations (61 | 11.8%), and federal government employees (56 | 10.8%) make up the most common classes of employment.
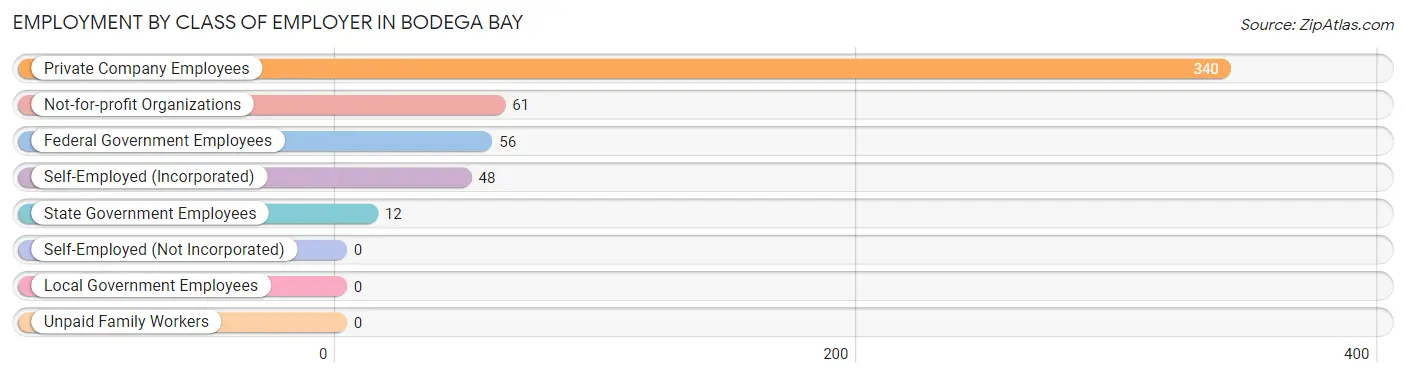
| Employer Class | # Employees | % Employees |
| Private Company Employees | 340 | 65.8% |
| Self-Employed (Incorporated) | 48 | 9.3% |
| Self-Employed (Not Incorporated) | 0 | 0.0% |
| Not-for-profit Organizations | 61 | 11.8% |
| Local Government Employees | 0 | 0.0% |
| State Government Employees | 12 | 2.3% |
| Federal Government Employees | 56 | 10.8% |
| Unpaid Family Workers | 0 | 0.0% |
| Total | 517 | 100.0% |
Employment Status by Age in Bodega Bay
According to the labor force statistics for Bodega Bay, out of the total population over 16 years of age (1,170), 59.1% or 691 individuals are in the labor force, with 19.0% or 131 of them unemployed. The age group with the highest labor force participation rate is 20 to 24 years, with 100.0% or 36 individuals in the labor force. Within the labor force, the 75 years and over age range has the highest percentage of unemployed individuals, with 64.1% or 41 of them being unemployed.
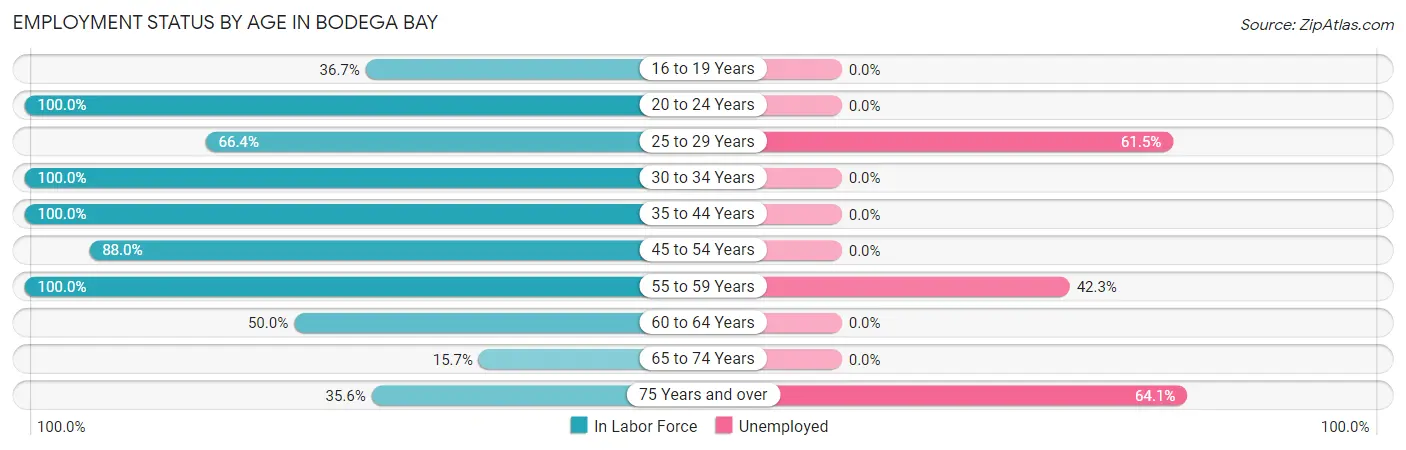
| Age Bracket | In Labor Force | Unemployed |
| 16 to 19 Years | 51 (36.7%) | 0 (0.0%) |
| 20 to 24 Years | 36 (100.0%) | 0 (0.0%) |
| 25 to 29 Years | 91 (66.4%) | 56 (61.5%) |
| 30 to 34 Years | 35 (100.0%) | 0 (0.0%) |
| 35 to 44 Years | 38 (100.0%) | 0 (0.0%) |
| 45 to 54 Years | 250 (88.0%) | 0 (0.0%) |
| 55 to 59 Years | 71 (100.0%) | 30 (42.3%) |
| 60 to 64 Years | 23 (50.0%) | 0 (0.0%) |
| 65 to 74 Years | 32 (15.7%) | 0 (0.0%) |
| 75 Years and over | 64 (35.6%) | 41 (64.1%) |
| Total | 691 (59.1%) | 131 (19.0%) |
Employment Status by Educational Attainment in Bodega Bay
According to labor force statistics for Bodega Bay, 83.1% of individuals (508) out of the total population between 25 and 64 years of age (611) are in the labor force, with 16.9% or 86 of them being unemployed. The group with the highest labor force participation rate are those with the educational attainment of less than high school, with 100.0% or 112 individuals in the labor force. Within the labor force, individuals with college / associate degree education have the highest percentage of unemployment, with 68.8% or 86 of them being unemployed.
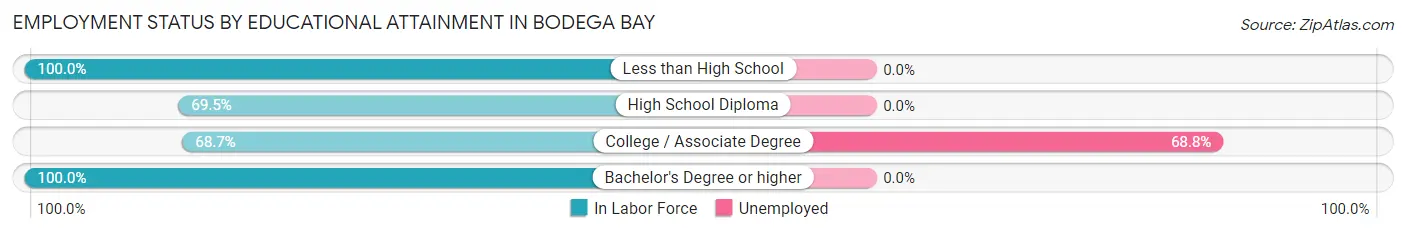
| Educational Attainment | In Labor Force | Unemployed |
| Less than High School | 112 (100.0%) | 0 (0.0%) |
| High School Diploma | 105 (69.5%) | 0 (0.0%) |
| College / Associate Degree | 125 (68.7%) | 125 (68.8%) |
| Bachelor's Degree or higher | 166 (100.0%) | 0 (0.0%) |
| Total | 508 (83.1%) | 103 (16.9%) |
Employment Occupations by Sex in Bodega Bay
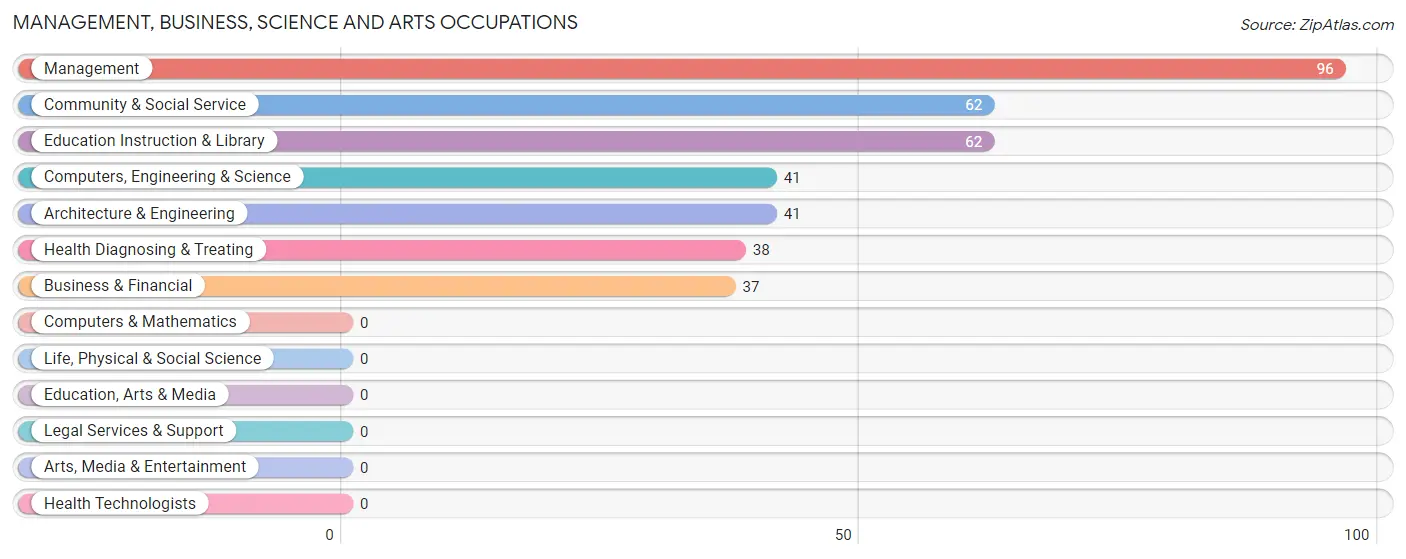
Management, Business, Science and Arts Occupations
The most common Management, Business, Science and Arts occupations in Bodega Bay are Management (96 | 17.7%), Community & Social Service (62 | 11.4%), Education Instruction & Library (62 | 11.4%), Computers, Engineering & Science (41 | 7.5%), and Architecture & Engineering (41 | 7.5%).
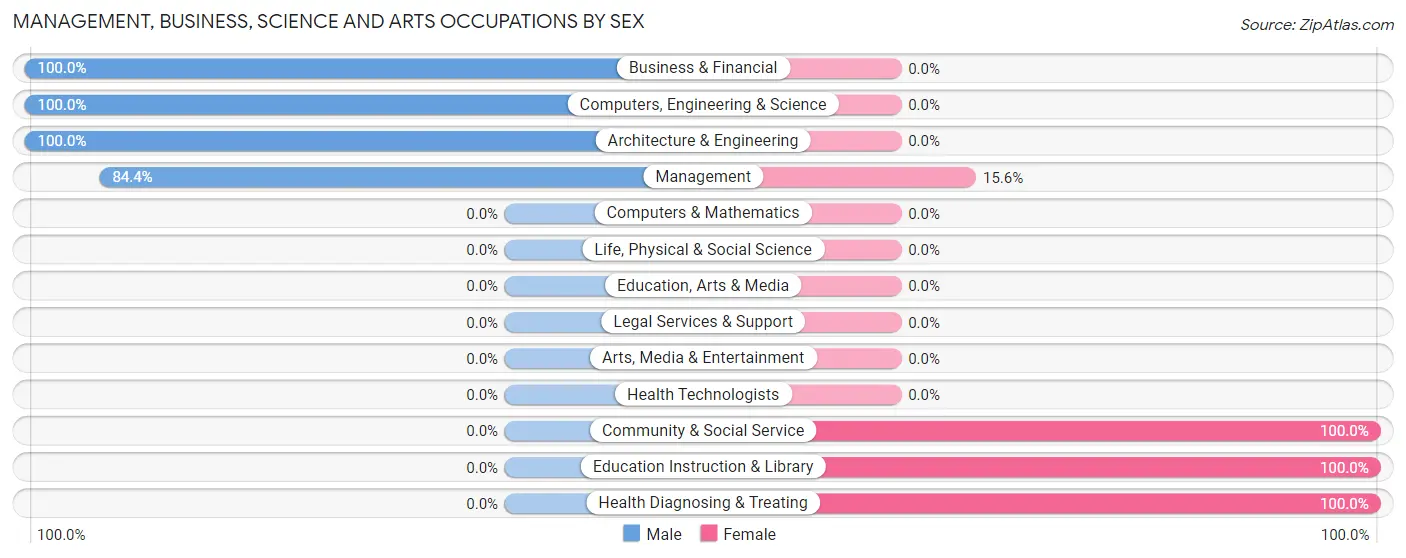
Management, Business, Science and Arts Occupations by Sex
Within the Management, Business, Science and Arts occupations in Bodega Bay, the most male-oriented occupations are Business & Financial (100.0%), Computers, Engineering & Science (100.0%), and Architecture & Engineering (100.0%), while the most female-oriented occupations are Community & Social Service (100.0%), Education Instruction & Library (100.0%), and Health Diagnosing & Treating (100.0%).
| Occupation | Male | Female |
| Management | 81 (84.4%) | 15 (15.6%) |
| Business & Financial | 37 (100.0%) | 0 (0.0%) |
| Computers, Engineering & Science | 41 (100.0%) | 0 (0.0%) |
| Computers & Mathematics | 0 (0.0%) | 0 (0.0%) |
| Architecture & Engineering | 41 (100.0%) | 0 (0.0%) |
| Life, Physical & Social Science | 0 (0.0%) | 0 (0.0%) |
| Community & Social Service | 0 (0.0%) | 62 (100.0%) |
| Education, Arts & Media | 0 (0.0%) | 0 (0.0%) |
| Legal Services & Support | 0 (0.0%) | 0 (0.0%) |
| Education Instruction & Library | 0 (0.0%) | 62 (100.0%) |
| Arts, Media & Entertainment | 0 (0.0%) | 0 (0.0%) |
| Health Diagnosing & Treating | 0 (0.0%) | 38 (100.0%) |
| Health Technologists | 0 (0.0%) | 0 (0.0%) |
| Total (Category) | 159 (58.0%) | 115 (42.0%) |
| Total (Overall) | 299 (55.1%) | 244 (44.9%) |
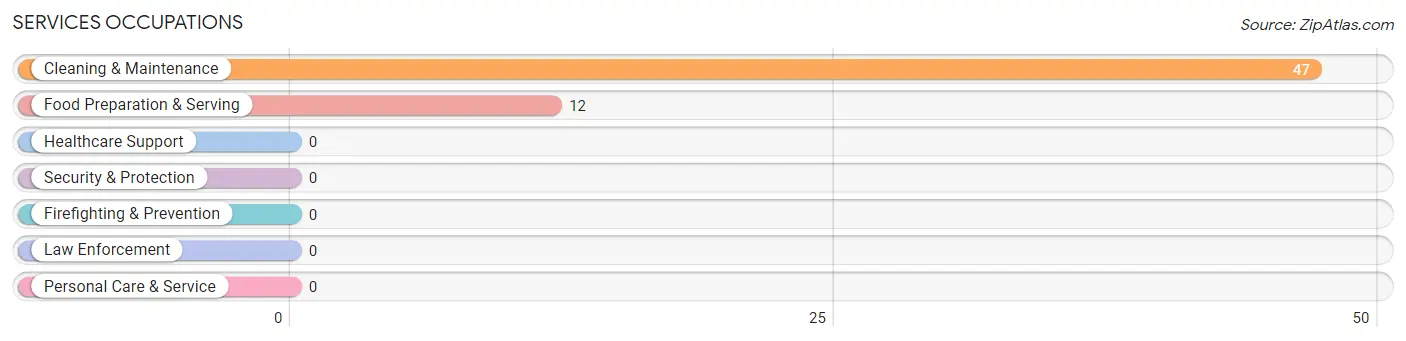
Services Occupations
The most common Services occupations in Bodega Bay are Cleaning & Maintenance (47 | 8.7%), and Food Preparation & Serving (12 | 2.2%).
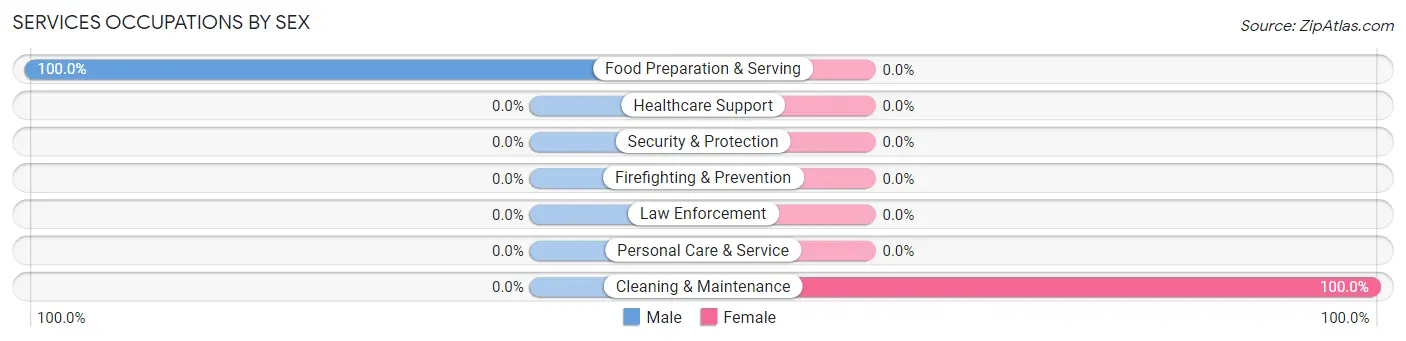
Services Occupations by Sex
| Occupation | Male | Female |
| Healthcare Support | 0 (0.0%) | 0 (0.0%) |
| Security & Protection | 0 (0.0%) | 0 (0.0%) |
| Firefighting & Prevention | 0 (0.0%) | 0 (0.0%) |
| Law Enforcement | 0 (0.0%) | 0 (0.0%) |
| Food Preparation & Serving | 12 (100.0%) | 0 (0.0%) |
| Cleaning & Maintenance | 0 (0.0%) | 47 (100.0%) |
| Personal Care & Service | 0 (0.0%) | 0 (0.0%) |
| Total (Category) | 12 (20.3%) | 47 (79.7%) |
| Total (Overall) | 299 (55.1%) | 244 (44.9%) |
Sales and Office Occupations
The most common Sales and Office occupations in Bodega Bay are Office & Administration (50 | 9.2%), and Sales & Related (32 | 5.9%).
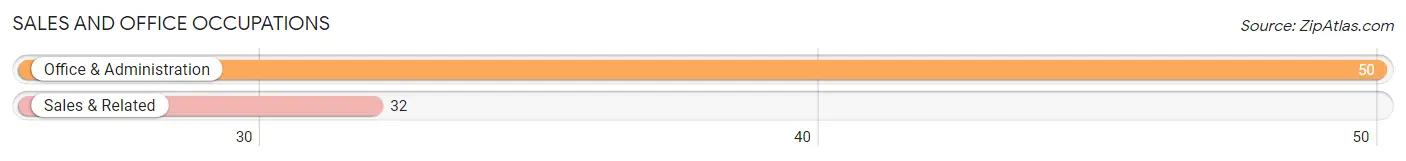
Sales and Office Occupations by Sex
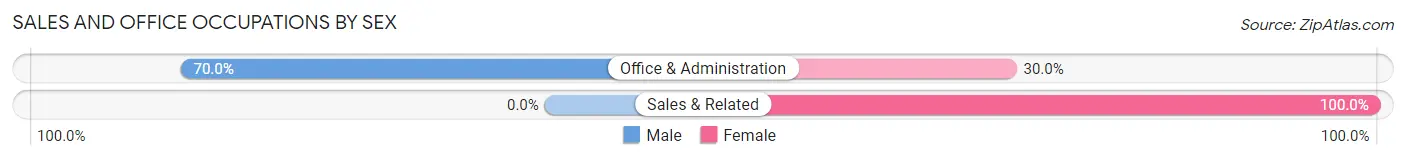
| Occupation | Male | Female |
| Sales & Related | 0 (0.0%) | 32 (100.0%) |
| Office & Administration | 35 (70.0%) | 15 (30.0%) |
| Total (Category) | 35 (42.7%) | 47 (57.3%) |
| Total (Overall) | 299 (55.1%) | 244 (44.9%) |
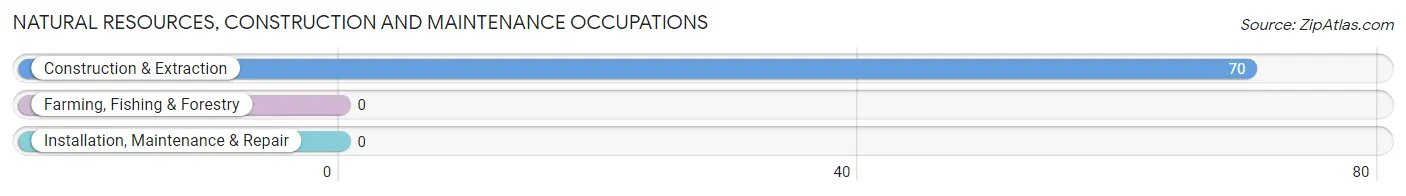
Natural Resources, Construction and Maintenance Occupations
The most common Natural Resources, Construction and Maintenance occupations in Bodega Bay are , and Construction & Extraction (70 | 12.9%).
Natural Resources, Construction and Maintenance Occupations by Sex
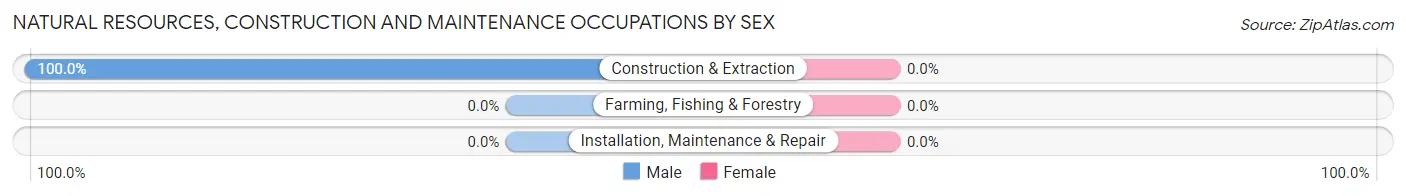
| Occupation | Male | Female |
| Farming, Fishing & Forestry | 0 (0.0%) | 0 (0.0%) |
| Construction & Extraction | 70 (100.0%) | 0 (0.0%) |
| Installation, Maintenance & Repair | 0 (0.0%) | 0 (0.0%) |
| Total (Category) | 70 (100.0%) | 0 (0.0%) |
| Total (Overall) | 299 (55.1%) | 244 (44.9%) |
Production, Transportation and Moving Occupations
The most common Production, Transportation and Moving occupations in Bodega Bay are Transportation (35 | 6.5%), and Material Moving (23 | 4.2%).
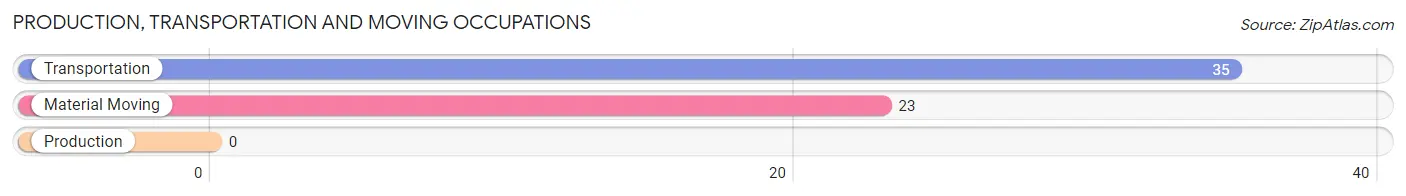
Production, Transportation and Moving Occupations by Sex
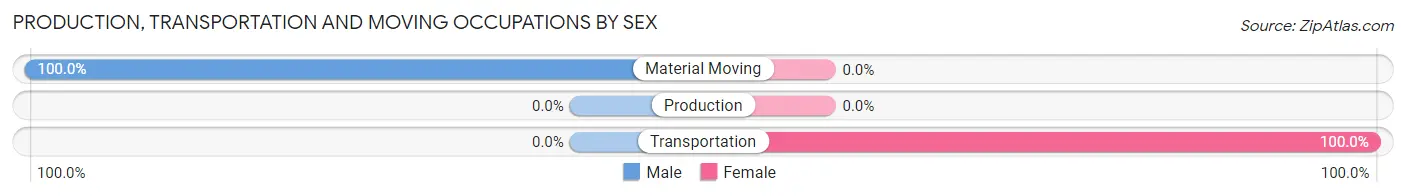
| Occupation | Male | Female |
| Production | 0 (0.0%) | 0 (0.0%) |
| Transportation | 0 (0.0%) | 35 (100.0%) |
| Material Moving | 23 (100.0%) | 0 (0.0%) |
| Total (Category) | 23 (39.7%) | 35 (60.3%) |
| Total (Overall) | 299 (55.1%) | 244 (44.9%) |
Employment Industries by Sex in Bodega Bay
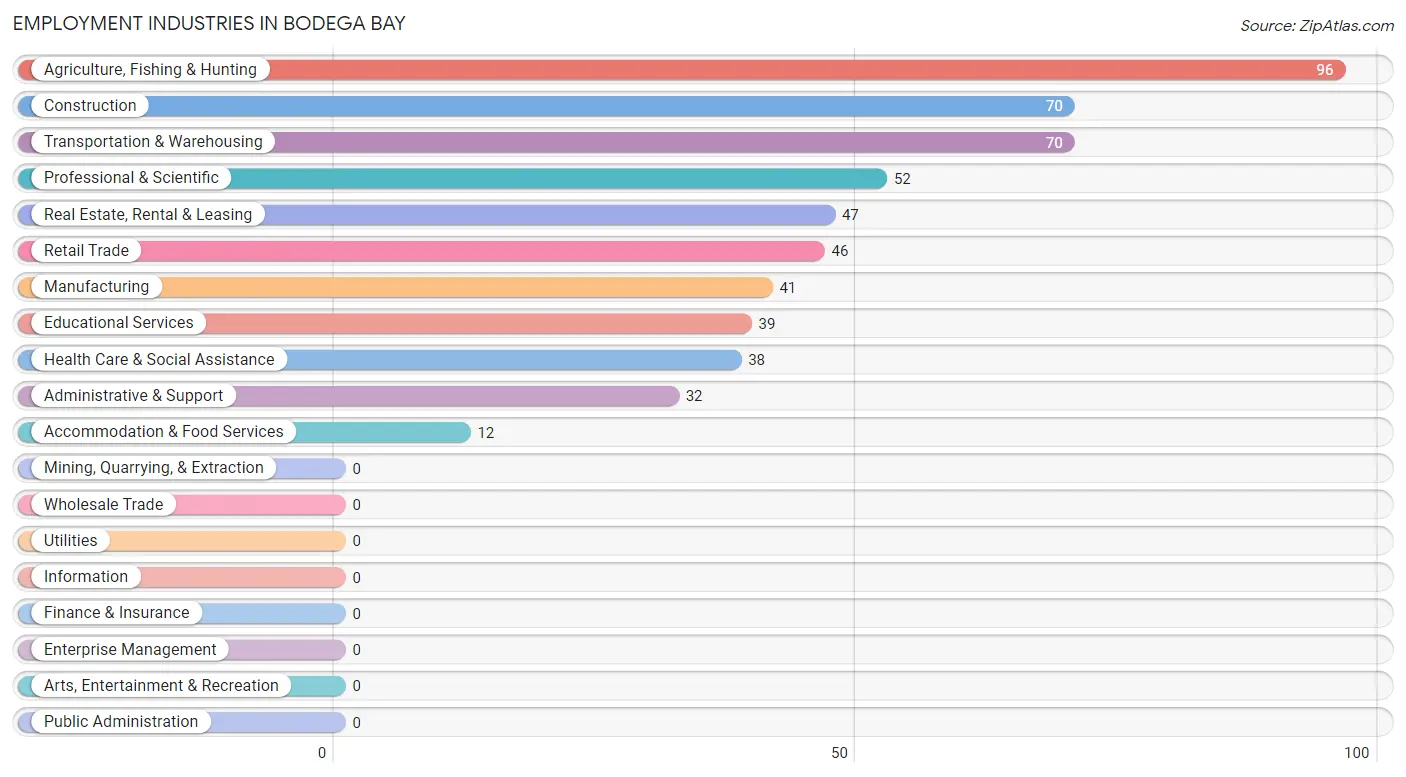
Employment Industries in Bodega Bay
The major employment industries in Bodega Bay include Agriculture, Fishing & Hunting (96 | 17.7%), Construction (70 | 12.9%), Transportation & Warehousing (70 | 12.9%), Professional & Scientific (52 | 9.6%), and Real Estate, Rental & Leasing (47 | 8.7%).
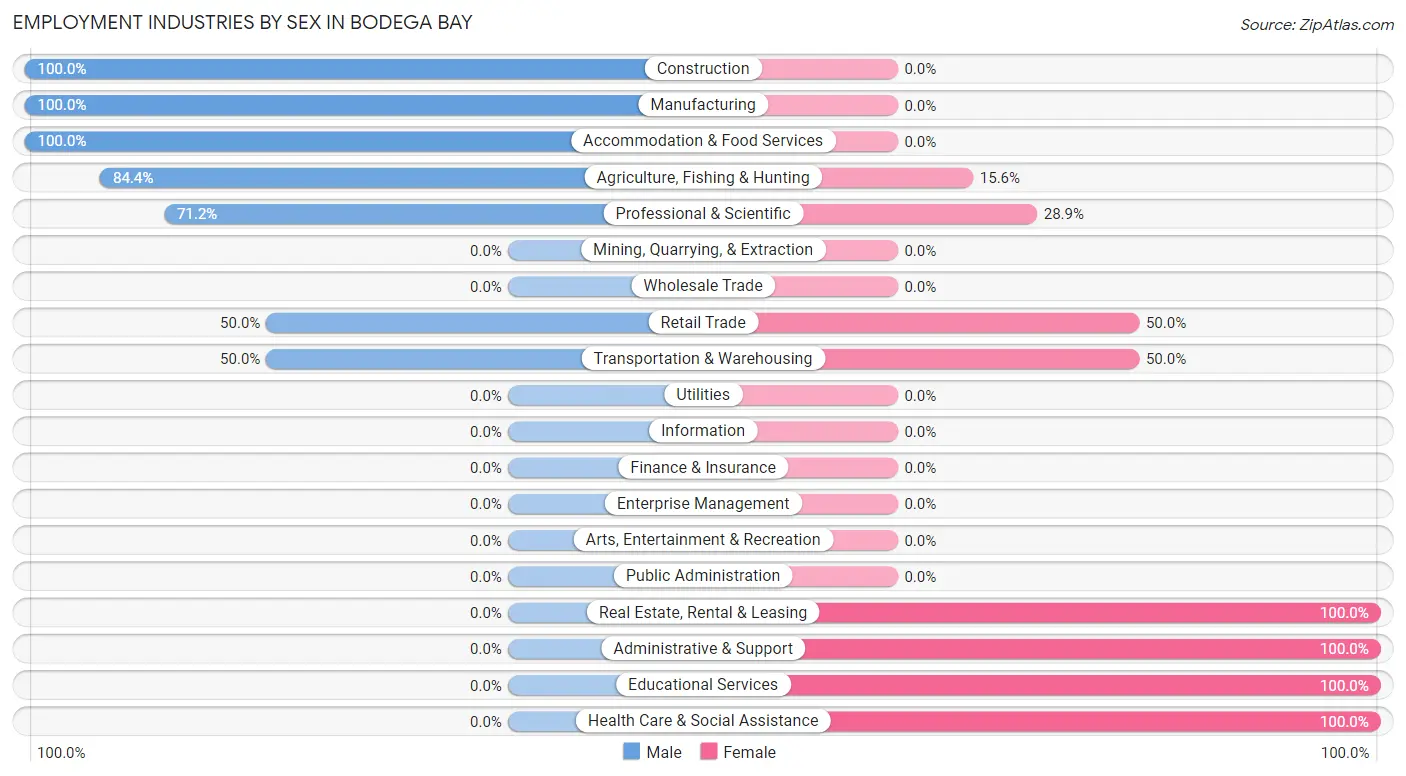
Employment Industries by Sex in Bodega Bay
The Bodega Bay industries that see more men than women are Construction (100.0%), Manufacturing (100.0%), and Accommodation & Food Services (100.0%), whereas the industries that tend to have a higher number of women are Real Estate, Rental & Leasing (100.0%), Administrative & Support (100.0%), and Educational Services (100.0%).
| Industry | Male | Female |
| Agriculture, Fishing & Hunting | 81 (84.4%) | 15 (15.6%) |
| Mining, Quarrying, & Extraction | 0 (0.0%) | 0 (0.0%) |
| Construction | 70 (100.0%) | 0 (0.0%) |
| Manufacturing | 41 (100.0%) | 0 (0.0%) |
| Wholesale Trade | 0 (0.0%) | 0 (0.0%) |
| Retail Trade | 23 (50.0%) | 23 (50.0%) |
| Transportation & Warehousing | 35 (50.0%) | 35 (50.0%) |
| Utilities | 0 (0.0%) | 0 (0.0%) |
| Information | 0 (0.0%) | 0 (0.0%) |
| Finance & Insurance | 0 (0.0%) | 0 (0.0%) |
| Real Estate, Rental & Leasing | 0 (0.0%) | 47 (100.0%) |
| Professional & Scientific | 37 (71.2%) | 15 (28.8%) |
| Enterprise Management | 0 (0.0%) | 0 (0.0%) |
| Administrative & Support | 0 (0.0%) | 32 (100.0%) |
| Educational Services | 0 (0.0%) | 39 (100.0%) |
| Health Care & Social Assistance | 0 (0.0%) | 38 (100.0%) |
| Arts, Entertainment & Recreation | 0 (0.0%) | 0 (0.0%) |
| Accommodation & Food Services | 12 (100.0%) | 0 (0.0%) |
| Public Administration | 0 (0.0%) | 0 (0.0%) |
| Total | 299 (55.1%) | 244 (44.9%) |
Education in Bodega Bay
School Enrollment in Bodega Bay
The most common levels of schooling among the 170 students in Bodega Bay are high school (113 | 66.5%), college / undergraduate (41 | 24.1%), and middle school (16 | 9.4%).
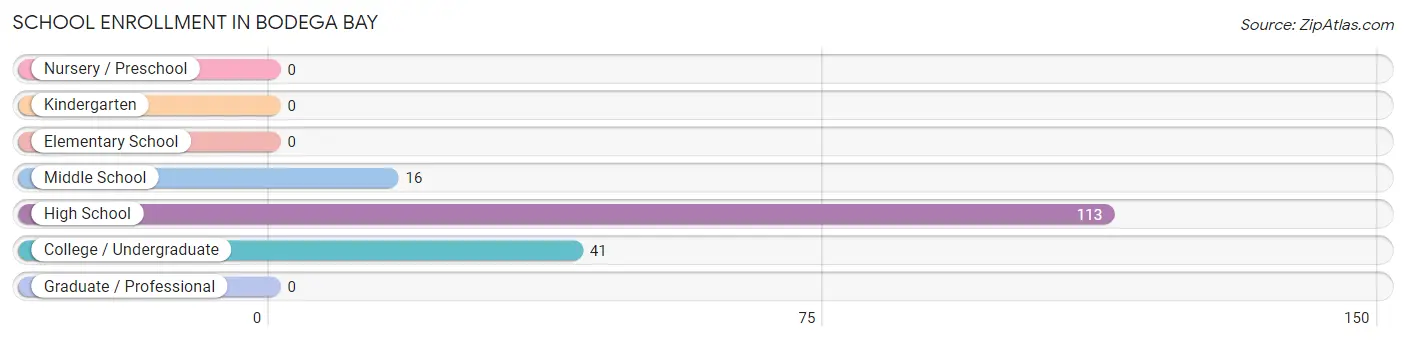
| School Level | # Students | % Students |
| Nursery / Preschool | 0 | 0.0% |
| Kindergarten | 0 | 0.0% |
| Elementary School | 0 | 0.0% |
| Middle School | 16 | 9.4% |
| High School | 113 | 66.5% |
| College / Undergraduate | 41 | 24.1% |
| Graduate / Professional | 0 | 0.0% |
| Total | 170 | 100.0% |
School Enrollment by Age by Funding Source in Bodega Bay
Out of a total of 170 students who are enrolled in schools in Bodega Bay, 31 (18.2%) attend a private institution, while the remaining 139 (81.8%) are enrolled in public schools. The age group of 10 to 14 year olds has the highest likelihood of being enrolled in private schools, with 16 (100.0% in the age bracket) enrolled. Conversely, the age group of 15 to 17 year olds has the lowest likelihood of being enrolled in a private school, with 113 (100.0% in the age bracket) attending a public institution.
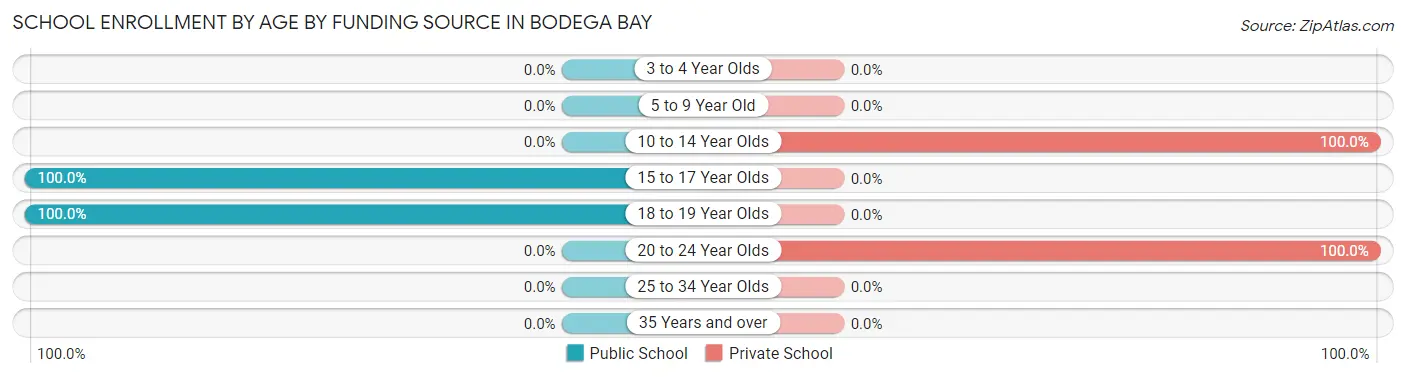
| Age Bracket | Public School | Private School |
| 3 to 4 Year Olds | 0 (0.0%) | 0 (0.0%) |
| 5 to 9 Year Old | 0 (0.0%) | 0 (0.0%) |
| 10 to 14 Year Olds | 0 (0.0%) | 16 (100.0%) |
| 15 to 17 Year Olds | 113 (100.0%) | 0 (0.0%) |
| 18 to 19 Year Olds | 26 (100.0%) | 0 (0.0%) |
| 20 to 24 Year Olds | 0 (0.0%) | 15 (100.0%) |
| 25 to 34 Year Olds | 0 (0.0%) | 0 (0.0%) |
| 35 Years and over | 0 (0.0%) | 0 (0.0%) |
| Total | 139 (81.8%) | 31 (18.2%) |
Educational Attainment by Field of Study in Bodega Bay
Science & technology (78 | 16.7%), business (72 | 15.4%), communications (67 | 14.3%), literature & languages (53 | 11.4%), and visual & performing arts (50 | 10.7%) are the most common fields of study among 467 individuals in Bodega Bay who have obtained a bachelor's degree or higher.
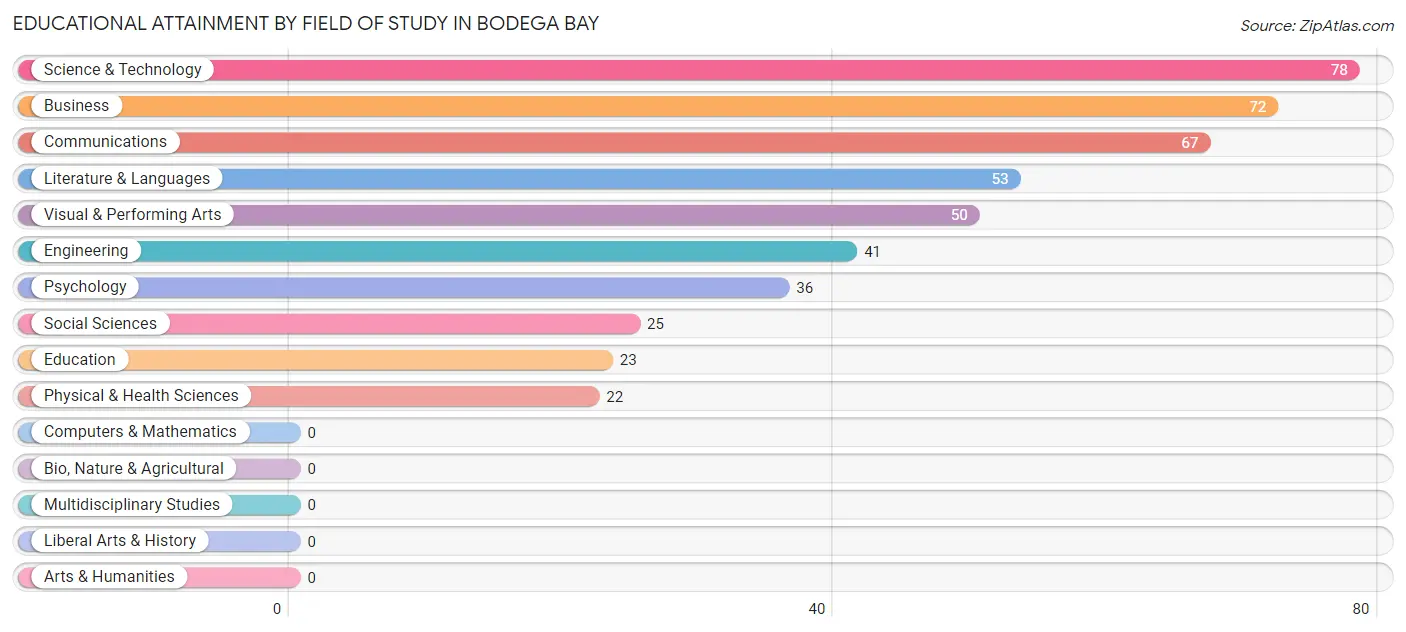
| Field of Study | # Graduates | % Graduates |
| Computers & Mathematics | 0 | 0.0% |
| Bio, Nature & Agricultural | 0 | 0.0% |
| Physical & Health Sciences | 22 | 4.7% |
| Psychology | 36 | 7.7% |
| Social Sciences | 25 | 5.3% |
| Engineering | 41 | 8.8% |
| Multidisciplinary Studies | 0 | 0.0% |
| Science & Technology | 78 | 16.7% |
| Business | 72 | 15.4% |
| Education | 23 | 4.9% |
| Literature & Languages | 53 | 11.4% |
| Liberal Arts & History | 0 | 0.0% |
| Visual & Performing Arts | 50 | 10.7% |
| Communications | 67 | 14.3% |
| Arts & Humanities | 0 | 0.0% |
| Total | 467 | 100.0% |
Transportation & Commute in Bodega Bay
Vehicle Availability by Sex in Bodega Bay
The most prevalent vehicle ownership categories in Bodega Bay are males with 3 vehicles (115, accounting for 40.1%) and females with 3 vehicles (15, making up 63.2%).
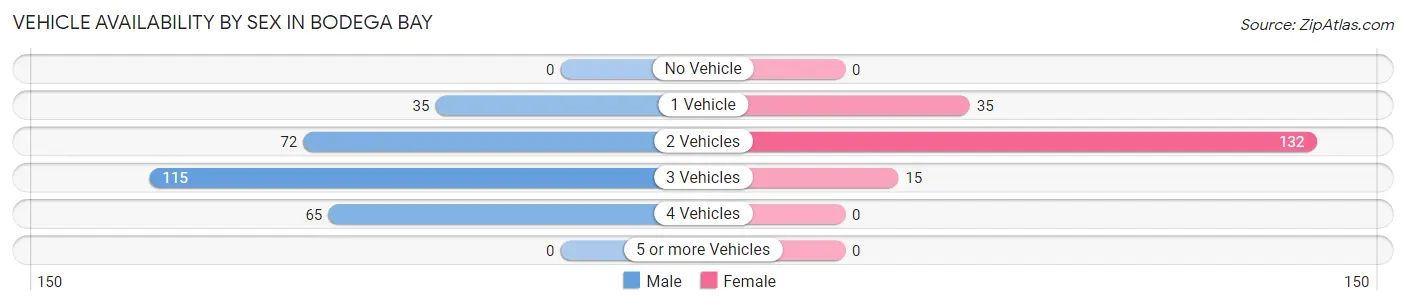
| Vehicles Available | Male | Female |
| No Vehicle | 0 (0.0%) | 0 (0.0%) |
| 1 Vehicle | 35 (12.2%) | 35 (19.2%) |
| 2 Vehicles | 72 (25.1%) | 132 (72.5%) |
| 3 Vehicles | 115 (40.1%) | 15 (8.2%) |
| 4 Vehicles | 65 (22.7%) | 0 (0.0%) |
| 5 or more Vehicles | 0 (0.0%) | 0 (0.0%) |
| Total | 287 (100.0%) | 182 (100.0%) |
Commute Time in Bodega Bay
The most frequently occuring commute durations in Bodega Bay are less than 5 minutes (85 commuters, 21.5%), 45 to 59 minutes (70 commuters, 17.7%), and 15 to 19 minutes (65 commuters, 16.4%).
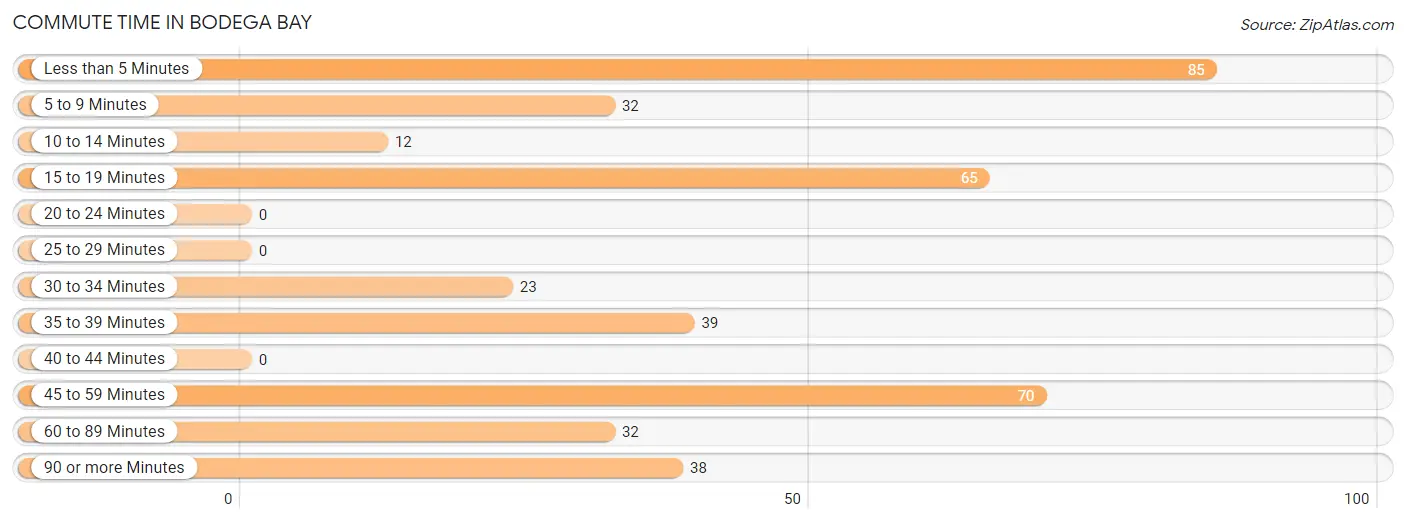
| Commute Time | # Commuters | % Commuters |
| Less than 5 Minutes | 85 | 21.5% |
| 5 to 9 Minutes | 32 | 8.1% |
| 10 to 14 Minutes | 12 | 3.0% |
| 15 to 19 Minutes | 65 | 16.4% |
| 20 to 24 Minutes | 0 | 0.0% |
| 25 to 29 Minutes | 0 | 0.0% |
| 30 to 34 Minutes | 23 | 5.8% |
| 35 to 39 Minutes | 39 | 9.9% |
| 40 to 44 Minutes | 0 | 0.0% |
| 45 to 59 Minutes | 70 | 17.7% |
| 60 to 89 Minutes | 32 | 8.1% |
| 90 or more Minutes | 38 | 9.6% |
Commute Time by Sex in Bodega Bay
The most common commute times in Bodega Bay are 45 to 59 minutes (70 commuters, 29.5%) for males and less than 5 minutes (50 commuters, 31.5%) for females.
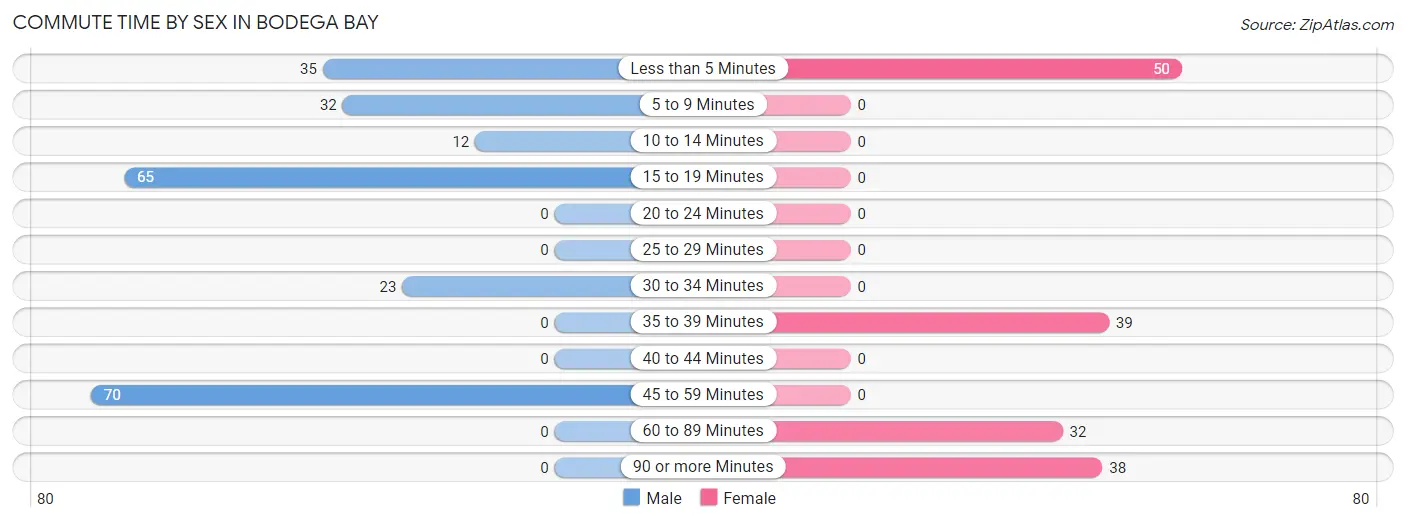
| Commute Time | Male | Female |
| Less than 5 Minutes | 35 (14.8%) | 50 (31.5%) |
| 5 to 9 Minutes | 32 (13.5%) | 0 (0.0%) |
| 10 to 14 Minutes | 12 (5.1%) | 0 (0.0%) |
| 15 to 19 Minutes | 65 (27.4%) | 0 (0.0%) |
| 20 to 24 Minutes | 0 (0.0%) | 0 (0.0%) |
| 25 to 29 Minutes | 0 (0.0%) | 0 (0.0%) |
| 30 to 34 Minutes | 23 (9.7%) | 0 (0.0%) |
| 35 to 39 Minutes | 0 (0.0%) | 39 (24.5%) |
| 40 to 44 Minutes | 0 (0.0%) | 0 (0.0%) |
| 45 to 59 Minutes | 70 (29.5%) | 0 (0.0%) |
| 60 to 89 Minutes | 0 (0.0%) | 32 (20.1%) |
| 90 or more Minutes | 0 (0.0%) | 38 (23.9%) |
Time of Departure to Work by Sex in Bodega Bay
The most frequent times of departure to work in Bodega Bay are 7:00 AM to 7:29 AM (116, 48.9%) for males and 11:00 AM to 11:59 AM (39, 24.5%) for females.
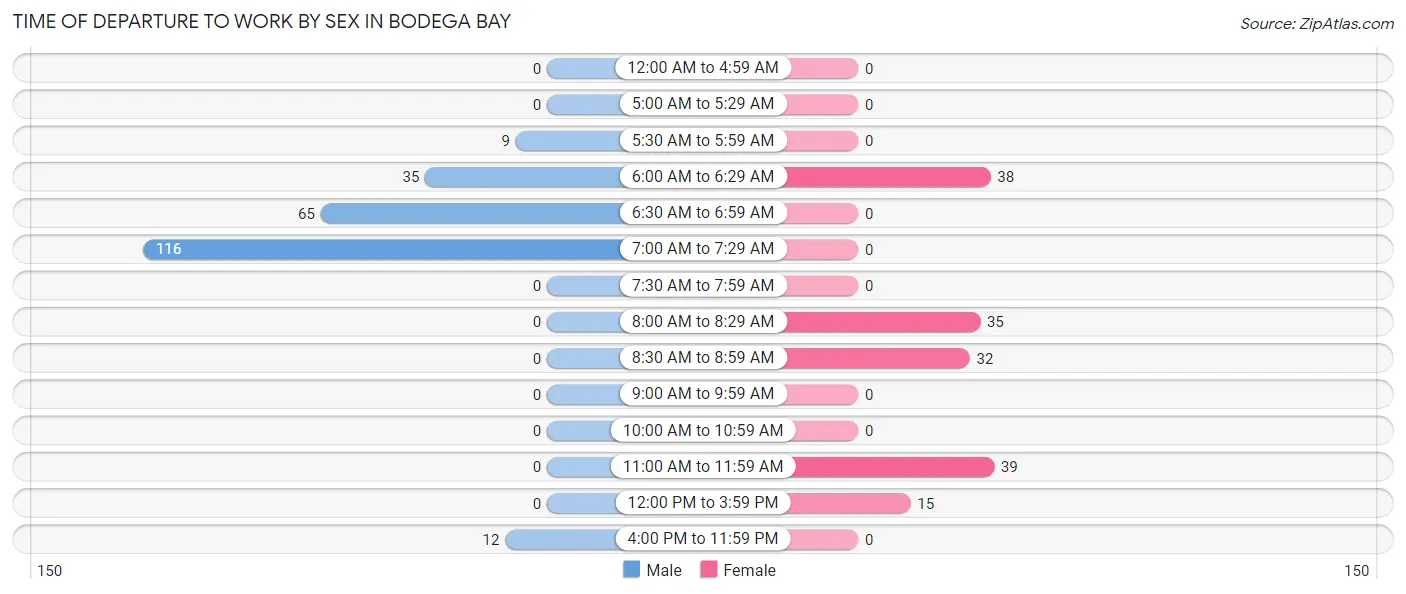
| Time of Departure | Male | Female |
| 12:00 AM to 4:59 AM | 0 (0.0%) | 0 (0.0%) |
| 5:00 AM to 5:29 AM | 0 (0.0%) | 0 (0.0%) |
| 5:30 AM to 5:59 AM | 9 (3.8%) | 0 (0.0%) |
| 6:00 AM to 6:29 AM | 35 (14.8%) | 38 (23.9%) |
| 6:30 AM to 6:59 AM | 65 (27.4%) | 0 (0.0%) |
| 7:00 AM to 7:29 AM | 116 (48.9%) | 0 (0.0%) |
| 7:30 AM to 7:59 AM | 0 (0.0%) | 0 (0.0%) |
| 8:00 AM to 8:29 AM | 0 (0.0%) | 35 (22.0%) |
| 8:30 AM to 8:59 AM | 0 (0.0%) | 32 (20.1%) |
| 9:00 AM to 9:59 AM | 0 (0.0%) | 0 (0.0%) |
| 10:00 AM to 10:59 AM | 0 (0.0%) | 0 (0.0%) |
| 11:00 AM to 11:59 AM | 0 (0.0%) | 39 (24.5%) |
| 12:00 PM to 3:59 PM | 0 (0.0%) | 15 (9.4%) |
| 4:00 PM to 11:59 PM | 12 (5.1%) | 0 (0.0%) |
| Total | 237 (100.0%) | 159 (100.0%) |
Housing Occupancy in Bodega Bay
Occupancy by Ownership in Bodega Bay
Of the total 488 dwellings in Bodega Bay, owner-occupied units account for 360 (73.8%), while renter-occupied units make up 128 (26.2%).
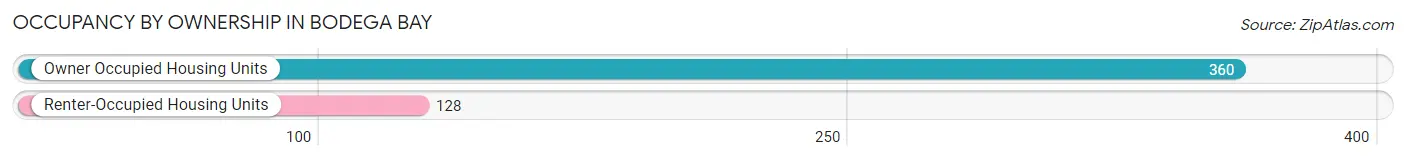
| Occupancy | # Housing Units | % Housing Units |
| Owner Occupied Housing Units | 360 | 73.8% |
| Renter-Occupied Housing Units | 128 | 26.2% |
| Total Occupied Housing Units | 488 | 100.0% |
Occupancy by Household Size in Bodega Bay
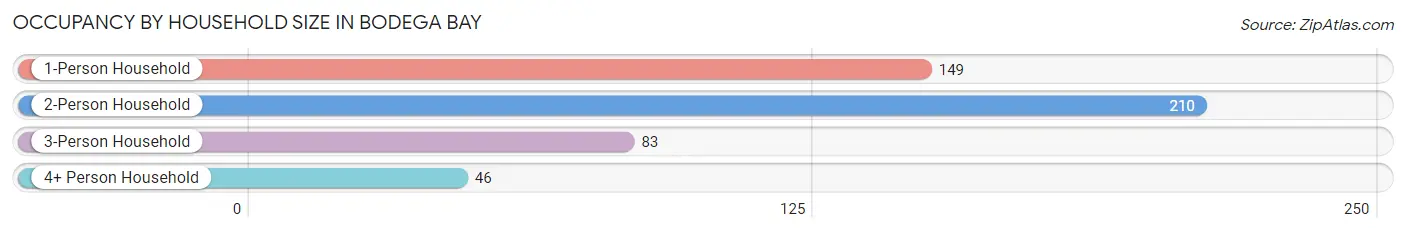
| Household Size | # Housing Units | % Housing Units |
| 1-Person Household | 149 | 30.5% |
| 2-Person Household | 210 | 43.0% |
| 3-Person Household | 83 | 17.0% |
| 4+ Person Household | 46 | 9.4% |
| Total Housing Units | 488 | 100.0% |
Occupancy by Ownership by Household Size in Bodega Bay
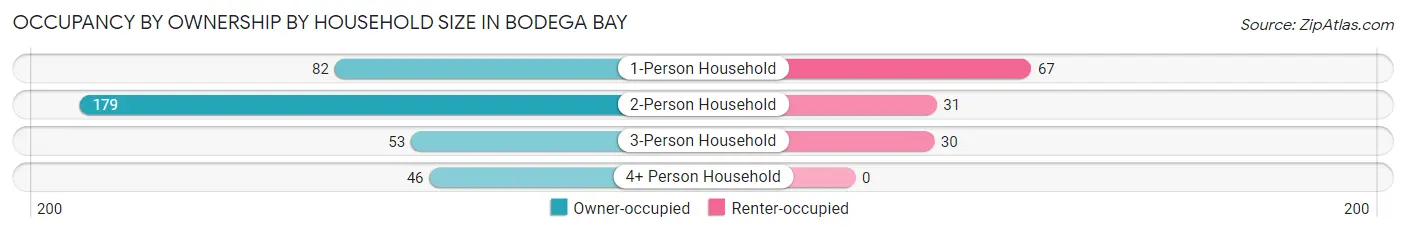
| Household Size | Owner-occupied | Renter-occupied |
| 1-Person Household | 82 (55.0%) | 67 (45.0%) |
| 2-Person Household | 179 (85.2%) | 31 (14.8%) |
| 3-Person Household | 53 (63.9%) | 30 (36.1%) |
| 4+ Person Household | 46 (100.0%) | 0 (0.0%) |
| Total Housing Units | 360 (73.8%) | 128 (26.2%) |
Occupancy by Educational Attainment in Bodega Bay
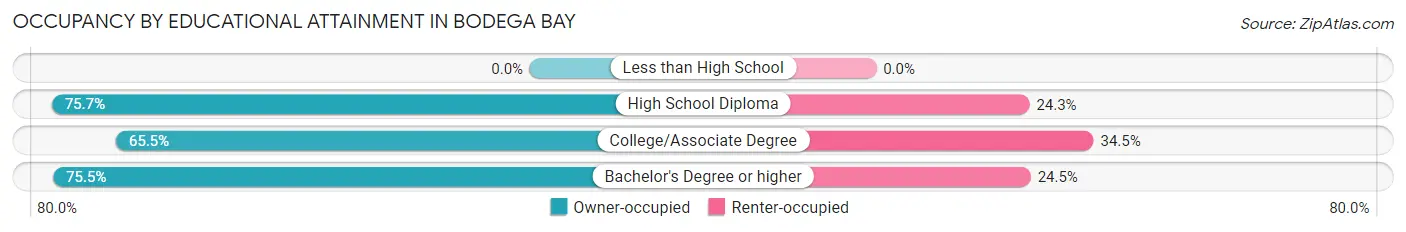
| Household Size | Owner-occupied | Renter-occupied |
| Less than High School | 0 (0.0%) | 0 (0.0%) |
| High School Diploma | 109 (75.7%) | 35 (24.3%) |
| College/Associate Degree | 57 (65.5%) | 30 (34.5%) |
| Bachelor's Degree or higher | 194 (75.5%) | 63 (24.5%) |
Occupancy by Age of Householder in Bodega Bay
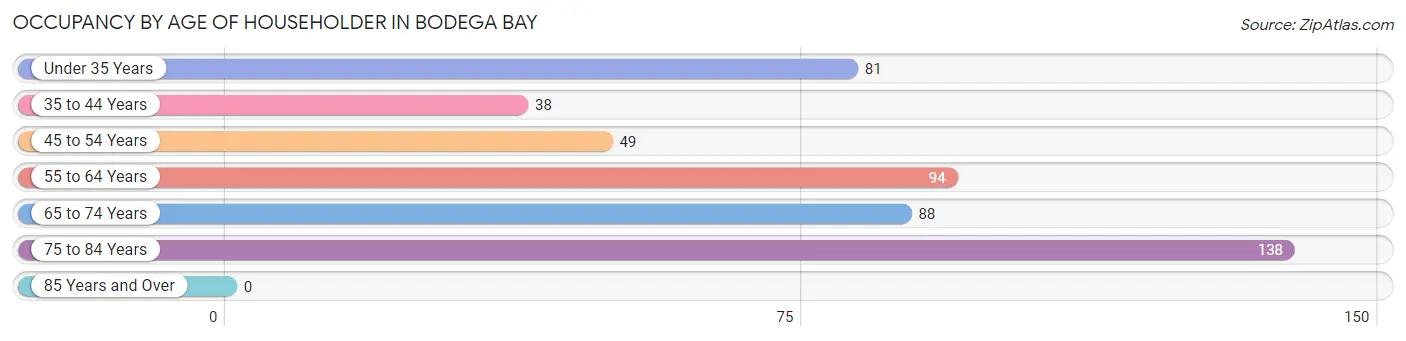
| Age Bracket | # Households | % Households |
| Under 35 Years | 81 | 16.6% |
| 35 to 44 Years | 38 | 7.8% |
| 45 to 54 Years | 49 | 10.0% |
| 55 to 64 Years | 94 | 19.3% |
| 65 to 74 Years | 88 | 18.0% |
| 75 to 84 Years | 138 | 28.3% |
| 85 Years and Over | 0 | 0.0% |
| Total | 488 | 100.0% |
Housing Finances in Bodega Bay
Median Income by Occupancy in Bodega Bay
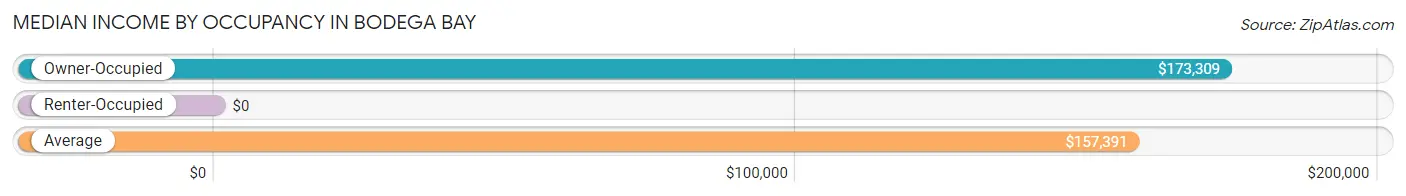
| Occupancy Type | # Households | Median Income |
| Owner-Occupied | 360 (73.8%) | $173,309 |
| Renter-Occupied | 128 (26.2%) | $0 |
| Average | 488 (100.0%) | $157,391 |
Occupancy by Householder Income Bracket in Bodega Bay
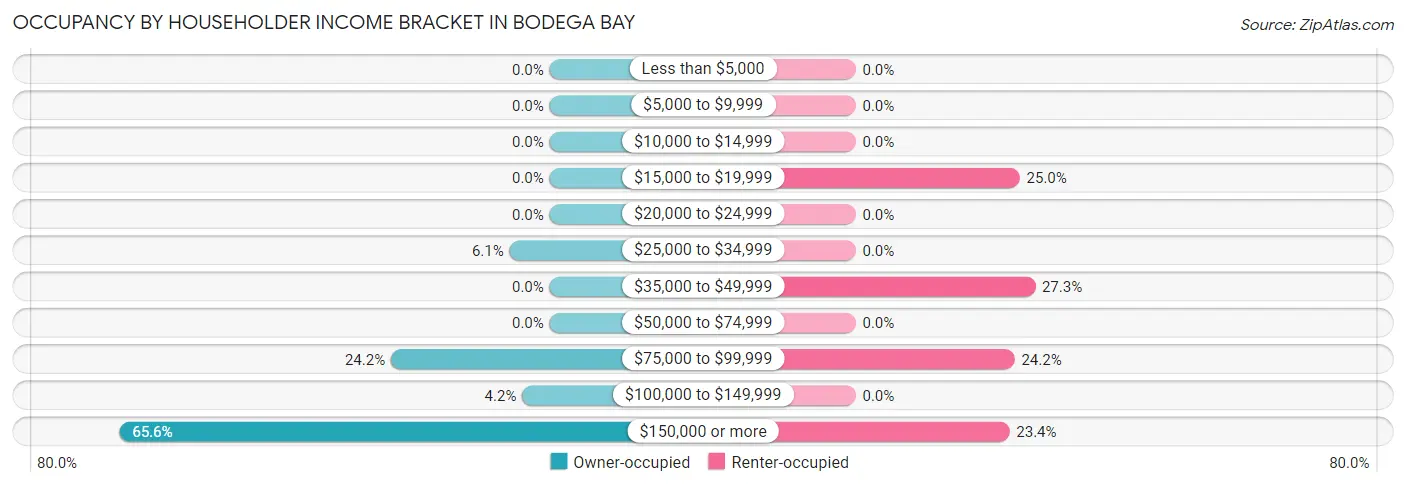
| Income Bracket | Owner-occupied | Renter-occupied |
| Less than $5,000 | 0 (0.0%) | 0 (0.0%) |
| $5,000 to $9,999 | 0 (0.0%) | 0 (0.0%) |
| $10,000 to $14,999 | 0 (0.0%) | 0 (0.0%) |
| $15,000 to $19,999 | 0 (0.0%) | 32 (25.0%) |
| $20,000 to $24,999 | 0 (0.0%) | 0 (0.0%) |
| $25,000 to $34,999 | 22 (6.1%) | 0 (0.0%) |
| $35,000 to $49,999 | 0 (0.0%) | 35 (27.3%) |
| $50,000 to $74,999 | 0 (0.0%) | 0 (0.0%) |
| $75,000 to $99,999 | 87 (24.2%) | 31 (24.2%) |
| $100,000 to $149,999 | 15 (4.2%) | 0 (0.0%) |
| $150,000 or more | 236 (65.6%) | 30 (23.4%) |
| Total | 360 (100.0%) | 128 (100.0%) |
Monthly Housing Cost Tiers in Bodega Bay
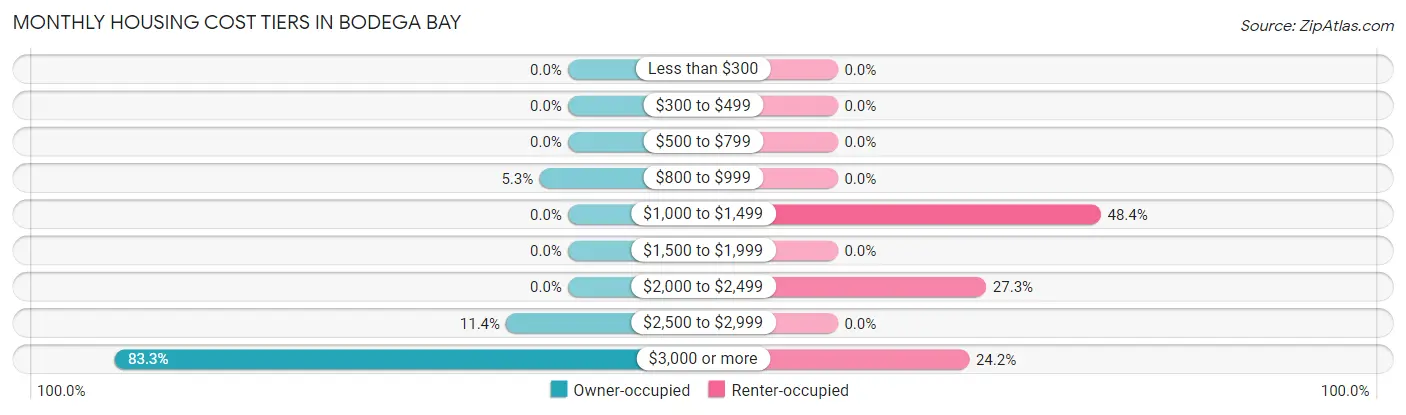
| Monthly Cost | Owner-occupied | Renter-occupied |
| Less than $300 | 0 (0.0%) | 0 (0.0%) |
| $300 to $499 | 0 (0.0%) | 0 (0.0%) |
| $500 to $799 | 0 (0.0%) | 0 (0.0%) |
| $800 to $999 | 19 (5.3%) | 0 (0.0%) |
| $1,000 to $1,499 | 0 (0.0%) | 62 (48.4%) |
| $1,500 to $1,999 | 0 (0.0%) | 0 (0.0%) |
| $2,000 to $2,499 | 0 (0.0%) | 35 (27.3%) |
| $2,500 to $2,999 | 41 (11.4%) | 0 (0.0%) |
| $3,000 or more | 300 (83.3%) | 31 (24.2%) |
| Total | 360 (100.0%) | 128 (100.0%) |
Physical Housing Characteristics in Bodega Bay
Housing Structures in Bodega Bay
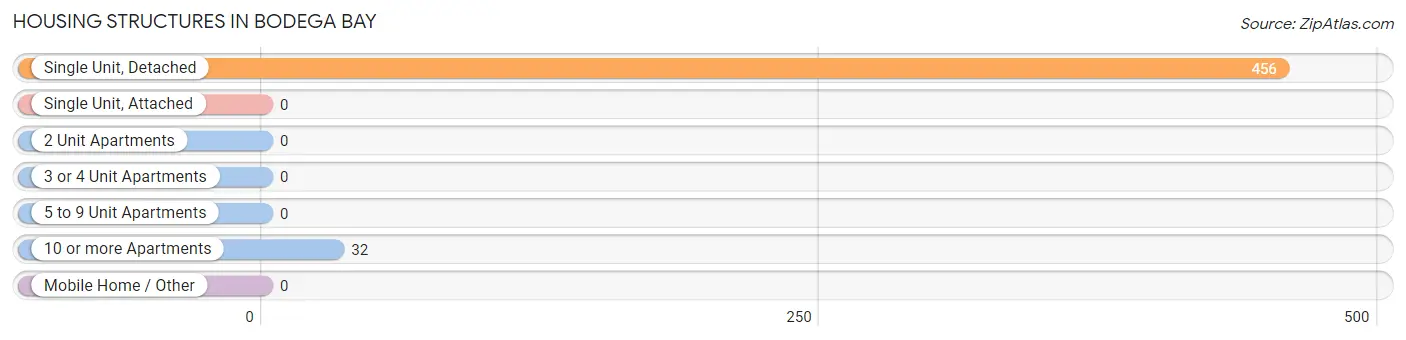
| Structure Type | # Housing Units | % Housing Units |
| Single Unit, Detached | 456 | 93.4% |
| Single Unit, Attached | 0 | 0.0% |
| 2 Unit Apartments | 0 | 0.0% |
| 3 or 4 Unit Apartments | 0 | 0.0% |
| 5 to 9 Unit Apartments | 0 | 0.0% |
| 10 or more Apartments | 32 | 6.6% |
| Mobile Home / Other | 0 | 0.0% |
| Total | 488 | 100.0% |
Housing Structures by Occupancy in Bodega Bay
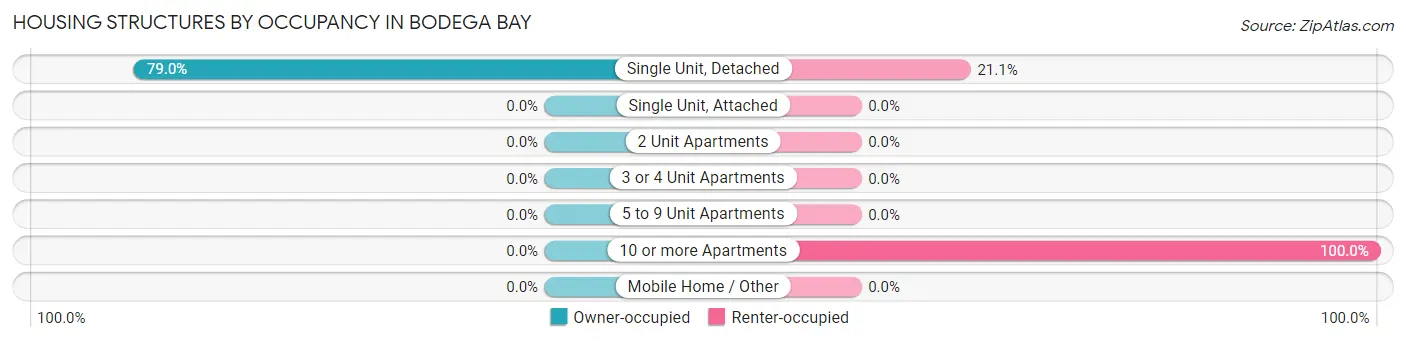
| Structure Type | Owner-occupied | Renter-occupied |
| Single Unit, Detached | 360 (78.9%) | 96 (21.0%) |
| Single Unit, Attached | 0 (0.0%) | 0 (0.0%) |
| 2 Unit Apartments | 0 (0.0%) | 0 (0.0%) |
| 3 or 4 Unit Apartments | 0 (0.0%) | 0 (0.0%) |
| 5 to 9 Unit Apartments | 0 (0.0%) | 0 (0.0%) |
| 10 or more Apartments | 0 (0.0%) | 32 (100.0%) |
| Mobile Home / Other | 0 (0.0%) | 0 (0.0%) |
| Total | 360 (73.8%) | 128 (26.2%) |
Housing Structures by Number of Rooms in Bodega Bay
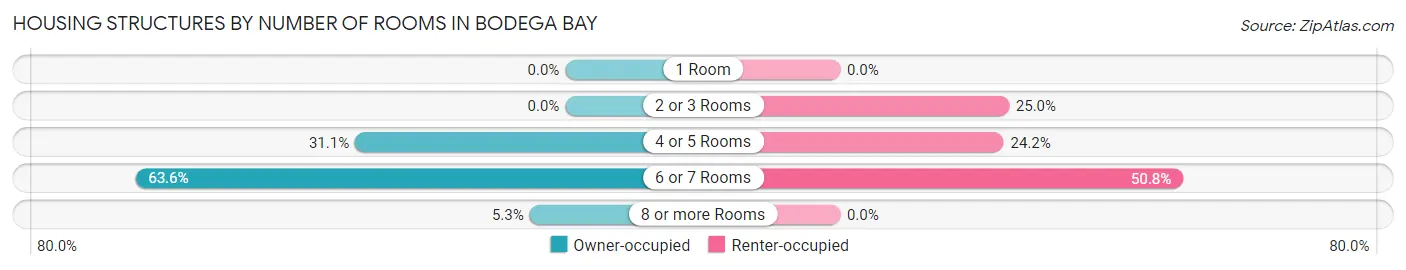
| Number of Rooms | Owner-occupied | Renter-occupied |
| 1 Room | 0 (0.0%) | 0 (0.0%) |
| 2 or 3 Rooms | 0 (0.0%) | 32 (25.0%) |
| 4 or 5 Rooms | 112 (31.1%) | 31 (24.2%) |
| 6 or 7 Rooms | 229 (63.6%) | 65 (50.8%) |
| 8 or more Rooms | 19 (5.3%) | 0 (0.0%) |
| Total | 360 (100.0%) | 128 (100.0%) |
Housing Structure by Heating Type in Bodega Bay
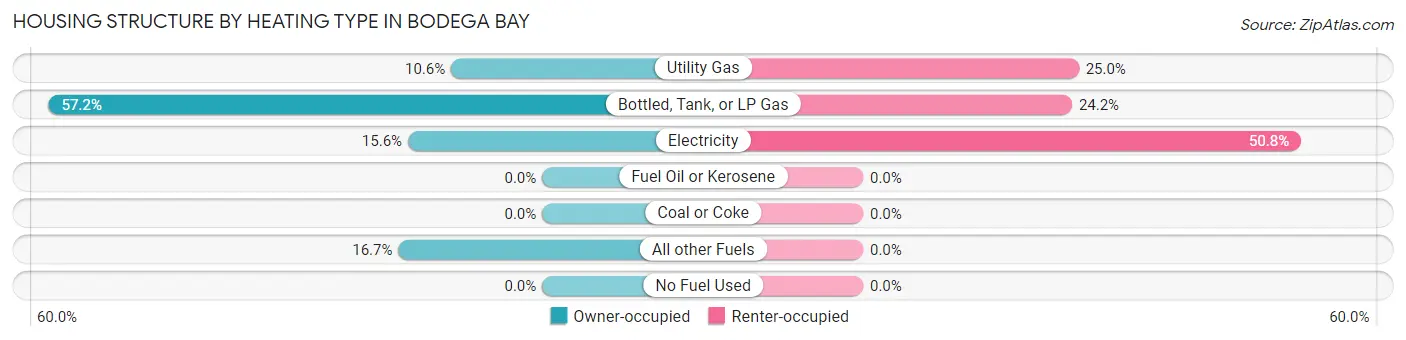
| Heating Type | Owner-occupied | Renter-occupied |
| Utility Gas | 38 (10.6%) | 32 (25.0%) |
| Bottled, Tank, or LP Gas | 206 (57.2%) | 31 (24.2%) |
| Electricity | 56 (15.6%) | 65 (50.8%) |
| Fuel Oil or Kerosene | 0 (0.0%) | 0 (0.0%) |
| Coal or Coke | 0 (0.0%) | 0 (0.0%) |
| All other Fuels | 60 (16.7%) | 0 (0.0%) |
| No Fuel Used | 0 (0.0%) | 0 (0.0%) |
| Total | 360 (100.0%) | 128 (100.0%) |
Household Vehicle Usage in Bodega Bay
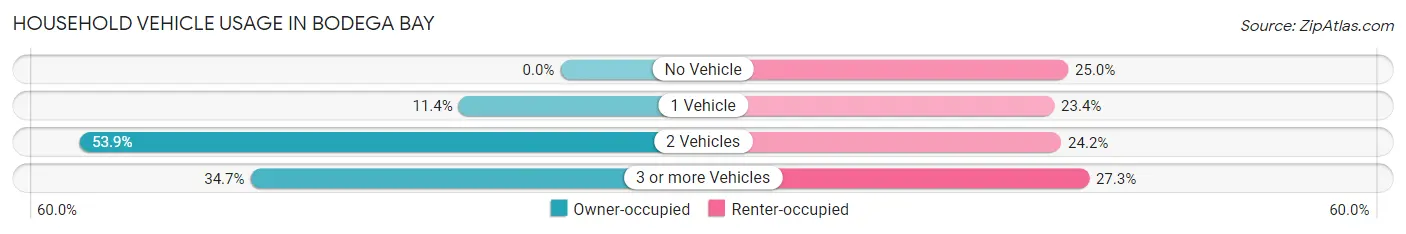
| Vehicles per Household | Owner-occupied | Renter-occupied |
| No Vehicle | 0 (0.0%) | 32 (25.0%) |
| 1 Vehicle | 41 (11.4%) | 30 (23.4%) |
| 2 Vehicles | 194 (53.9%) | 31 (24.2%) |
| 3 or more Vehicles | 125 (34.7%) | 35 (27.3%) |
| Total | 360 (100.0%) | 128 (100.0%) |
Real Estate & Mortgages in Bodega Bay
Real Estate and Mortgage Overview in Bodega Bay
| Characteristic | Without Mortgage | With Mortgage |
| Housing Units | 19 | 341 |
| Median Property Value | - | - |
| Median Household Income | - | - |
| Monthly Housing Costs | - | - |
| Real Estate Taxes | - | - |
Property Value by Mortgage Status in Bodega Bay
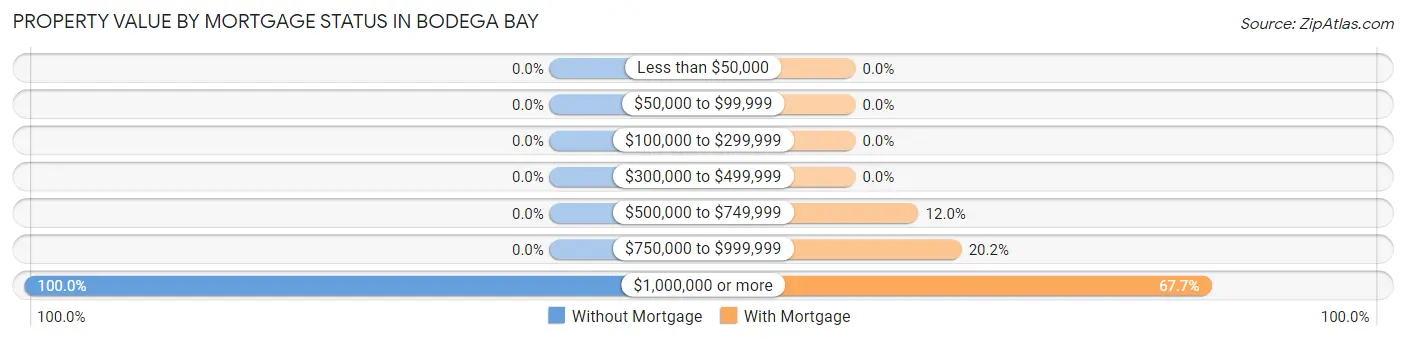
| Property Value | Without Mortgage | With Mortgage |
| Less than $50,000 | 0 (0.0%) | 0 (0.0%) |
| $50,000 to $99,999 | 0 (0.0%) | 0 (0.0%) |
| $100,000 to $299,999 | 0 (0.0%) | 0 (0.0%) |
| $300,000 to $499,999 | 0 (0.0%) | 0 (0.0%) |
| $500,000 to $749,999 | 0 (0.0%) | 41 (12.0%) |
| $750,000 to $999,999 | 0 (0.0%) | 69 (20.2%) |
| $1,000,000 or more | 19 (100.0%) | 231 (67.7%) |
| Total | 19 (100.0%) | 341 (100.0%) |
Household Income by Mortgage Status in Bodega Bay
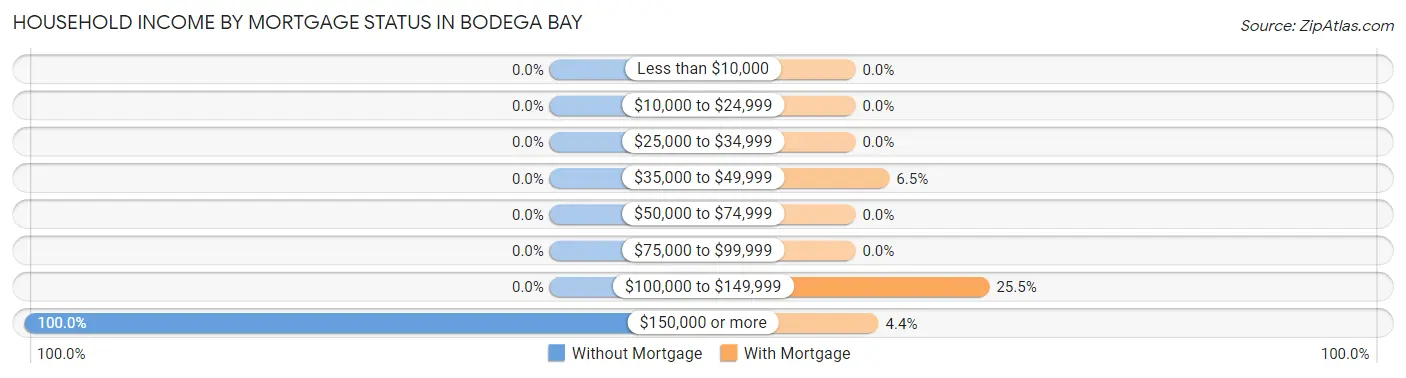
| Household Income | Without Mortgage | With Mortgage |
| Less than $10,000 | 0 (0.0%) | 0 (0.0%) |
| $10,000 to $24,999 | 0 (0.0%) | 0 (0.0%) |
| $25,000 to $34,999 | 0 (0.0%) | 0 (0.0%) |
| $35,000 to $49,999 | 0 (0.0%) | 22 (6.5%) |
| $50,000 to $74,999 | 0 (0.0%) | 0 (0.0%) |
| $75,000 to $99,999 | 0 (0.0%) | 0 (0.0%) |
| $100,000 to $149,999 | 0 (0.0%) | 87 (25.5%) |
| $150,000 or more | 19 (100.0%) | 15 (4.4%) |
| Total | 19 (100.0%) | 341 (100.0%) |
Property Value to Household Income Ratio in Bodega Bay
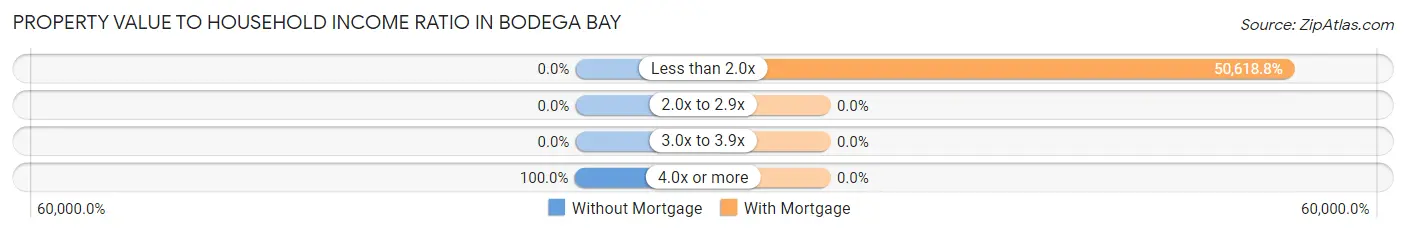
| Value-to-Income Ratio | Without Mortgage | With Mortgage |
| Less than 2.0x | 0 (0.0%) | 172,610 (50,618.8%) |
| 2.0x to 2.9x | 0 (0.0%) | 0 (0.0%) |
| 3.0x to 3.9x | 0 (0.0%) | 0 (0.0%) |
| 4.0x or more | 19 (100.0%) | 0 (0.0%) |
| Total | 19 (100.0%) | 341 (100.0%) |
Real Estate Taxes by Mortgage Status in Bodega Bay
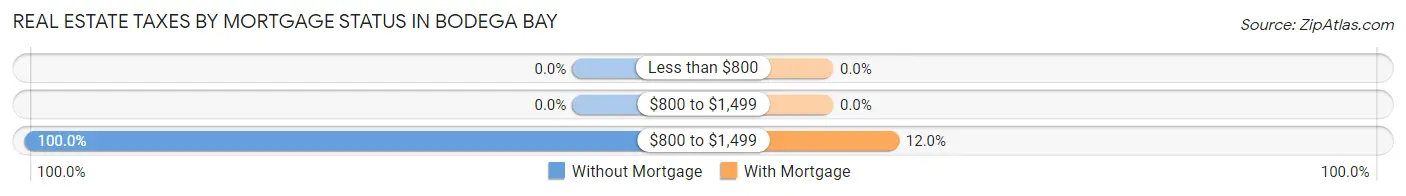
| Property Taxes | Without Mortgage | With Mortgage |
| Less than $800 | 0 (0.0%) | 0 (0.0%) |
| $800 to $1,499 | 0 (0.0%) | 0 (0.0%) |
| $800 to $1,499 | 19 (100.0%) | 41 (12.0%) |
| Total | 19 (100.0%) | 341 (100.0%) |
Health & Disability in Bodega Bay
Health Insurance Coverage by Age in Bodega Bay
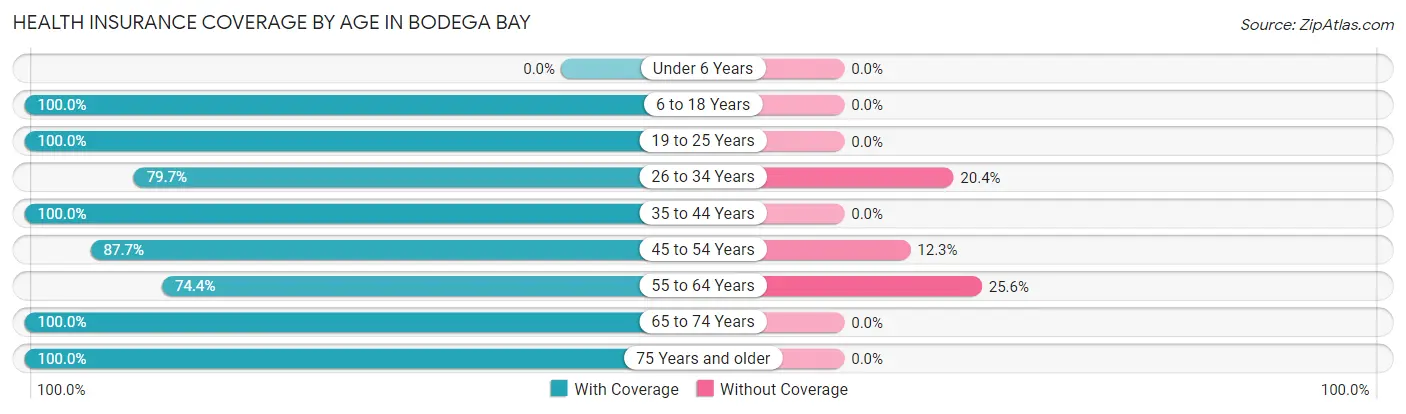
| Age Bracket | With Coverage | Without Coverage |
| Under 6 Years | 0 (0.0%) | 0 (0.0%) |
| 6 to 18 Years | 143 (100.0%) | 0 (0.0%) |
| 19 to 25 Years | 27 (100.0%) | 0 (0.0%) |
| 26 to 34 Years | 137 (79.6%) | 35 (20.3%) |
| 35 to 44 Years | 38 (100.0%) | 0 (0.0%) |
| 45 to 54 Years | 249 (87.7%) | 35 (12.3%) |
| 55 to 64 Years | 87 (74.4%) | 30 (25.6%) |
| 65 to 74 Years | 204 (100.0%) | 0 (0.0%) |
| 75 Years and older | 180 (100.0%) | 0 (0.0%) |
| Total | 1,065 (91.4%) | 100 (8.6%) |
Health Insurance Coverage by Citizenship Status in Bodega Bay
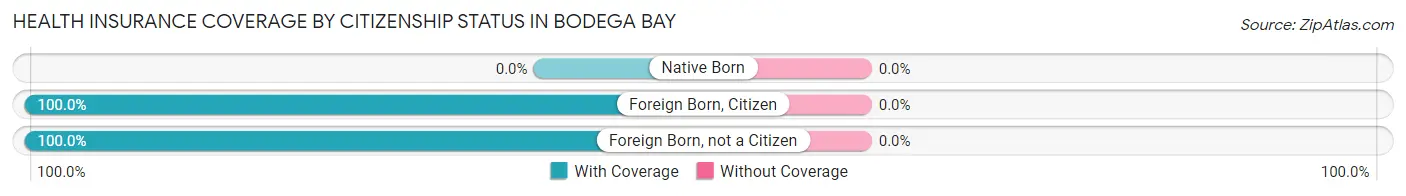
| Citizenship Status | With Coverage | Without Coverage |
| Native Born | 0 (0.0%) | 0 (0.0%) |
| Foreign Born, Citizen | 143 (100.0%) | 0 (0.0%) |
| Foreign Born, not a Citizen | 27 (100.0%) | 0 (0.0%) |
Health Insurance Coverage by Household Income in Bodega Bay
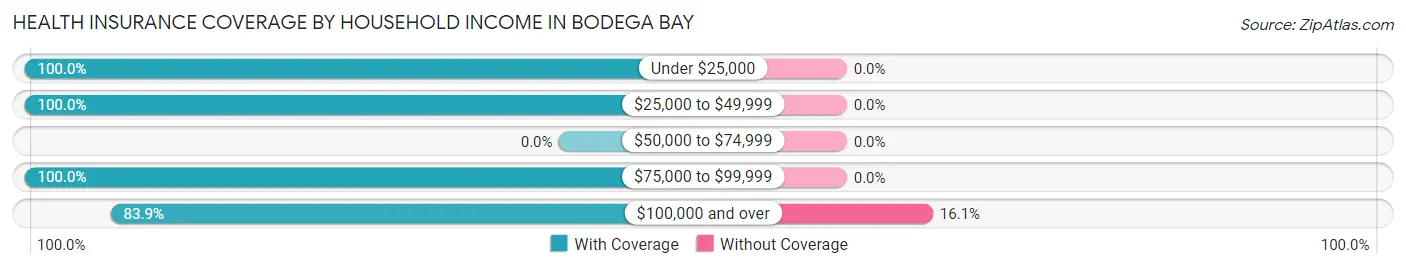
| Household Income | With Coverage | Without Coverage |
| Under $25,000 | 32 (100.0%) | 0 (0.0%) |
| $25,000 to $49,999 | 80 (100.0%) | 0 (0.0%) |
| $50,000 to $74,999 | 0 (0.0%) | 0 (0.0%) |
| $75,000 to $99,999 | 392 (100.0%) | 0 (0.0%) |
| $100,000 and over | 520 (83.9%) | 100 (16.1%) |
Public vs Private Health Insurance Coverage by Age in Bodega Bay
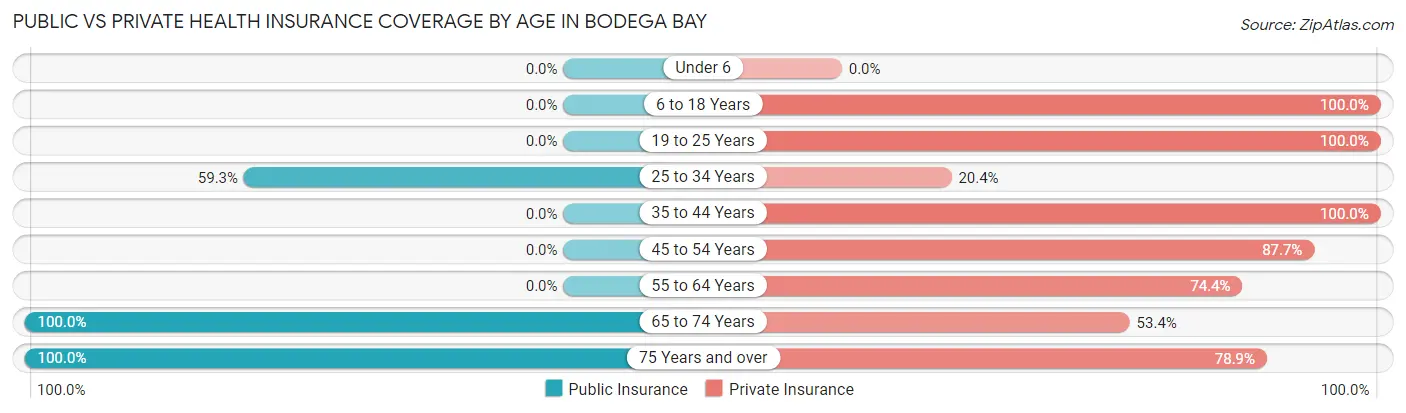
| Age Bracket | Public Insurance | Private Insurance |
| Under 6 | 0 (0.0%) | 0 (0.0%) |
| 6 to 18 Years | 0 (0.0%) | 143 (100.0%) |
| 19 to 25 Years | 0 (0.0%) | 27 (100.0%) |
| 25 to 34 Years | 102 (59.3%) | 35 (20.3%) |
| 35 to 44 Years | 0 (0.0%) | 38 (100.0%) |
| 45 to 54 Years | 0 (0.0%) | 249 (87.7%) |
| 55 to 64 Years | 0 (0.0%) | 87 (74.4%) |
| 65 to 74 Years | 204 (100.0%) | 109 (53.4%) |
| 75 Years and over | 180 (100.0%) | 142 (78.9%) |
| Total | 486 (41.7%) | 830 (71.2%) |
Disability Status by Sex by Age in Bodega Bay
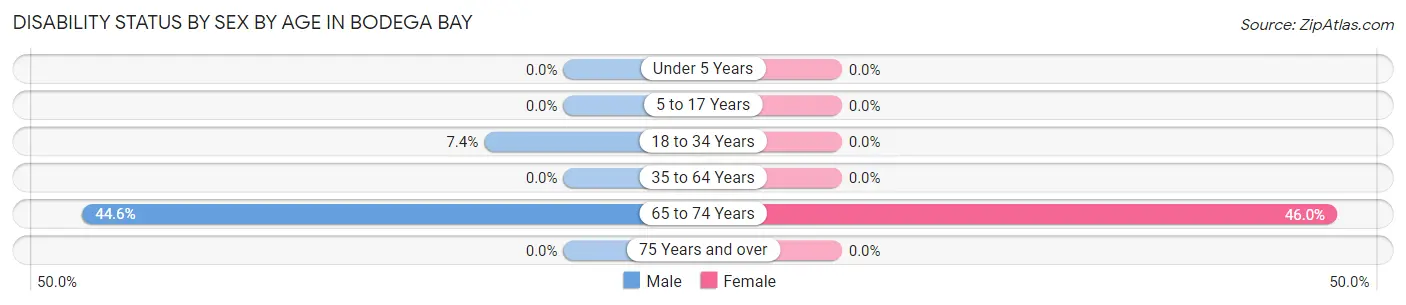
| Age Bracket | Male | Female |
| Under 5 Years | 0 (0.0%) | 0 (0.0%) |
| 5 to 17 Years | 0 (0.0%) | 0 (0.0%) |
| 18 to 34 Years | 12 (7.4%) | 0 (0.0%) |
| 35 to 64 Years | 0 (0.0%) | 0 (0.0%) |
| 65 to 74 Years | 25 (44.6%) | 68 (46.0%) |
| 75 Years and over | 0 (0.0%) | 0 (0.0%) |
Disability Class by Sex by Age in Bodega Bay
Disability Class: Hearing Difficulty
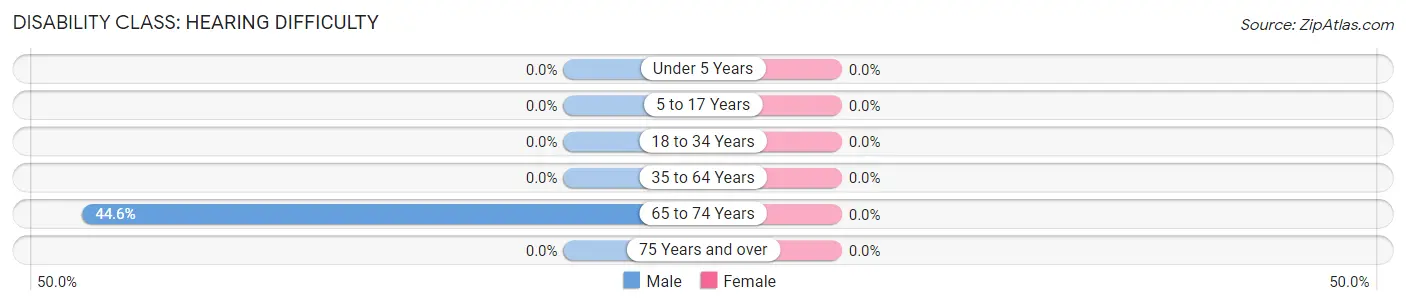
| Age Bracket | Male | Female |
| Under 5 Years | 0 (0.0%) | 0 (0.0%) |
| 5 to 17 Years | 0 (0.0%) | 0 (0.0%) |
| 18 to 34 Years | 0 (0.0%) | 0 (0.0%) |
| 35 to 64 Years | 0 (0.0%) | 0 (0.0%) |
| 65 to 74 Years | 25 (44.6%) | 0 (0.0%) |
| 75 Years and over | 0 (0.0%) | 0 (0.0%) |
Disability Class: Vision Difficulty
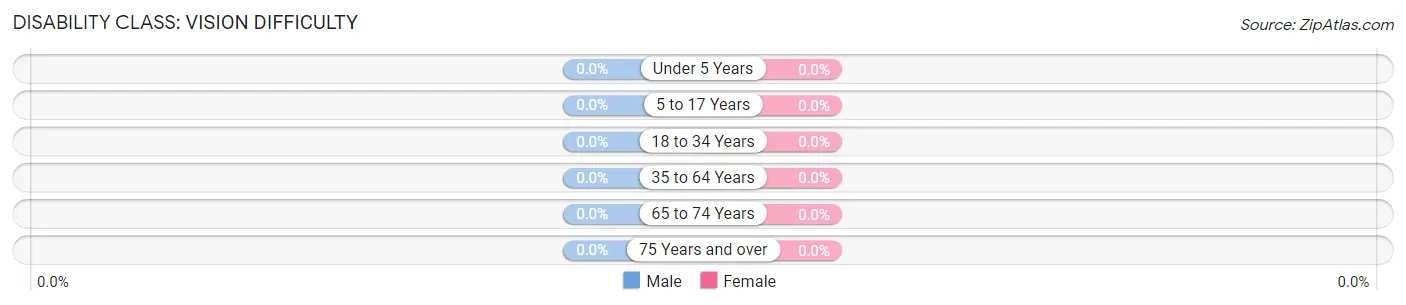
| Age Bracket | Male | Female |
| Under 5 Years | 0 (0.0%) | 0 (0.0%) |
| 5 to 17 Years | 0 (0.0%) | 0 (0.0%) |
| 18 to 34 Years | 0 (0.0%) | 0 (0.0%) |
| 35 to 64 Years | 0 (0.0%) | 0 (0.0%) |
| 65 to 74 Years | 0 (0.0%) | 0 (0.0%) |
| 75 Years and over | 0 (0.0%) | 0 (0.0%) |
Disability Class: Cognitive Difficulty
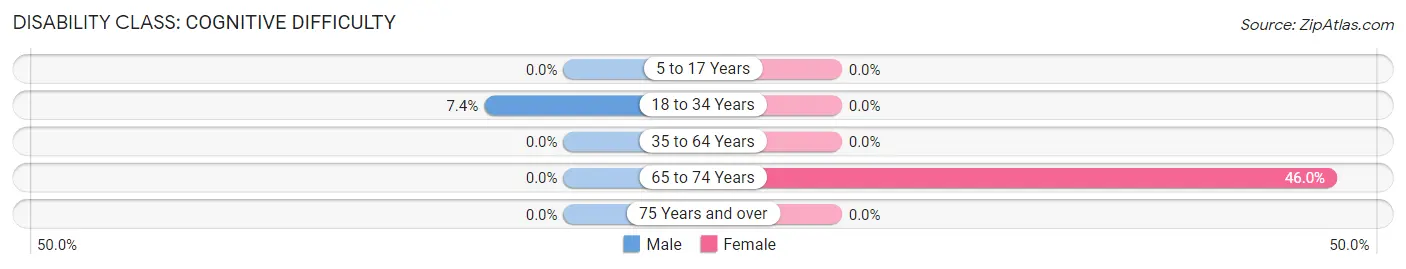
| Age Bracket | Male | Female |
| 5 to 17 Years | 0 (0.0%) | 0 (0.0%) |
| 18 to 34 Years | 12 (7.4%) | 0 (0.0%) |
| 35 to 64 Years | 0 (0.0%) | 0 (0.0%) |
| 65 to 74 Years | 0 (0.0%) | 68 (46.0%) |
| 75 Years and over | 0 (0.0%) | 0 (0.0%) |
Disability Class: Ambulatory Difficulty
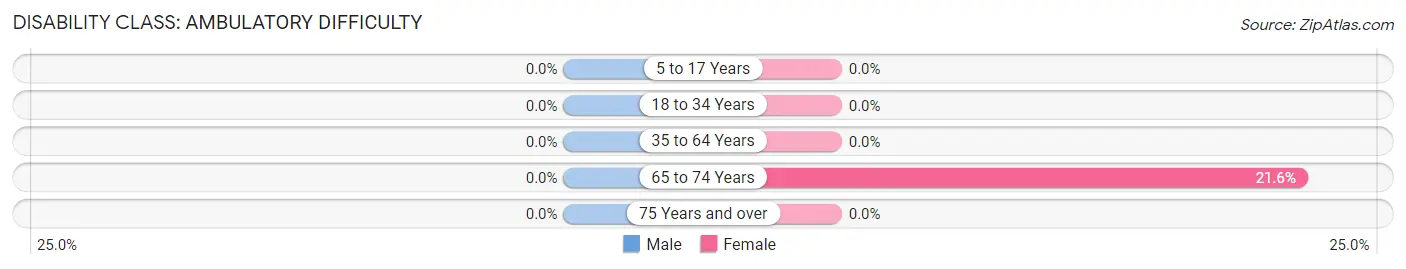
| Age Bracket | Male | Female |
| 5 to 17 Years | 0 (0.0%) | 0 (0.0%) |
| 18 to 34 Years | 0 (0.0%) | 0 (0.0%) |
| 35 to 64 Years | 0 (0.0%) | 0 (0.0%) |
| 65 to 74 Years | 0 (0.0%) | 32 (21.6%) |
| 75 Years and over | 0 (0.0%) | 0 (0.0%) |
Disability Class: Self-Care Difficulty
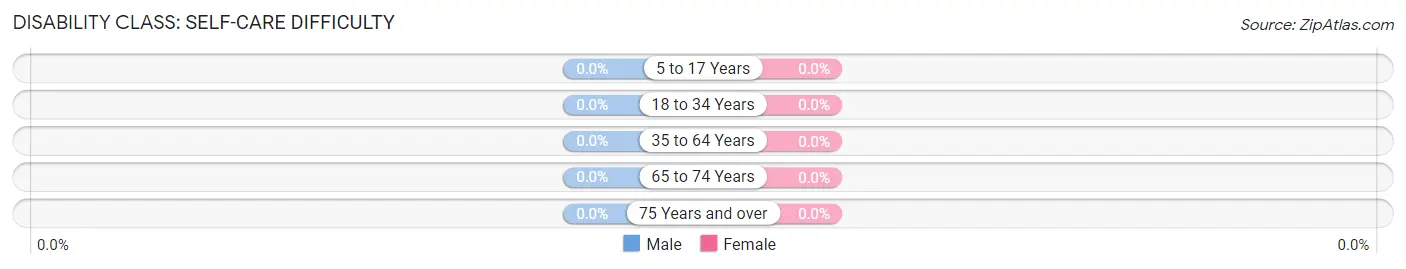
| Age Bracket | Male | Female |
| 5 to 17 Years | 0 (0.0%) | 0 (0.0%) |
| 18 to 34 Years | 0 (0.0%) | 0 (0.0%) |
| 35 to 64 Years | 0 (0.0%) | 0 (0.0%) |
| 65 to 74 Years | 0 (0.0%) | 0 (0.0%) |
| 75 Years and over | 0 (0.0%) | 0 (0.0%) |
Technology Access in Bodega Bay
Computing Device Access in Bodega Bay
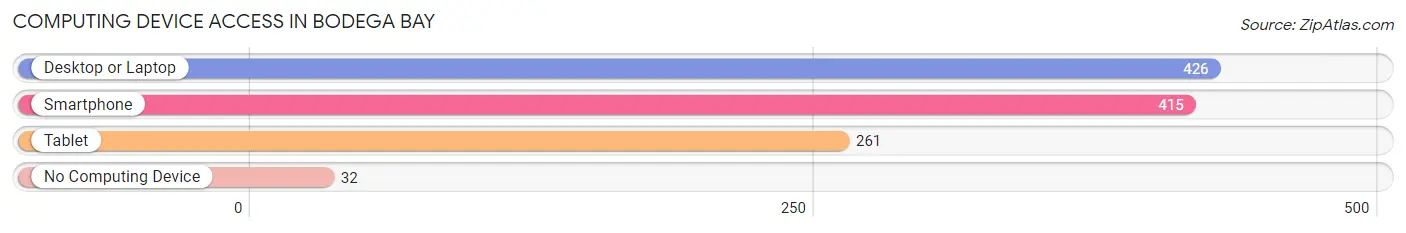
| Device Type | # Households | % Households |
| Desktop or Laptop | 426 | 87.3% |
| Smartphone | 415 | 85.0% |
| Tablet | 261 | 53.5% |
| No Computing Device | 32 | 6.6% |
| Total | 488 | 100.0% |
Internet Access in Bodega Bay
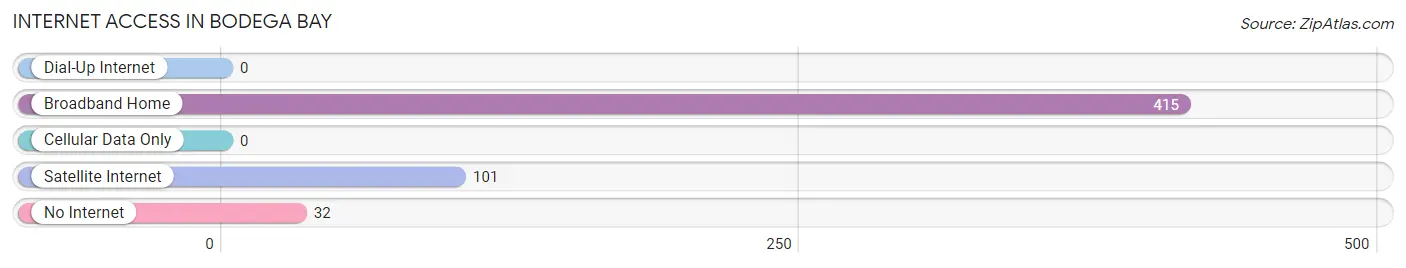
| Internet Type | # Households | % Households |
| Dial-Up Internet | 0 | 0.0% |
| Broadband Home | 415 | 85.0% |
| Cellular Data Only | 0 | 0.0% |
| Satellite Internet | 101 | 20.7% |
| No Internet | 32 | 6.6% |
| Total | 488 | 100.0% |
Bodega Bay Summary
Bodega Bay is a small coastal town located in Sonoma County, California, United States. It is situated on the Pacific Ocean, approximately 50 miles north of San Francisco. The town is known for its picturesque views, rugged coastline, and abundance of wildlife. Bodega Bay is a popular tourist destination, offering a variety of activities such as fishing, kayaking, and whale watching.
History
The area now known as Bodega Bay was first inhabited by the Coast Miwok Native Americans. The first European to explore the area was Spanish explorer Sebastián Vizcaíno, who arrived in 1603. The area was later explored by Russian fur traders in the late 18th century.
In 1822, the Spanish government granted the land to the Russian-American Company, which established a trading post in the area. The post was abandoned in 1841, and the land was later acquired by the United States government.
In the late 19th century, the area was settled by a number of European immigrants, including Italians, Portuguese, and Russians. The town of Bodega Bay was officially established in 1867.
Geography
Bodega Bay is located on the Pacific Coast of California, approximately 50 miles north of San Francisco. The town is situated on a small bay, which is surrounded by rugged cliffs and rocky shorelines. The bay is home to a variety of marine life, including seals, sea lions, and whales.
The town is located in a temperate climate zone, with mild winters and warm summers. The average annual temperature is approximately 57°F (14°C).
Economy
The economy of Bodega Bay is largely based on tourism. The town is a popular destination for fishing, kayaking, and whale watching. There are also several restaurants, hotels, and shops in the area.
The town is also home to a number of commercial fishing operations, which provide a variety of seafood to local restaurants and markets.
Demographics
As of the 2010 census, the population of Bodega Bay was 1,077. The racial makeup of the town was 87.3% White, 0.7% African American, 0.7% Native American, 0.7% Asian, 0.2% Pacific Islander, and 10.1% from other races.
The median household income in Bodega Bay was $50,938, and the median family income was $60,000. The per capita income was $25,938.
Conclusion
Bodega Bay is a small coastal town located in Sonoma County, California. It is known for its picturesque views, rugged coastline, and abundance of wildlife. The town is a popular tourist destination, offering a variety of activities such as fishing, kayaking, and whale watching. The economy of Bodega Bay is largely based on tourism, and the town is also home to a number of commercial fishing operations. As of the 2010 census, the population of Bodega Bay was 1,077.
Common Questions
What is Per Capita Income in Bodega Bay?
Per Capita income in Bodega Bay is $67,901.
What is the Median Family Income in Bodega Bay?
Median Family Income in Bodega Bay is $172,045.
What is the Median Household income in Bodega Bay?
Median Household Income in Bodega Bay is $157,391.
What is Inequality or Gini Index in Bodega Bay?
Inequality or Gini Index in Bodega Bay is 0.38.
What is the Total Population of Bodega Bay?
Total Population of Bodega Bay is 1,186.
What is the Total Male Population of Bodega Bay?
Total Male Population of Bodega Bay is 727.
What is the Total Female Population of Bodega Bay?
Total Female Population of Bodega Bay is 459.
What is the Ratio of Males per 100 Females in Bodega Bay?
There are 158.39 Males per 100 Females in Bodega Bay.
What is the Ratio of Females per 100 Males in Bodega Bay?
There are 63.14 Females per 100 Males in Bodega Bay.
What is the Median Population Age in Bodega Bay?
Median Population Age in Bodega Bay is 53.1 Years.
What is the Average Family Size in Bodega Bay
Average Family Size in Bodega Bay is 2.9 People.
What is the Average Household Size in Bodega Bay
Average Household Size in Bodega Bay is 2.3 People.
How Large is the Labor Force in Bodega Bay?
There are 691 People in the Labor Forcein in Bodega Bay.
What is the Percentage of People in the Labor Force in Bodega Bay?
59.1% of People are in the Labor Force in Bodega Bay.
What is the Unemployment Rate in Bodega Bay?
Unemployment Rate in Bodega Bay is 19.0%.