Cities with the Highest Percentage of Population Employed in Architecture & Engineering in Kansas
RELATED REPORTS & OPTIONS
Architecture & Engineering
Kansas
Compare Cities
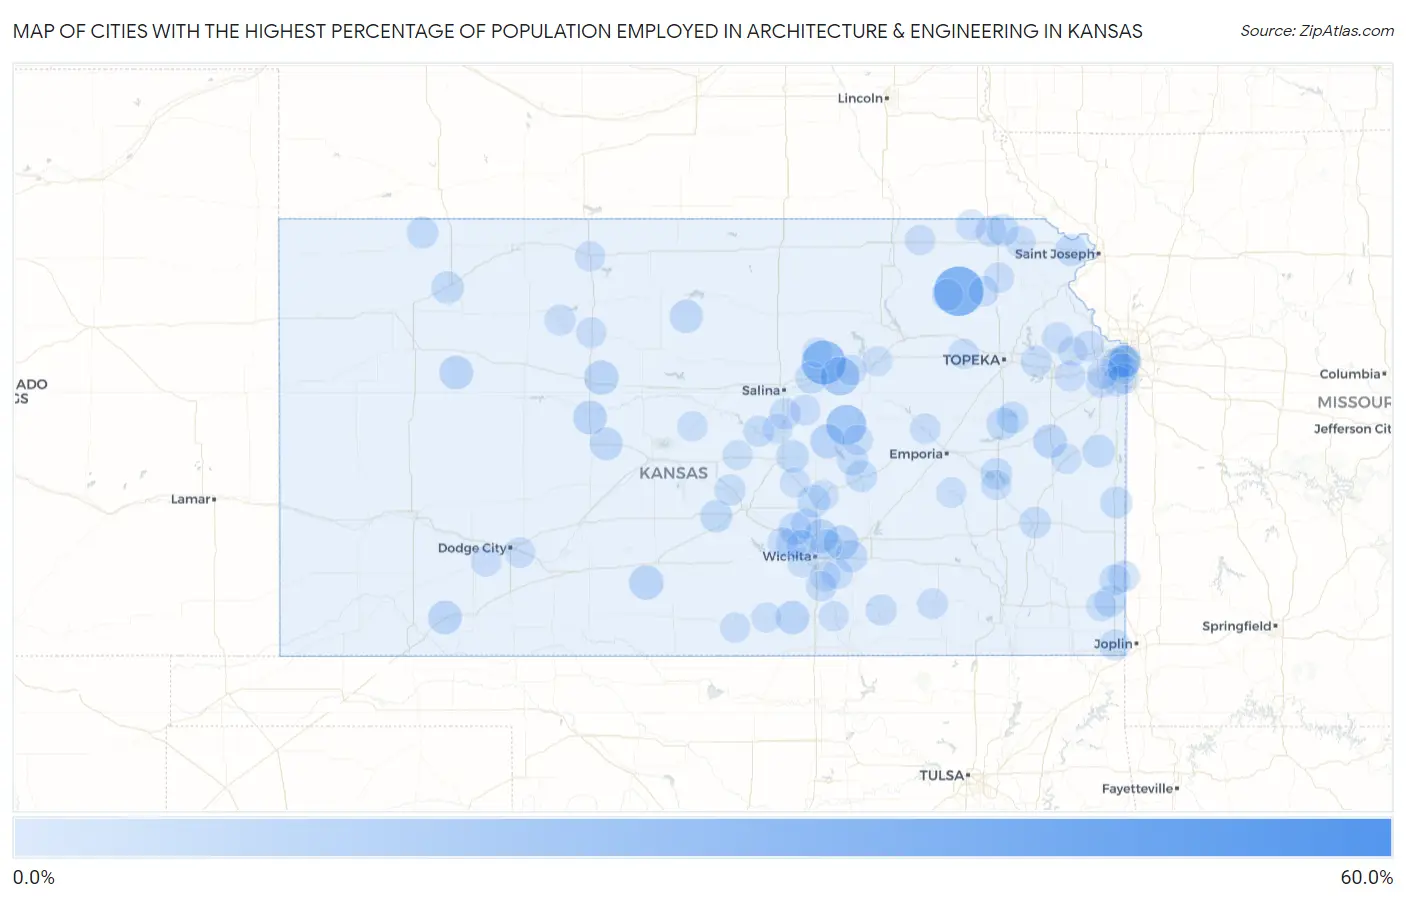
Map of Cities with the Highest Percentage of Population Employed in Architecture & Engineering in Kansas
0.0%
60.0%
Cities with the Highest Percentage of Population Employed in Architecture & Engineering in Kansas
| City | % Employed | vs State | vs National | |
| 1. | Ludell | 57.1% | 2.0%(+55.1)#1 | 2.1%(+55.0)#18 |
| 2. | Elyria | 46.7% | 2.0%(+44.7)#2 | 2.1%(+44.6)#31 |
| 3. | Havensville | 33.0% | 2.0%(+30.9)#3 | 2.1%(+30.8)#50 |
| 4. | Talmage | 24.1% | 2.0%(+22.1)#4 | 2.1%(+22.0)#94 |
| 5. | Furley | 21.4% | 2.0%(+19.4)#5 | 2.1%(+19.3)#116 |
| 6. | Ramona | 18.0% | 2.0%(+16.0)#6 | 2.1%(+15.9)#157 |
| 7. | Detroit | 15.4% | 2.0%(+13.3)#7 | 2.1%(+13.2)#217 |
| 8. | Benton | 9.1% | 2.0%(+7.08)#8 | 2.1%(+6.98)#560 |
| 9. | Coats | 9.1% | 2.0%(+7.05)#9 | 2.1%(+6.94)#566 |
| 10. | Durham | 9.1% | 2.0%(+7.05)#10 | 2.1%(+6.94)#568 |
| 11. | Catharine | 9.0% | 2.0%(+6.95)#11 | 2.1%(+6.84)#579 |
| 12. | Plains | 8.2% | 2.0%(+6.11)#12 | 2.1%(+6.00)#694 |
| 13. | Gove City | 8.1% | 2.0%(+6.02)#13 | 2.1%(+5.92)#711 |
| 14. | Princeton | 8.0% | 2.0%(+5.99)#14 | 2.1%(+5.89)#720 |
| 15. | Liebenthal | 8.0% | 2.0%(+5.96)#15 | 2.1%(+5.85)#725 |
| 16. | Kechi | 7.9% | 2.0%(+5.88)#16 | 2.1%(+5.77)#737 |
| 17. | Mayfield | 7.7% | 2.0%(+5.65)#17 | 2.1%(+5.54)#774 |
| 18. | Tipton | 7.2% | 2.0%(+5.20)#18 | 2.1%(+5.10)#861 |
| 19. | Timken | 6.7% | 2.0%(+4.63)#19 | 2.1%(+4.52)#1,003 |
| 20. | Galva | 6.5% | 2.0%(+4.49)#20 | 2.1%(+4.38)#1,039 |
| 21. | Fontana | 6.3% | 2.0%(+4.25)#21 | 2.1%(+4.14)#1,118 |
| 22. | Selden | 6.2% | 2.0%(+4.14)#22 | 2.1%(+4.03)#1,169 |
| 23. | Bentley | 6.1% | 2.0%(+4.08)#23 | 2.1%(+3.97)#1,184 |
| 24. | Westwood Hills | 6.1% | 2.0%(+4.08)#24 | 2.1%(+3.97)#1,185 |
| 25. | North Newton | 6.1% | 2.0%(+4.07)#25 | 2.1%(+3.96)#1,193 |
| 26. | Roeland Park | 6.0% | 2.0%(+4.00)#26 | 2.1%(+3.89)#1,221 |
| 27. | Lyndon | 6.0% | 2.0%(+3.91)#27 | 2.1%(+3.81)#1,263 |
| 28. | Abbyville | 5.7% | 2.0%(+3.67)#28 | 2.1%(+3.57)#1,387 |
| 29. | Solomon | 5.6% | 2.0%(+3.58)#29 | 2.1%(+3.47)#1,435 |
| 30. | Troy | 5.4% | 2.0%(+3.38)#30 | 2.1%(+3.27)#1,550 |
| 31. | Morrill | 5.4% | 2.0%(+3.36)#31 | 2.1%(+3.26)#1,564 |
| 32. | Vassar | 5.2% | 2.0%(+3.17)#32 | 2.1%(+3.07)#1,685 |
| 33. | Prescott | 5.2% | 2.0%(+3.15)#33 | 2.1%(+3.05)#1,697 |
| 34. | Florence | 5.2% | 2.0%(+3.15)#34 | 2.1%(+3.04)#1,700 |
| 35. | Augusta | 5.2% | 2.0%(+3.13)#35 | 2.1%(+3.03)#1,709 |
| 36. | Bel Aire | 4.9% | 2.0%(+2.90)#36 | 2.1%(+2.80)#1,870 |
| 37. | New Strawn | 4.9% | 2.0%(+2.85)#37 | 2.1%(+2.74)#1,907 |
| 38. | Chicopee | 4.8% | 2.0%(+2.72)#38 | 2.1%(+2.61)#2,007 |
| 39. | Herndon | 4.8% | 2.0%(+2.72)#39 | 2.1%(+2.61)#2,010 |
| 40. | Iola | 4.6% | 2.0%(+2.58)#40 | 2.1%(+2.47)#2,124 |
| 41. | Westwood | 4.5% | 2.0%(+2.50)#41 | 2.1%(+2.40)#2,186 |
| 42. | Onaga | 4.5% | 2.0%(+2.48)#42 | 2.1%(+2.38)#2,212 |
| 43. | Mulberry | 4.3% | 2.0%(+2.27)#43 | 2.1%(+2.17)#2,391 |
| 44. | Sabetha | 4.2% | 2.0%(+2.19)#44 | 2.1%(+2.09)#2,471 |
| 45. | Franklin | 4.2% | 2.0%(+2.14)#45 | 2.1%(+2.03)#2,552 |
| 46. | Merriam | 4.1% | 2.0%(+2.02)#46 | 2.1%(+1.92)#2,691 |
| 47. | Lecompton | 4.1% | 2.0%(+2.02)#47 | 2.1%(+1.91)#2,701 |
| 48. | Marion | 4.0% | 2.0%(+2.01)#48 | 2.1%(+1.90)#2,717 |
| 49. | Nickerson | 4.0% | 2.0%(+1.95)#49 | 2.1%(+1.84)#2,785 |
| 50. | Riverton | 3.9% | 2.0%(+1.87)#50 | 2.1%(+1.77)#2,879 |
| 51. | Burden | 3.9% | 2.0%(+1.85)#51 | 2.1%(+1.75)#2,904 |
| 52. | Marquette | 3.9% | 2.0%(+1.83)#52 | 2.1%(+1.72)#2,937 |
| 53. | Assaria | 3.8% | 2.0%(+1.77)#53 | 2.1%(+1.66)#3,005 |
| 54. | Damar | 3.8% | 2.0%(+1.76)#54 | 2.1%(+1.65)#3,022 |
| 55. | Hiawatha | 3.8% | 2.0%(+1.74)#55 | 2.1%(+1.63)#3,047 |
| 56. | Basehor | 3.7% | 2.0%(+1.70)#56 | 2.1%(+1.59)#3,101 |
| 57. | Colwich | 3.7% | 2.0%(+1.64)#57 | 2.1%(+1.54)#3,203 |
| 58. | Gypsum | 3.6% | 2.0%(+1.53)#58 | 2.1%(+1.42)#3,393 |
| 59. | Mclouth | 3.6% | 2.0%(+1.51)#59 | 2.1%(+1.41)#3,426 |
| 60. | Moline | 3.5% | 2.0%(+1.44)#60 | 2.1%(+1.33)#3,567 |
| 61. | Dunlap | 3.4% | 2.0%(+1.41)#61 | 2.1%(+1.30)#3,626 |
| 62. | Rose Hill | 3.4% | 2.0%(+1.38)#62 | 2.1%(+1.27)#3,685 |
| 63. | Lincolnville | 3.4% | 2.0%(+1.33)#63 | 2.1%(+1.22)#3,781 |
| 64. | Ensign | 3.3% | 2.0%(+1.29)#64 | 2.1%(+1.18)#3,852 |
| 65. | Bern | 3.3% | 2.0%(+1.29)#65 | 2.1%(+1.18)#3,854 |
| 66. | Overland Park | 3.3% | 2.0%(+1.24)#66 | 2.1%(+1.13)#3,928 |
| 67. | Derby | 3.2% | 2.0%(+1.21)#67 | 2.1%(+1.10)#3,999 |
| 68. | Wilroads Gardens | 3.2% | 2.0%(+1.20)#68 | 2.1%(+1.09)#4,009 |
| 69. | Sedgwick | 3.2% | 2.0%(+1.19)#69 | 2.1%(+1.08)#4,036 |
| 70. | Netawaka | 3.2% | 2.0%(+1.18)#70 | 2.1%(+1.08)#4,052 |
| 71. | Plainville | 3.2% | 2.0%(+1.17)#71 | 2.1%(+1.06)#4,074 |
| 72. | Leawood | 3.2% | 2.0%(+1.15)#72 | 2.1%(+1.04)#4,121 |
| 73. | Olathe | 3.2% | 2.0%(+1.14)#73 | 2.1%(+1.03)#4,146 |
| 74. | Chapman | 3.1% | 2.0%(+1.09)#74 | 2.1%(+0.982)#4,256 |
| 75. | Mulvane | 3.1% | 2.0%(+1.08)#75 | 2.1%(+0.974)#4,290 |
| 76. | Lenexa | 3.1% | 2.0%(+1.06)#76 | 2.1%(+0.951)#4,334 |
| 77. | Maple Hill | 3.1% | 2.0%(+1.02)#77 | 2.1%(+0.916)#4,410 |
| 78. | Eudora | 3.1% | 2.0%(+1.02)#78 | 2.1%(+0.916)#4,411 |
| 79. | Beattie | 3.0% | 2.0%(+0.943)#79 | 2.1%(+0.836)#4,626 |
| 80. | Circleville | 3.0% | 2.0%(+0.943)#80 | 2.1%(+0.836)#4,629 |
| 81. | Prairie Village | 3.0% | 2.0%(+0.936)#81 | 2.1%(+0.828)#4,643 |
| 82. | Andale | 2.9% | 2.0%(+0.878)#82 | 2.1%(+0.770)#4,797 |
| 83. | Phillipsburg | 2.9% | 2.0%(+0.863)#83 | 2.1%(+0.755)#4,831 |
| 84. | Madison | 2.9% | 2.0%(+0.841)#84 | 2.1%(+0.733)#4,895 |
| 85. | Argonia | 2.8% | 2.0%(+0.789)#85 | 2.1%(+0.681)#5,026 |
| 86. | Cherokee | 2.8% | 2.0%(+0.780)#86 | 2.1%(+0.672)#5,051 |
| 87. | Greeley | 2.8% | 2.0%(+0.775)#87 | 2.1%(+0.668)#5,068 |
| 88. | Burlington | 2.8% | 2.0%(+0.741)#88 | 2.1%(+0.634)#5,161 |
| 89. | Holyrood | 2.8% | 2.0%(+0.736)#89 | 2.1%(+0.629)#5,180 |
| 90. | Manchester | 2.7% | 2.0%(+0.661)#90 | 2.1%(+0.553)#5,429 |
| 91. | Wichita | 2.7% | 2.0%(+0.653)#91 | 2.1%(+0.545)#5,445 |
| 92. | Tonganoxie | 2.7% | 2.0%(+0.641)#92 | 2.1%(+0.534)#5,489 |
| 93. | Oxford | 2.6% | 2.0%(+0.564)#93 | 2.1%(+0.457)#5,704 |
| 94. | Lindsborg | 2.6% | 2.0%(+0.552)#94 | 2.1%(+0.445)#5,741 |
| 95. | Anthony | 2.5% | 2.0%(+0.508)#95 | 2.1%(+0.400)#5,894 |
| 96. | Moundridge | 2.5% | 2.0%(+0.475)#96 | 2.1%(+0.367)#5,994 |
| 97. | Grandview Plaza | 2.5% | 2.0%(+0.448)#97 | 2.1%(+0.340)#6,068 |
| 98. | Walton | 2.5% | 2.0%(+0.428)#98 | 2.1%(+0.320)#6,133 |
| 99. | Maize | 2.5% | 2.0%(+0.411)#99 | 2.1%(+0.303)#6,187 |
| 100. | Little River | 2.4% | 2.0%(+0.397)#100 | 2.1%(+0.290)#6,226 |
Common Questions
What are the Top 10 Cities with the Highest Percentage of Population Employed in Architecture & Engineering in Kansas?
Top 10 Cities with the Highest Percentage of Population Employed in Architecture & Engineering in Kansas are:
What city has the Highest Percentage of Population Employed in Architecture & Engineering in Kansas?
Havensville has the Highest Percentage of Population Employed in Architecture & Engineering in Kansas with 33.0%.
What is the Percentage of Population Employed in Architecture & Engineering in the State of Kansas?
Percentage of Population Employed in Architecture & Engineering in Kansas is 2.0%.
What is the Percentage of Population Employed in Architecture & Engineering in the United States?
Percentage of Population Employed in Architecture & Engineering in the United States is 2.1%.