Pismo Beach, CA Map & Demographics
Pismo Beach Map
Pismo Beach Overview
$71,752
PER CAPITA INCOME
$145,069
AVG FAMILY INCOME
$109,196
AVG HOUSEHOLD INCOME
31.2%
WAGE / INCOME GAP [ % ]
68.8¢/ $1
WAGE / INCOME GAP [ $ ]
0.46
INEQUALITY / GINI INDEX
8,050
TOTAL POPULATION
4,103
MALE POPULATION
3,947
FEMALE POPULATION
103.95
MALES / 100 FEMALES
96.20
FEMALES / 100 MALES
54.1
MEDIAN AGE
2.5
AVG FAMILY SIZE
1.9
AVG HOUSEHOLD SIZE
4,050
LABOR FORCE [ PEOPLE ]
56.5%
PERCENT IN LABOR FORCE
2.7%
UNEMPLOYMENT RATE
Pismo Beach Zip Codes
Pismo Beach Area Codes
Income in Pismo Beach
Income Overview in Pismo Beach
Per Capita Income in Pismo Beach is $71,752, while median incomes of families and households are $145,069 and $109,196 respectively.
| Characteristic | Number | Measure |
| Per Capita Income | 8,050 | $71,752 |
| Median Family Income | 2,197 | $145,069 |
| Mean Family Income | 2,197 | $175,940 |
| Median Household Income | 4,113 | $109,196 |
| Mean Household Income | 4,113 | $139,578 |
| Income Deficit | 2,197 | $0 |
| Wage / Income Gap (%) | 8,050 | 31.22% |
| Wage / Income Gap ($) | 8,050 | 68.78¢ per $1 |
| Gini / Inequality Index | 8,050 | 0.46 |
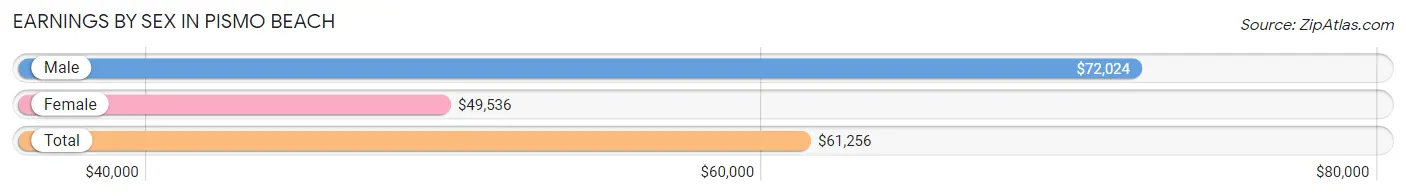
Earnings by Sex in Pismo Beach
Average Earnings in Pismo Beach are $61,256, $72,024 for men and $49,536 for women, a difference of 31.2%.
| Sex | Number | Average Earnings |
| Male | 2,506 (60.1%) | $72,024 |
| Female | 1,665 (39.9%) | $49,536 |
| Total | 4,171 (100.0%) | $61,256 |
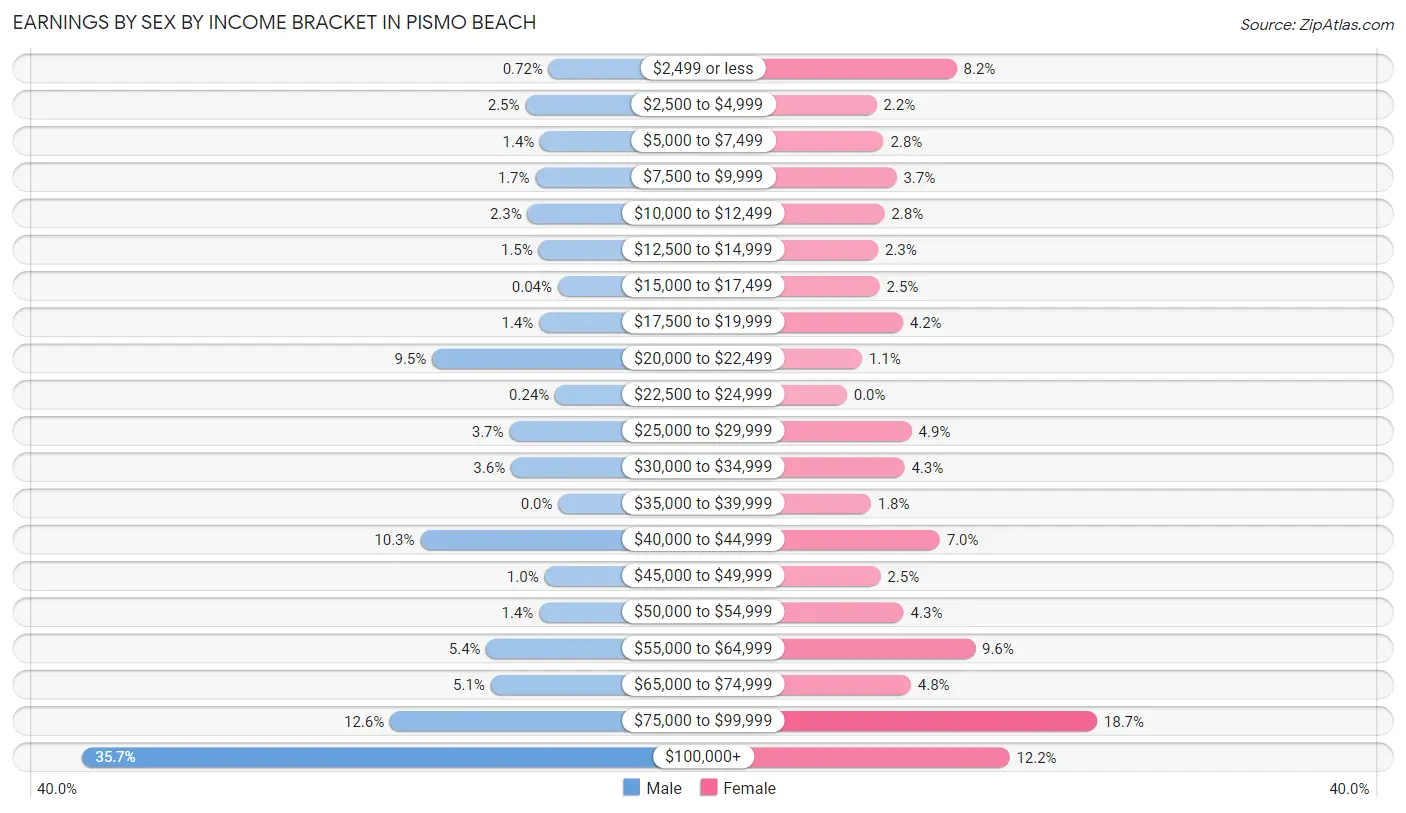
Earnings by Sex by Income Bracket in Pismo Beach
The most common earnings brackets in Pismo Beach are $100,000+ for men (894 | 35.7%) and $75,000 to $99,999 for women (312 | 18.7%).
| Income | Male | Female |
| $2,499 or less | 18 (0.7%) | 137 (8.2%) |
| $2,500 to $4,999 | 62 (2.5%) | 37 (2.2%) |
| $5,000 to $7,499 | 34 (1.4%) | 46 (2.8%) |
| $7,500 to $9,999 | 43 (1.7%) | 62 (3.7%) |
| $10,000 to $12,499 | 58 (2.3%) | 47 (2.8%) |
| $12,500 to $14,999 | 37 (1.5%) | 39 (2.3%) |
| $15,000 to $17,499 | 1 (0.0%) | 41 (2.5%) |
| $17,500 to $19,999 | 36 (1.4%) | 70 (4.2%) |
| $20,000 to $22,499 | 237 (9.5%) | 19 (1.1%) |
| $22,500 to $24,999 | 6 (0.2%) | 0 (0.0%) |
| $25,000 to $29,999 | 92 (3.7%) | 81 (4.9%) |
| $30,000 to $34,999 | 89 (3.5%) | 72 (4.3%) |
| $35,000 to $39,999 | 0 (0.0%) | 30 (1.8%) |
| $40,000 to $44,999 | 259 (10.3%) | 116 (7.0%) |
| $45,000 to $49,999 | 26 (1.0%) | 42 (2.5%) |
| $50,000 to $54,999 | 36 (1.4%) | 71 (4.3%) |
| $55,000 to $64,999 | 135 (5.4%) | 160 (9.6%) |
| $65,000 to $74,999 | 127 (5.1%) | 80 (4.8%) |
| $75,000 to $99,999 | 316 (12.6%) | 312 (18.7%) |
| $100,000+ | 894 (35.7%) | 203 (12.2%) |
| Total | 2,506 (100.0%) | 1,665 (100.0%) |
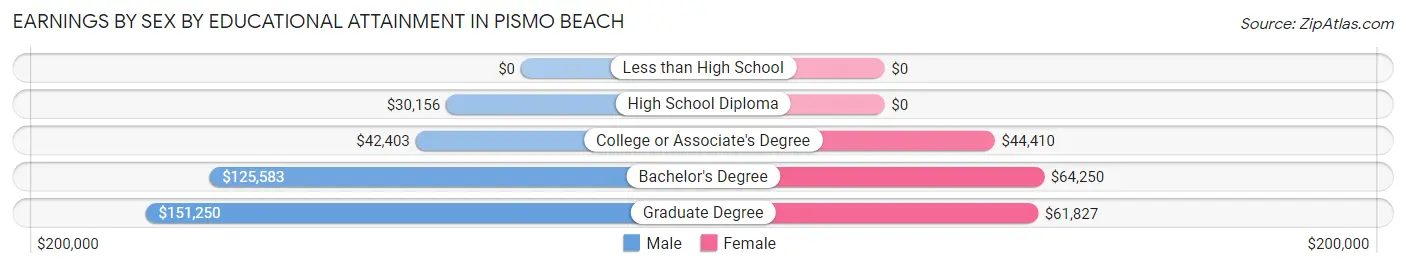
Earnings by Sex by Educational Attainment in Pismo Beach
Average earnings in Pismo Beach are $74,327 for men and $53,694 for women, a difference of 27.8%. Men with an educational attainment of graduate degree enjoy the highest average annual earnings of $151,250, while those with high school diploma education earn the least with $30,156. Women with an educational attainment of bachelor's degree earn the most with the average annual earnings of $64,250, while those with college or associate's degree education have the smallest earnings of $44,410.
| Educational Attainment | Male Income | Female Income |
| Less than High School | - | - |
| High School Diploma | $30,156 | $0 |
| College or Associate's Degree | $42,403 | $44,410 |
| Bachelor's Degree | $125,583 | $64,250 |
| Graduate Degree | $151,250 | $61,827 |
| Total | $74,327 | $53,694 |
Family Income in Pismo Beach
Family Income Brackets in Pismo Beach
According to the Pismo Beach family income data, there are 635 families falling into the $200,000+ income range, which is the most common income bracket and makes up 28.9% of all families.
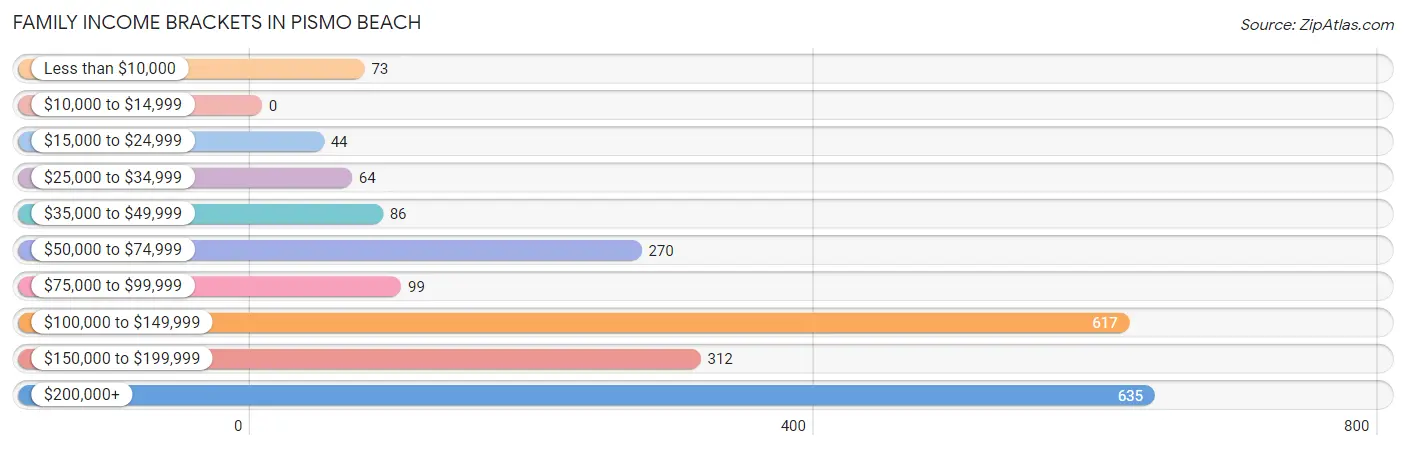
| Income Bracket | # Families | % Families |
| Less than $10,000 | 73 | 3.3% |
| $10,000 to $14,999 | 0 | 0.0% |
| $15,000 to $24,999 | 44 | 2.0% |
| $25,000 to $34,999 | 64 | 2.9% |
| $35,000 to $49,999 | 86 | 3.9% |
| $50,000 to $74,999 | 270 | 12.3% |
| $75,000 to $99,999 | 99 | 4.5% |
| $100,000 to $149,999 | 617 | 28.1% |
| $150,000 to $199,999 | 312 | 14.2% |
| $200,000+ | 635 | 28.9% |
Family Income by Famaliy Size in Pismo Beach
4-person families (313 | 14.2%) account for the highest median family income in Pismo Beach with $175,268 per family, while 2-person families (1,493 | 68.0%) have the highest median income of $62,854 per family member.
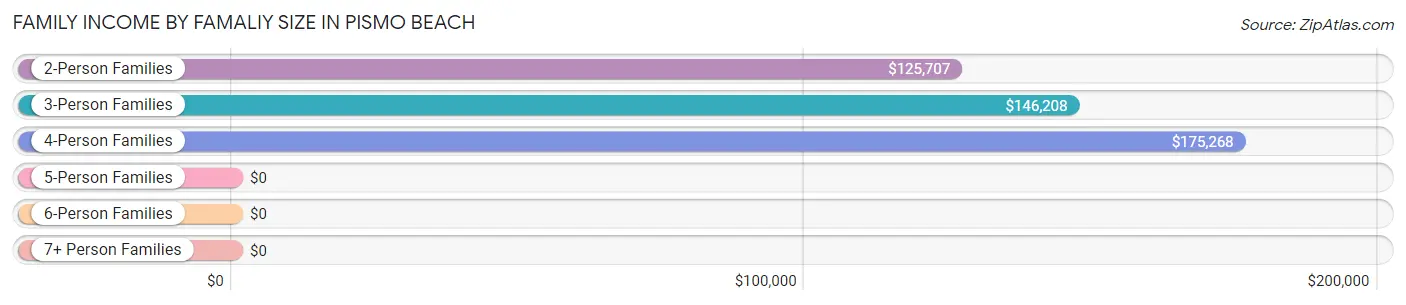
| Income Bracket | # Families | Median Income |
| 2-Person Families | 1,493 (68.0%) | $125,707 |
| 3-Person Families | 356 (16.2%) | $146,208 |
| 4-Person Families | 313 (14.2%) | $175,268 |
| 5-Person Families | 27 (1.2%) | $0 |
| 6-Person Families | 8 (0.4%) | $0 |
| 7+ Person Families | 0 (0.0%) | $0 |
| Total | 2,197 (100.0%) | $145,069 |
Family Income by Number of Earners in Pismo Beach
The median family income in Pismo Beach is $145,069, with families comprising 3+ earners (80) having the highest median family income of $154,605, while families with no earners (626) have the lowest median family income of $69,417, accounting for 3.6% and 28.5% of families, respectively.
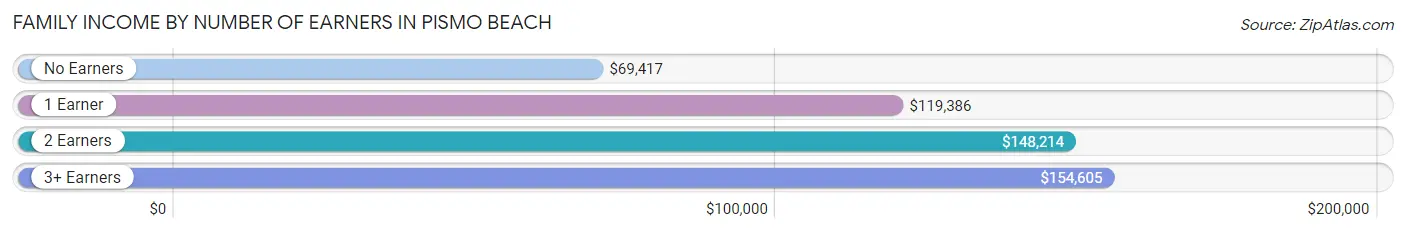
| Number of Earners | # Families | Median Income |
| No Earners | 626 (28.5%) | $69,417 |
| 1 Earner | 579 (26.4%) | $119,386 |
| 2 Earners | 912 (41.5%) | $148,214 |
| 3+ Earners | 80 (3.6%) | $154,605 |
| Total | 2,197 (100.0%) | $145,069 |
Household Income in Pismo Beach
Household Income Brackets in Pismo Beach
With 999 households falling in the category, the $100,000 to $149,999 income range is the most frequent in Pismo Beach, accounting for 24.3% of all households. In contrast, only 58 households (1.4%) fall into the $10,000 to $14,999 income bracket, making it the least populous group.
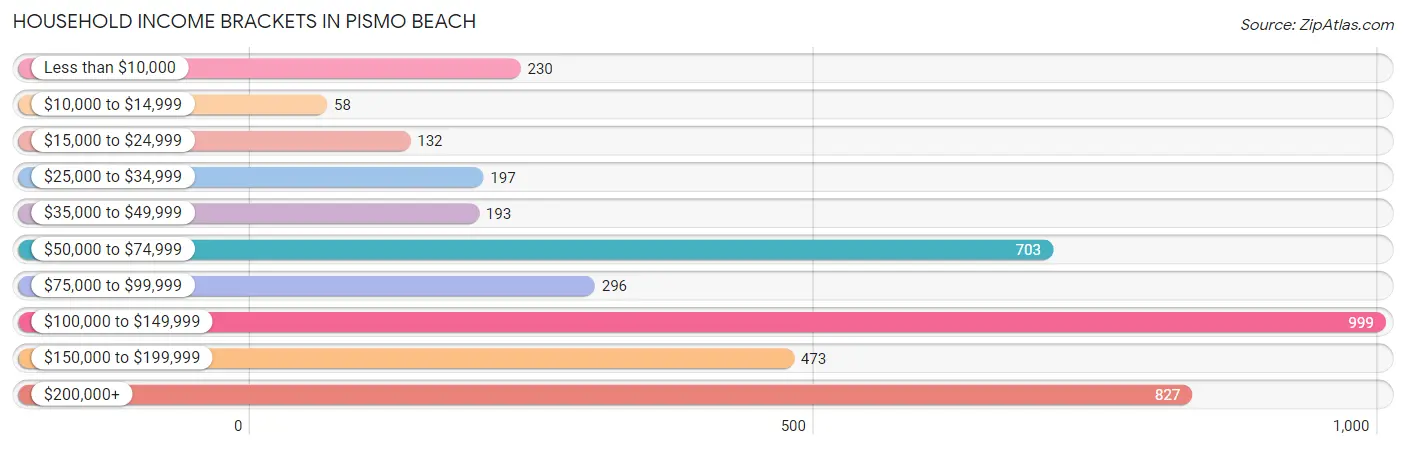
| Income Bracket | # Households | % Households |
| Less than $10,000 | 230 | 5.6% |
| $10,000 to $14,999 | 58 | 1.4% |
| $15,000 to $24,999 | 132 | 3.2% |
| $25,000 to $34,999 | 197 | 4.8% |
| $35,000 to $49,999 | 193 | 4.7% |
| $50,000 to $74,999 | 703 | 17.1% |
| $75,000 to $99,999 | 296 | 7.2% |
| $100,000 to $149,999 | 999 | 24.3% |
| $150,000 to $199,999 | 473 | 11.5% |
| $200,000+ | 827 | 20.1% |
Household Income by Householder Age in Pismo Beach
The median household income in Pismo Beach is $109,196, with the highest median household income of $142,897 found in the 45 to 64 years age bracket for the primary householder. A total of 1,530 households (37.2%) fall into this category. Meanwhile, the 15 to 24 years age bracket for the primary householder has the lowest median household income of $60,213, with 95 households (2.3%) in this group.
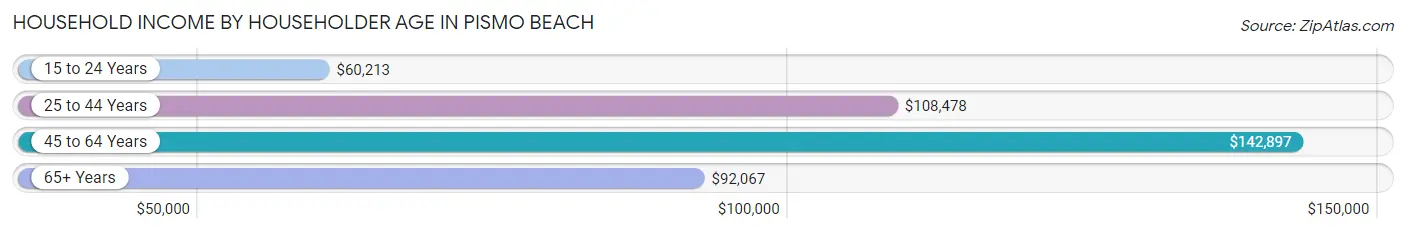
| Income Bracket | # Households | Median Income |
| 15 to 24 Years | 95 (2.3%) | $60,213 |
| 25 to 44 Years | 1,057 (25.7%) | $108,478 |
| 45 to 64 Years | 1,530 (37.2%) | $142,897 |
| 65+ Years | 1,431 (34.8%) | $92,067 |
| Total | 4,113 (100.0%) | $109,196 |
Poverty in Pismo Beach
Income Below Poverty by Sex and Age in Pismo Beach
With 7.3% poverty level for males and 8.6% for females among the residents of Pismo Beach, under 5 year old males and 25 to 34 year old females are the most vulnerable to poverty, with 37 males (26.8%) and 69 females (22.9%) in their respective age groups living below the poverty level.
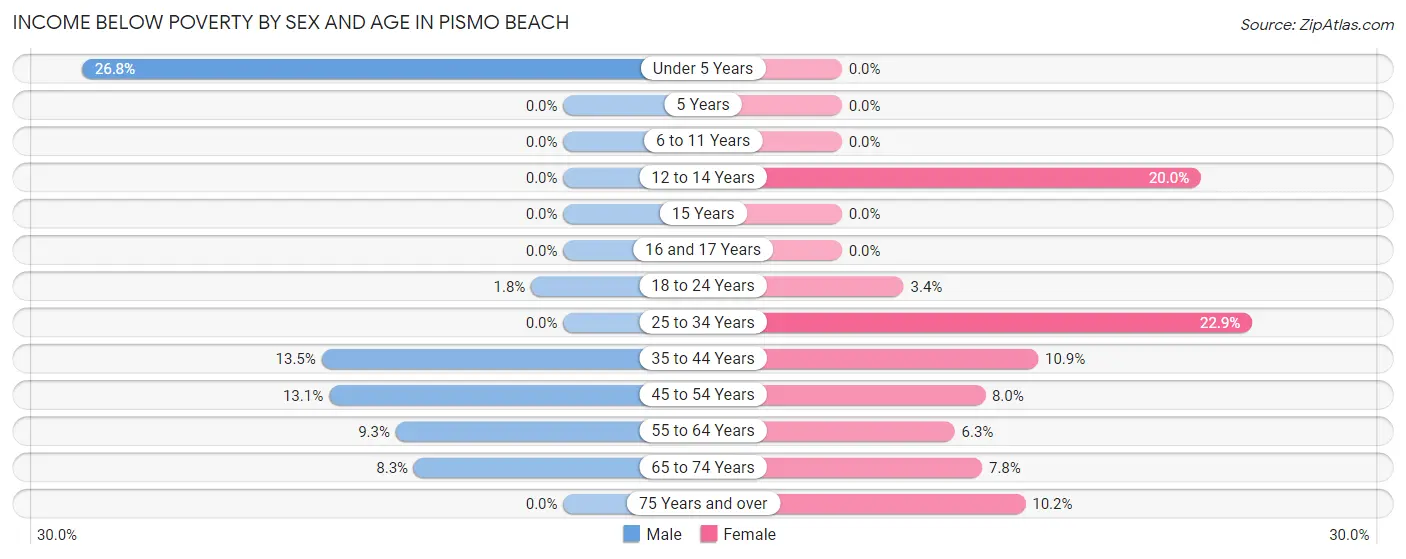
| Age Bracket | Male | Female |
| Under 5 Years | 37 (26.8%) | 0 (0.0%) |
| 5 Years | 0 (0.0%) | 0 (0.0%) |
| 6 to 11 Years | 0 (0.0%) | 0 (0.0%) |
| 12 to 14 Years | 0 (0.0%) | 13 (20.0%) |
| 15 Years | 0 (0.0%) | 0 (0.0%) |
| 16 and 17 Years | 0 (0.0%) | 0 (0.0%) |
| 18 to 24 Years | 1 (1.8%) | 9 (3.4%) |
| 25 to 34 Years | 0 (0.0%) | 69 (22.9%) |
| 35 to 44 Years | 70 (13.5%) | 40 (10.9%) |
| 45 to 54 Years | 74 (13.1%) | 37 (8.0%) |
| 55 to 64 Years | 72 (9.3%) | 46 (6.3%) |
| 65 to 74 Years | 42 (8.3%) | 70 (7.8%) |
| 75 Years and over | 0 (0.0%) | 52 (10.2%) |
| Total | 296 (7.3%) | 336 (8.6%) |
Income Above Poverty by Sex and Age in Pismo Beach
According to the poverty statistics in Pismo Beach, males aged 6 to 11 years and females aged under 5 years are the age groups that are most secure financially, with 100.0% of males and 100.0% of females in these age groups living above the poverty line.
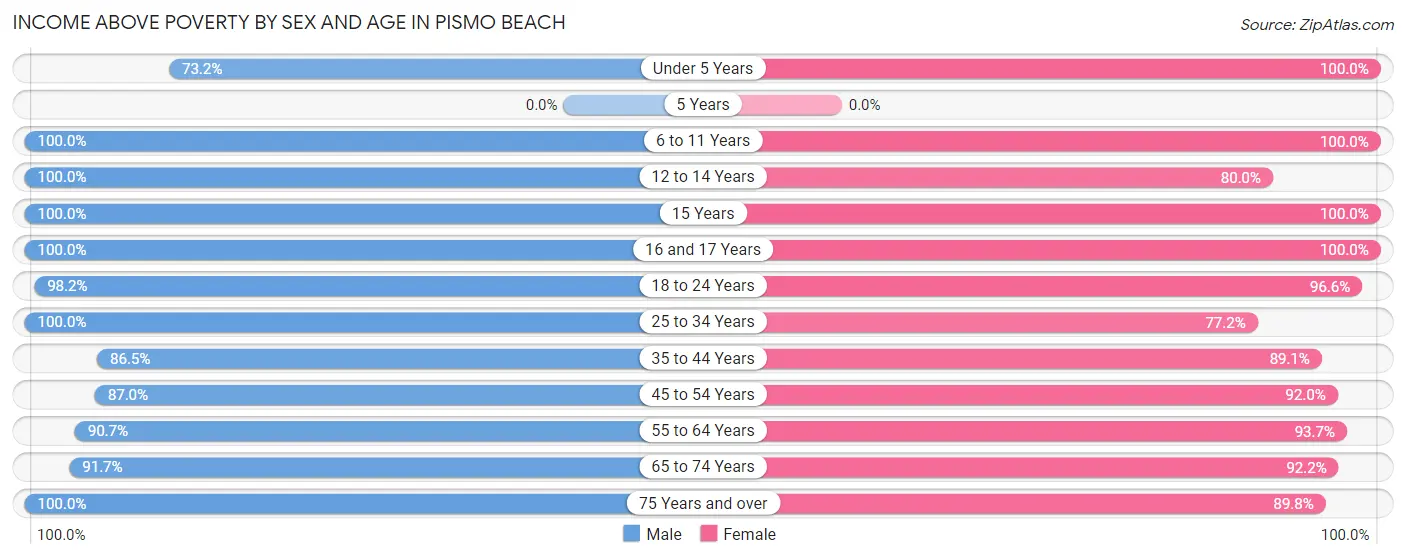
| Age Bracket | Male | Female |
| Under 5 Years | 101 (73.2%) | 53 (100.0%) |
| 5 Years | 0 (0.0%) | 0 (0.0%) |
| 6 to 11 Years | 97 (100.0%) | 82 (100.0%) |
| 12 to 14 Years | 214 (100.0%) | 52 (80.0%) |
| 15 Years | 46 (100.0%) | 127 (100.0%) |
| 16 and 17 Years | 10 (100.0%) | 60 (100.0%) |
| 18 to 24 Years | 55 (98.2%) | 253 (96.6%) |
| 25 to 34 Years | 698 (100.0%) | 233 (77.1%) |
| 35 to 44 Years | 450 (86.5%) | 326 (89.1%) |
| 45 to 54 Years | 493 (87.0%) | 427 (92.0%) |
| 55 to 64 Years | 700 (90.7%) | 687 (93.7%) |
| 65 to 74 Years | 463 (91.7%) | 826 (92.2%) |
| 75 Years and over | 448 (100.0%) | 457 (89.8%) |
| Total | 3,775 (92.7%) | 3,583 (91.4%) |
Income Below Poverty Among Married-Couple Families in Pismo Beach
The poverty statistics for married-couple families in Pismo Beach show that 3.6% or 64 of the total 1,796 families live below the poverty line. Families with no children have the highest poverty rate of 4.6%, comprising of 64 families. On the other hand, families with 1 or 2 children have the lowest poverty rate of 0.0%, which includes 0 families.
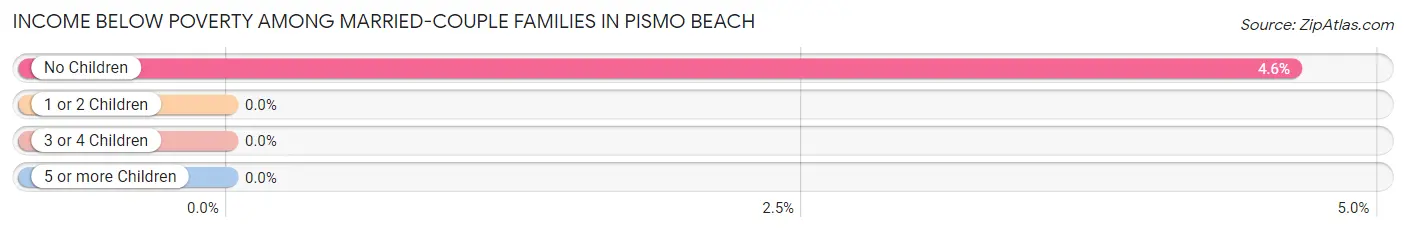
| Children | Above Poverty | Below Poverty |
| No Children | 1,317 (95.4%) | 64 (4.6%) |
| 1 or 2 Children | 415 (100.0%) | 0 (0.0%) |
| 3 or 4 Children | 0 (0.0%) | 0 (0.0%) |
| 5 or more Children | 0 (0.0%) | 0 (0.0%) |
| Total | 1,732 (96.4%) | 64 (3.6%) |
Income Below Poverty Among Single-Parent Households in Pismo Beach
According to the poverty data in Pismo Beach, 36.4% or 51 single-father households and 5.0% or 13 single-mother households are living below the poverty line. Among single-father households, those with 1 or 2 children have the highest poverty rate, with 51 households (49.5%) experiencing poverty. Likewise, among single-mother households, those with 1 or 2 children have the highest poverty rate, with 13 households (21.3%) falling below the poverty line.
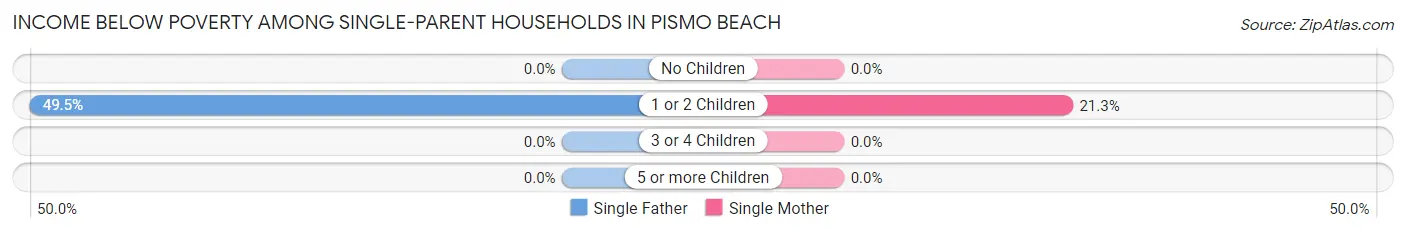
| Children | Single Father | Single Mother |
| No Children | 0 (0.0%) | 0 (0.0%) |
| 1 or 2 Children | 51 (49.5%) | 13 (21.3%) |
| 3 or 4 Children | 0 (0.0%) | 0 (0.0%) |
| 5 or more Children | 0 (0.0%) | 0 (0.0%) |
| Total | 51 (36.4%) | 13 (5.0%) |
Income Below Poverty Among Married-Couple vs Single-Parent Households in Pismo Beach
The poverty data for Pismo Beach shows that 64 of the married-couple family households (3.6%) and 64 of the single-parent households (16.0%) are living below the poverty level. Within the married-couple family households, those with no children have the highest poverty rate, with 64 households (4.6%) falling below the poverty line. Among the single-parent households, those with 1 or 2 children have the highest poverty rate, with 64 household (39.0%) living below poverty.
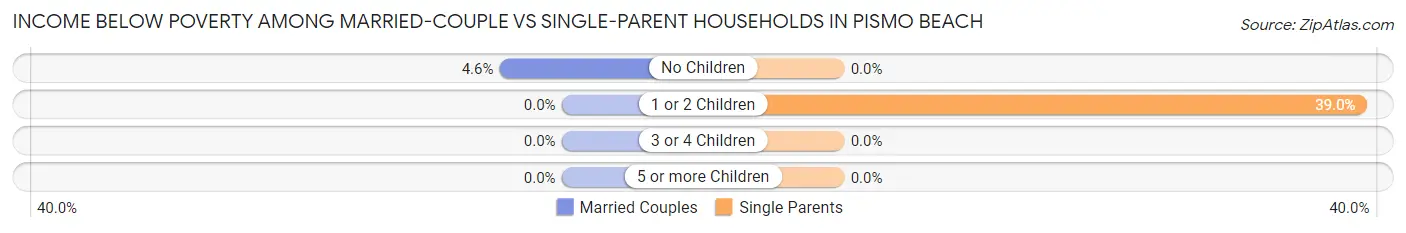
| Children | Married-Couple Families | Single-Parent Households |
| No Children | 64 (4.6%) | 0 (0.0%) |
| 1 or 2 Children | 0 (0.0%) | 64 (39.0%) |
| 3 or 4 Children | 0 (0.0%) | 0 (0.0%) |
| 5 or more Children | 0 (0.0%) | 0 (0.0%) |
| Total | 64 (3.6%) | 64 (16.0%) |
Race in Pismo Beach
The most populous races in Pismo Beach are White / Caucasian (6,654 | 82.7%), Hispanic or Latino (805 | 10.0%), and Two or more Races (592 | 7.3%).
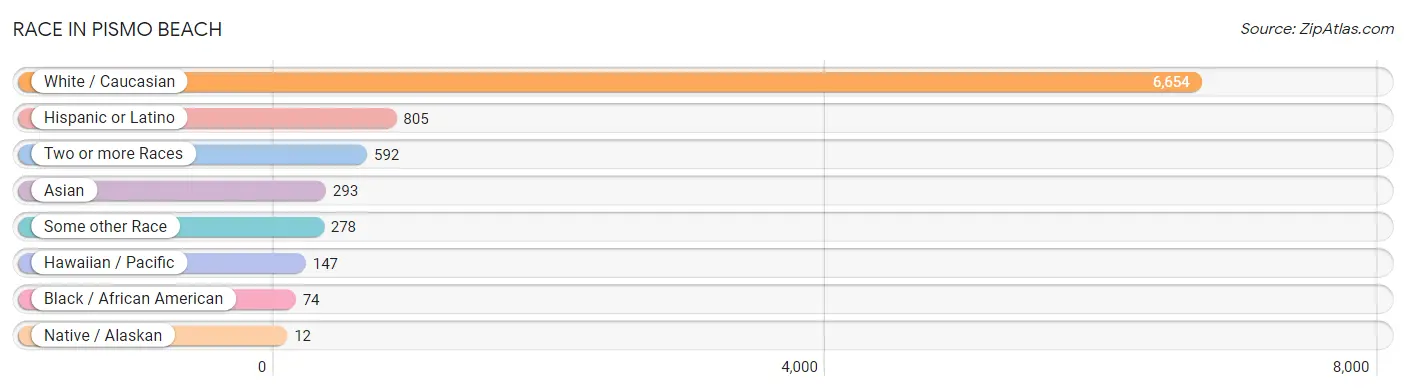
| Race | # Population | % Population |
| Asian | 293 | 3.6% |
| Black / African American | 74 | 0.9% |
| Hawaiian / Pacific | 147 | 1.8% |
| Hispanic or Latino | 805 | 10.0% |
| Native / Alaskan | 12 | 0.2% |
| White / Caucasian | 6,654 | 82.7% |
| Two or more Races | 592 | 7.3% |
| Some other Race | 278 | 3.5% |
| Total | 8,050 | 100.0% |
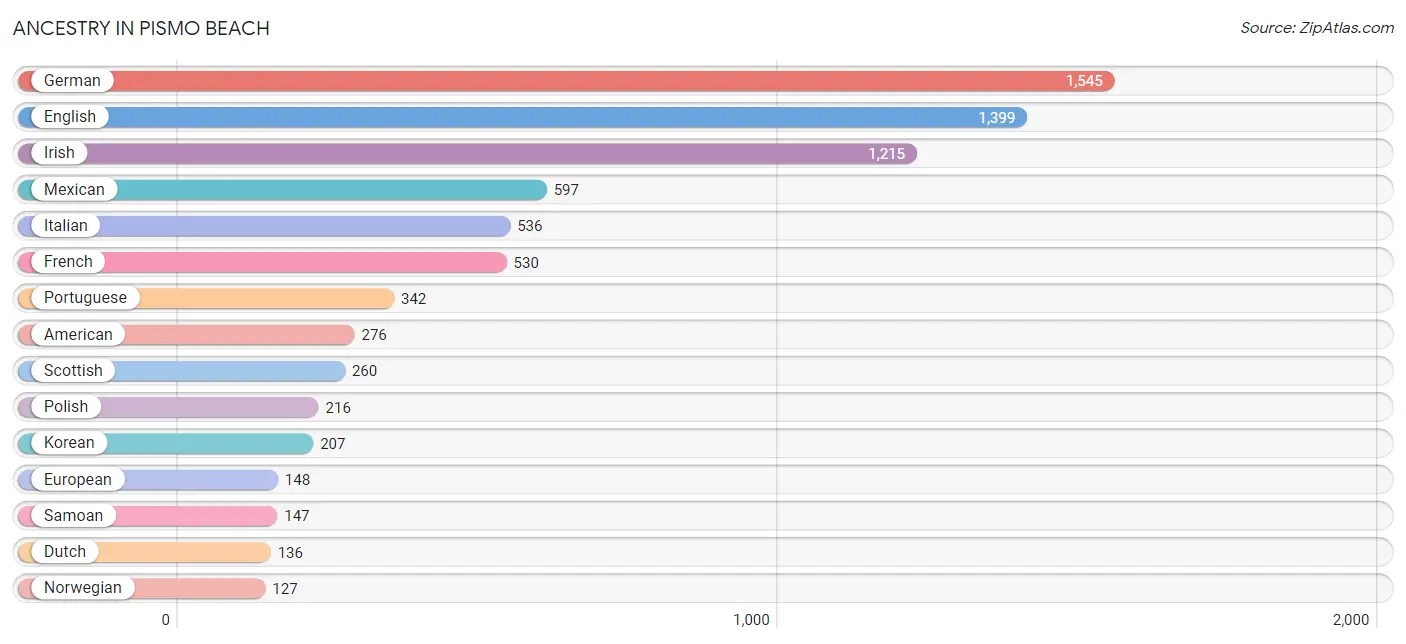
Ancestry in Pismo Beach
The most populous ancestries reported in Pismo Beach are German (1,545 | 19.2%), English (1,399 | 17.4%), Irish (1,215 | 15.1%), Mexican (597 | 7.4%), and Italian (536 | 6.7%), together accounting for 65.7% of all Pismo Beach residents.
| Ancestry | # Population | % Population |
| African | 1 | 0.0% |
| American | 276 | 3.4% |
| Arab | 50 | 0.6% |
| Armenian | 83 | 1.0% |
| Australian | 22 | 0.3% |
| Austrian | 70 | 0.9% |
| Basque | 9 | 0.1% |
| Bhutanese | 69 | 0.9% |
| British | 62 | 0.8% |
| Burmese | 59 | 0.7% |
| Canadian | 9 | 0.1% |
| Central American | 77 | 1.0% |
| Cherokee | 46 | 0.6% |
| Colombian | 24 | 0.3% |
| Croatian | 35 | 0.4% |
| Czech | 75 | 0.9% |
| Czechoslovakian | 7 | 0.1% |
| Danish | 66 | 0.8% |
| Dutch | 136 | 1.7% |
| Egyptian | 9 | 0.1% |
| English | 1,399 | 17.4% |
| European | 148 | 1.8% |
| French | 530 | 6.6% |
| French Canadian | 22 | 0.3% |
| German | 1,545 | 19.2% |
| Greek | 21 | 0.3% |
| Guatemalan | 9 | 0.1% |
| Hungarian | 7 | 0.1% |
| Iranian | 8 | 0.1% |
| Irish | 1,215 | 15.1% |
| Italian | 536 | 6.7% |
| Japanese | 68 | 0.8% |
| Korean | 207 | 2.6% |
| Lebanese | 27 | 0.3% |
| Lithuanian | 74 | 0.9% |
| Mexican | 597 | 7.4% |
| Norwegian | 127 | 1.6% |
| Pennsylvania German | 15 | 0.2% |
| Peruvian | 11 | 0.1% |
| Polish | 216 | 2.7% |
| Portuguese | 342 | 4.3% |
| Puerto Rican | 14 | 0.2% |
| Romanian | 10 | 0.1% |
| Russian | 65 | 0.8% |
| Salvadoran | 68 | 0.8% |
| Samoan | 147 | 1.8% |
| Scandinavian | 52 | 0.6% |
| Scotch-Irish | 65 | 0.8% |
| Scottish | 260 | 3.2% |
| Slavic | 10 | 0.1% |
| Slovak | 49 | 0.6% |
| Slovene | 12 | 0.2% |
| South American | 35 | 0.4% |
| Spanish | 61 | 0.8% |
| Sri Lankan | 34 | 0.4% |
| Subsaharan African | 1 | 0.0% |
| Swedish | 107 | 1.3% |
| Swiss | 26 | 0.3% |
| Ukrainian | 34 | 0.4% |
| Welsh | 73 | 0.9% | View All 60 Rows |
Immigrants in Pismo Beach
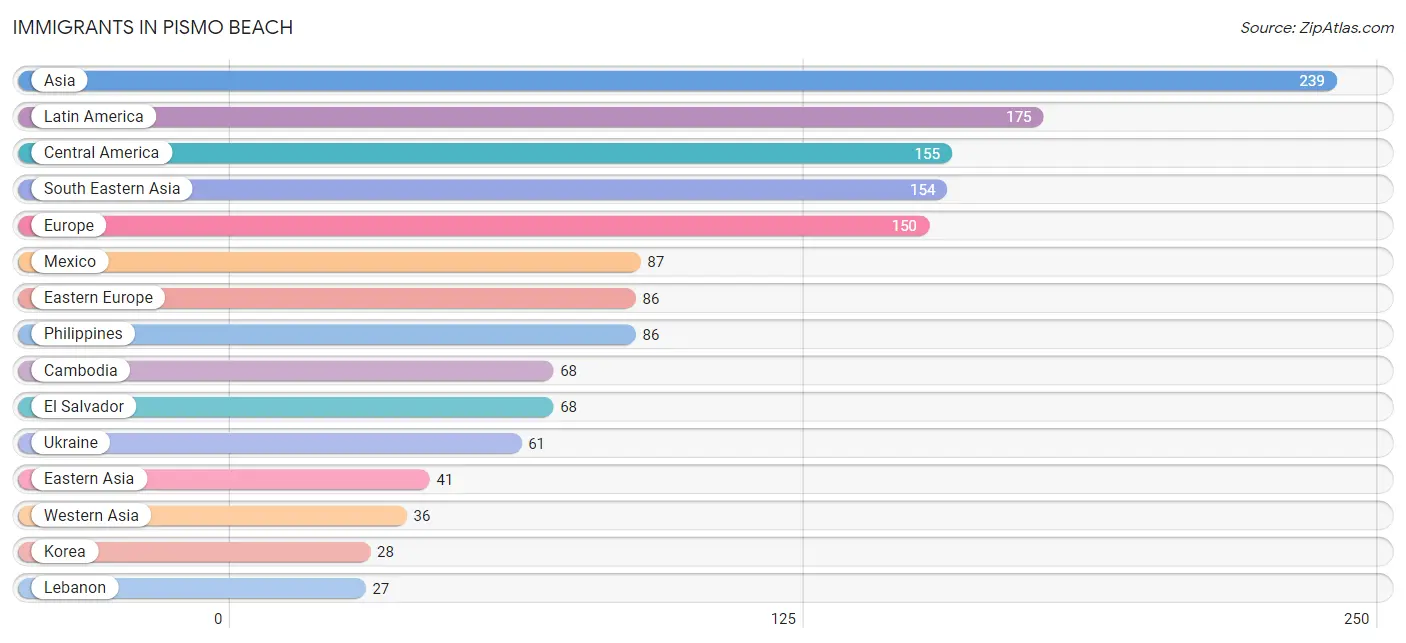
The most numerous immigrant groups reported in Pismo Beach came from Asia (239 | 3.0%), Latin America (175 | 2.2%), Central America (155 | 1.9%), South Eastern Asia (154 | 1.9%), and Europe (150 | 1.9%), together accounting for 10.8% of all Pismo Beach residents.
| Immigration Origin | # Population | % Population |
| Asia | 239 | 3.0% |
| Australia | 22 | 0.3% |
| Cambodia | 68 | 0.8% |
| Canada | 21 | 0.3% |
| Central America | 155 | 1.9% |
| Eastern Asia | 41 | 0.5% |
| Eastern Europe | 86 | 1.1% |
| El Salvador | 68 | 0.8% |
| England | 15 | 0.2% |
| Europe | 150 | 1.9% |
| Germany | 25 | 0.3% |
| Iran | 8 | 0.1% |
| Italy | 21 | 0.3% |
| Japan | 13 | 0.2% |
| Korea | 28 | 0.4% |
| Latin America | 175 | 2.2% |
| Lebanon | 27 | 0.3% |
| Mexico | 87 | 1.1% |
| Northern Europe | 18 | 0.2% |
| Oceania | 22 | 0.3% |
| Peru | 11 | 0.1% |
| Philippines | 86 | 1.1% |
| Poland | 16 | 0.2% |
| Russia | 9 | 0.1% |
| South America | 20 | 0.3% |
| South Central Asia | 8 | 0.1% |
| South Eastern Asia | 154 | 1.9% |
| Southern Europe | 21 | 0.3% |
| Syria | 9 | 0.1% |
| Ukraine | 61 | 0.8% |
| Western Asia | 36 | 0.4% |
| Western Europe | 25 | 0.3% | View All 32 Rows |
Sex and Age in Pismo Beach
Sex and Age in Pismo Beach
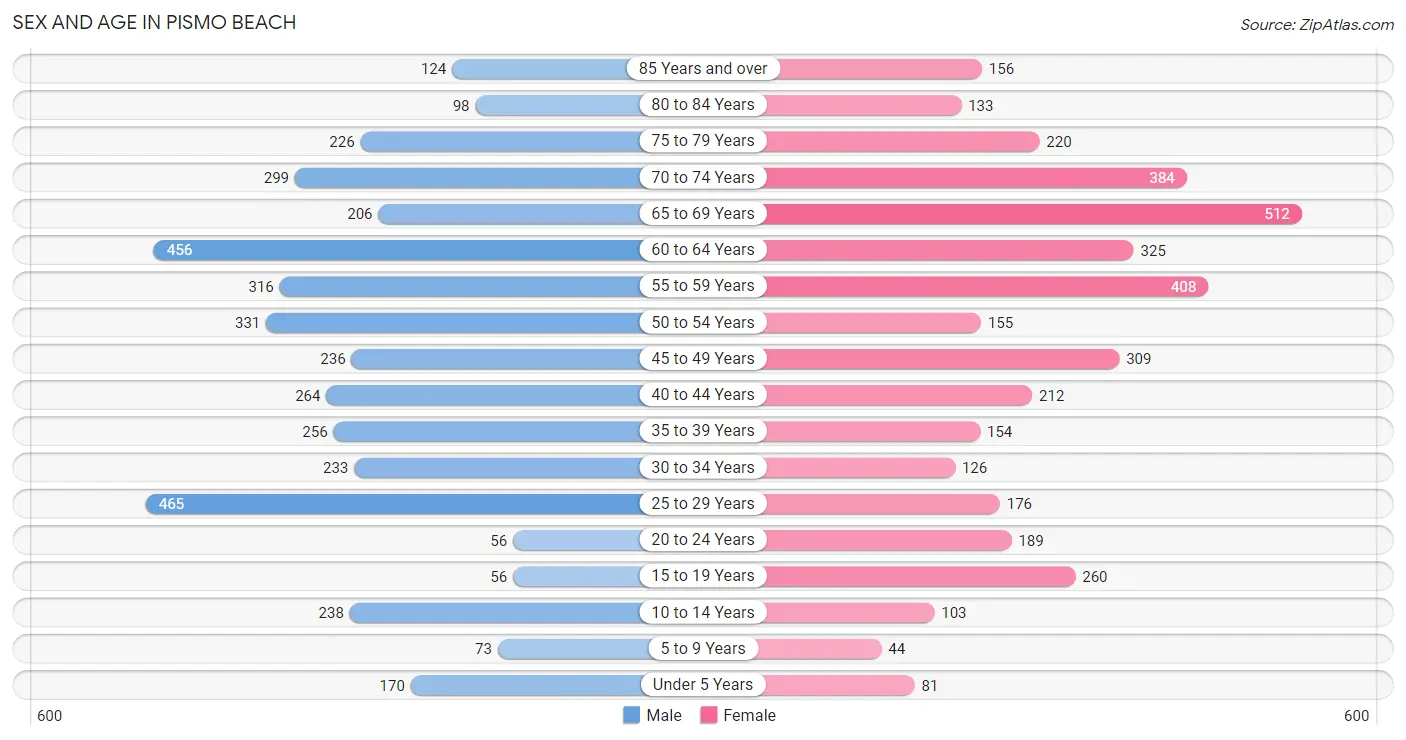
The most populous age groups in Pismo Beach are 25 to 29 Years (465 | 11.3%) for men and 65 to 69 Years (512 | 13.0%) for women.
| Age Bracket | Male | Female |
| Under 5 Years | 170 (4.1%) | 81 (2.1%) |
| 5 to 9 Years | 73 (1.8%) | 44 (1.1%) |
| 10 to 14 Years | 238 (5.8%) | 103 (2.6%) |
| 15 to 19 Years | 56 (1.4%) | 260 (6.6%) |
| 20 to 24 Years | 56 (1.4%) | 189 (4.8%) |
| 25 to 29 Years | 465 (11.3%) | 176 (4.5%) |
| 30 to 34 Years | 233 (5.7%) | 126 (3.2%) |
| 35 to 39 Years | 256 (6.2%) | 154 (3.9%) |
| 40 to 44 Years | 264 (6.4%) | 212 (5.4%) |
| 45 to 49 Years | 236 (5.8%) | 309 (7.8%) |
| 50 to 54 Years | 331 (8.1%) | 155 (3.9%) |
| 55 to 59 Years | 316 (7.7%) | 408 (10.3%) |
| 60 to 64 Years | 456 (11.1%) | 325 (8.2%) |
| 65 to 69 Years | 206 (5.0%) | 512 (13.0%) |
| 70 to 74 Years | 299 (7.3%) | 384 (9.7%) |
| 75 to 79 Years | 226 (5.5%) | 220 (5.6%) |
| 80 to 84 Years | 98 (2.4%) | 133 (3.4%) |
| 85 Years and over | 124 (3.0%) | 156 (4.0%) |
| Total | 4,103 (100.0%) | 3,947 (100.0%) |
Families and Households in Pismo Beach
Median Family Size in Pismo Beach
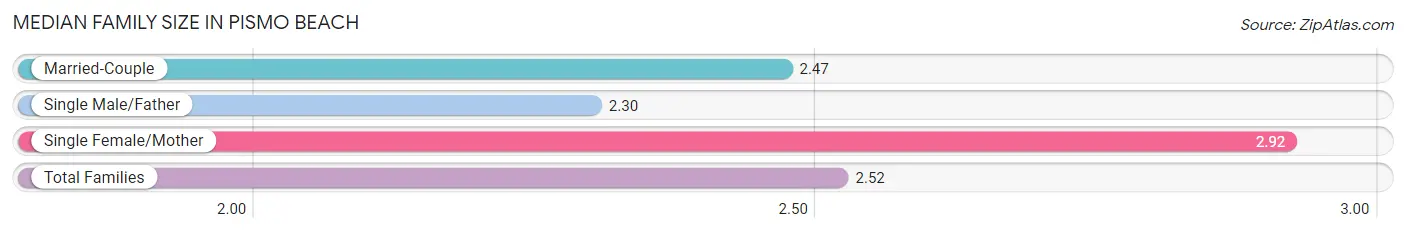
The median family size in Pismo Beach is 2.52 persons per family, with single female/mother families (261 | 11.9%) accounting for the largest median family size of 2.92 persons per family. On the other hand, single male/father families (140 | 6.4%) represent the smallest median family size with 2.30 persons per family.
| Family Type | # Families | Family Size |
| Married-Couple | 1,796 (81.8%) | 2.47 |
| Single Male/Father | 140 (6.4%) | 2.30 |
| Single Female/Mother | 261 (11.9%) | 2.92 |
| Total Families | 2,197 (100.0%) | 2.52 |
Median Household Size in Pismo Beach
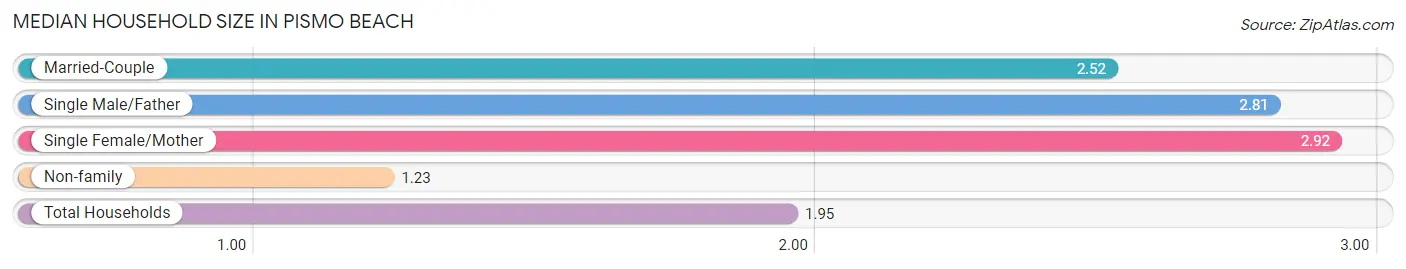
The median household size in Pismo Beach is 1.95 persons per household, with single female/mother households (261 | 6.4%) accounting for the largest median household size of 2.92 persons per household. non-family households (1,916 | 46.6%) represent the smallest median household size with 1.23 persons per household.
| Household Type | # Households | Household Size |
| Married-Couple | 1,796 (43.7%) | 2.52 |
| Single Male/Father | 140 (3.4%) | 2.81 |
| Single Female/Mother | 261 (6.4%) | 2.92 |
| Non-family | 1,916 (46.6%) | 1.23 |
| Total Households | 4,113 (100.0%) | 1.95 |
Household Size by Marriage Status in Pismo Beach
Out of a total of 4,113 households in Pismo Beach, 2,197 (53.4%) are family households, while 1,916 (46.6%) are nonfamily households. The most numerous type of family households are 2-person households, comprising 1,399, and the most common type of nonfamily households are 1-person households, comprising 1,438.
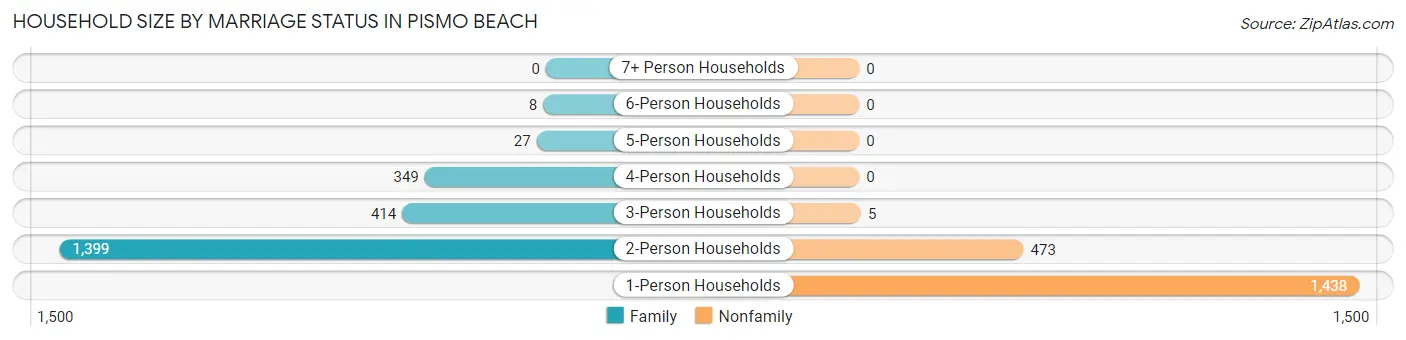
| Household Size | Family Households | Nonfamily Households |
| 1-Person Households | - | 1,438 (35.0%) |
| 2-Person Households | 1,399 (34.0%) | 473 (11.5%) |
| 3-Person Households | 414 (10.1%) | 5 (0.1%) |
| 4-Person Households | 349 (8.5%) | 0 (0.0%) |
| 5-Person Households | 27 (0.7%) | 0 (0.0%) |
| 6-Person Households | 8 (0.2%) | 0 (0.0%) |
| 7+ Person Households | 0 (0.0%) | 0 (0.0%) |
| Total | 2,197 (53.4%) | 1,916 (46.6%) |
Female Fertility in Pismo Beach
Fertility by Age in Pismo Beach
Average fertility rate in Pismo Beach is 57.0 births per 1,000 women. Women in the age bracket of 20 to 34 years have the highest fertility rate with 147.0 births per 1,000 women. Women in the age bracket of 20 to 34 years acount for 86.8% of all women with births.
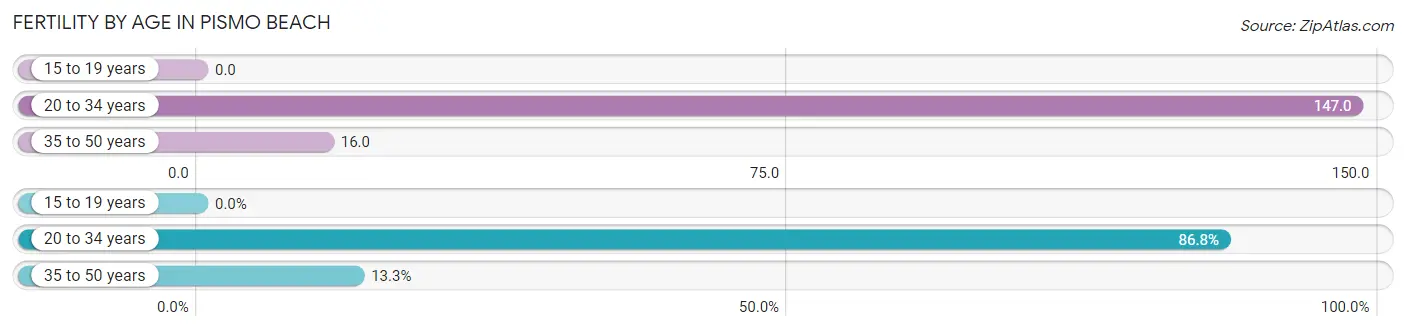
| Age Bracket | Women with Births | Births / 1,000 Women |
| 15 to 19 years | 0 (0.0%) | 0.0 |
| 20 to 34 years | 72 (86.8%) | 147.0 |
| 35 to 50 years | 11 (13.3%) | 16.0 |
| Total | 83 (100.0%) | 57.0 |
Fertility by Age by Marriage Status in Pismo Beach
28.9% of women with births (83) in Pismo Beach are married. The highest percentage of unmarried women with births falls into 20 to 34 years age bracket with 81.9% of them unmarried at the time of birth, while the lowest percentage of unmarried women with births belong to 35 to 50 years age bracket with 0.0% of them unmarried.
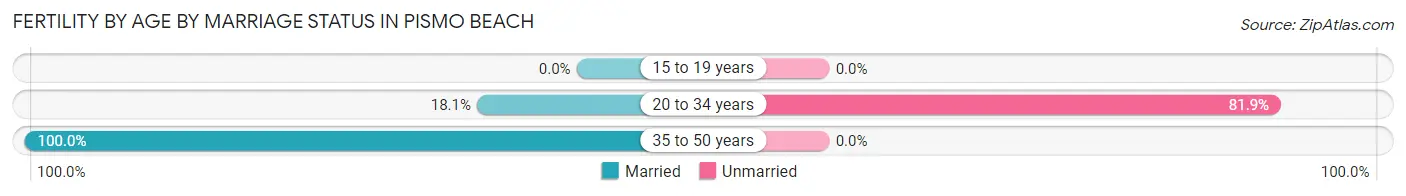
| Age Bracket | Married | Unmarried |
| 15 to 19 years | 0 (0.0%) | 0 (0.0%) |
| 20 to 34 years | 13 (18.1%) | 59 (81.9%) |
| 35 to 50 years | 11 (100.0%) | 0 (0.0%) |
| Total | 24 (28.9%) | 59 (71.1%) |
Fertility by Education in Pismo Beach
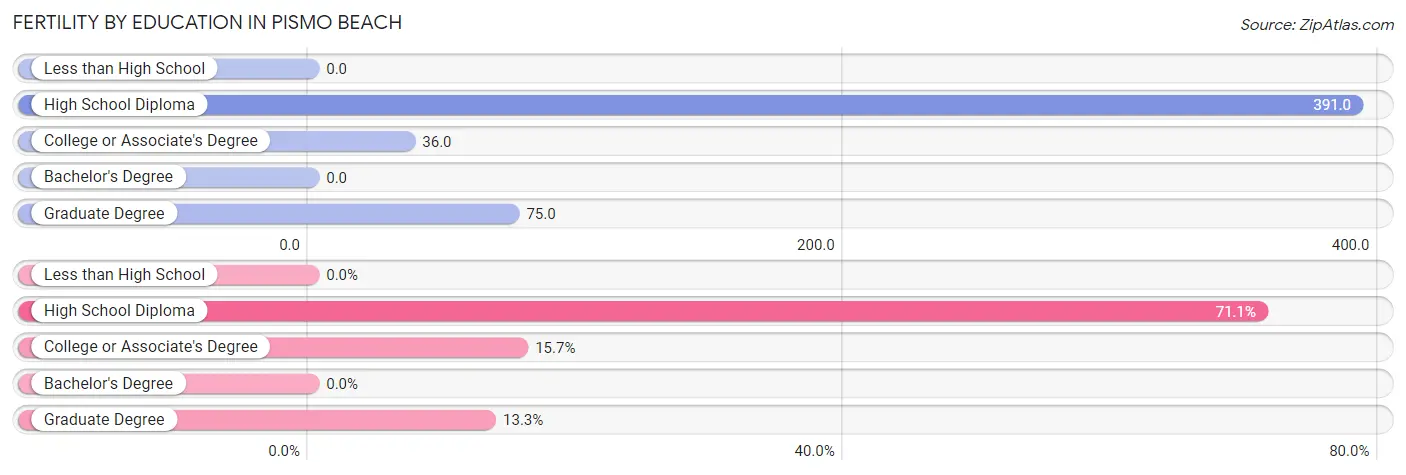
| Educational Attainment | Women with Births | Births / 1,000 Women |
| Less than High School | 0 (0.0%) | 0.0 |
| High School Diploma | 59 (71.1%) | 391.0 |
| College or Associate's Degree | 13 (15.7%) | 36.0 |
| Bachelor's Degree | 0 (0.0%) | 0.0 |
| Graduate Degree | 11 (13.3%) | 75.0 |
| Total | 83 (100.0%) | 57.0 |
Fertility by Education by Marriage Status in Pismo Beach
71.1% of women with births in Pismo Beach are unmarried. Women with the educational attainment of college or associate's degree are most likely to be married with 100.0% of them married at childbirth, while women with the educational attainment of high school diploma are least likely to be married with 100.0% of them unmarried at childbirth.
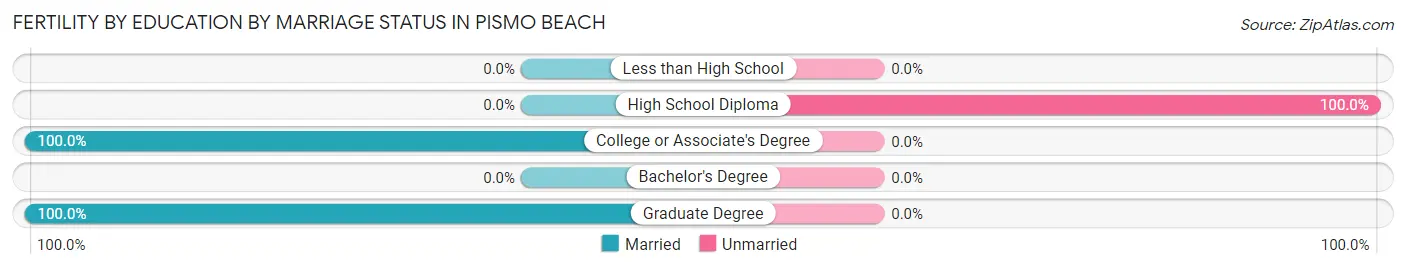
| Educational Attainment | Married | Unmarried |
| Less than High School | 0 (0.0%) | 0 (0.0%) |
| High School Diploma | 0 (0.0%) | 59 (100.0%) |
| College or Associate's Degree | 13 (100.0%) | 0 (0.0%) |
| Bachelor's Degree | 0 (0.0%) | 0 (0.0%) |
| Graduate Degree | 11 (100.0%) | 0 (0.0%) |
| Total | 24 (28.9%) | 59 (71.1%) |
Employment Characteristics in Pismo Beach
Employment by Class of Employer in Pismo Beach
Among the 3,796 employed individuals in Pismo Beach, private company employees (2,396 | 63.1%), self-employed (not incorporated) (412 | 10.8%), and local government employees (281 | 7.4%) make up the most common classes of employment.
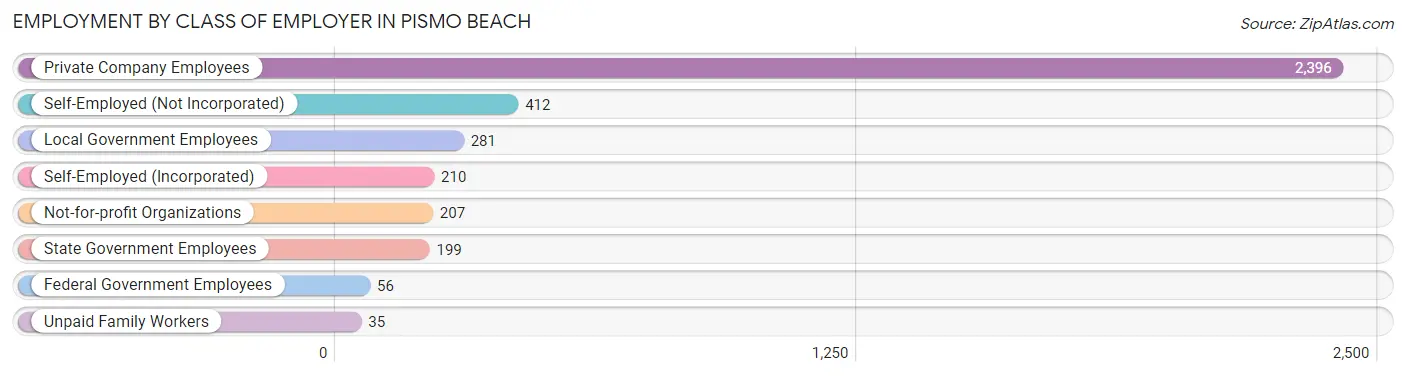
| Employer Class | # Employees | % Employees |
| Private Company Employees | 2,396 | 63.1% |
| Self-Employed (Incorporated) | 210 | 5.5% |
| Self-Employed (Not Incorporated) | 412 | 10.8% |
| Not-for-profit Organizations | 207 | 5.4% |
| Local Government Employees | 281 | 7.4% |
| State Government Employees | 199 | 5.2% |
| Federal Government Employees | 56 | 1.5% |
| Unpaid Family Workers | 35 | 0.9% |
| Total | 3,796 | 100.0% |
Employment Status by Age in Pismo Beach
According to the labor force statistics for Pismo Beach, out of the total population over 16 years of age (7,168), 56.5% or 4,050 individuals are in the labor force, with 2.7% or 109 of them unemployed. The age group with the highest labor force participation rate is 30 to 34 years, with 98.3% or 353 individuals in the labor force. Within the labor force, the 55 to 59 years age range has the highest percentage of unemployed individuals, with 6.4% or 32 of them being unemployed.
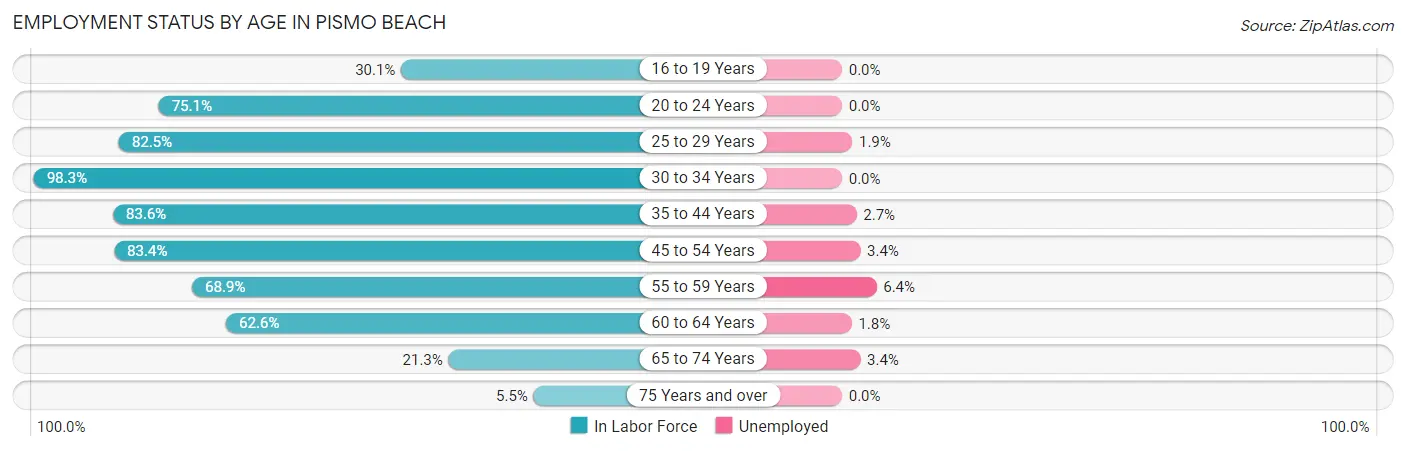
| Age Bracket | In Labor Force | Unemployed |
| 16 to 19 Years | 43 (30.1%) | 0 (0.0%) |
| 20 to 24 Years | 184 (75.1%) | 0 (0.0%) |
| 25 to 29 Years | 529 (82.5%) | 10 (1.9%) |
| 30 to 34 Years | 353 (98.3%) | 0 (0.0%) |
| 35 to 44 Years | 741 (83.6%) | 20 (2.7%) |
| 45 to 54 Years | 860 (83.4%) | 29 (3.4%) |
| 55 to 59 Years | 499 (68.9%) | 32 (6.4%) |
| 60 to 64 Years | 489 (62.6%) | 9 (1.8%) |
| 65 to 74 Years | 298 (21.3%) | 10 (3.4%) |
| 75 Years and over | 53 (5.5%) | 0 (0.0%) |
| Total | 4,050 (56.5%) | 109 (2.7%) |
Employment Status by Educational Attainment in Pismo Beach
According to labor force statistics for Pismo Beach, 78.5% of individuals (3,471) out of the total population between 25 and 64 years of age (4,422) are in the labor force, with 2.9% or 101 of them being unemployed. The group with the highest labor force participation rate are those with the educational attainment of college / associate degree, with 84.0% or 1,382 individuals in the labor force. Within the labor force, individuals with less than high school education have the highest percentage of unemployment, with 25.5% or 13 of them being unemployed.
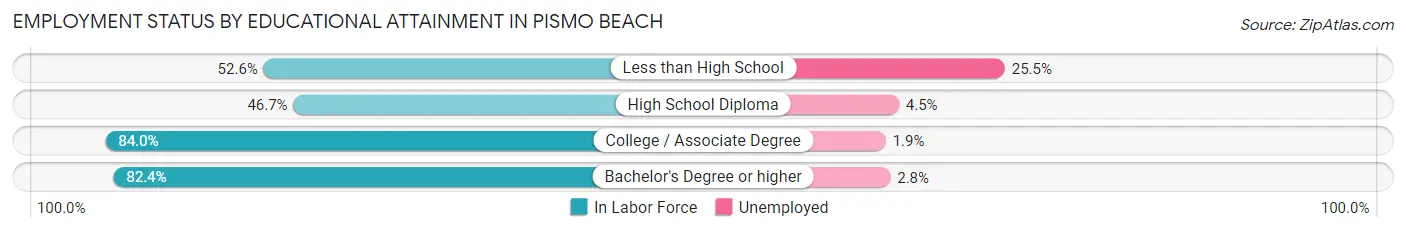
| Educational Attainment | In Labor Force | Unemployed |
| Less than High School | 51 (52.6%) | 25 (25.5%) |
| High School Diploma | 222 (46.7%) | 21 (4.5%) |
| College / Associate Degree | 1,382 (84.0%) | 31 (1.9%) |
| Bachelor's Degree or higher | 1,817 (82.4%) | 62 (2.8%) |
| Total | 3,471 (78.5%) | 128 (2.9%) |
Employment Occupations by Sex in Pismo Beach
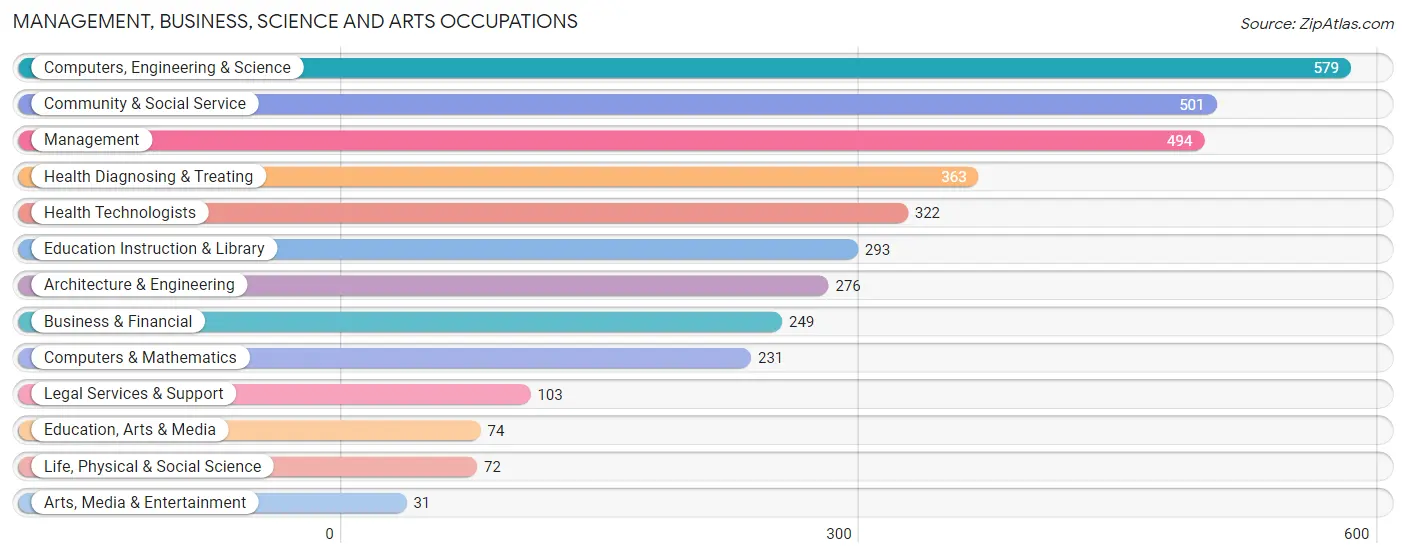
Management, Business, Science and Arts Occupations
The most common Management, Business, Science and Arts occupations in Pismo Beach are Computers, Engineering & Science (579 | 14.7%), Community & Social Service (501 | 12.7%), Management (494 | 12.5%), Health Diagnosing & Treating (363 | 9.2%), and Health Technologists (322 | 8.2%).
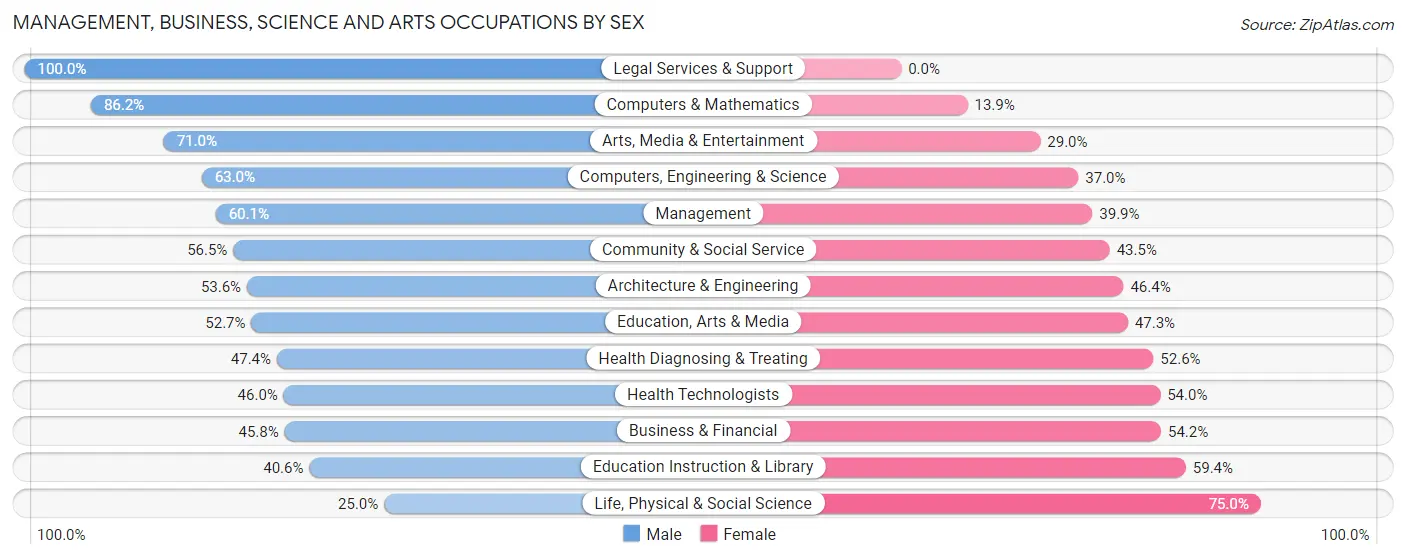
Management, Business, Science and Arts Occupations by Sex
Within the Management, Business, Science and Arts occupations in Pismo Beach, the most male-oriented occupations are Legal Services & Support (100.0%), Computers & Mathematics (86.2%), and Arts, Media & Entertainment (71.0%), while the most female-oriented occupations are Life, Physical & Social Science (75.0%), Education Instruction & Library (59.4%), and Business & Financial (54.2%).
| Occupation | Male | Female |
| Management | 297 (60.1%) | 197 (39.9%) |
| Business & Financial | 114 (45.8%) | 135 (54.2%) |
| Computers, Engineering & Science | 365 (63.0%) | 214 (37.0%) |
| Computers & Mathematics | 199 (86.2%) | 32 (13.9%) |
| Architecture & Engineering | 148 (53.6%) | 128 (46.4%) |
| Life, Physical & Social Science | 18 (25.0%) | 54 (75.0%) |
| Community & Social Service | 283 (56.5%) | 218 (43.5%) |
| Education, Arts & Media | 39 (52.7%) | 35 (47.3%) |
| Legal Services & Support | 103 (100.0%) | 0 (0.0%) |
| Education Instruction & Library | 119 (40.6%) | 174 (59.4%) |
| Arts, Media & Entertainment | 22 (71.0%) | 9 (29.0%) |
| Health Diagnosing & Treating | 172 (47.4%) | 191 (52.6%) |
| Health Technologists | 148 (46.0%) | 174 (54.0%) |
| Total (Category) | 1,231 (56.3%) | 955 (43.7%) |
| Total (Overall) | 2,427 (61.6%) | 1,512 (38.4%) |
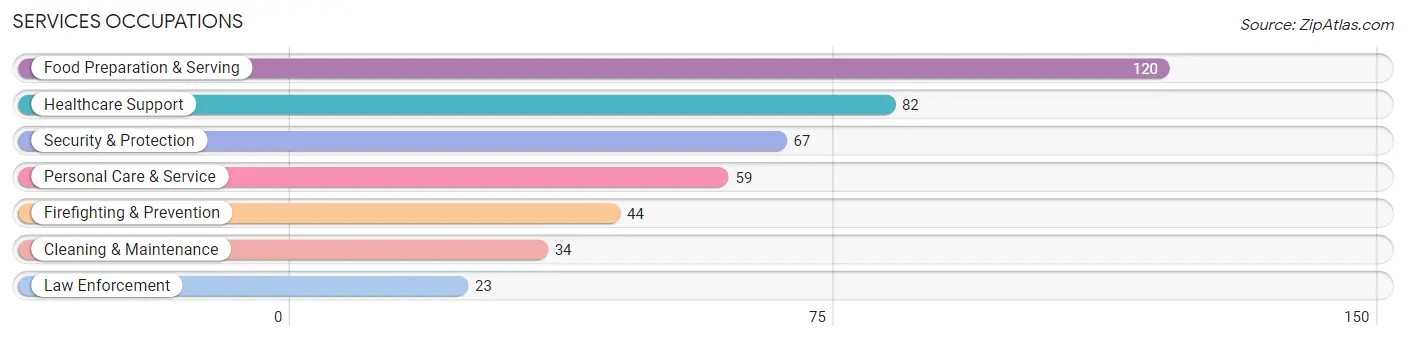
Services Occupations
The most common Services occupations in Pismo Beach are Food Preparation & Serving (120 | 3.0%), Healthcare Support (82 | 2.1%), Security & Protection (67 | 1.7%), Personal Care & Service (59 | 1.5%), and Firefighting & Prevention (44 | 1.1%).
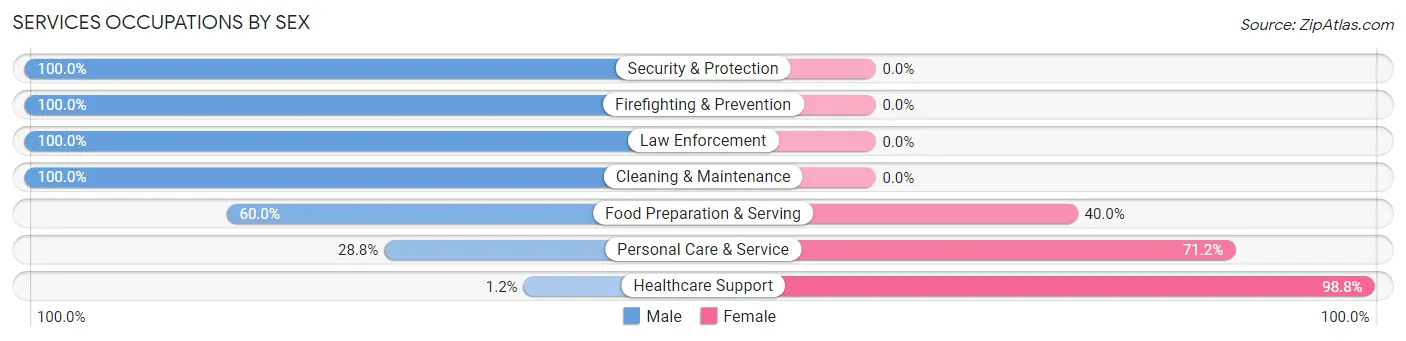
Services Occupations by Sex
Within the Services occupations in Pismo Beach, the most male-oriented occupations are Security & Protection (100.0%), Firefighting & Prevention (100.0%), and Law Enforcement (100.0%), while the most female-oriented occupations are Healthcare Support (98.8%), Personal Care & Service (71.2%), and Food Preparation & Serving (40.0%).
| Occupation | Male | Female |
| Healthcare Support | 1 (1.2%) | 81 (98.8%) |
| Security & Protection | 67 (100.0%) | 0 (0.0%) |
| Firefighting & Prevention | 44 (100.0%) | 0 (0.0%) |
| Law Enforcement | 23 (100.0%) | 0 (0.0%) |
| Food Preparation & Serving | 72 (60.0%) | 48 (40.0%) |
| Cleaning & Maintenance | 34 (100.0%) | 0 (0.0%) |
| Personal Care & Service | 17 (28.8%) | 42 (71.2%) |
| Total (Category) | 191 (52.8%) | 171 (47.2%) |
| Total (Overall) | 2,427 (61.6%) | 1,512 (38.4%) |
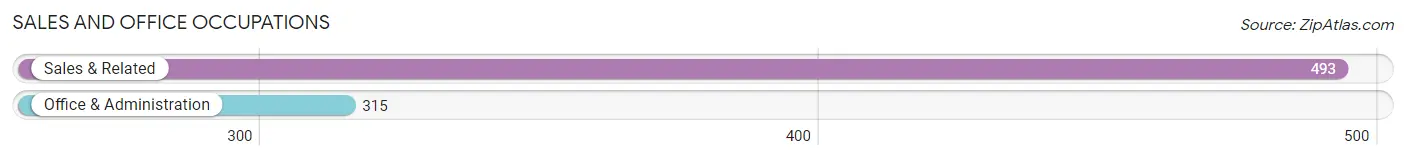
Sales and Office Occupations
The most common Sales and Office occupations in Pismo Beach are Sales & Related (493 | 12.5%), and Office & Administration (315 | 8.0%).
Sales and Office Occupations by Sex
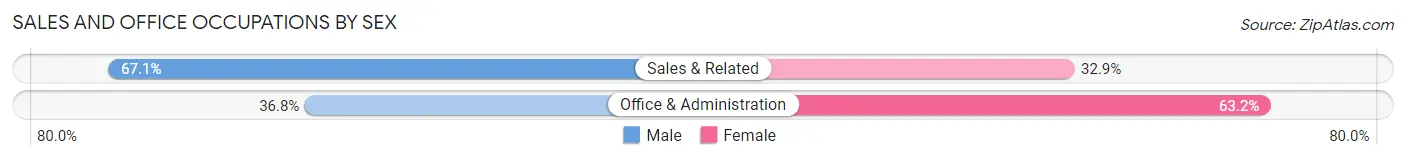
| Occupation | Male | Female |
| Sales & Related | 331 (67.1%) | 162 (32.9%) |
| Office & Administration | 116 (36.8%) | 199 (63.2%) |
| Total (Category) | 447 (55.3%) | 361 (44.7%) |
| Total (Overall) | 2,427 (61.6%) | 1,512 (38.4%) |
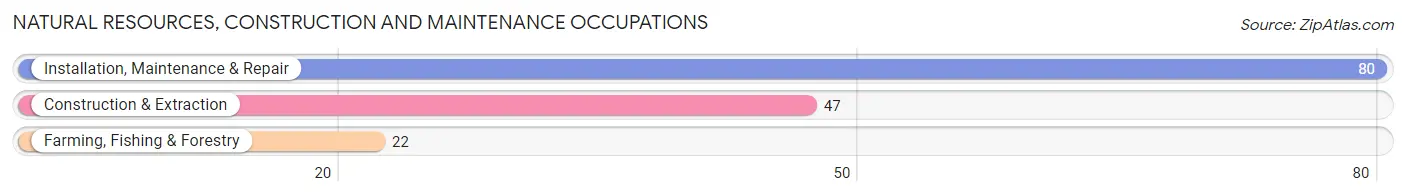
Natural Resources, Construction and Maintenance Occupations
The most common Natural Resources, Construction and Maintenance occupations in Pismo Beach are Installation, Maintenance & Repair (80 | 2.0%), Construction & Extraction (47 | 1.2%), and Farming, Fishing & Forestry (22 | 0.6%).
Natural Resources, Construction and Maintenance Occupations by Sex
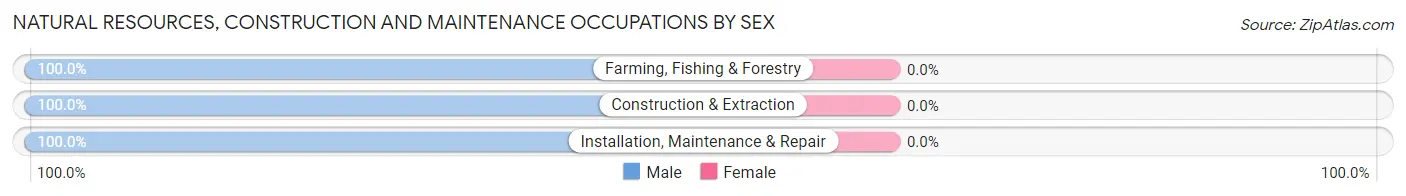
| Occupation | Male | Female |
| Farming, Fishing & Forestry | 22 (100.0%) | 0 (0.0%) |
| Construction & Extraction | 47 (100.0%) | 0 (0.0%) |
| Installation, Maintenance & Repair | 80 (100.0%) | 0 (0.0%) |
| Total (Category) | 149 (100.0%) | 0 (0.0%) |
| Total (Overall) | 2,427 (61.6%) | 1,512 (38.4%) |
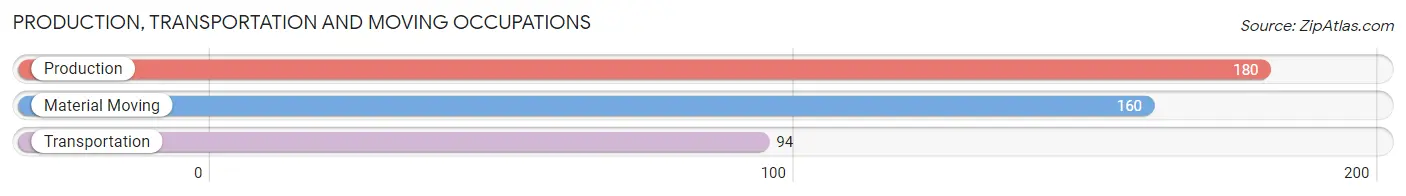
Production, Transportation and Moving Occupations
The most common Production, Transportation and Moving occupations in Pismo Beach are Production (180 | 4.6%), Material Moving (160 | 4.1%), and Transportation (94 | 2.4%).
Production, Transportation and Moving Occupations by Sex
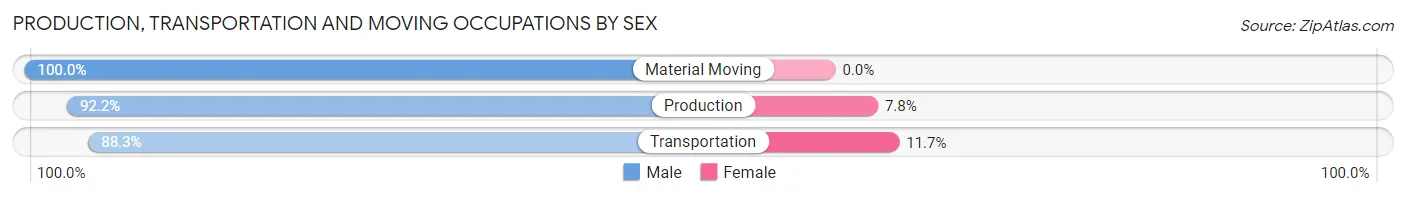
| Occupation | Male | Female |
| Production | 166 (92.2%) | 14 (7.8%) |
| Transportation | 83 (88.3%) | 11 (11.7%) |
| Material Moving | 160 (100.0%) | 0 (0.0%) |
| Total (Category) | 409 (94.2%) | 25 (5.8%) |
| Total (Overall) | 2,427 (61.6%) | 1,512 (38.4%) |
Employment Industries by Sex in Pismo Beach
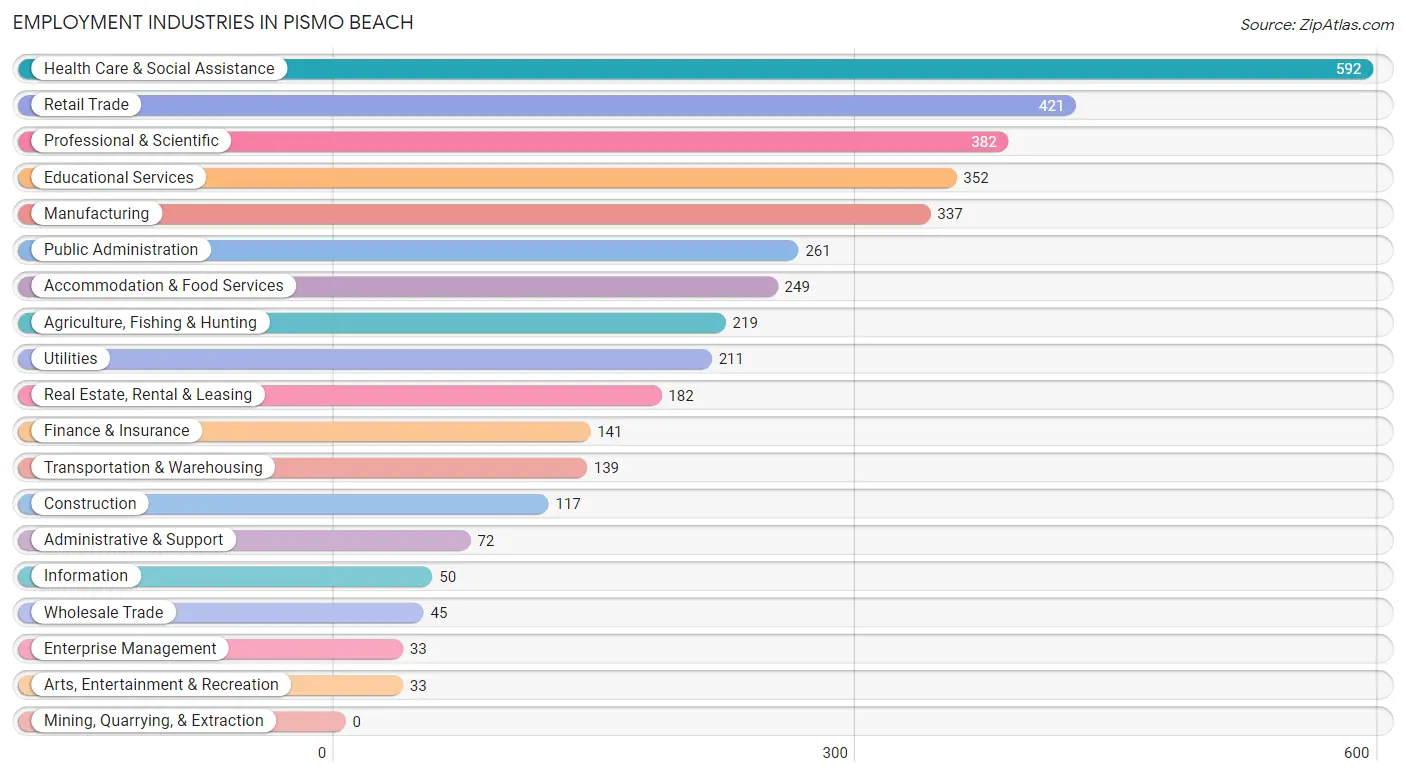
Employment Industries in Pismo Beach
The major employment industries in Pismo Beach include Health Care & Social Assistance (592 | 15.0%), Retail Trade (421 | 10.7%), Professional & Scientific (382 | 9.7%), Educational Services (352 | 8.9%), and Manufacturing (337 | 8.6%).
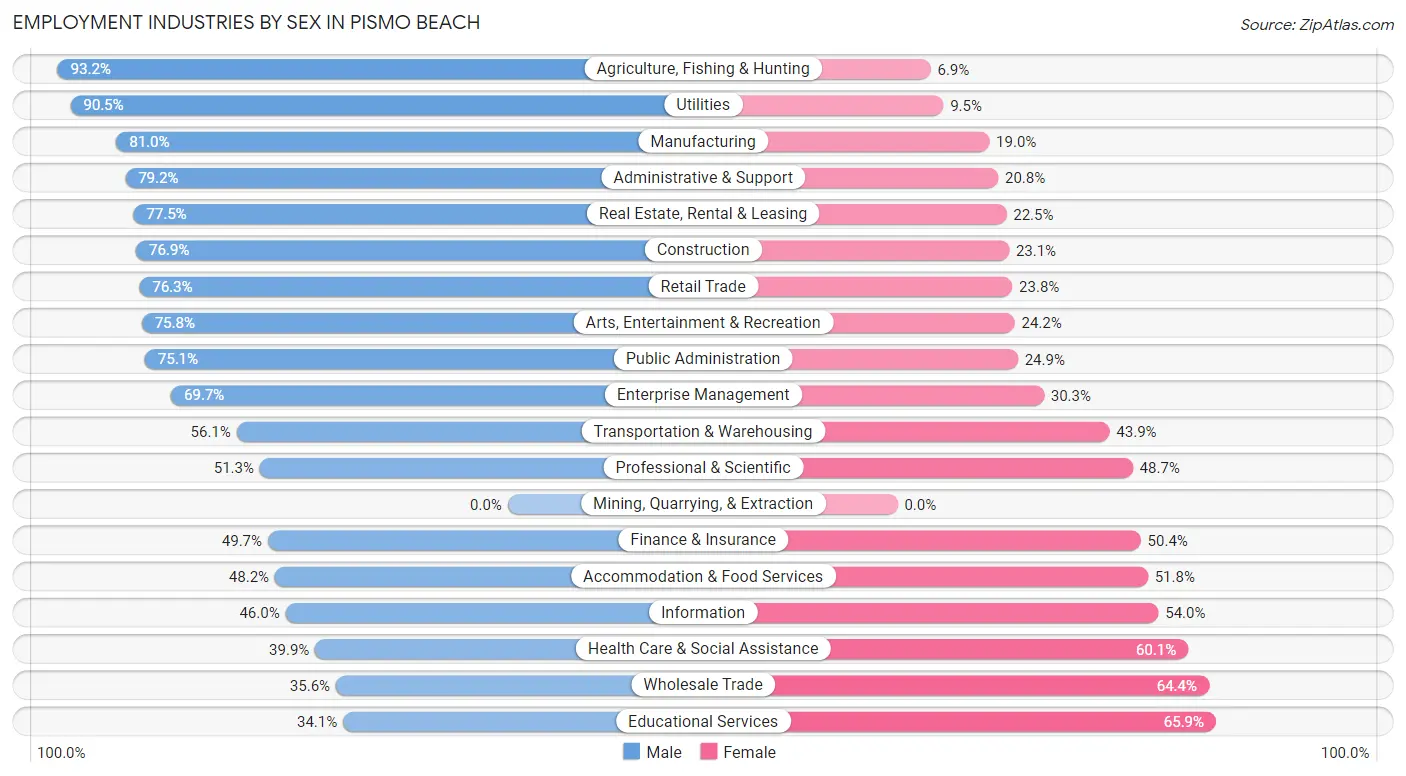
Employment Industries by Sex in Pismo Beach
The Pismo Beach industries that see more men than women are Agriculture, Fishing & Hunting (93.1%), Utilities (90.5%), and Manufacturing (81.0%), whereas the industries that tend to have a higher number of women are Educational Services (65.9%), Wholesale Trade (64.4%), and Health Care & Social Assistance (60.1%).
| Industry | Male | Female |
| Agriculture, Fishing & Hunting | 204 (93.1%) | 15 (6.9%) |
| Mining, Quarrying, & Extraction | 0 (0.0%) | 0 (0.0%) |
| Construction | 90 (76.9%) | 27 (23.1%) |
| Manufacturing | 273 (81.0%) | 64 (19.0%) |
| Wholesale Trade | 16 (35.6%) | 29 (64.4%) |
| Retail Trade | 321 (76.2%) | 100 (23.7%) |
| Transportation & Warehousing | 78 (56.1%) | 61 (43.9%) |
| Utilities | 191 (90.5%) | 20 (9.5%) |
| Information | 23 (46.0%) | 27 (54.0%) |
| Finance & Insurance | 70 (49.6%) | 71 (50.3%) |
| Real Estate, Rental & Leasing | 141 (77.5%) | 41 (22.5%) |
| Professional & Scientific | 196 (51.3%) | 186 (48.7%) |
| Enterprise Management | 23 (69.7%) | 10 (30.3%) |
| Administrative & Support | 57 (79.2%) | 15 (20.8%) |
| Educational Services | 120 (34.1%) | 232 (65.9%) |
| Health Care & Social Assistance | 236 (39.9%) | 356 (60.1%) |
| Arts, Entertainment & Recreation | 25 (75.8%) | 8 (24.2%) |
| Accommodation & Food Services | 120 (48.2%) | 129 (51.8%) |
| Public Administration | 196 (75.1%) | 65 (24.9%) |
| Total | 2,427 (61.6%) | 1,512 (38.4%) |
Education in Pismo Beach
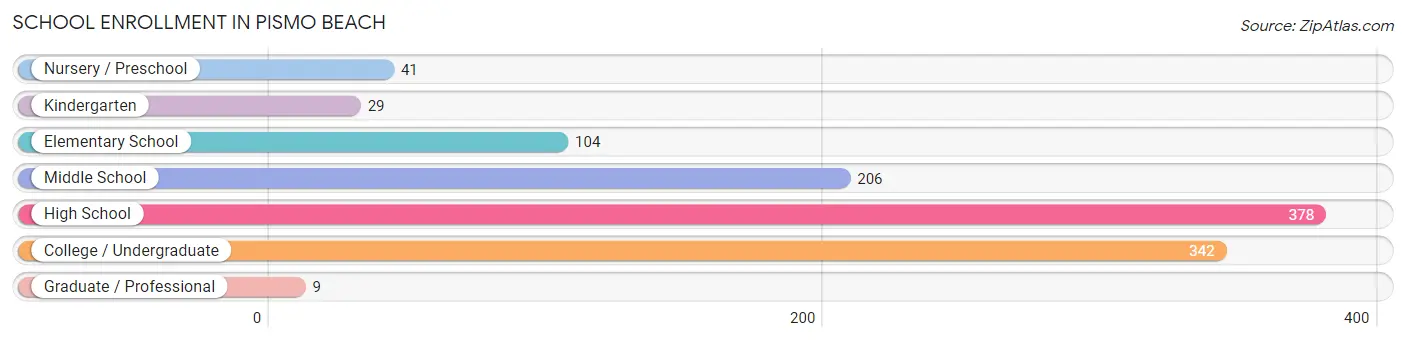
School Enrollment in Pismo Beach
The most common levels of schooling among the 1,109 students in Pismo Beach are high school (378 | 34.1%), college / undergraduate (342 | 30.8%), and middle school (206 | 18.6%).
| School Level | # Students | % Students |
| Nursery / Preschool | 41 | 3.7% |
| Kindergarten | 29 | 2.6% |
| Elementary School | 104 | 9.4% |
| Middle School | 206 | 18.6% |
| High School | 378 | 34.1% |
| College / Undergraduate | 342 | 30.8% |
| Graduate / Professional | 9 | 0.8% |
| Total | 1,109 | 100.0% |
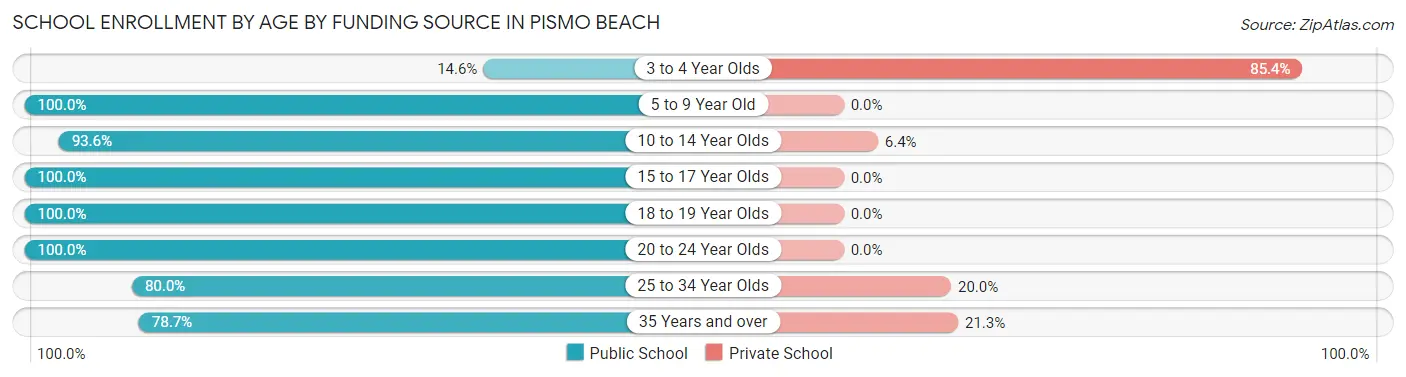
School Enrollment by Age by Funding Source in Pismo Beach
Out of a total of 1,109 students who are enrolled in schools in Pismo Beach, 104 (9.4%) attend a private institution, while the remaining 1,005 (90.6%) are enrolled in public schools. The age group of 3 to 4 year olds has the highest likelihood of being enrolled in private schools, with 41 (85.4% in the age bracket) enrolled. Conversely, the age group of 5 to 9 year old has the lowest likelihood of being enrolled in a private school, with 117 (100.0% in the age bracket) attending a public institution.
| Age Bracket | Public School | Private School |
| 3 to 4 Year Olds | 7 (14.6%) | 41 (85.4%) |
| 5 to 9 Year Old | 117 (100.0%) | 0 (0.0%) |
| 10 to 14 Year Olds | 294 (93.6%) | 20 (6.4%) |
| 15 to 17 Year Olds | 243 (100.0%) | 0 (0.0%) |
| 18 to 19 Year Olds | 55 (100.0%) | 0 (0.0%) |
| 20 to 24 Year Olds | 128 (100.0%) | 0 (0.0%) |
| 25 to 34 Year Olds | 28 (80.0%) | 7 (20.0%) |
| 35 Years and over | 133 (78.7%) | 36 (21.3%) |
| Total | 1,005 (90.6%) | 104 (9.4%) |
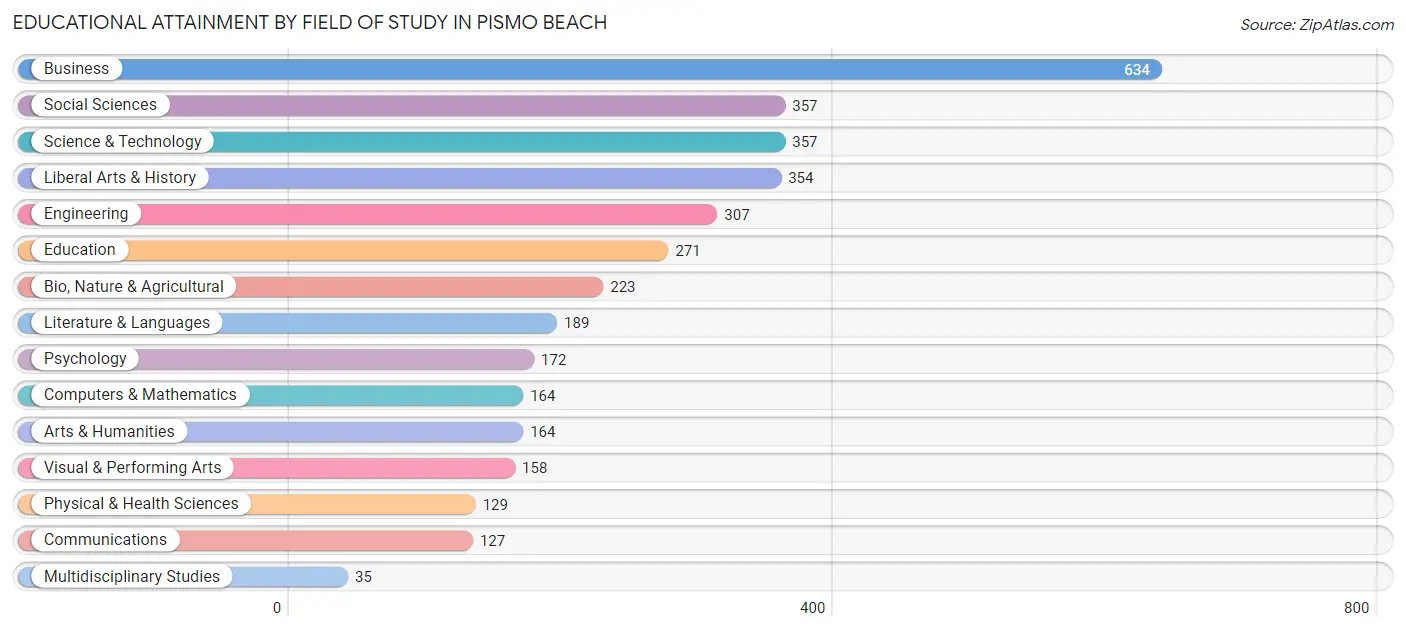
Educational Attainment by Field of Study in Pismo Beach
Business (634 | 17.4%), social sciences (357 | 9.8%), science & technology (357 | 9.8%), liberal arts & history (354 | 9.7%), and engineering (307 | 8.4%) are the most common fields of study among 3,641 individuals in Pismo Beach who have obtained a bachelor's degree or higher.
| Field of Study | # Graduates | % Graduates |
| Computers & Mathematics | 164 | 4.5% |
| Bio, Nature & Agricultural | 223 | 6.1% |
| Physical & Health Sciences | 129 | 3.5% |
| Psychology | 172 | 4.7% |
| Social Sciences | 357 | 9.8% |
| Engineering | 307 | 8.4% |
| Multidisciplinary Studies | 35 | 1.0% |
| Science & Technology | 357 | 9.8% |
| Business | 634 | 17.4% |
| Education | 271 | 7.4% |
| Literature & Languages | 189 | 5.2% |
| Liberal Arts & History | 354 | 9.7% |
| Visual & Performing Arts | 158 | 4.3% |
| Communications | 127 | 3.5% |
| Arts & Humanities | 164 | 4.5% |
| Total | 3,641 | 100.0% |
Transportation & Commute in Pismo Beach
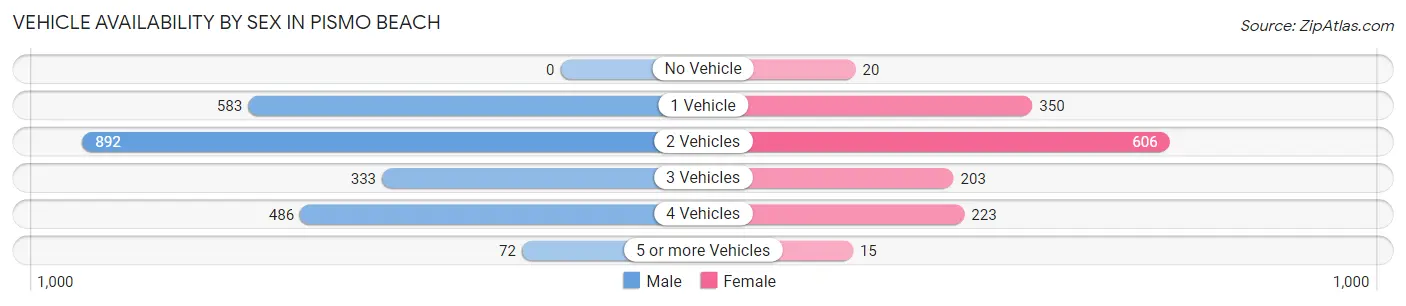
Vehicle Availability by Sex in Pismo Beach
The most prevalent vehicle ownership categories in Pismo Beach are males with 2 vehicles (892, accounting for 37.7%) and females with 2 vehicles (606, making up 62.9%).
| Vehicles Available | Male | Female |
| No Vehicle | 0 (0.0%) | 20 (1.4%) |
| 1 Vehicle | 583 (24.6%) | 350 (24.7%) |
| 2 Vehicles | 892 (37.7%) | 606 (42.8%) |
| 3 Vehicles | 333 (14.1%) | 203 (14.3%) |
| 4 Vehicles | 486 (20.5%) | 223 (15.7%) |
| 5 or more Vehicles | 72 (3.0%) | 15 (1.1%) |
| Total | 2,366 (100.0%) | 1,417 (100.0%) |
Commute Time in Pismo Beach
The most frequently occuring commute durations in Pismo Beach are 15 to 19 minutes (743 commuters, 23.4%), 20 to 24 minutes (579 commuters, 18.2%), and 5 to 9 minutes (470 commuters, 14.8%).
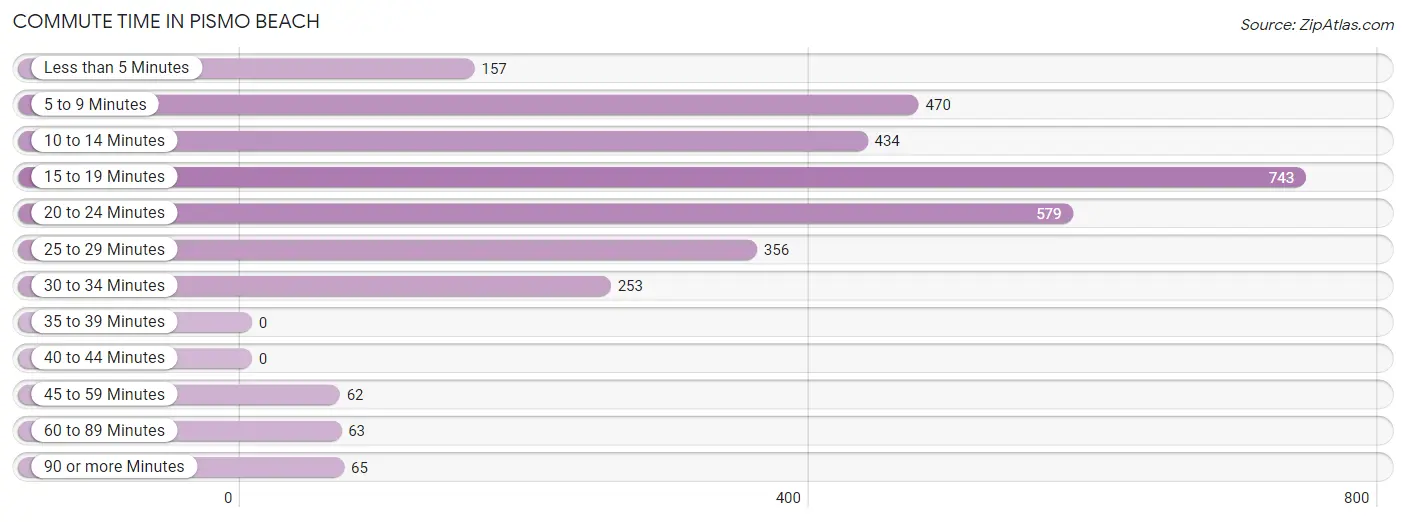
| Commute Time | # Commuters | % Commuters |
| Less than 5 Minutes | 157 | 4.9% |
| 5 to 9 Minutes | 470 | 14.8% |
| 10 to 14 Minutes | 434 | 13.6% |
| 15 to 19 Minutes | 743 | 23.4% |
| 20 to 24 Minutes | 579 | 18.2% |
| 25 to 29 Minutes | 356 | 11.2% |
| 30 to 34 Minutes | 253 | 8.0% |
| 35 to 39 Minutes | 0 | 0.0% |
| 40 to 44 Minutes | 0 | 0.0% |
| 45 to 59 Minutes | 62 | 1.9% |
| 60 to 89 Minutes | 63 | 2.0% |
| 90 or more Minutes | 65 | 2.0% |
Commute Time by Sex in Pismo Beach
The most common commute times in Pismo Beach are 15 to 19 minutes (499 commuters, 24.3%) for males and 20 to 24 minutes (268 commuters, 23.8%) for females.
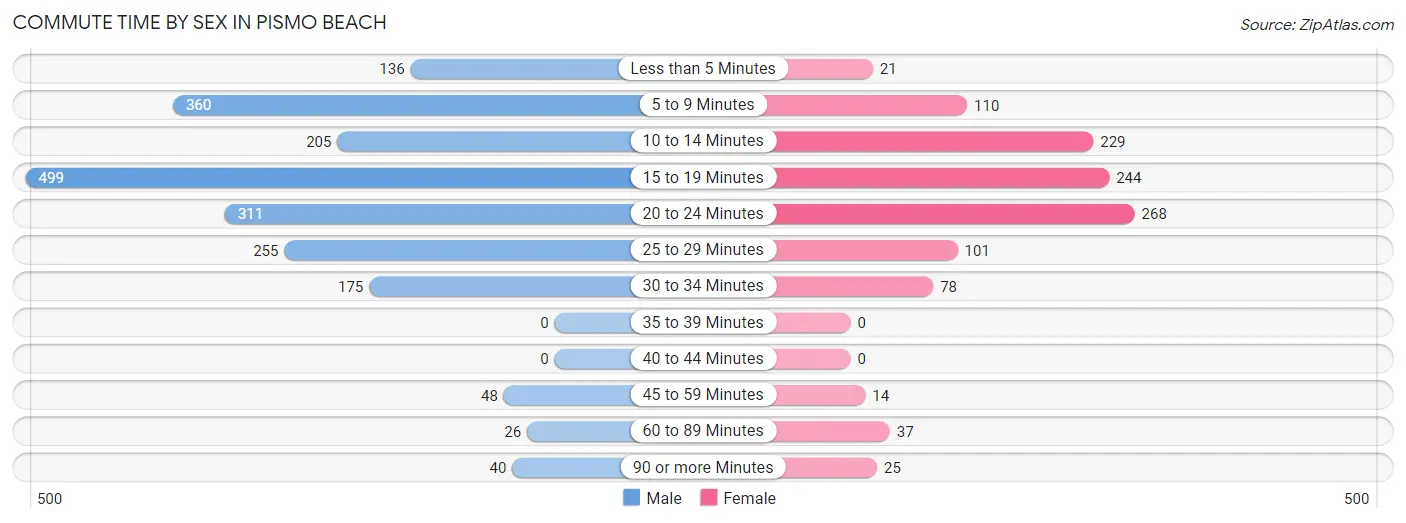
| Commute Time | Male | Female |
| Less than 5 Minutes | 136 (6.6%) | 21 (1.9%) |
| 5 to 9 Minutes | 360 (17.5%) | 110 (9.8%) |
| 10 to 14 Minutes | 205 (10.0%) | 229 (20.3%) |
| 15 to 19 Minutes | 499 (24.3%) | 244 (21.6%) |
| 20 to 24 Minutes | 311 (15.1%) | 268 (23.8%) |
| 25 to 29 Minutes | 255 (12.4%) | 101 (9.0%) |
| 30 to 34 Minutes | 175 (8.5%) | 78 (6.9%) |
| 35 to 39 Minutes | 0 (0.0%) | 0 (0.0%) |
| 40 to 44 Minutes | 0 (0.0%) | 0 (0.0%) |
| 45 to 59 Minutes | 48 (2.3%) | 14 (1.2%) |
| 60 to 89 Minutes | 26 (1.3%) | 37 (3.3%) |
| 90 or more Minutes | 40 (1.9%) | 25 (2.2%) |
Time of Departure to Work by Sex in Pismo Beach
The most frequent times of departure to work in Pismo Beach are 8:00 AM to 8:29 AM (428, 20.8%) for males and 8:00 AM to 8:29 AM (260, 23.1%) for females.
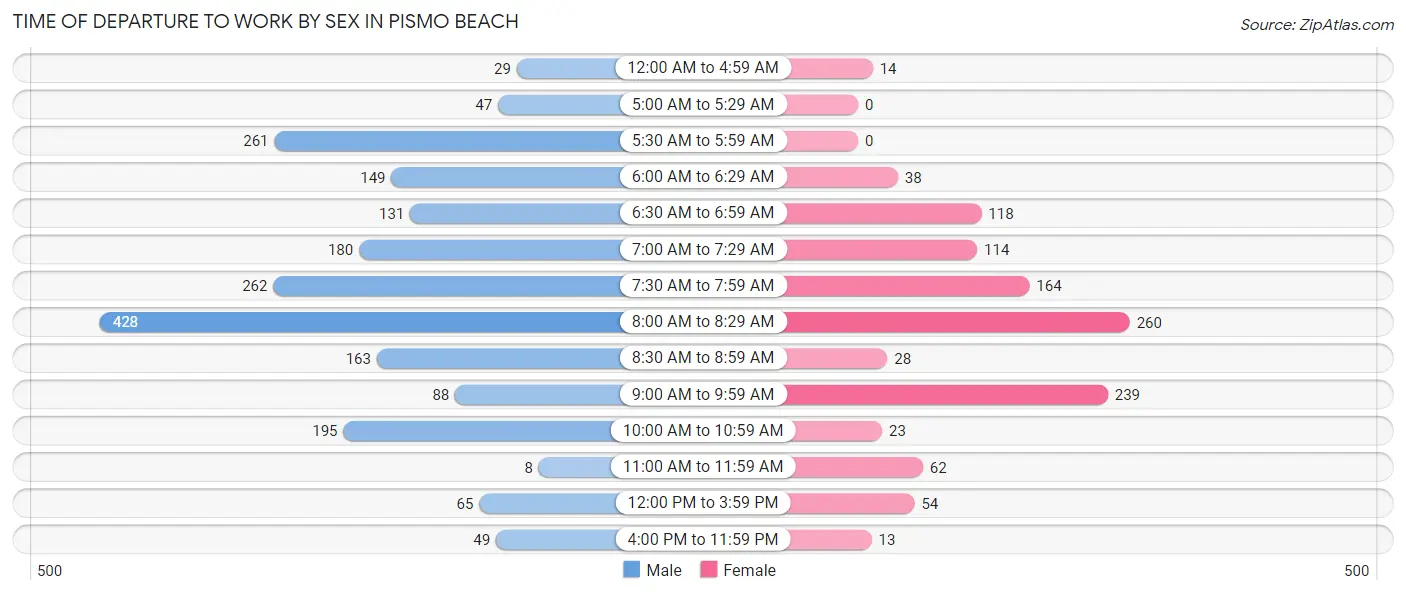
| Time of Departure | Male | Female |
| 12:00 AM to 4:59 AM | 29 (1.4%) | 14 (1.2%) |
| 5:00 AM to 5:29 AM | 47 (2.3%) | 0 (0.0%) |
| 5:30 AM to 5:59 AM | 261 (12.7%) | 0 (0.0%) |
| 6:00 AM to 6:29 AM | 149 (7.2%) | 38 (3.4%) |
| 6:30 AM to 6:59 AM | 131 (6.4%) | 118 (10.5%) |
| 7:00 AM to 7:29 AM | 180 (8.8%) | 114 (10.1%) |
| 7:30 AM to 7:59 AM | 262 (12.8%) | 164 (14.5%) |
| 8:00 AM to 8:29 AM | 428 (20.8%) | 260 (23.1%) |
| 8:30 AM to 8:59 AM | 163 (7.9%) | 28 (2.5%) |
| 9:00 AM to 9:59 AM | 88 (4.3%) | 239 (21.2%) |
| 10:00 AM to 10:59 AM | 195 (9.5%) | 23 (2.0%) |
| 11:00 AM to 11:59 AM | 8 (0.4%) | 62 (5.5%) |
| 12:00 PM to 3:59 PM | 65 (3.2%) | 54 (4.8%) |
| 4:00 PM to 11:59 PM | 49 (2.4%) | 13 (1.1%) |
| Total | 2,055 (100.0%) | 1,127 (100.0%) |
Housing Occupancy in Pismo Beach
Occupancy by Ownership in Pismo Beach
Of the total 4,113 dwellings in Pismo Beach, owner-occupied units account for 2,659 (64.6%), while renter-occupied units make up 1,454 (35.3%).
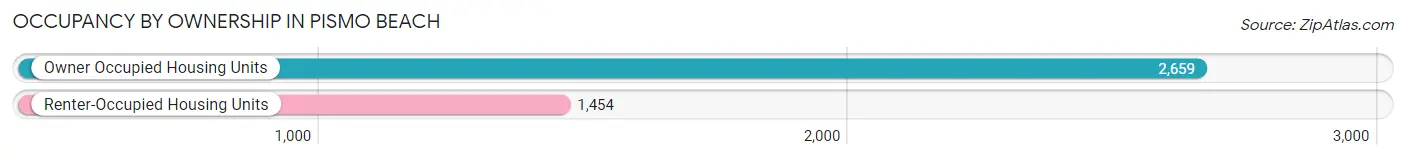
| Occupancy | # Housing Units | % Housing Units |
| Owner Occupied Housing Units | 2,659 | 64.6% |
| Renter-Occupied Housing Units | 1,454 | 35.3% |
| Total Occupied Housing Units | 4,113 | 100.0% |
Occupancy by Household Size in Pismo Beach
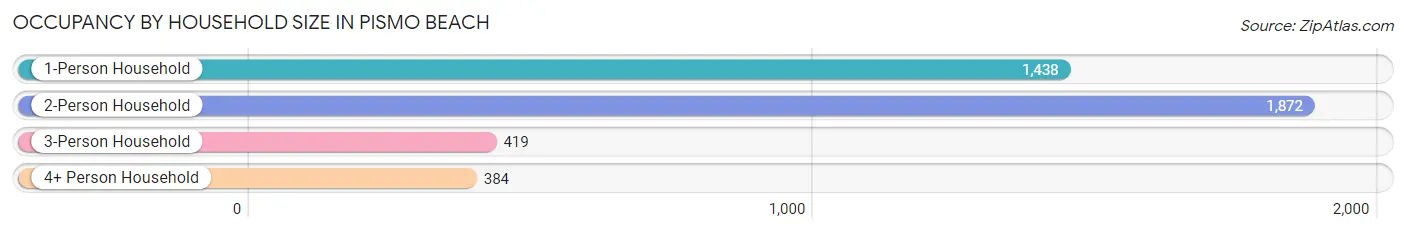
| Household Size | # Housing Units | % Housing Units |
| 1-Person Household | 1,438 | 35.0% |
| 2-Person Household | 1,872 | 45.5% |
| 3-Person Household | 419 | 10.2% |
| 4+ Person Household | 384 | 9.3% |
| Total Housing Units | 4,113 | 100.0% |
Occupancy by Ownership by Household Size in Pismo Beach
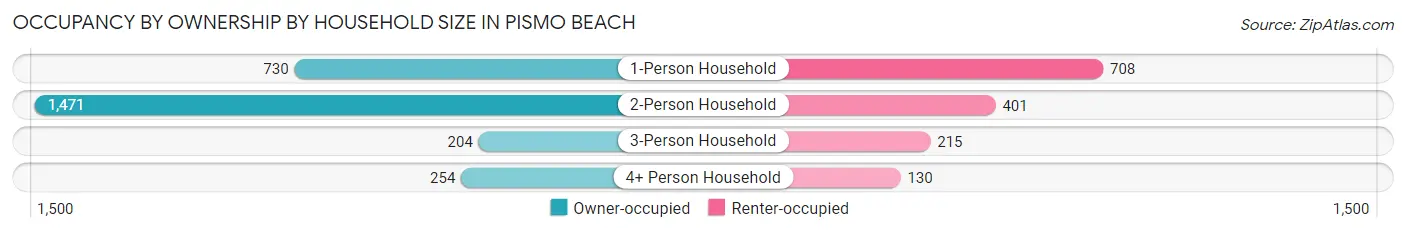
| Household Size | Owner-occupied | Renter-occupied |
| 1-Person Household | 730 (50.8%) | 708 (49.2%) |
| 2-Person Household | 1,471 (78.6%) | 401 (21.4%) |
| 3-Person Household | 204 (48.7%) | 215 (51.3%) |
| 4+ Person Household | 254 (66.1%) | 130 (33.9%) |
| Total Housing Units | 2,659 (64.6%) | 1,454 (35.3%) |
Occupancy by Educational Attainment in Pismo Beach
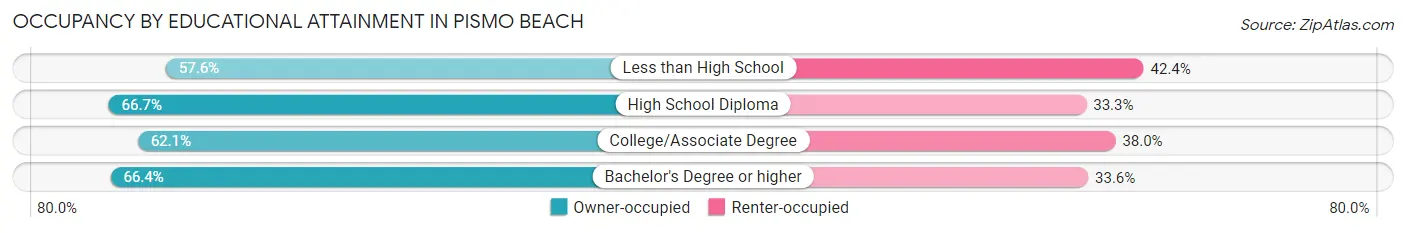
| Household Size | Owner-occupied | Renter-occupied |
| Less than High School | 95 (57.6%) | 70 (42.4%) |
| High School Diploma | 254 (66.7%) | 127 (33.3%) |
| College/Associate Degree | 829 (62.1%) | 507 (38.0%) |
| Bachelor's Degree or higher | 1,481 (66.4%) | 750 (33.6%) |
Occupancy by Age of Householder in Pismo Beach
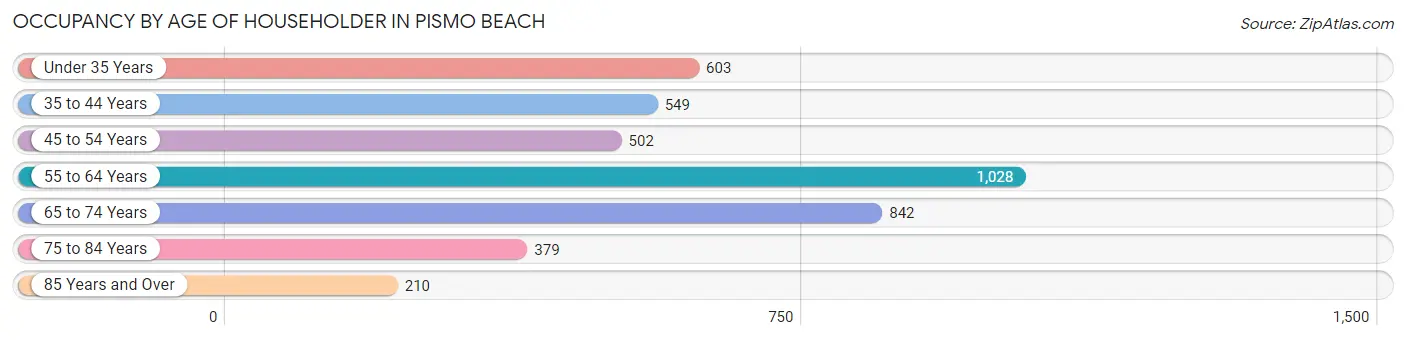
| Age Bracket | # Households | % Households |
| Under 35 Years | 603 | 14.7% |
| 35 to 44 Years | 549 | 13.4% |
| 45 to 54 Years | 502 | 12.2% |
| 55 to 64 Years | 1,028 | 25.0% |
| 65 to 74 Years | 842 | 20.5% |
| 75 to 84 Years | 379 | 9.2% |
| 85 Years and Over | 210 | 5.1% |
| Total | 4,113 | 100.0% |
Housing Finances in Pismo Beach
Median Income by Occupancy in Pismo Beach
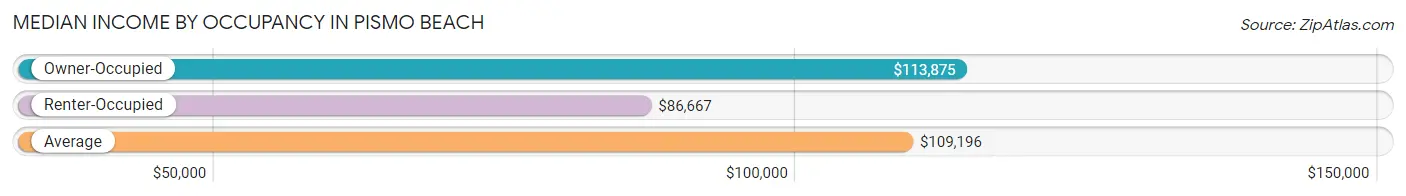
| Occupancy Type | # Households | Median Income |
| Owner-Occupied | 2,659 (64.6%) | $113,875 |
| Renter-Occupied | 1,454 (35.3%) | $86,667 |
| Average | 4,113 (100.0%) | $109,196 |
Occupancy by Householder Income Bracket in Pismo Beach
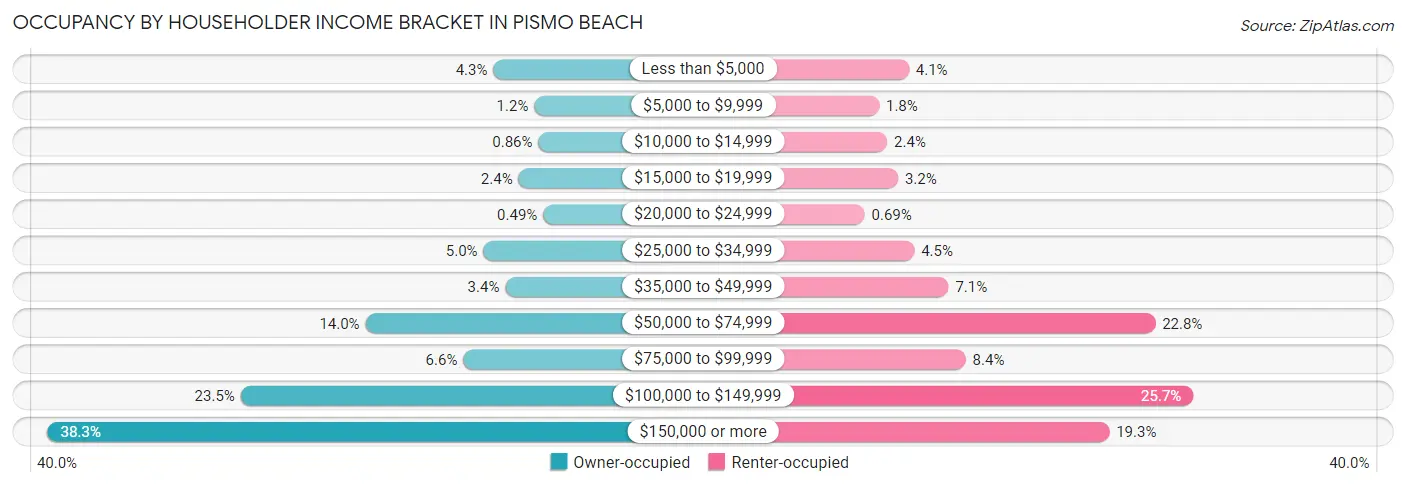
| Income Bracket | Owner-occupied | Renter-occupied |
| Less than $5,000 | 114 (4.3%) | 59 (4.1%) |
| $5,000 to $9,999 | 31 (1.2%) | 26 (1.8%) |
| $10,000 to $14,999 | 23 (0.9%) | 35 (2.4%) |
| $15,000 to $19,999 | 63 (2.4%) | 47 (3.2%) |
| $20,000 to $24,999 | 13 (0.5%) | 10 (0.7%) |
| $25,000 to $34,999 | 134 (5.0%) | 65 (4.5%) |
| $35,000 to $49,999 | 90 (3.4%) | 103 (7.1%) |
| $50,000 to $74,999 | 373 (14.0%) | 332 (22.8%) |
| $75,000 to $99,999 | 175 (6.6%) | 122 (8.4%) |
| $100,000 to $149,999 | 626 (23.5%) | 374 (25.7%) |
| $150,000 or more | 1,017 (38.3%) | 281 (19.3%) |
| Total | 2,659 (100.0%) | 1,454 (100.0%) |
Monthly Housing Cost Tiers in Pismo Beach
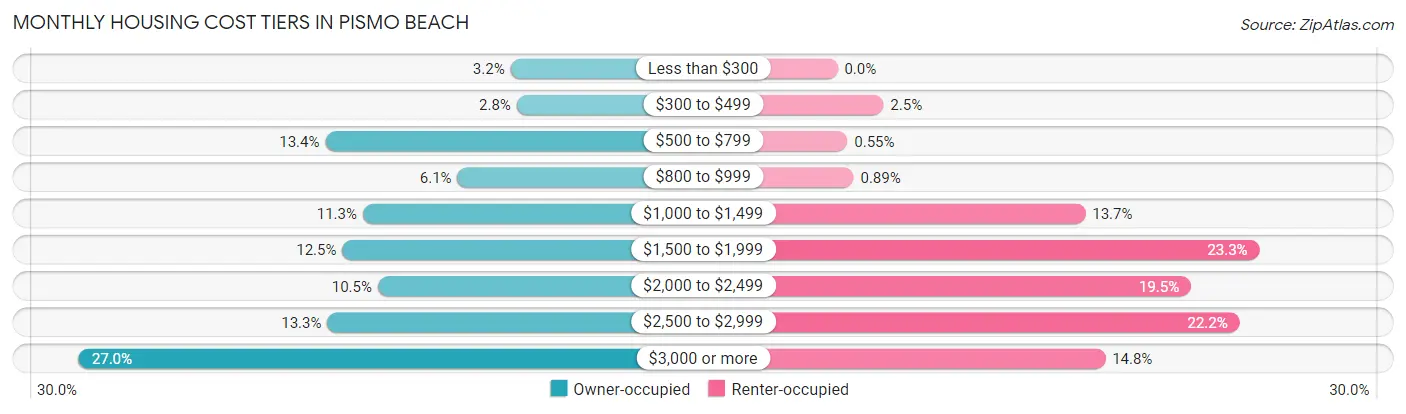
| Monthly Cost | Owner-occupied | Renter-occupied |
| Less than $300 | 84 (3.2%) | 0 (0.0%) |
| $300 to $499 | 75 (2.8%) | 37 (2.5%) |
| $500 to $799 | 356 (13.4%) | 8 (0.5%) |
| $800 to $999 | 162 (6.1%) | 13 (0.9%) |
| $1,000 to $1,499 | 301 (11.3%) | 199 (13.7%) |
| $1,500 to $1,999 | 331 (12.4%) | 339 (23.3%) |
| $2,000 to $2,499 | 279 (10.5%) | 284 (19.5%) |
| $2,500 to $2,999 | 353 (13.3%) | 323 (22.2%) |
| $3,000 or more | 718 (27.0%) | 215 (14.8%) |
| Total | 2,659 (100.0%) | 1,454 (100.0%) |
Physical Housing Characteristics in Pismo Beach
Housing Structures in Pismo Beach
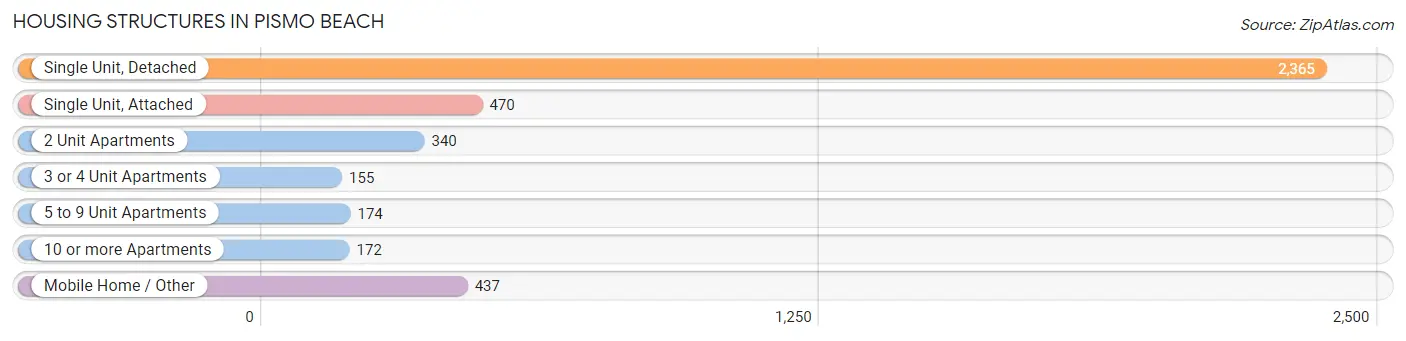
| Structure Type | # Housing Units | % Housing Units |
| Single Unit, Detached | 2,365 | 57.5% |
| Single Unit, Attached | 470 | 11.4% |
| 2 Unit Apartments | 340 | 8.3% |
| 3 or 4 Unit Apartments | 155 | 3.8% |
| 5 to 9 Unit Apartments | 174 | 4.2% |
| 10 or more Apartments | 172 | 4.2% |
| Mobile Home / Other | 437 | 10.6% |
| Total | 4,113 | 100.0% |
Housing Structures by Occupancy in Pismo Beach
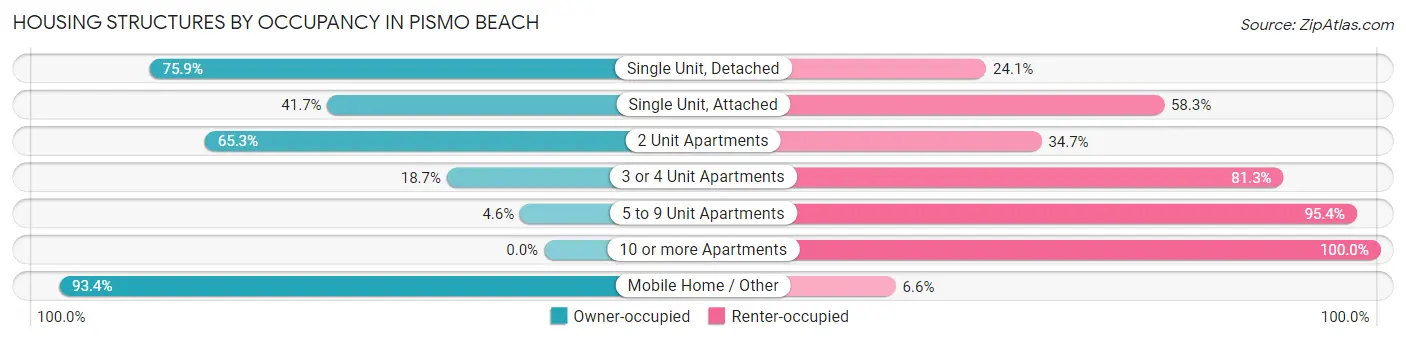
| Structure Type | Owner-occupied | Renter-occupied |
| Single Unit, Detached | 1,796 (75.9%) | 569 (24.1%) |
| Single Unit, Attached | 196 (41.7%) | 274 (58.3%) |
| 2 Unit Apartments | 222 (65.3%) | 118 (34.7%) |
| 3 or 4 Unit Apartments | 29 (18.7%) | 126 (81.3%) |
| 5 to 9 Unit Apartments | 8 (4.6%) | 166 (95.4%) |
| 10 or more Apartments | 0 (0.0%) | 172 (100.0%) |
| Mobile Home / Other | 408 (93.4%) | 29 (6.6%) |
| Total | 2,659 (64.6%) | 1,454 (35.3%) |
Housing Structures by Number of Rooms in Pismo Beach
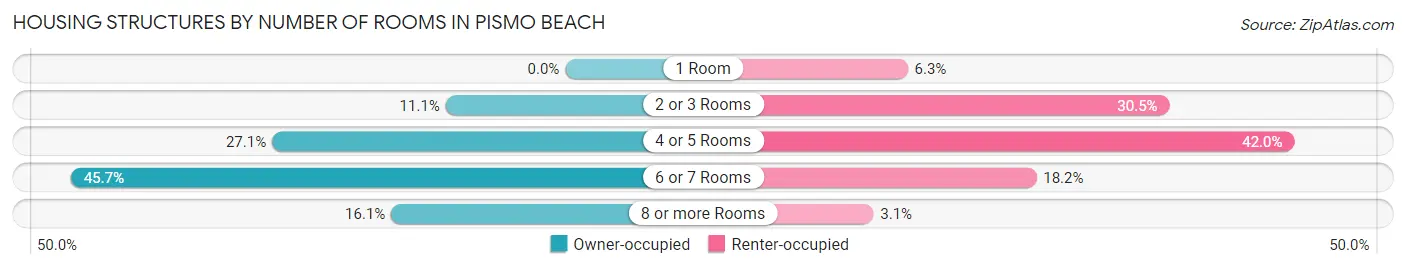
| Number of Rooms | Owner-occupied | Renter-occupied |
| 1 Room | 0 (0.0%) | 91 (6.3%) |
| 2 or 3 Rooms | 294 (11.1%) | 443 (30.5%) |
| 4 or 5 Rooms | 721 (27.1%) | 611 (42.0%) |
| 6 or 7 Rooms | 1,216 (45.7%) | 264 (18.2%) |
| 8 or more Rooms | 428 (16.1%) | 45 (3.1%) |
| Total | 2,659 (100.0%) | 1,454 (100.0%) |
Housing Structure by Heating Type in Pismo Beach
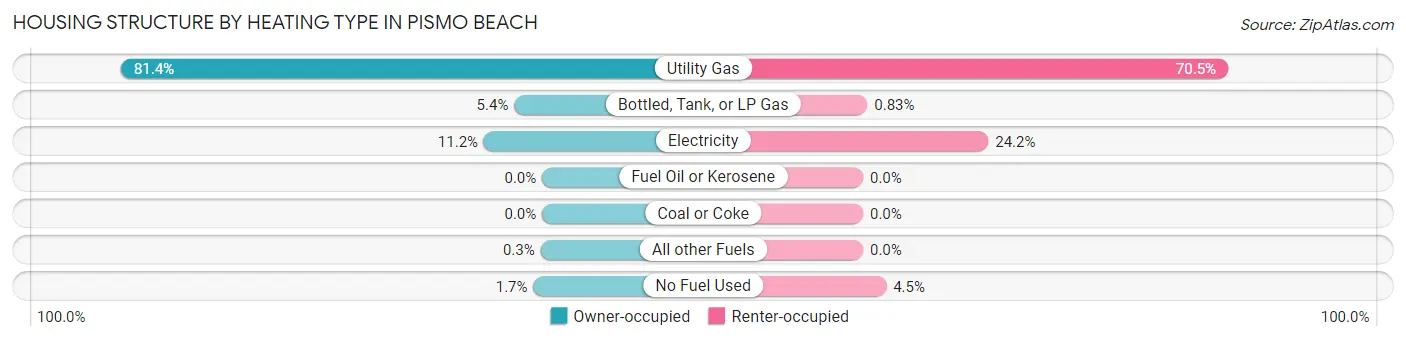
| Heating Type | Owner-occupied | Renter-occupied |
| Utility Gas | 2,164 (81.4%) | 1,025 (70.5%) |
| Bottled, Tank, or LP Gas | 143 (5.4%) | 12 (0.8%) |
| Electricity | 299 (11.2%) | 352 (24.2%) |
| Fuel Oil or Kerosene | 0 (0.0%) | 0 (0.0%) |
| Coal or Coke | 0 (0.0%) | 0 (0.0%) |
| All other Fuels | 8 (0.3%) | 0 (0.0%) |
| No Fuel Used | 45 (1.7%) | 65 (4.5%) |
| Total | 2,659 (100.0%) | 1,454 (100.0%) |
Household Vehicle Usage in Pismo Beach
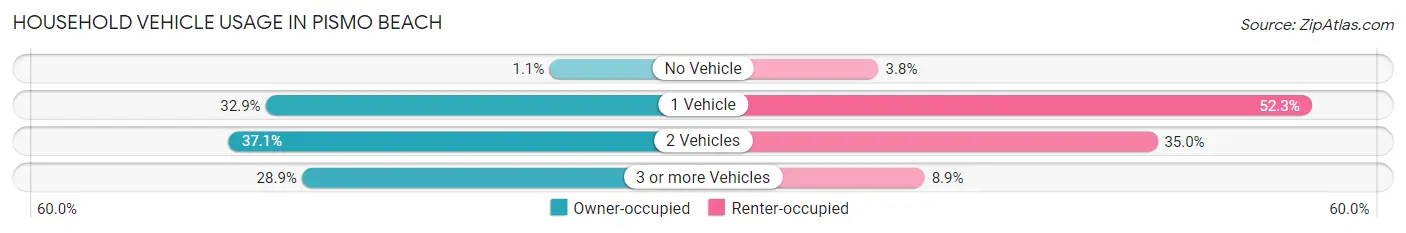
| Vehicles per Household | Owner-occupied | Renter-occupied |
| No Vehicle | 30 (1.1%) | 55 (3.8%) |
| 1 Vehicle | 875 (32.9%) | 760 (52.3%) |
| 2 Vehicles | 987 (37.1%) | 509 (35.0%) |
| 3 or more Vehicles | 767 (28.8%) | 130 (8.9%) |
| Total | 2,659 (100.0%) | 1,454 (100.0%) |
Real Estate & Mortgages in Pismo Beach
Real Estate and Mortgage Overview in Pismo Beach
| Characteristic | Without Mortgage | With Mortgage |
| Housing Units | 1,072 | 1,587 |
| Median Property Value | $943,300 | $943,800 |
| Median Household Income | $101,029 | $680 |
| Monthly Housing Costs | $845 | $718 |
| Real Estate Taxes | $5,631 | $166 |
Property Value by Mortgage Status in Pismo Beach
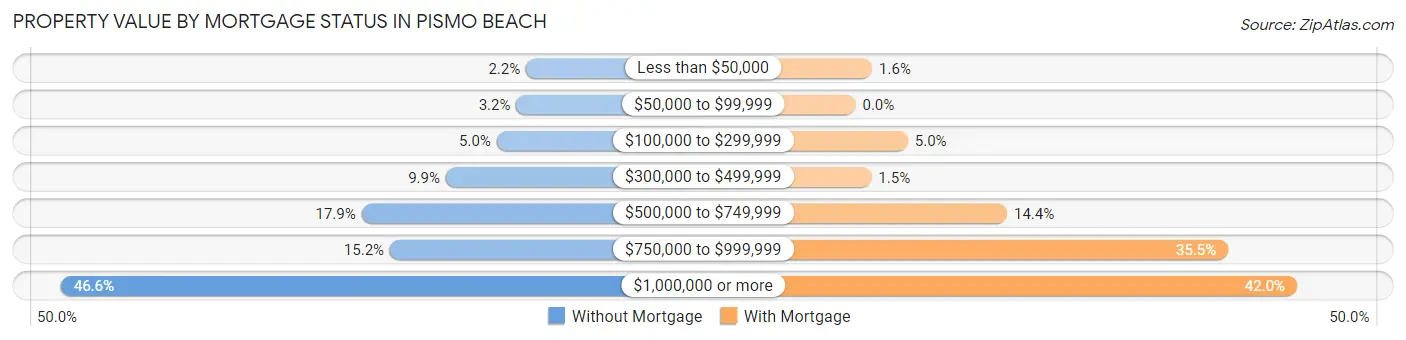
| Property Value | Without Mortgage | With Mortgage |
| Less than $50,000 | 24 (2.2%) | 25 (1.6%) |
| $50,000 to $99,999 | 34 (3.2%) | 0 (0.0%) |
| $100,000 to $299,999 | 54 (5.0%) | 79 (5.0%) |
| $300,000 to $499,999 | 106 (9.9%) | 24 (1.5%) |
| $500,000 to $749,999 | 192 (17.9%) | 229 (14.4%) |
| $750,000 to $999,999 | 163 (15.2%) | 563 (35.5%) |
| $1,000,000 or more | 499 (46.6%) | 667 (42.0%) |
| Total | 1,072 (100.0%) | 1,587 (100.0%) |
Household Income by Mortgage Status in Pismo Beach
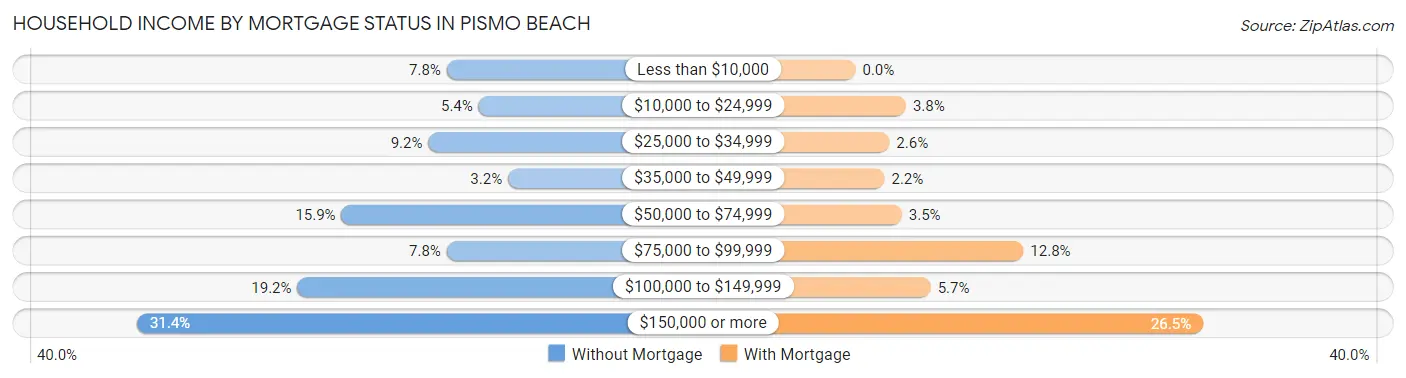
| Household Income | Without Mortgage | With Mortgage |
| Less than $10,000 | 84 (7.8%) | 0 (0.0%) |
| $10,000 to $24,999 | 58 (5.4%) | 61 (3.8%) |
| $25,000 to $34,999 | 99 (9.2%) | 41 (2.6%) |
| $35,000 to $49,999 | 34 (3.2%) | 35 (2.2%) |
| $50,000 to $74,999 | 170 (15.9%) | 56 (3.5%) |
| $75,000 to $99,999 | 84 (7.8%) | 203 (12.8%) |
| $100,000 to $149,999 | 206 (19.2%) | 91 (5.7%) |
| $150,000 or more | 337 (31.4%) | 420 (26.5%) |
| Total | 1,072 (100.0%) | 1,587 (100.0%) |
Property Value to Household Income Ratio in Pismo Beach
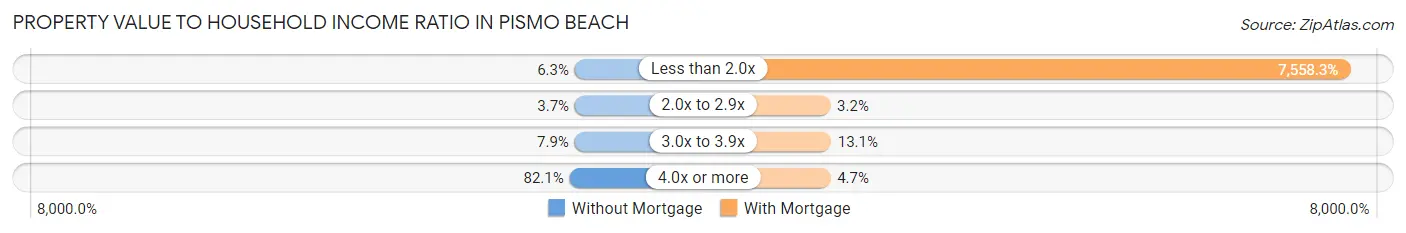
| Value-to-Income Ratio | Without Mortgage | With Mortgage |
| Less than 2.0x | 67 (6.2%) | 119,950 (7,558.3%) |
| 2.0x to 2.9x | 40 (3.7%) | 51 (3.2%) |
| 3.0x to 3.9x | 85 (7.9%) | 208 (13.1%) |
| 4.0x or more | 880 (82.1%) | 75 (4.7%) |
| Total | 1,072 (100.0%) | 1,587 (100.0%) |
Real Estate Taxes by Mortgage Status in Pismo Beach
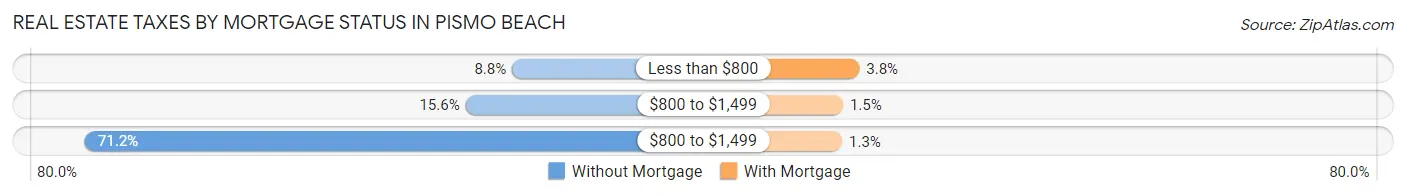
| Property Taxes | Without Mortgage | With Mortgage |
| Less than $800 | 94 (8.8%) | 61 (3.8%) |
| $800 to $1,499 | 167 (15.6%) | 23 (1.5%) |
| $800 to $1,499 | 763 (71.2%) | 21 (1.3%) |
| Total | 1,072 (100.0%) | 1,587 (100.0%) |
Health & Disability in Pismo Beach
Health Insurance Coverage by Age in Pismo Beach
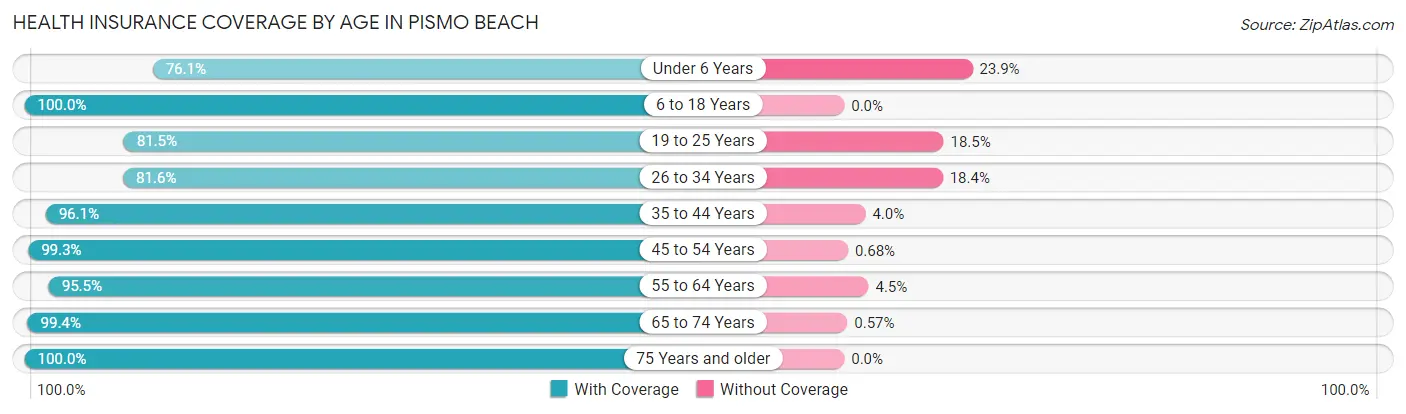
| Age Bracket | With Coverage | Without Coverage |
| Under 6 Years | 191 (76.1%) | 60 (23.9%) |
| 6 to 18 Years | 774 (100.0%) | 0 (0.0%) |
| 19 to 25 Years | 229 (81.5%) | 52 (18.5%) |
| 26 to 34 Years | 787 (81.6%) | 177 (18.4%) |
| 35 to 44 Years | 851 (96.1%) | 35 (4.0%) |
| 45 to 54 Years | 1,024 (99.3%) | 7 (0.7%) |
| 55 to 64 Years | 1,437 (95.5%) | 68 (4.5%) |
| 65 to 74 Years | 1,393 (99.4%) | 8 (0.6%) |
| 75 Years and older | 957 (100.0%) | 0 (0.0%) |
| Total | 7,643 (94.9%) | 407 (5.1%) |
Health Insurance Coverage by Citizenship Status in Pismo Beach
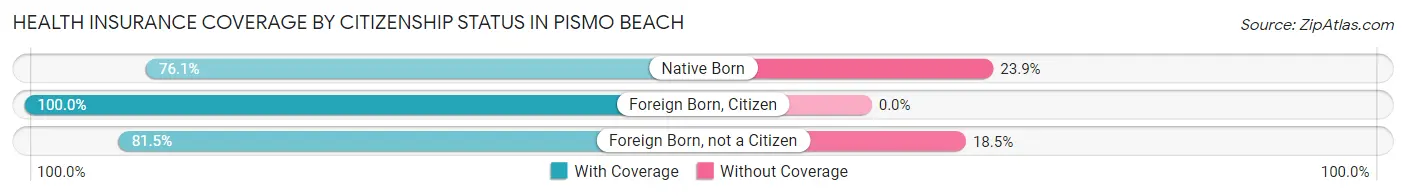
| Citizenship Status | With Coverage | Without Coverage |
| Native Born | 191 (76.1%) | 60 (23.9%) |
| Foreign Born, Citizen | 774 (100.0%) | 0 (0.0%) |
| Foreign Born, not a Citizen | 229 (81.5%) | 52 (18.5%) |
Health Insurance Coverage by Household Income in Pismo Beach
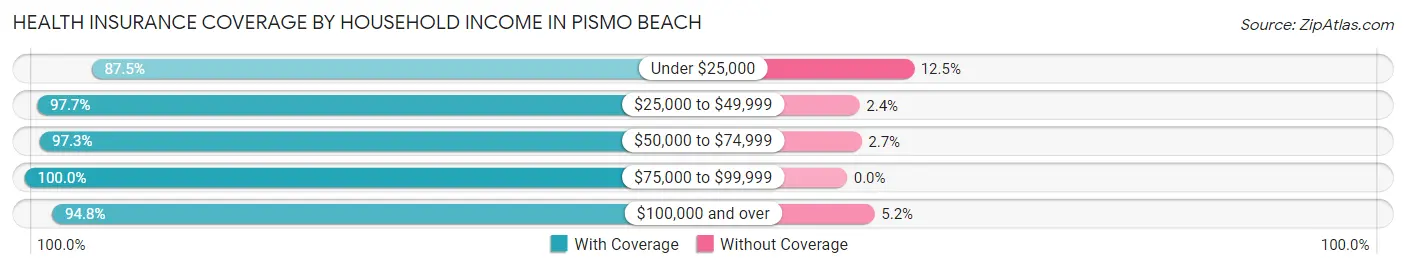
| Household Income | With Coverage | Without Coverage |
| Under $25,000 | 586 (87.5%) | 84 (12.5%) |
| $25,000 to $49,999 | 583 (97.7%) | 14 (2.4%) |
| $50,000 to $74,999 | 1,037 (97.3%) | 29 (2.7%) |
| $75,000 to $99,999 | 427 (100.0%) | 0 (0.0%) |
| $100,000 and over | 5,004 (94.8%) | 272 (5.2%) |
Public vs Private Health Insurance Coverage by Age in Pismo Beach
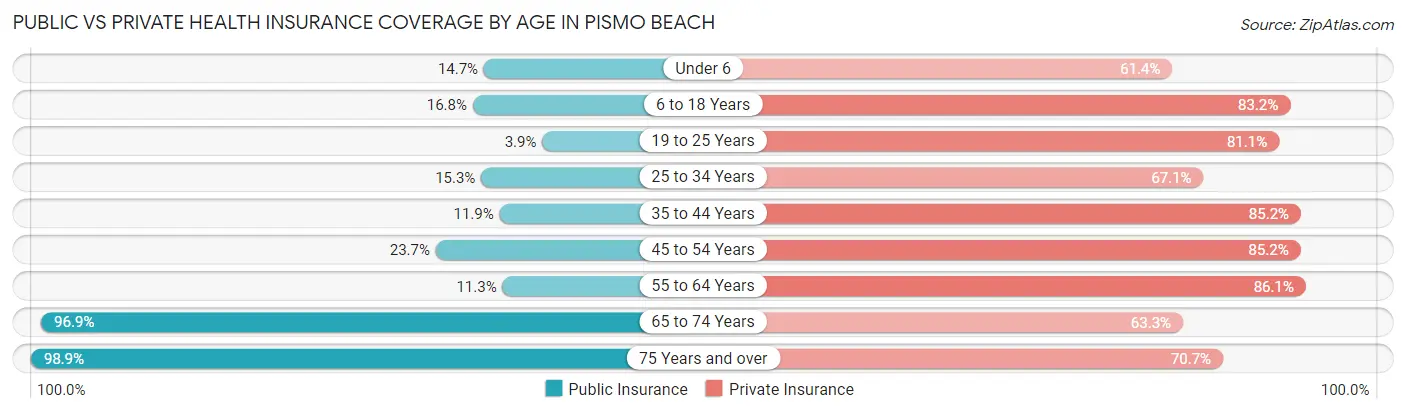
| Age Bracket | Public Insurance | Private Insurance |
| Under 6 | 37 (14.7%) | 154 (61.4%) |
| 6 to 18 Years | 130 (16.8%) | 644 (83.2%) |
| 19 to 25 Years | 11 (3.9%) | 228 (81.1%) |
| 25 to 34 Years | 147 (15.2%) | 647 (67.1%) |
| 35 to 44 Years | 105 (11.8%) | 755 (85.2%) |
| 45 to 54 Years | 244 (23.7%) | 878 (85.2%) |
| 55 to 64 Years | 170 (11.3%) | 1,296 (86.1%) |
| 65 to 74 Years | 1,358 (96.9%) | 887 (63.3%) |
| 75 Years and over | 946 (98.9%) | 677 (70.7%) |
| Total | 3,148 (39.1%) | 6,166 (76.6%) |
Disability Status by Sex by Age in Pismo Beach
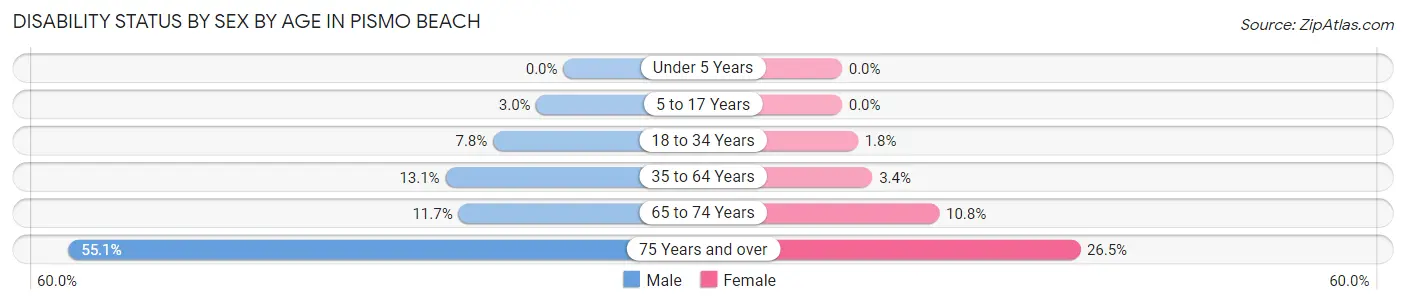
| Age Bracket | Male | Female |
| Under 5 Years | 0 (0.0%) | 0 (0.0%) |
| 5 to 17 Years | 11 (3.0%) | 0 (0.0%) |
| 18 to 34 Years | 59 (7.8%) | 10 (1.8%) |
| 35 to 64 Years | 244 (13.1%) | 53 (3.4%) |
| 65 to 74 Years | 59 (11.7%) | 97 (10.8%) |
| 75 Years and over | 247 (55.1%) | 135 (26.5%) |
Disability Class by Sex by Age in Pismo Beach
Disability Class: Hearing Difficulty
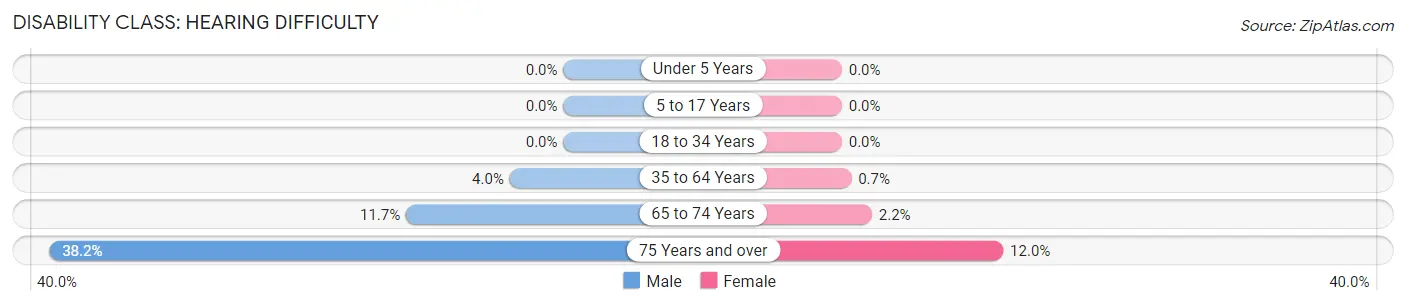
| Age Bracket | Male | Female |
| Under 5 Years | 0 (0.0%) | 0 (0.0%) |
| 5 to 17 Years | 0 (0.0%) | 0 (0.0%) |
| 18 to 34 Years | 0 (0.0%) | 0 (0.0%) |
| 35 to 64 Years | 74 (4.0%) | 11 (0.7%) |
| 65 to 74 Years | 59 (11.7%) | 20 (2.2%) |
| 75 Years and over | 171 (38.2%) | 61 (12.0%) |
Disability Class: Vision Difficulty
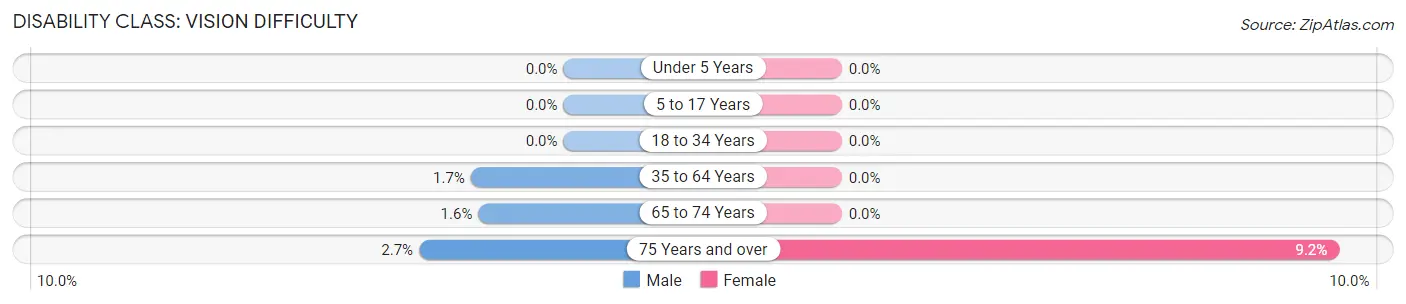
| Age Bracket | Male | Female |
| Under 5 Years | 0 (0.0%) | 0 (0.0%) |
| 5 to 17 Years | 0 (0.0%) | 0 (0.0%) |
| 18 to 34 Years | 0 (0.0%) | 0 (0.0%) |
| 35 to 64 Years | 32 (1.7%) | 0 (0.0%) |
| 65 to 74 Years | 8 (1.6%) | 0 (0.0%) |
| 75 Years and over | 12 (2.7%) | 47 (9.2%) |
Disability Class: Cognitive Difficulty
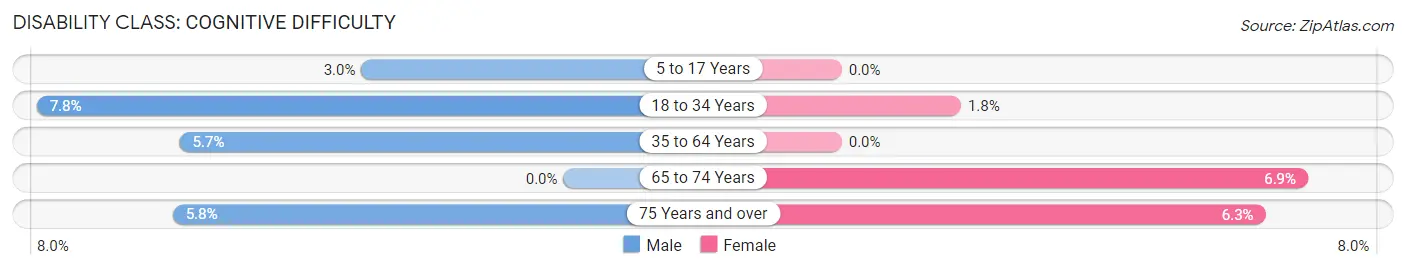
| Age Bracket | Male | Female |
| 5 to 17 Years | 11 (3.0%) | 0 (0.0%) |
| 18 to 34 Years | 59 (7.8%) | 10 (1.8%) |
| 35 to 64 Years | 106 (5.7%) | 0 (0.0%) |
| 65 to 74 Years | 0 (0.0%) | 62 (6.9%) |
| 75 Years and over | 26 (5.8%) | 32 (6.3%) |
Disability Class: Ambulatory Difficulty
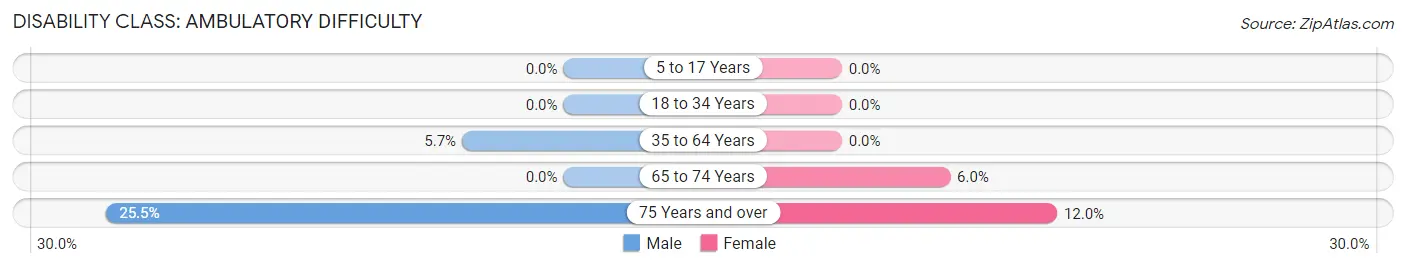
| Age Bracket | Male | Female |
| 5 to 17 Years | 0 (0.0%) | 0 (0.0%) |
| 18 to 34 Years | 0 (0.0%) | 0 (0.0%) |
| 35 to 64 Years | 105 (5.7%) | 0 (0.0%) |
| 65 to 74 Years | 0 (0.0%) | 54 (6.0%) |
| 75 Years and over | 114 (25.5%) | 61 (12.0%) |
Disability Class: Self-Care Difficulty
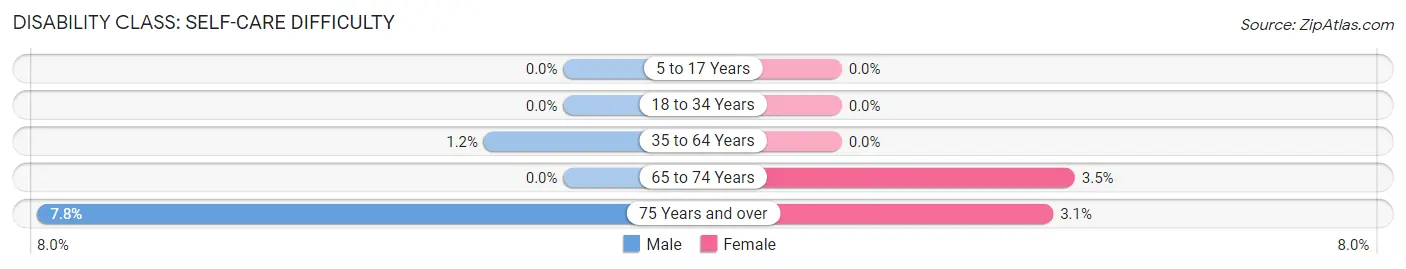
| Age Bracket | Male | Female |
| 5 to 17 Years | 0 (0.0%) | 0 (0.0%) |
| 18 to 34 Years | 0 (0.0%) | 0 (0.0%) |
| 35 to 64 Years | 22 (1.2%) | 0 (0.0%) |
| 65 to 74 Years | 0 (0.0%) | 31 (3.5%) |
| 75 Years and over | 35 (7.8%) | 16 (3.1%) |
Technology Access in Pismo Beach
Computing Device Access in Pismo Beach
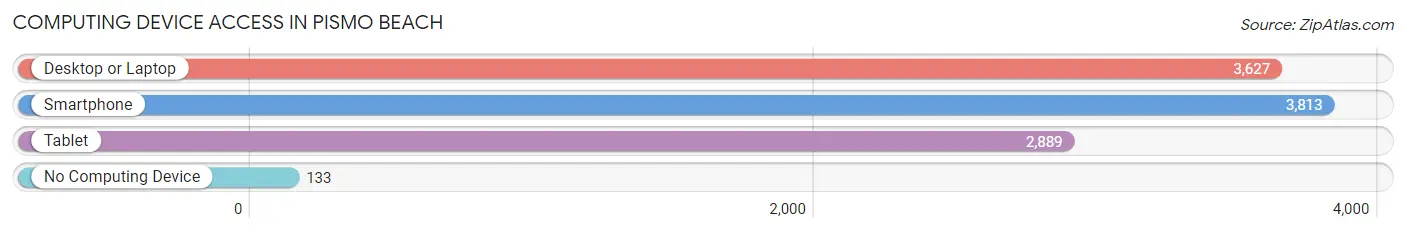
| Device Type | # Households | % Households |
| Desktop or Laptop | 3,627 | 88.2% |
| Smartphone | 3,813 | 92.7% |
| Tablet | 2,889 | 70.2% |
| No Computing Device | 133 | 3.2% |
| Total | 4,113 | 100.0% |
Internet Access in Pismo Beach
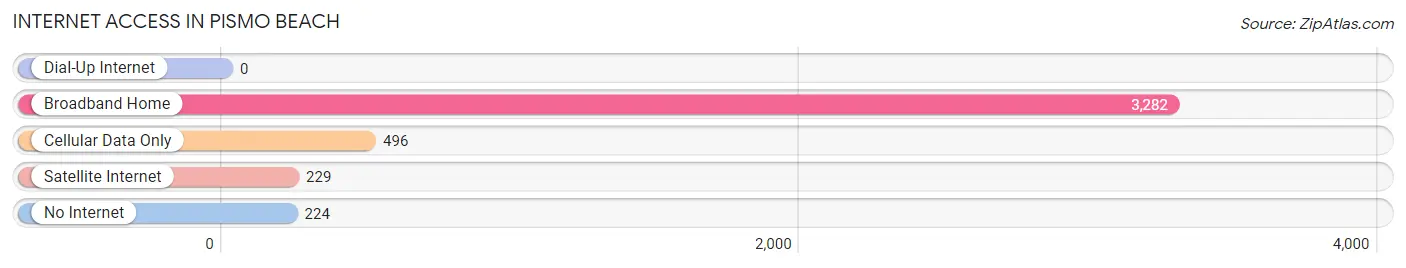
| Internet Type | # Households | % Households |
| Dial-Up Internet | 0 | 0.0% |
| Broadband Home | 3,282 | 79.8% |
| Cellular Data Only | 496 | 12.1% |
| Satellite Internet | 229 | 5.6% |
| No Internet | 224 | 5.4% |
| Total | 4,113 | 100.0% |
Pismo Beach Summary
Pismo Beach is a city located in San Luis Obispo County, California, United States. It is situated on the Pacific Coast Highway, about halfway between Los Angeles and San Francisco. The population was 8,551 at the 2010 census, up from 7,655 at the 2000 census. Pismo Beach is a popular tourist destination due to its mild climate, beautiful beaches, and numerous attractions.
History
The area that is now Pismo Beach was originally inhabited by the Chumash people, who lived in the area for thousands of years. The first European to explore the area was Portuguese explorer Juan Rodríguez Cabrillo, who sailed up the California coast in 1542. The area was later explored by Spanish missionaries, who established the nearby Mission San Luis Obispo de Tolosa in 1772.
In the late 19th century, the area was settled by ranchers and farmers, who established the town of Pismo Beach in 1891. The town was named after the nearby Pismo clam, which was a popular food source for the local Chumash people. The town grew steadily throughout the 20th century, and by the 1950s it had become a popular tourist destination.
Geography
Pismo Beach is located at 35°7′25″N 120°37′52″W (35.123611, -120.631111). It is situated on the Pacific Coast Highway, about halfway between Los Angeles and San Francisco. The city covers an area of 4.2 square miles (10.8 km2), all of which is land.
The city is bordered by the Pacific Ocean to the west, the city of Grover Beach to the north, the city of Arroyo Grande to the east, and the city of Shell Beach to the south. Pismo Beach is located in a temperate climate zone, with mild temperatures year-round.
Economy
Pismo Beach’s economy is largely based on tourism. The city is home to numerous hotels, restaurants, and attractions, which draw visitors from all over the world. The city is also home to a number of businesses, including retail stores, professional services, and manufacturing companies.
The city’s largest employer is the Pismo Beach Unified School District, which employs over 1,000 people. Other major employers include the Pismo Beach City Hall, the Pismo Beach Police Department, and the Pismo Beach Fire Department.
Demographics
As of the 2010 census, there were 8,551 people, 3,845 households, and 2,072 families residing in the city. The population density was 2,037.2 people per square mile (788.7/km2). There were 4,093 housing units at an average density of 983.2 per square mile (379.9/km2).
The racial makeup of the city was 79.2% White, 0.7% African American, 0.7% Native American, 1.3% Asian, 0.2% Pacific Islander, 14.2% from other races, and 3.8% from two or more races. Hispanic or Latino of any race were 28.2% of the population.
The median income for a household in the city was $50,945, and the median income for a family was $60,945. Males had a median income of $41,945 versus $31,945 for females. The per capita income for the city was $25,945. About 8.2% of families and 11.2% of the population were below the poverty line, including 15.2% of those under age 18 and 6.2% of those age 65 or over.
Common Questions
What is Per Capita Income in Pismo Beach?
Per Capita income in Pismo Beach is $71,752.
What is the Median Family Income in Pismo Beach?
Median Family Income in Pismo Beach is $145,069.
What is the Median Household income in Pismo Beach?
Median Household Income in Pismo Beach is $109,196.
What is Income or Wage Gap in Pismo Beach?
Income or Wage Gap in Pismo Beach is 31.2%.
Women in Pismo Beach earn 68.8 cents for every dollar earned by a man.
What is Inequality or Gini Index in Pismo Beach?
Inequality or Gini Index in Pismo Beach is 0.46.
What is the Total Population of Pismo Beach?
Total Population of Pismo Beach is 8,050.
What is the Total Male Population of Pismo Beach?
Total Male Population of Pismo Beach is 4,103.
What is the Total Female Population of Pismo Beach?
Total Female Population of Pismo Beach is 3,947.
What is the Ratio of Males per 100 Females in Pismo Beach?
There are 103.95 Males per 100 Females in Pismo Beach.
What is the Ratio of Females per 100 Males in Pismo Beach?
There are 96.20 Females per 100 Males in Pismo Beach.
What is the Median Population Age in Pismo Beach?
Median Population Age in Pismo Beach is 54.1 Years.
What is the Average Family Size in Pismo Beach
Average Family Size in Pismo Beach is 2.5 People.
What is the Average Household Size in Pismo Beach
Average Household Size in Pismo Beach is 1.9 People.
How Large is the Labor Force in Pismo Beach?
There are 4,050 People in the Labor Forcein in Pismo Beach.
What is the Percentage of People in the Labor Force in Pismo Beach?
56.5% of People are in the Labor Force in Pismo Beach.
What is the Unemployment Rate in Pismo Beach?
Unemployment Rate in Pismo Beach is 2.7%.