Burnt Ranch, CA Map & Demographics
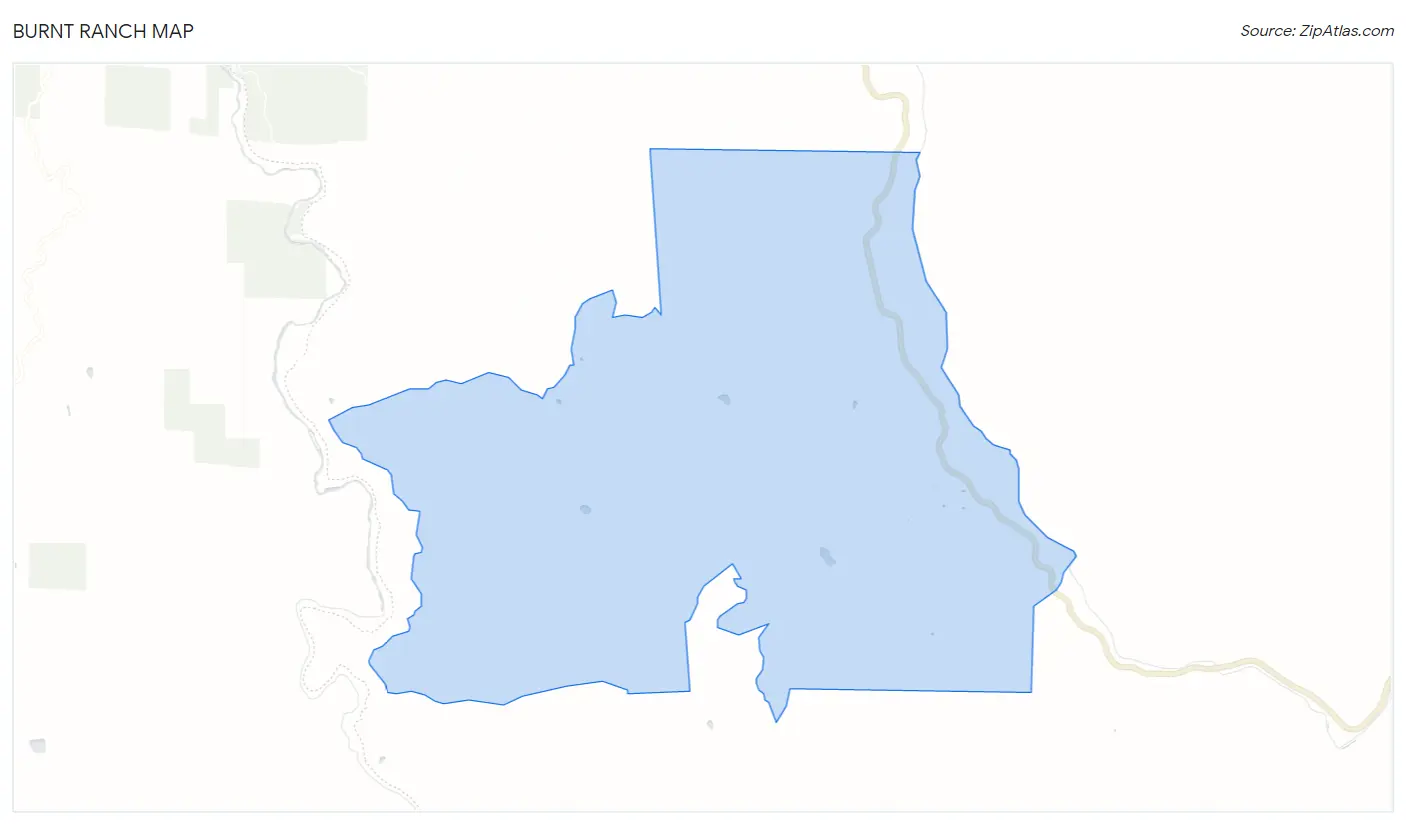
Burnt Ranch Map
Burnt Ranch Overview
$15,540
PER CAPITA INCOME
$28,516
AVG FAMILY INCOME
$55,357
AVG HOUSEHOLD INCOME
0.38
INEQUALITY / GINI INDEX
228
TOTAL POPULATION
120
MALE POPULATION
108
FEMALE POPULATION
111.11
MALES / 100 FEMALES
90.00
FEMALES / 100 MALES
45.7
MEDIAN AGE
2.7
AVG FAMILY SIZE
2.6
AVG HOUSEHOLD SIZE
77
LABOR FORCE [ PEOPLE ]
38.5%
PERCENT IN LABOR FORCE
Burnt Ranch Zip Codes
Income in Burnt Ranch
Income Overview in Burnt Ranch
Per Capita Income in Burnt Ranch is $15,540, while median incomes of families and households are $28,516 and $55,357 respectively.
| Characteristic | Number | Measure |
| Per Capita Income | 228 | $15,540 |
| Median Family Income | 66 | $28,516 |
| Mean Family Income | 66 | $30,818 |
| Median Household Income | 88 | $55,357 |
| Mean Household Income | 88 | $40,124 |
| Income Deficit | 66 | $0 |
| Wage / Income Gap (%) | 228 | 0.00% |
| Wage / Income Gap ($) | 228 | 100.00¢ per $1 |
| Gini / Inequality Index | 228 | 0.38 |
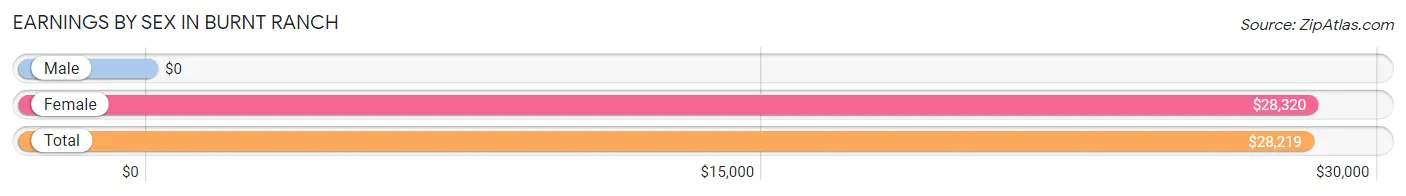
Earnings by Sex in Burnt Ranch
| Sex | Number | Average Earnings |
| Male | 16 (20.8%) | $0 |
| Female | 61 (79.2%) | $28,320 |
| Total | 77 (100.0%) | $28,219 |
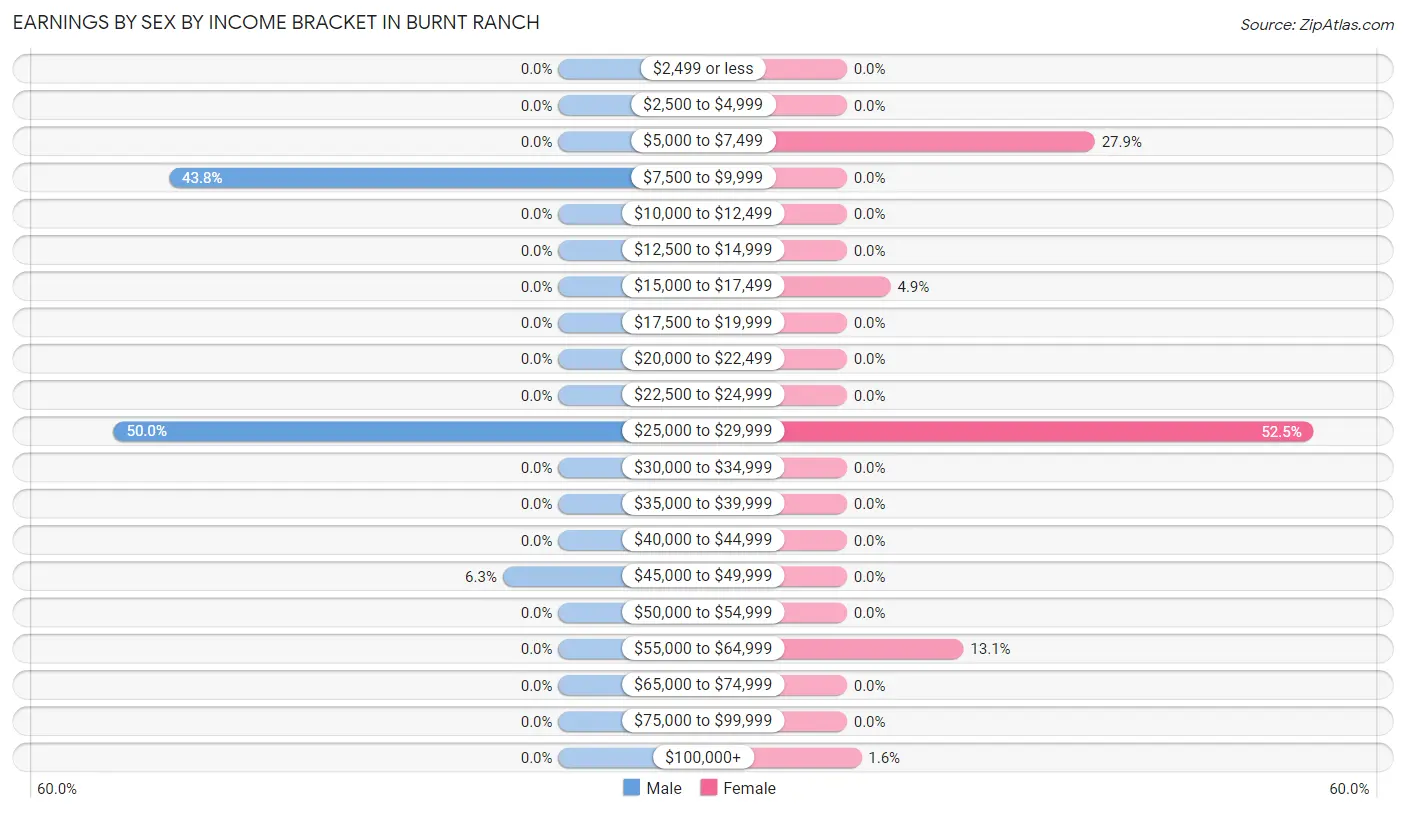
Earnings by Sex by Income Bracket in Burnt Ranch
The most common earnings brackets in Burnt Ranch are $25,000 to $29,999 for men (8 | 50.0%) and $25,000 to $29,999 for women (32 | 52.5%).
| Income | Male | Female |
| $2,499 or less | 0 (0.0%) | 0 (0.0%) |
| $2,500 to $4,999 | 0 (0.0%) | 0 (0.0%) |
| $5,000 to $7,499 | 0 (0.0%) | 17 (27.9%) |
| $7,500 to $9,999 | 7 (43.8%) | 0 (0.0%) |
| $10,000 to $12,499 | 0 (0.0%) | 0 (0.0%) |
| $12,500 to $14,999 | 0 (0.0%) | 0 (0.0%) |
| $15,000 to $17,499 | 0 (0.0%) | 3 (4.9%) |
| $17,500 to $19,999 | 0 (0.0%) | 0 (0.0%) |
| $20,000 to $22,499 | 0 (0.0%) | 0 (0.0%) |
| $22,500 to $24,999 | 0 (0.0%) | 0 (0.0%) |
| $25,000 to $29,999 | 8 (50.0%) | 32 (52.5%) |
| $30,000 to $34,999 | 0 (0.0%) | 0 (0.0%) |
| $35,000 to $39,999 | 0 (0.0%) | 0 (0.0%) |
| $40,000 to $44,999 | 0 (0.0%) | 0 (0.0%) |
| $45,000 to $49,999 | 1 (6.2%) | 0 (0.0%) |
| $50,000 to $54,999 | 0 (0.0%) | 0 (0.0%) |
| $55,000 to $64,999 | 0 (0.0%) | 8 (13.1%) |
| $65,000 to $74,999 | 0 (0.0%) | 0 (0.0%) |
| $75,000 to $99,999 | 0 (0.0%) | 0 (0.0%) |
| $100,000+ | 0 (0.0%) | 1 (1.6%) |
| Total | 16 (100.0%) | 61 (100.0%) |
Earnings by Sex by Educational Attainment in Burnt Ranch
| Educational Attainment | Male Income | Female Income |
| Less than High School | - | - |
| High School Diploma | - | - |
| College or Associate's Degree | - | - |
| Bachelor's Degree | - | - |
| Graduate Degree | - | - |
| Total | - | - |
Family Income in Burnt Ranch
Family Income Brackets in Burnt Ranch
According to the Burnt Ranch family income data, there are 32 families falling into the $25,000 to $34,999 income range, which is the most common income bracket and makes up 48.5% of all families.
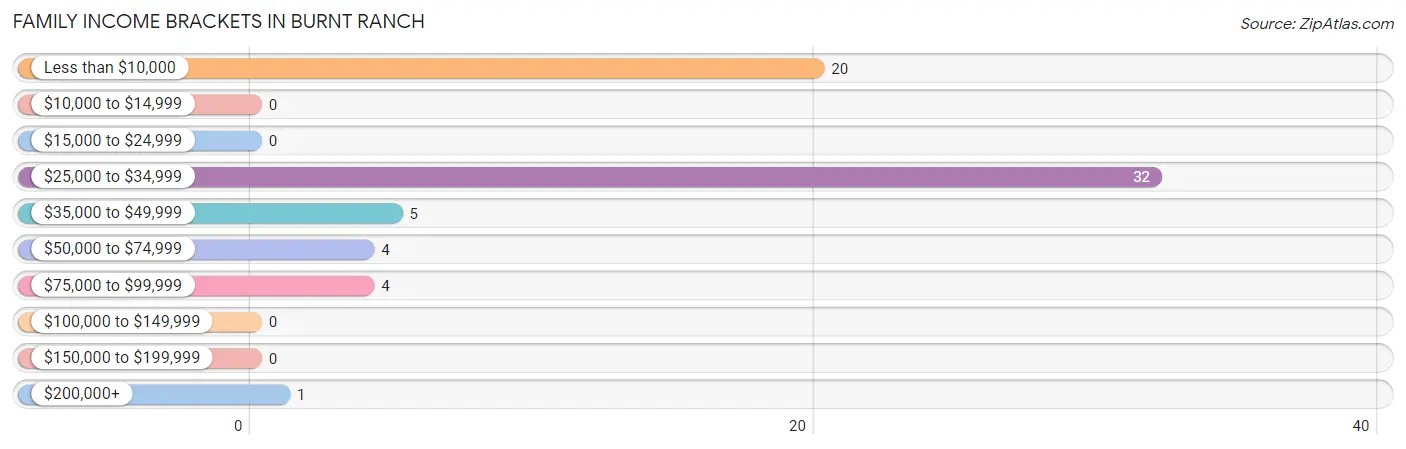
| Income Bracket | # Families | % Families |
| Less than $10,000 | 20 | 30.3% |
| $10,000 to $14,999 | 0 | 0.0% |
| $15,000 to $24,999 | 0 | 0.0% |
| $25,000 to $34,999 | 32 | 48.5% |
| $35,000 to $49,999 | 5 | 7.6% |
| $50,000 to $74,999 | 4 | 6.1% |
| $75,000 to $99,999 | 4 | 6.1% |
| $100,000 to $149,999 | 0 | 0.0% |
| $150,000 to $199,999 | 0 | 0.0% |
| $200,000+ | 1 | 1.5% |
Family Income by Famaliy Size in Burnt Ranch
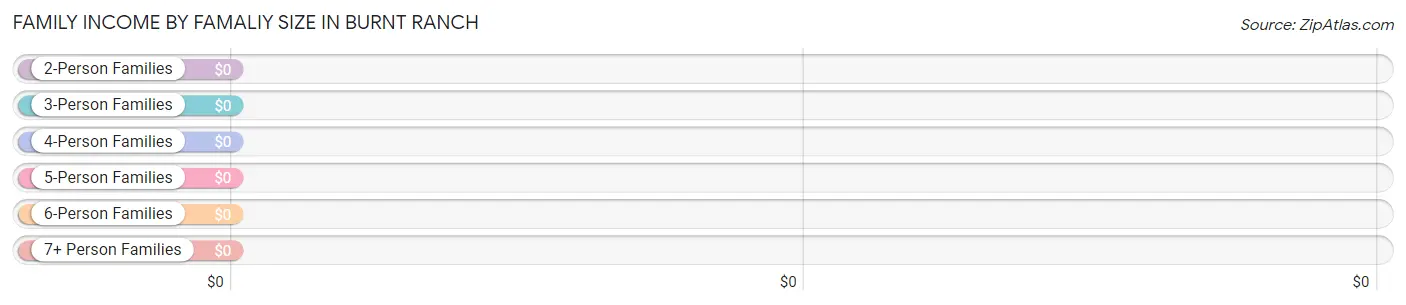
| Income Bracket | # Families | Median Income |
| 2-Person Families | 34 (51.5%) | $0 |
| 3-Person Families | 0 (0.0%) | $0 |
| 4-Person Families | 0 (0.0%) | $0 |
| 5-Person Families | 32 (48.5%) | $0 |
| 6-Person Families | 0 (0.0%) | $0 |
| 7+ Person Families | 0 (0.0%) | $0 |
| Total | 66 (100.0%) | $28,516 |
Family Income by Number of Earners in Burnt Ranch
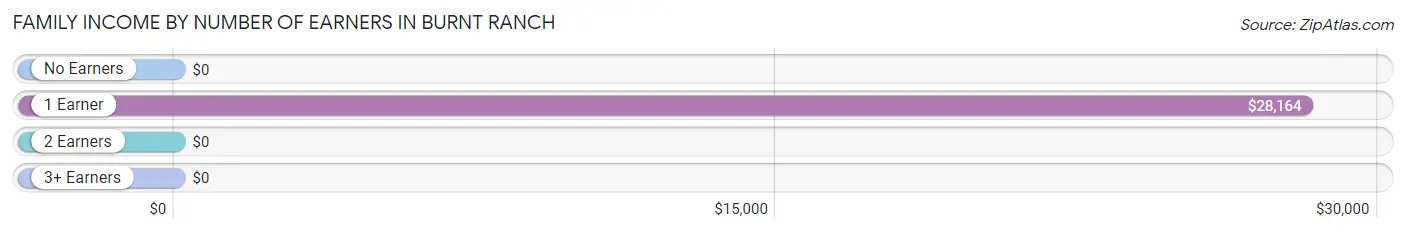
| Number of Earners | # Families | Median Income |
| No Earners | 9 (13.6%) | $0 |
| 1 Earner | 57 (86.4%) | $28,164 |
| 2 Earners | 0 (0.0%) | $0 |
| 3+ Earners | 0 (0.0%) | $0 |
| Total | 66 (100.0%) | $28,516 |
Household Income in Burnt Ranch
Household Income Brackets in Burnt Ranch
With 44 households falling in the category, the $50,000 to $74,999 income range is the most frequent in Burnt Ranch, accounting for 50.0% of all households.
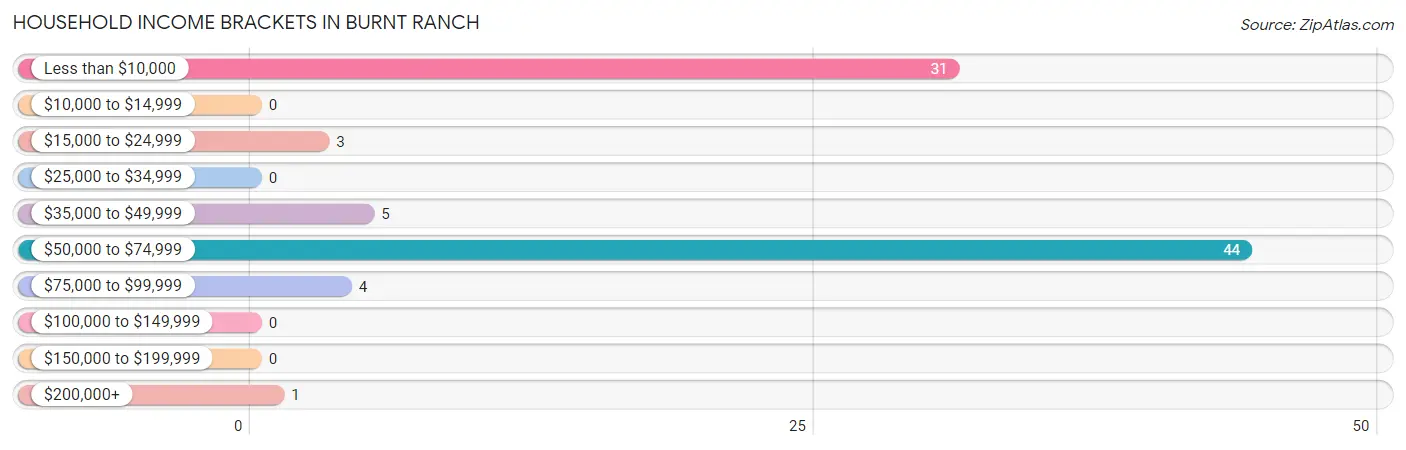
| Income Bracket | # Households | % Households |
| Less than $10,000 | 31 | 35.2% |
| $10,000 to $14,999 | 0 | 0.0% |
| $15,000 to $24,999 | 3 | 3.4% |
| $25,000 to $34,999 | 0 | 0.0% |
| $35,000 to $49,999 | 5 | 5.7% |
| $50,000 to $74,999 | 44 | 50.0% |
| $75,000 to $99,999 | 4 | 4.5% |
| $100,000 to $149,999 | 0 | 0.0% |
| $150,000 to $199,999 | 0 | 0.0% |
| $200,000+ | 1 | 1.1% |
Household Income by Householder Age in Burnt Ranch
The median household income in Burnt Ranch is $55,357, with the highest median household income of $57,083 found in the 65+ years age bracket for the primary householder. A total of 25 households (28.4%) fall into this category. Meanwhile, the 15 to 24 years age bracket for the primary householder has the lowest median household income of $0, with 1 households (1.1%) in this group.
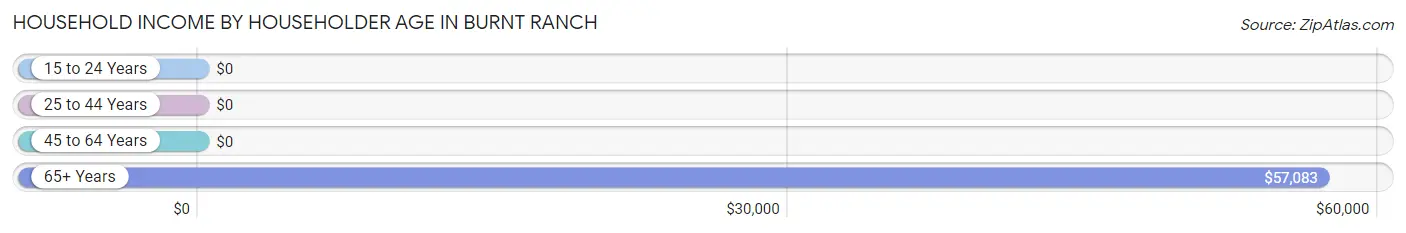
| Income Bracket | # Households | Median Income |
| 15 to 24 Years | 1 (1.1%) | $0 |
| 25 to 44 Years | 0 (0.0%) | $0 |
| 45 to 64 Years | 62 (70.5%) | $0 |
| 65+ Years | 25 (28.4%) | $57,083 |
| Total | 88 (100.0%) | $55,357 |
Poverty in Burnt Ranch
Income Below Poverty by Sex and Age in Burnt Ranch
With 55.8% poverty level for males and 78.7% for females among the residents of Burnt Ranch, 6 to 11 year old males and 12 to 14 year old females are the most vulnerable to poverty, with 12 males (100.0%) and 16 females (100.0%) in their respective age groups living below the poverty level.
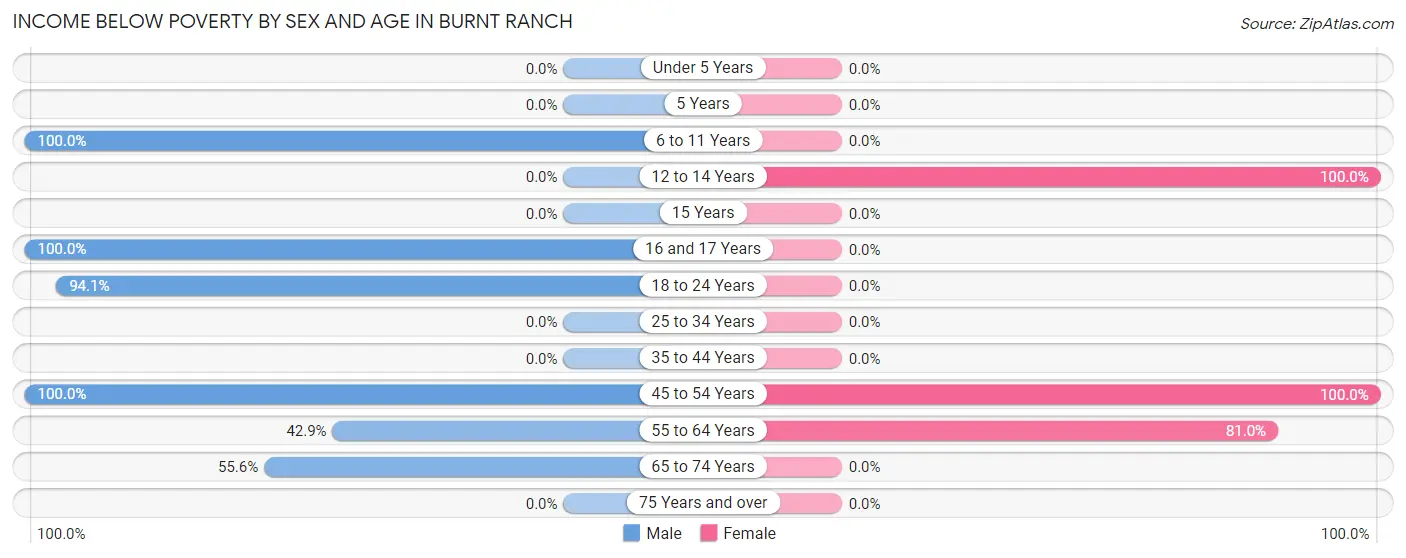
| Age Bracket | Male | Female |
| Under 5 Years | 0 (0.0%) | 0 (0.0%) |
| 5 Years | 0 (0.0%) | 0 (0.0%) |
| 6 to 11 Years | 12 (100.0%) | 0 (0.0%) |
| 12 to 14 Years | 0 (0.0%) | 16 (100.0%) |
| 15 Years | 0 (0.0%) | 0 (0.0%) |
| 16 and 17 Years | 21 (100.0%) | 0 (0.0%) |
| 18 to 24 Years | 16 (94.1%) | 0 (0.0%) |
| 25 to 34 Years | 0 (0.0%) | 0 (0.0%) |
| 35 to 44 Years | 0 (0.0%) | 0 (0.0%) |
| 45 to 54 Years | 7 (100.0%) | 52 (100.0%) |
| 55 to 64 Years | 6 (42.9%) | 17 (80.9%) |
| 65 to 74 Years | 5 (55.6%) | 0 (0.0%) |
| 75 Years and over | 0 (0.0%) | 0 (0.0%) |
| Total | 67 (55.8%) | 85 (78.7%) |
Income Above Poverty by Sex and Age in Burnt Ranch
According to the poverty statistics in Burnt Ranch, males aged 35 to 44 years and females aged 65 to 74 years are the age groups that are most secure financially, with 100.0% of males and 100.0% of females in these age groups living above the poverty line.
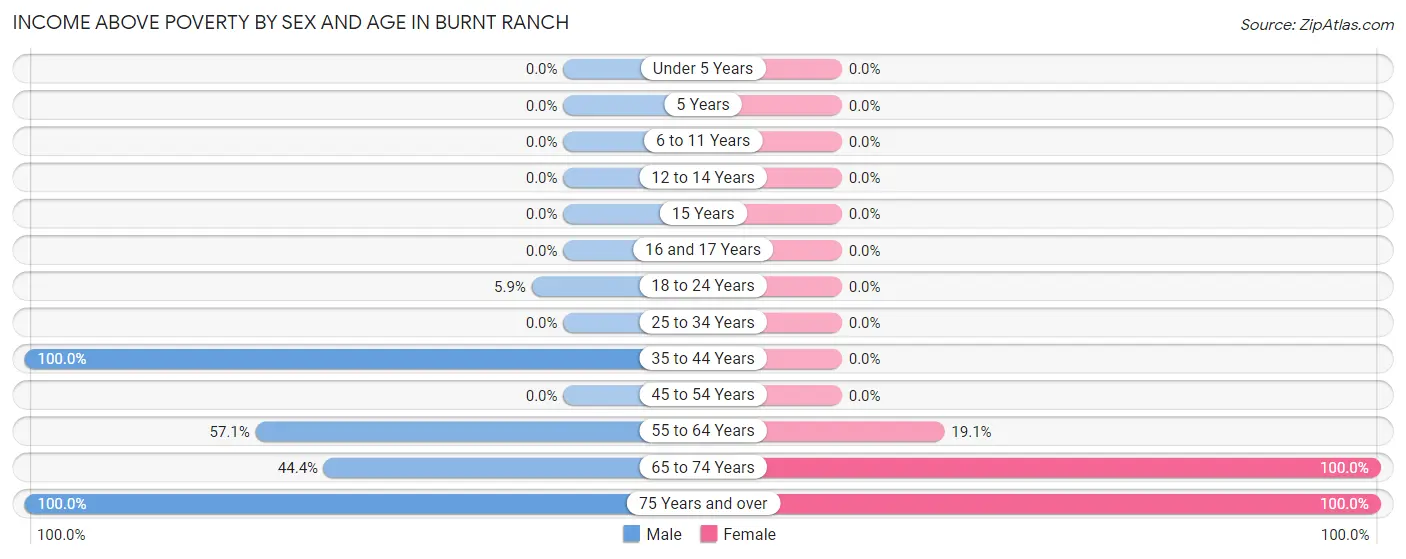
| Age Bracket | Male | Female |
| Under 5 Years | 0 (0.0%) | 0 (0.0%) |
| 5 Years | 0 (0.0%) | 0 (0.0%) |
| 6 to 11 Years | 0 (0.0%) | 0 (0.0%) |
| 12 to 14 Years | 0 (0.0%) | 0 (0.0%) |
| 15 Years | 0 (0.0%) | 0 (0.0%) |
| 16 and 17 Years | 0 (0.0%) | 0 (0.0%) |
| 18 to 24 Years | 1 (5.9%) | 0 (0.0%) |
| 25 to 34 Years | 0 (0.0%) | 0 (0.0%) |
| 35 to 44 Years | 8 (100.0%) | 0 (0.0%) |
| 45 to 54 Years | 0 (0.0%) | 0 (0.0%) |
| 55 to 64 Years | 8 (57.1%) | 4 (19.1%) |
| 65 to 74 Years | 4 (44.4%) | 14 (100.0%) |
| 75 Years and over | 32 (100.0%) | 5 (100.0%) |
| Total | 53 (44.2%) | 23 (21.3%) |
Income Below Poverty Among Married-Couple Families in Burnt Ranch
The poverty statistics for married-couple families in Burnt Ranch show that 60.6% or 20 of the total 33 families live below the poverty line. Families with no children have the highest poverty rate of 60.6%, comprising of 20 families. On the other hand, families with no children have the lowest poverty rate of 60.6%, which includes 20 families.
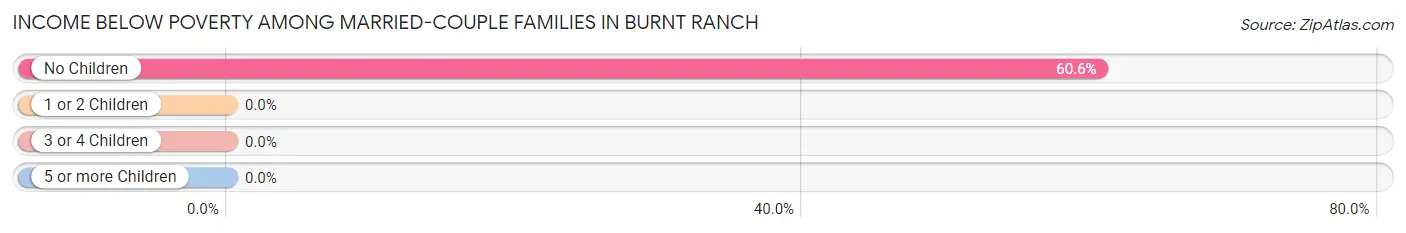
| Children | Above Poverty | Below Poverty |
| No Children | 13 (39.4%) | 20 (60.6%) |
| 1 or 2 Children | 0 (0.0%) | 0 (0.0%) |
| 3 or 4 Children | 0 (0.0%) | 0 (0.0%) |
| 5 or more Children | 0 (0.0%) | 0 (0.0%) |
| Total | 13 (39.4%) | 20 (60.6%) |
Income Below Poverty Among Single-Parent Households in Burnt Ranch
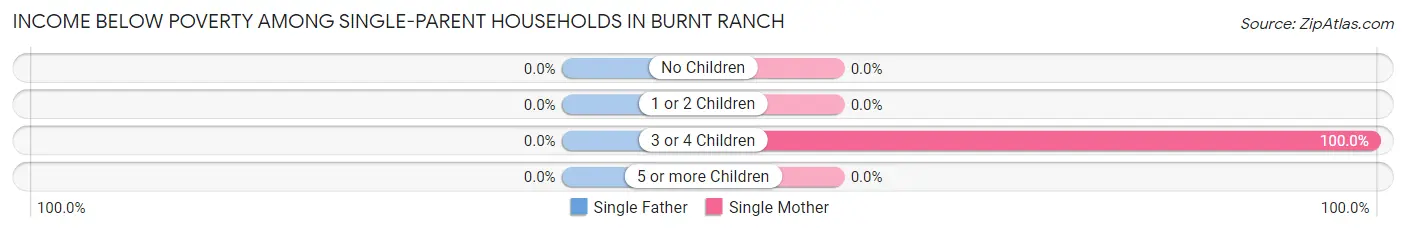
| Children | Single Father | Single Mother |
| No Children | 0 (0.0%) | 0 (0.0%) |
| 1 or 2 Children | 0 (0.0%) | 0 (0.0%) |
| 3 or 4 Children | 0 (0.0%) | 32 (100.0%) |
| 5 or more Children | 0 (0.0%) | 0 (0.0%) |
| Total | 0 (0.0%) | 32 (100.0%) |
Income Below Poverty Among Married-Couple vs Single-Parent Households in Burnt Ranch
The poverty data for Burnt Ranch shows that 20 of the married-couple family households (60.6%) and 32 of the single-parent households (97.0%) are living below the poverty level. Within the married-couple family households, those with no children have the highest poverty rate, with 20 households (60.6%) falling below the poverty line. Among the single-parent households, those with 3 or 4 children have the highest poverty rate, with 32 household (100.0%) living below poverty.
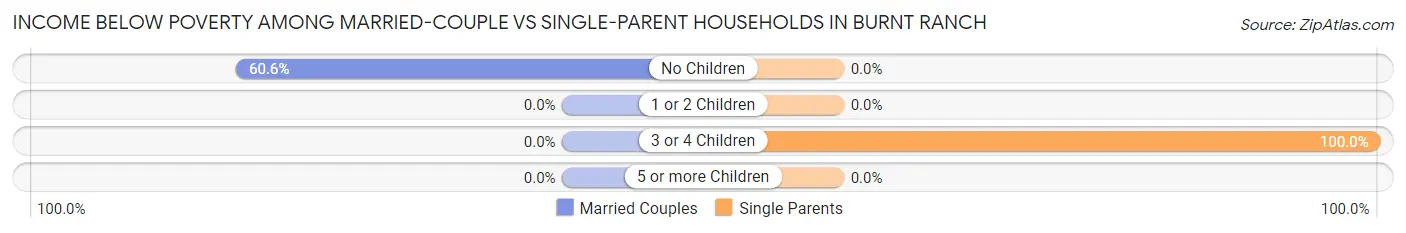
| Children | Married-Couple Families | Single-Parent Households |
| No Children | 20 (60.6%) | 0 (0.0%) |
| 1 or 2 Children | 0 (0.0%) | 0 (0.0%) |
| 3 or 4 Children | 0 (0.0%) | 32 (100.0%) |
| 5 or more Children | 0 (0.0%) | 0 (0.0%) |
| Total | 20 (60.6%) | 32 (97.0%) |
Race in Burnt Ranch
The most populous races in Burnt Ranch are White / Caucasian (221 | 96.9%), and Native / Alaskan (7 | 3.1%).
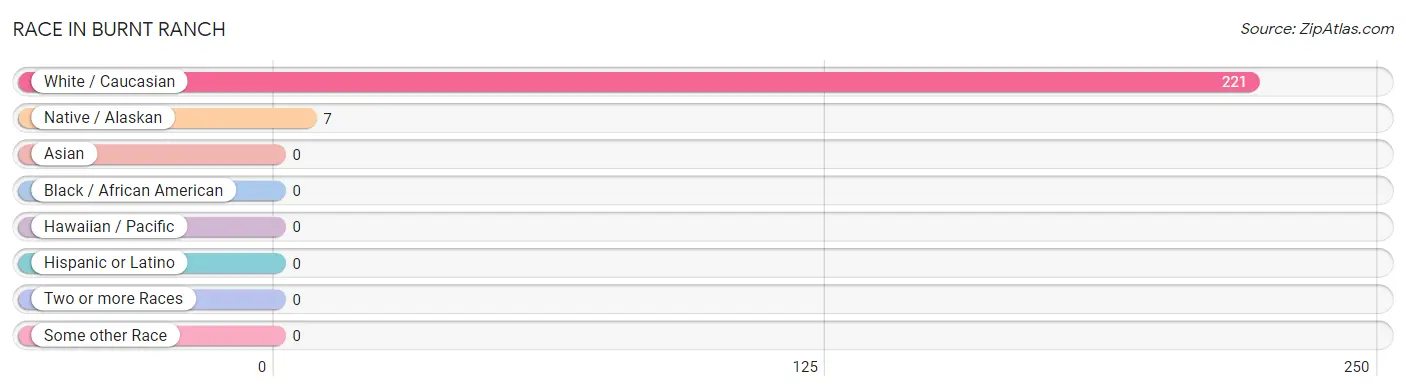
| Race | # Population | % Population |
| Asian | 0 | 0.0% |
| Black / African American | 0 | 0.0% |
| Hawaiian / Pacific | 0 | 0.0% |
| Hispanic or Latino | 0 | 0.0% |
| Native / Alaskan | 7 | 3.1% |
| White / Caucasian | 221 | 96.9% |
| Two or more Races | 0 | 0.0% |
| Some other Race | 0 | 0.0% |
| Total | 228 | 100.0% |
Ancestry in Burnt Ranch
The most populous ancestries reported in Burnt Ranch are English (104 | 45.6%), Irish (97 | 42.5%), American (45 | 19.7%), Northern European (10 | 4.4%), and Arab (8 | 3.5%), together accounting for 115.8% of all Burnt Ranch residents.
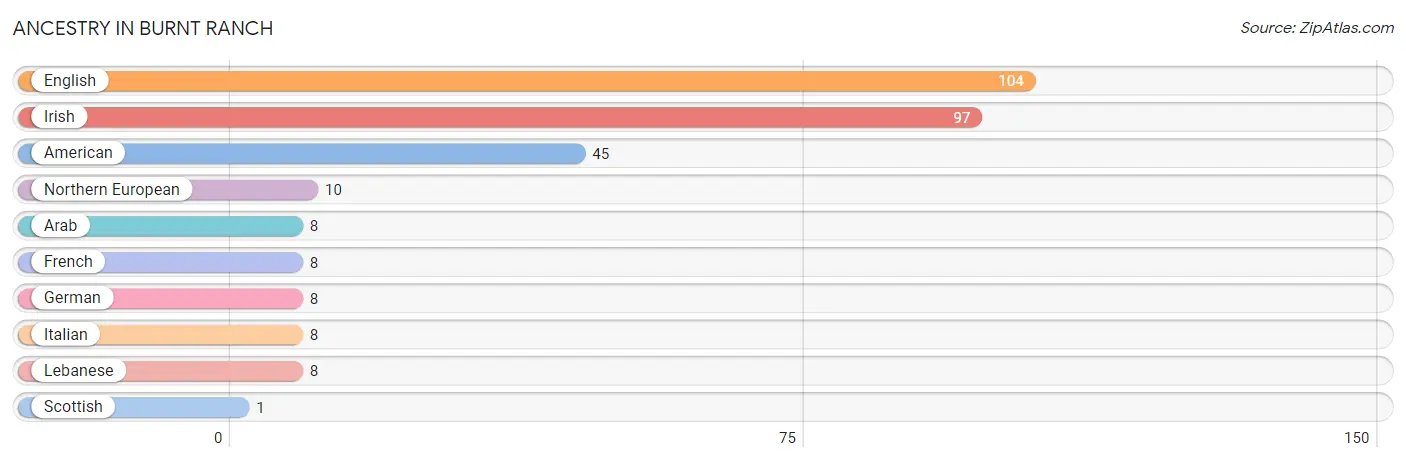
| Ancestry | # Population | % Population |
| American | 45 | 19.7% |
| Arab | 8 | 3.5% |
| English | 104 | 45.6% |
| French | 8 | 3.5% |
| German | 8 | 3.5% |
| Irish | 97 | 42.5% |
| Italian | 8 | 3.5% |
| Lebanese | 8 | 3.5% |
| Northern European | 10 | 4.4% |
| Scottish | 1 | 0.4% | View All 10 Rows |
Immigrants in Burnt Ranch

| Immigration Origin | # Population | % Population | View All 0 Rows |
Sex and Age in Burnt Ranch
Sex and Age in Burnt Ranch
The most populous age groups in Burnt Ranch are 15 to 19 Years (37 | 30.8%) for men and 45 to 49 Years (52 | 48.1%) for women.
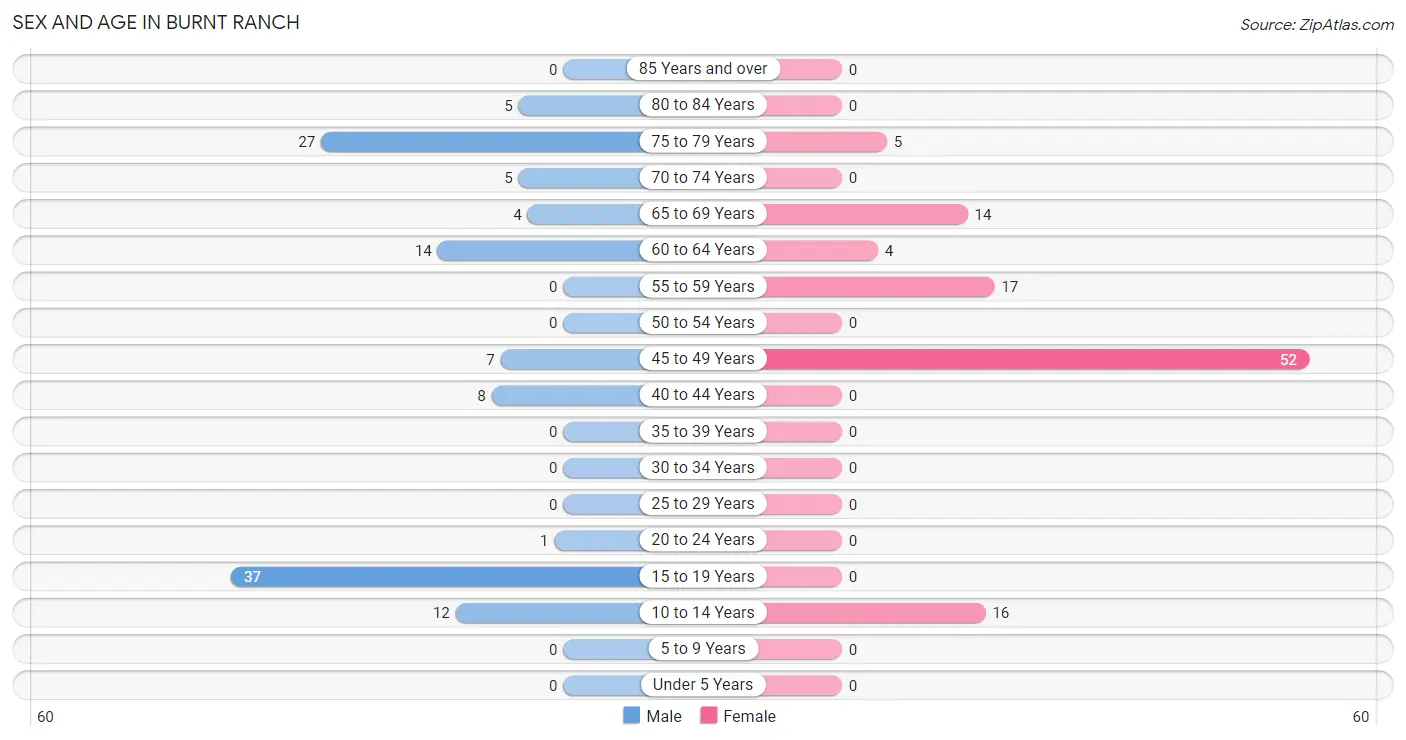
| Age Bracket | Male | Female |
| Under 5 Years | 0 (0.0%) | 0 (0.0%) |
| 5 to 9 Years | 0 (0.0%) | 0 (0.0%) |
| 10 to 14 Years | 12 (10.0%) | 16 (14.8%) |
| 15 to 19 Years | 37 (30.8%) | 0 (0.0%) |
| 20 to 24 Years | 1 (0.8%) | 0 (0.0%) |
| 25 to 29 Years | 0 (0.0%) | 0 (0.0%) |
| 30 to 34 Years | 0 (0.0%) | 0 (0.0%) |
| 35 to 39 Years | 0 (0.0%) | 0 (0.0%) |
| 40 to 44 Years | 8 (6.7%) | 0 (0.0%) |
| 45 to 49 Years | 7 (5.8%) | 52 (48.1%) |
| 50 to 54 Years | 0 (0.0%) | 0 (0.0%) |
| 55 to 59 Years | 0 (0.0%) | 17 (15.7%) |
| 60 to 64 Years | 14 (11.7%) | 4 (3.7%) |
| 65 to 69 Years | 4 (3.3%) | 14 (13.0%) |
| 70 to 74 Years | 5 (4.2%) | 0 (0.0%) |
| 75 to 79 Years | 27 (22.5%) | 5 (4.6%) |
| 80 to 84 Years | 5 (4.2%) | 0 (0.0%) |
| 85 Years and over | 0 (0.0%) | 0 (0.0%) |
| Total | 120 (100.0%) | 108 (100.0%) |
Families and Households in Burnt Ranch
Median Family Size in Burnt Ranch
The median family size in Burnt Ranch is 2.74 persons per family, with single male/father families (1 | 1.5%) accounting for the largest median family size of 25 persons per family. On the other hand, married-couple families (33 | 50.0%) represent the smallest median family size with 1.79 persons per family.
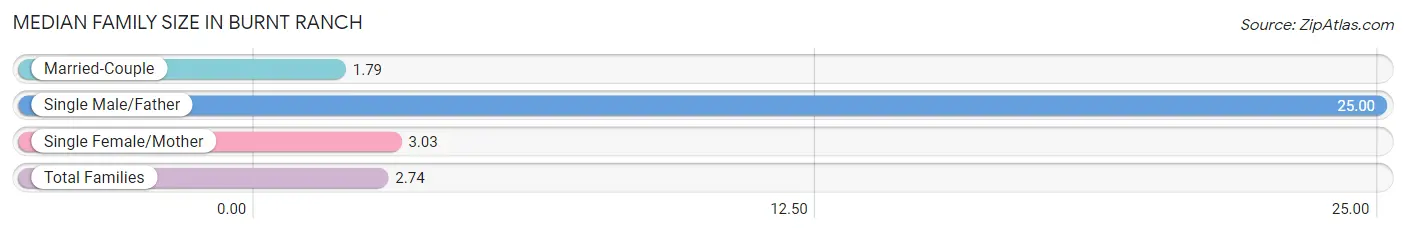
| Family Type | # Families | Family Size |
| Married-Couple | 33 (50.0%) | 1.79 |
| Single Male/Father | 1 (1.5%) | 25.00 |
| Single Female/Mother | 32 (48.5%) | 3.03 |
| Total Families | 66 (100.0%) | 2.74 |
Median Household Size in Burnt Ranch
The median household size in Burnt Ranch is 2.59 persons per household, with single male/father households (1 | 1.1%) accounting for the largest median household size of 25 persons per household. non-family households (22 | 25.0%) represent the smallest median household size with 1.77 persons per household.
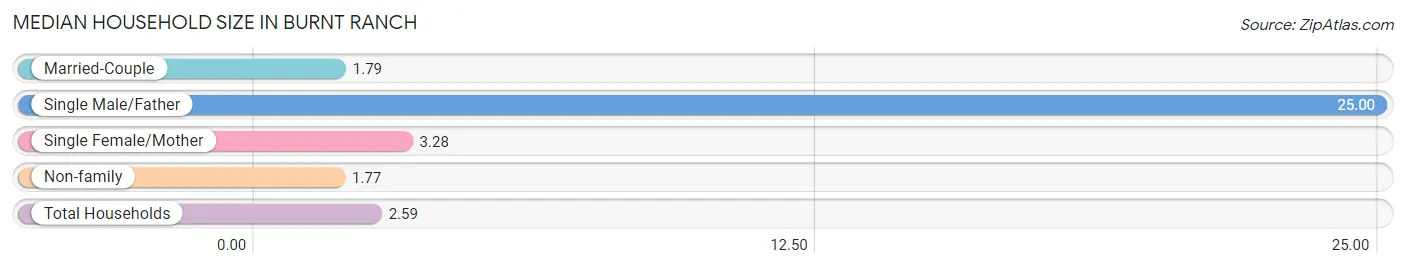
| Household Type | # Households | Household Size |
| Married-Couple | 33 (37.5%) | 1.79 |
| Single Male/Father | 1 (1.1%) | 25.00 |
| Single Female/Mother | 32 (36.4%) | 3.28 |
| Non-family | 22 (25.0%) | 1.77 |
| Total Households | 88 (100.0%) | 2.59 |
Household Size by Marriage Status in Burnt Ranch
Out of a total of 88 households in Burnt Ranch, 66 (75.0%) are family households, while 22 (25.0%) are nonfamily households. The most numerous type of family households are 2-person households, comprising 34, and the most common type of nonfamily households are 1-person households, comprising 17.
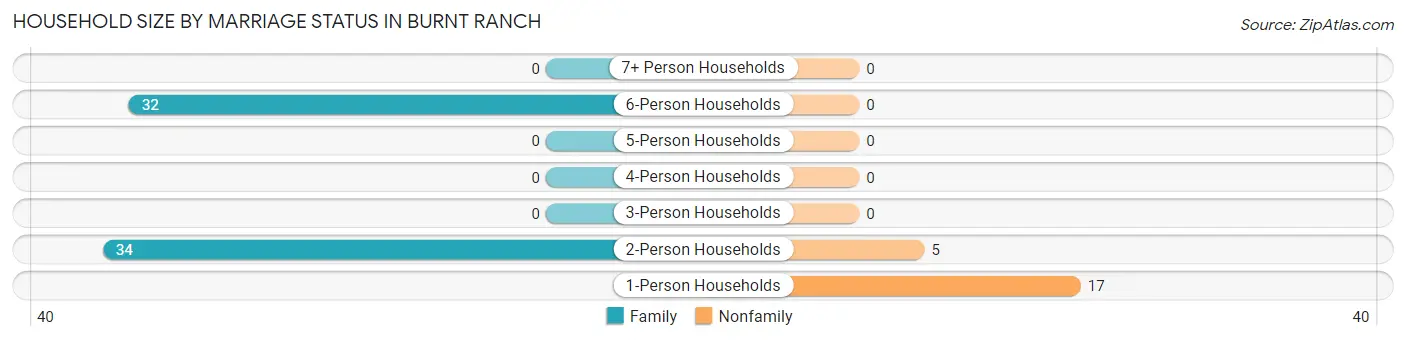
| Household Size | Family Households | Nonfamily Households |
| 1-Person Households | - | 17 (19.3%) |
| 2-Person Households | 34 (38.6%) | 5 (5.7%) |
| 3-Person Households | 0 (0.0%) | 0 (0.0%) |
| 4-Person Households | 0 (0.0%) | 0 (0.0%) |
| 5-Person Households | 0 (0.0%) | 0 (0.0%) |
| 6-Person Households | 32 (36.4%) | 0 (0.0%) |
| 7+ Person Households | 0 (0.0%) | 0 (0.0%) |
| Total | 66 (75.0%) | 22 (25.0%) |
Female Fertility in Burnt Ranch
Fertility by Age in Burnt Ranch
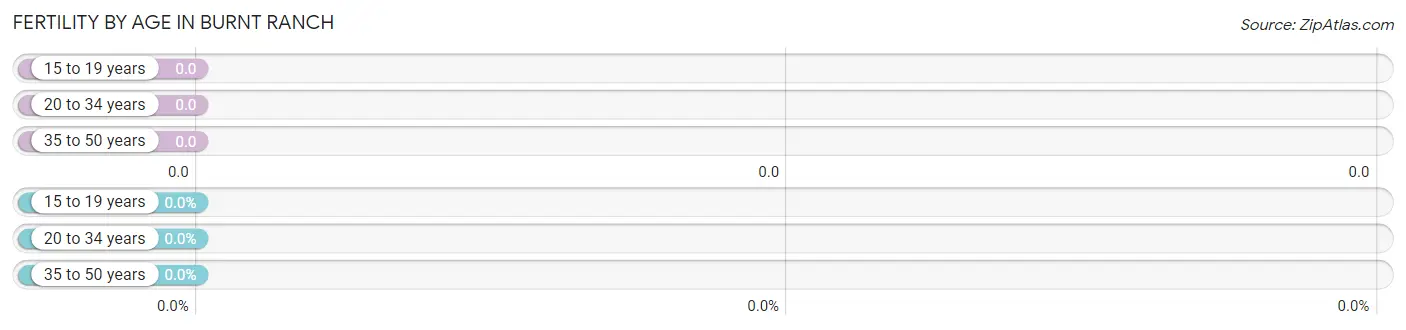
| Age Bracket | Women with Births | Births / 1,000 Women |
| 15 to 19 years | 0 (0.0%) | 0.0 |
| 20 to 34 years | 0 (0.0%) | 0.0 |
| 35 to 50 years | 0 (0.0%) | 0.0 |
| Total | 0 (0.0%) | 0.0 |
Fertility by Age by Marriage Status in Burnt Ranch
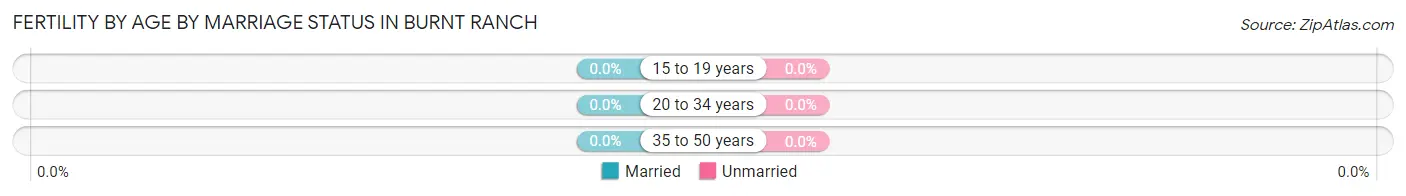
| Age Bracket | Married | Unmarried |
| 15 to 19 years | 0 (0.0%) | 0 (0.0%) |
| 20 to 34 years | 0 (0.0%) | 0 (0.0%) |
| 35 to 50 years | 0 (0.0%) | 0 (0.0%) |
| Total | 0 (0.0%) | 0 (0.0%) |
Fertility by Education in Burnt Ranch
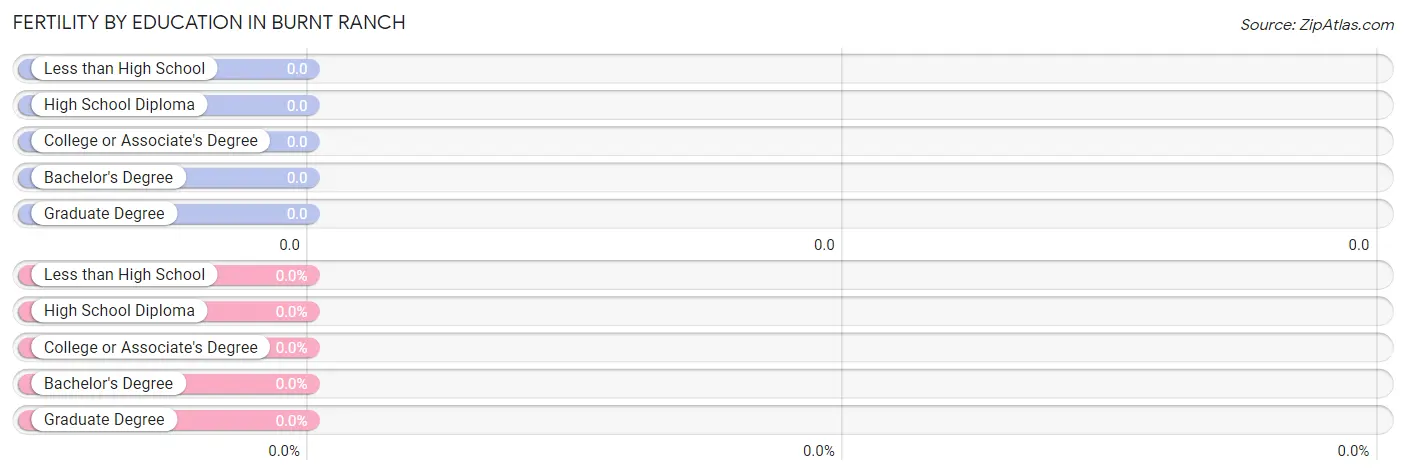
| Educational Attainment | Women with Births | Births / 1,000 Women |
| Less than High School | 0 (0.0%) | 0.0 |
| High School Diploma | 0 (0.0%) | 0.0 |
| College or Associate's Degree | 0 (0.0%) | 0.0 |
| Bachelor's Degree | 0 (0.0%) | 0.0 |
| Graduate Degree | 0 (0.0%) | 0.0 |
| Total | 0 (0.0%) | 0.0 |
Fertility by Education by Marriage Status in Burnt Ranch
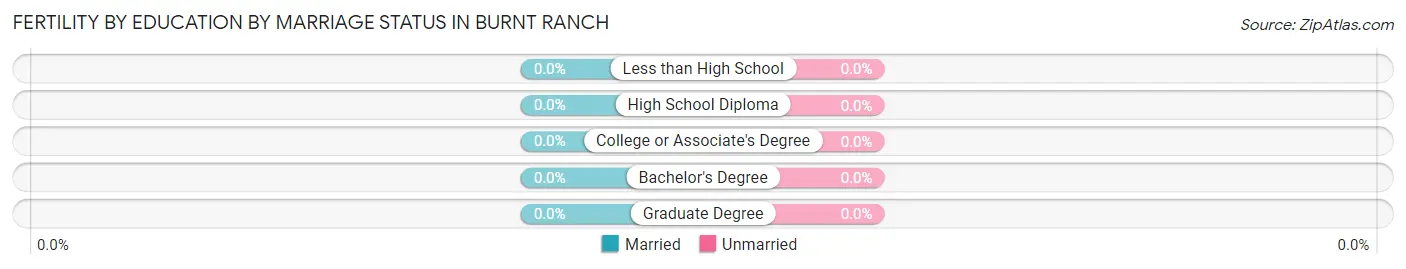
| Educational Attainment | Married | Unmarried |
| Less than High School | 0 (0.0%) | 0 (0.0%) |
| High School Diploma | 0 (0.0%) | 0 (0.0%) |
| College or Associate's Degree | 0 (0.0%) | 0 (0.0%) |
| Bachelor's Degree | 0 (0.0%) | 0 (0.0%) |
| Graduate Degree | 0 (0.0%) | 0 (0.0%) |
| Total | 0 (0.0%) | 0 (0.0%) |
Employment Characteristics in Burnt Ranch
Employment by Class of Employer in Burnt Ranch
Among the 77 employed individuals in Burnt Ranch, self-employed (not incorporated) (47 | 61.0%), local government employees (21 | 27.3%), and private company employees (9 | 11.7%) make up the most common classes of employment.
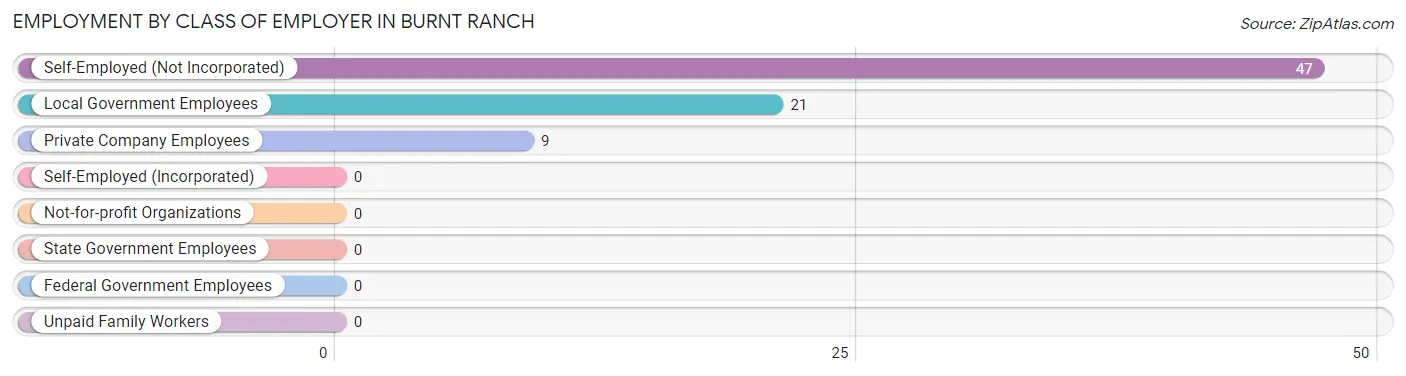
| Employer Class | # Employees | % Employees |
| Private Company Employees | 9 | 11.7% |
| Self-Employed (Incorporated) | 0 | 0.0% |
| Self-Employed (Not Incorporated) | 47 | 61.0% |
| Not-for-profit Organizations | 0 | 0.0% |
| Local Government Employees | 21 | 27.3% |
| State Government Employees | 0 | 0.0% |
| Federal Government Employees | 0 | 0.0% |
| Unpaid Family Workers | 0 | 0.0% |
| Total | 77 | 100.0% |
Employment Status by Age in Burnt Ranch
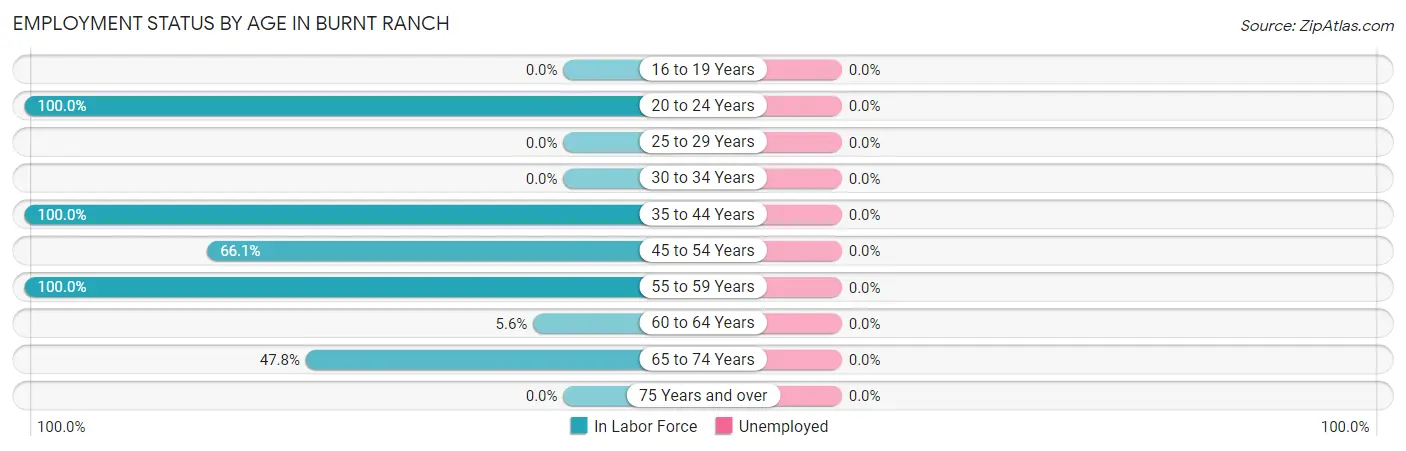
| Age Bracket | In Labor Force | Unemployed |
| 16 to 19 Years | 0 (0.0%) | 0 (0.0%) |
| 20 to 24 Years | 1 (100.0%) | 0 (0.0%) |
| 25 to 29 Years | 0 (0.0%) | 0 (0.0%) |
| 30 to 34 Years | 0 (0.0%) | 0 (0.0%) |
| 35 to 44 Years | 8 (100.0%) | 0 (0.0%) |
| 45 to 54 Years | 39 (66.1%) | 0 (0.0%) |
| 55 to 59 Years | 17 (100.0%) | 0 (0.0%) |
| 60 to 64 Years | 1 (5.6%) | 0 (0.0%) |
| 65 to 74 Years | 11 (47.8%) | 0 (0.0%) |
| 75 Years and over | 0 (0.0%) | 0 (0.0%) |
| Total | 77 (38.5%) | 0 (0.0%) |
Employment Status by Educational Attainment in Burnt Ranch
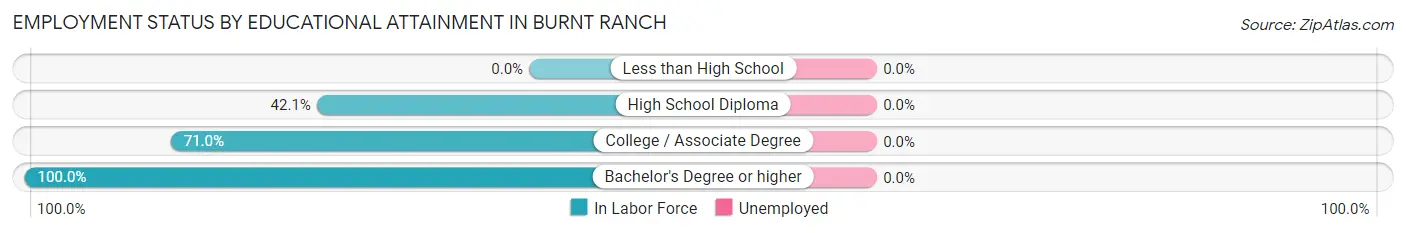
| Educational Attainment | In Labor Force | Unemployed |
| Less than High School | 0 (0.0%) | 0 (0.0%) |
| High School Diploma | 8 (42.1%) | 0 (0.0%) |
| College / Associate Degree | 49 (71.0%) | 0 (0.0%) |
| Bachelor's Degree or higher | 8 (100.0%) | 0 (0.0%) |
| Total | 65 (63.7%) | 0 (0.0%) |
Employment Occupations by Sex in Burnt Ranch
Management, Business, Science and Arts Occupations
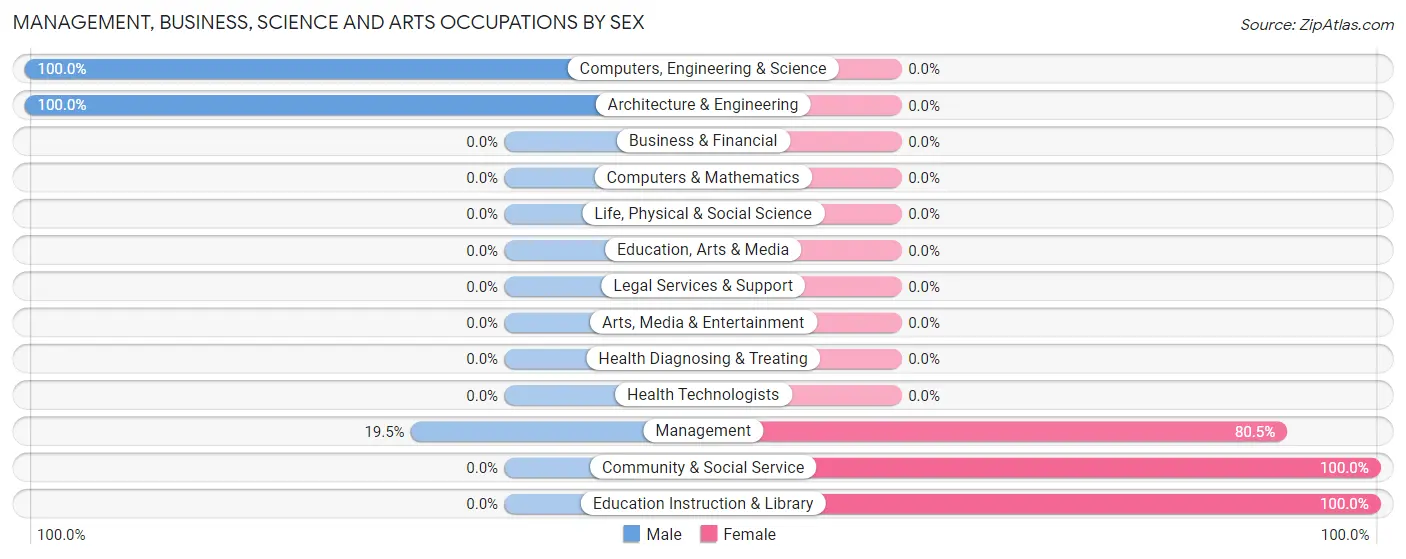
The most common Management, Business, Science and Arts occupations in Burnt Ranch are Management (41 | 53.2%), Computers, Engineering & Science (7 | 9.1%), Architecture & Engineering (7 | 9.1%), Community & Social Service (3 | 3.9%), and Education Instruction & Library (3 | 3.9%).
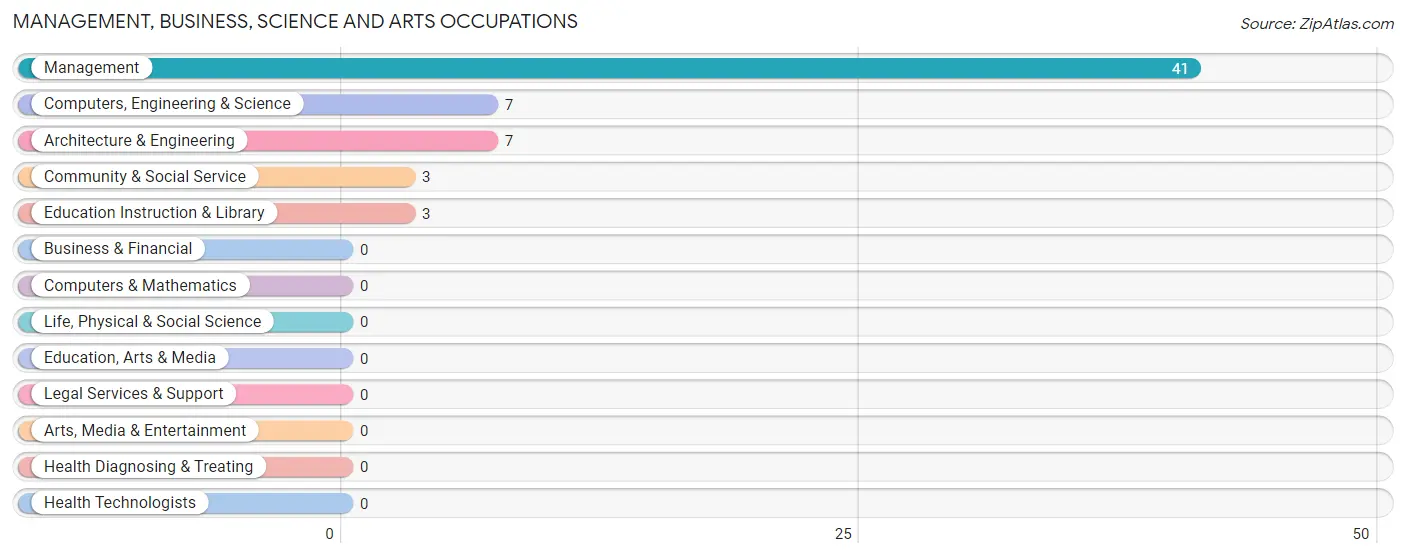
Management, Business, Science and Arts Occupations by Sex
Within the Management, Business, Science and Arts occupations in Burnt Ranch, the most male-oriented occupations are Computers, Engineering & Science (100.0%), Architecture & Engineering (100.0%), and Management (19.5%), while the most female-oriented occupations are Community & Social Service (100.0%), Education Instruction & Library (100.0%), and Management (80.5%).
| Occupation | Male | Female |
| Management | 8 (19.5%) | 33 (80.5%) |
| Business & Financial | 0 (0.0%) | 0 (0.0%) |
| Computers, Engineering & Science | 7 (100.0%) | 0 (0.0%) |
| Computers & Mathematics | 0 (0.0%) | 0 (0.0%) |
| Architecture & Engineering | 7 (100.0%) | 0 (0.0%) |
| Life, Physical & Social Science | 0 (0.0%) | 0 (0.0%) |
| Community & Social Service | 0 (0.0%) | 3 (100.0%) |
| Education, Arts & Media | 0 (0.0%) | 0 (0.0%) |
| Legal Services & Support | 0 (0.0%) | 0 (0.0%) |
| Education Instruction & Library | 0 (0.0%) | 3 (100.0%) |
| Arts, Media & Entertainment | 0 (0.0%) | 0 (0.0%) |
| Health Diagnosing & Treating | 0 (0.0%) | 0 (0.0%) |
| Health Technologists | 0 (0.0%) | 0 (0.0%) |
| Total (Category) | 15 (29.4%) | 36 (70.6%) |
| Total (Overall) | 16 (20.8%) | 61 (79.2%) |
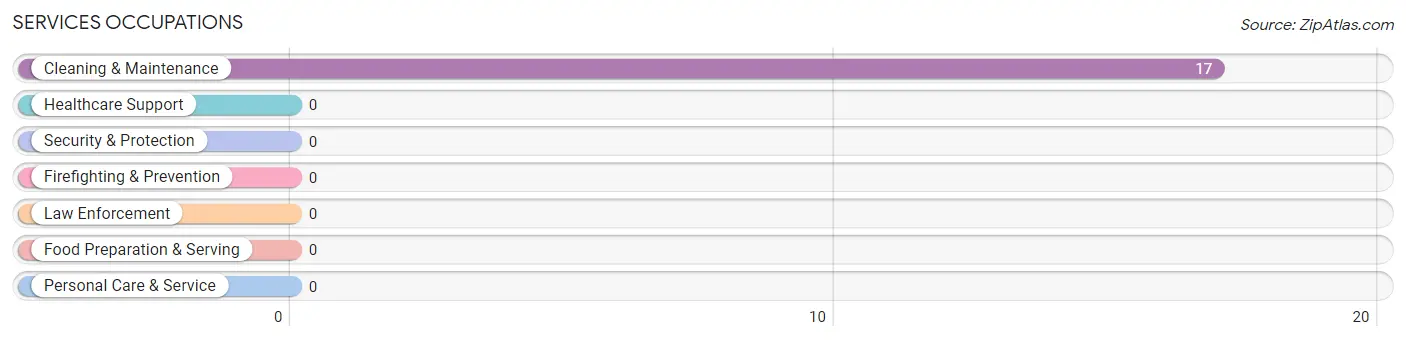
Services Occupations
The most common Services occupations in Burnt Ranch are , and Cleaning & Maintenance (17 | 22.1%).
Services Occupations by Sex
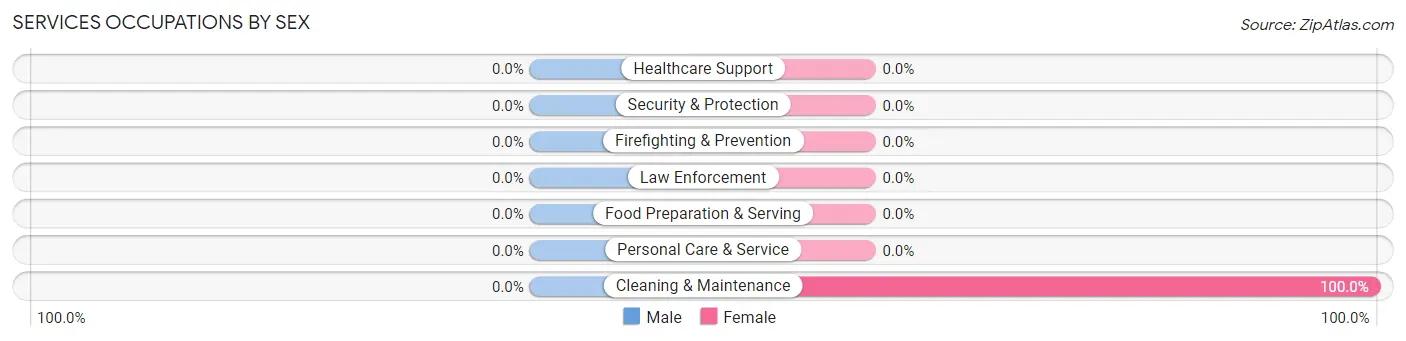
| Occupation | Male | Female |
| Healthcare Support | 0 (0.0%) | 0 (0.0%) |
| Security & Protection | 0 (0.0%) | 0 (0.0%) |
| Firefighting & Prevention | 0 (0.0%) | 0 (0.0%) |
| Law Enforcement | 0 (0.0%) | 0 (0.0%) |
| Food Preparation & Serving | 0 (0.0%) | 0 (0.0%) |
| Cleaning & Maintenance | 0 (0.0%) | 17 (100.0%) |
| Personal Care & Service | 0 (0.0%) | 0 (0.0%) |
| Total (Category) | 0 (0.0%) | 17 (100.0%) |
| Total (Overall) | 16 (20.8%) | 61 (79.2%) |
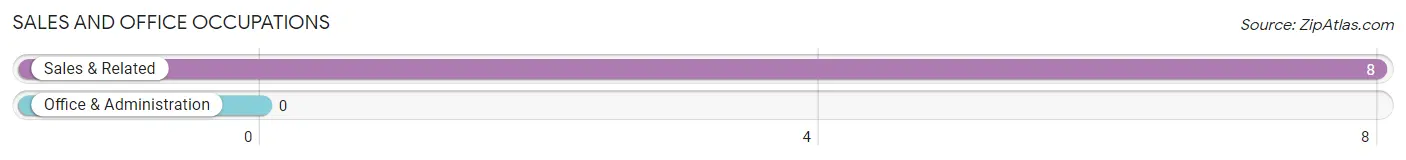
Sales and Office Occupations
The most common Sales and Office occupations in Burnt Ranch are , and Sales & Related (8 | 10.4%).
Sales and Office Occupations by Sex
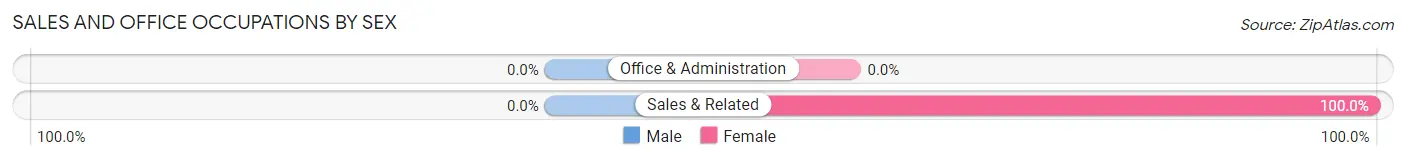
| Occupation | Male | Female |
| Sales & Related | 0 (0.0%) | 8 (100.0%) |
| Office & Administration | 0 (0.0%) | 0 (0.0%) |
| Total (Category) | 0 (0.0%) | 8 (100.0%) |
| Total (Overall) | 16 (20.8%) | 61 (79.2%) |
Natural Resources, Construction and Maintenance Occupations
The most common Natural Resources, Construction and Maintenance occupations in Burnt Ranch are , and Installation, Maintenance & Repair (1 | 1.3%).
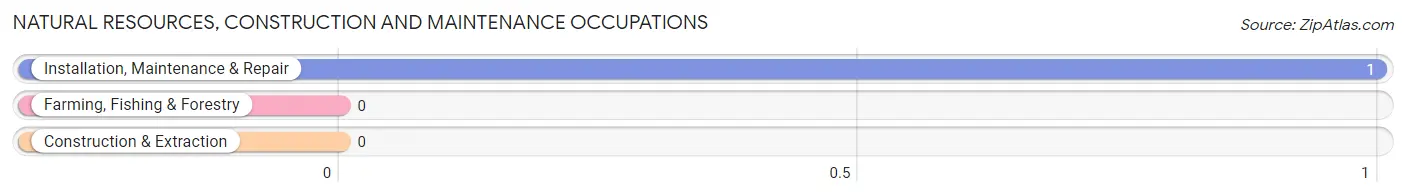
Natural Resources, Construction and Maintenance Occupations by Sex
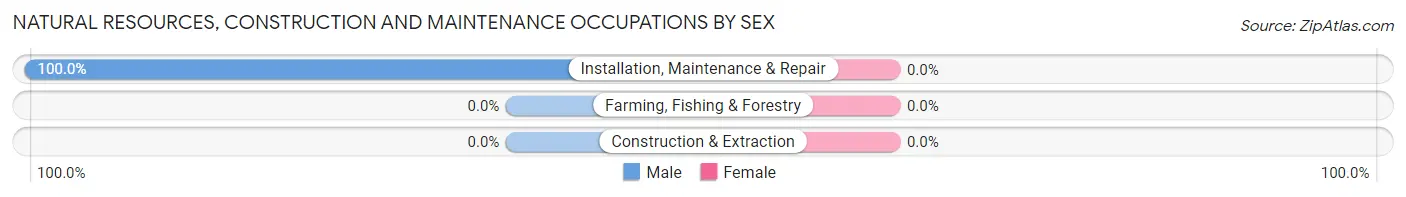
| Occupation | Male | Female |
| Farming, Fishing & Forestry | 0 (0.0%) | 0 (0.0%) |
| Construction & Extraction | 0 (0.0%) | 0 (0.0%) |
| Installation, Maintenance & Repair | 1 (100.0%) | 0 (0.0%) |
| Total (Category) | 1 (100.0%) | 0 (0.0%) |
| Total (Overall) | 16 (20.8%) | 61 (79.2%) |
Production, Transportation and Moving Occupations
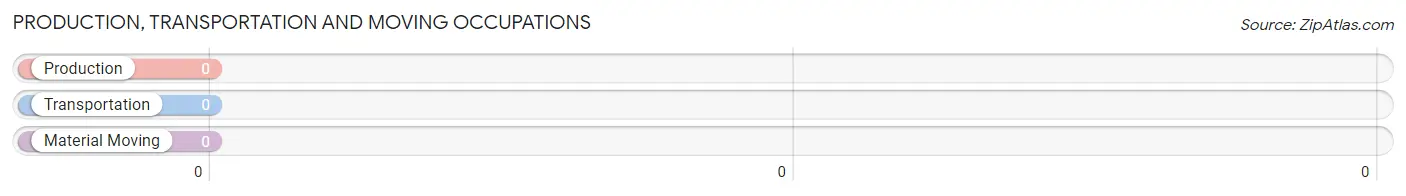
Production, Transportation and Moving Occupations by Sex
| Occupation | Male | Female |
| Production | 0 (0.0%) | 0 (0.0%) |
| Transportation | 0 (0.0%) | 0 (0.0%) |
| Material Moving | 0 (0.0%) | 0 (0.0%) |
| Total (Category) | 0 (0.0%) | 0 (0.0%) |
| Total (Overall) | 16 (20.8%) | 61 (79.2%) |
Employment Industries by Sex in Burnt Ranch
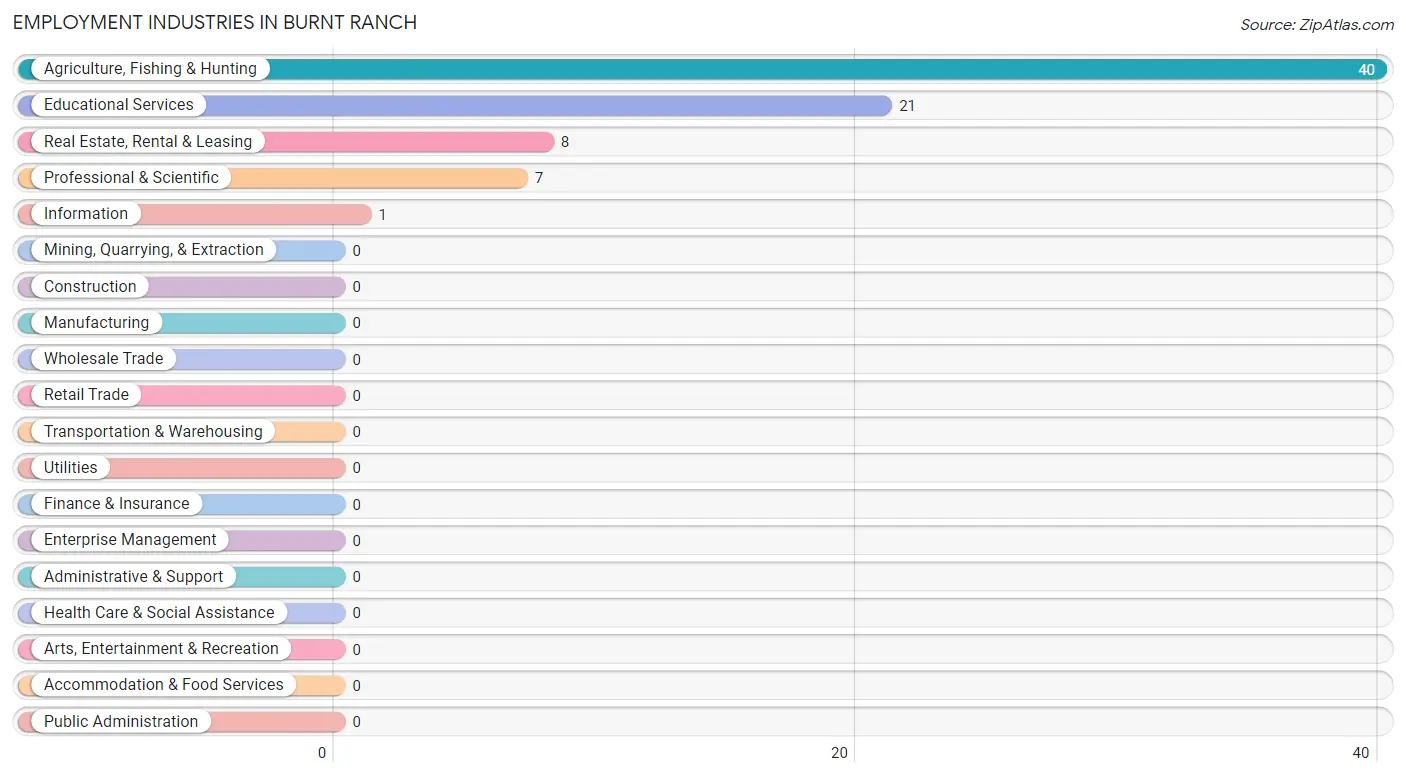
Employment Industries in Burnt Ranch
The major employment industries in Burnt Ranch include Agriculture, Fishing & Hunting (40 | 51.9%), Educational Services (21 | 27.3%), Real Estate, Rental & Leasing (8 | 10.4%), Professional & Scientific (7 | 9.1%), and Information (1 | 1.3%).
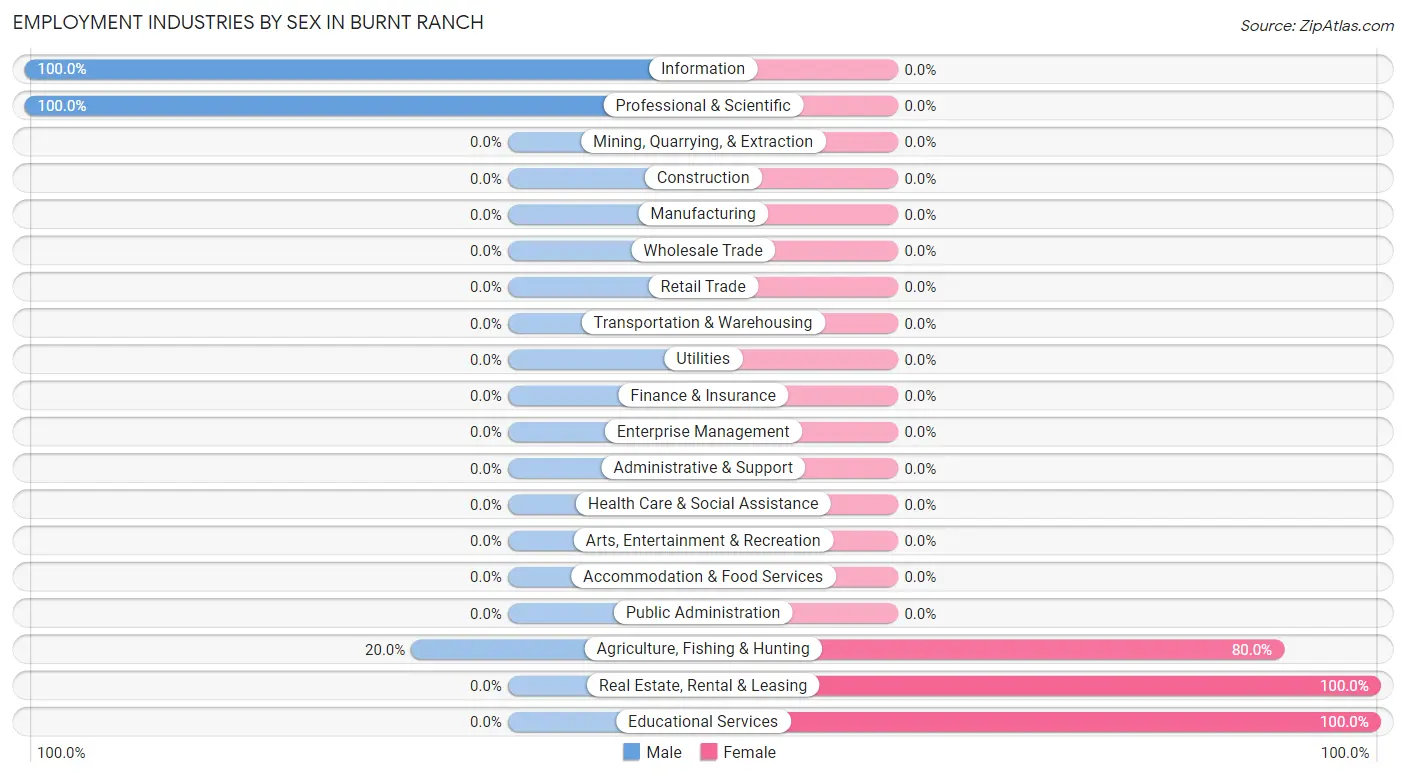
Employment Industries by Sex in Burnt Ranch
The Burnt Ranch industries that see more men than women are Information (100.0%), Professional & Scientific (100.0%), and Agriculture, Fishing & Hunting (20.0%), whereas the industries that tend to have a higher number of women are Real Estate, Rental & Leasing (100.0%), Educational Services (100.0%), and Agriculture, Fishing & Hunting (80.0%).
| Industry | Male | Female |
| Agriculture, Fishing & Hunting | 8 (20.0%) | 32 (80.0%) |
| Mining, Quarrying, & Extraction | 0 (0.0%) | 0 (0.0%) |
| Construction | 0 (0.0%) | 0 (0.0%) |
| Manufacturing | 0 (0.0%) | 0 (0.0%) |
| Wholesale Trade | 0 (0.0%) | 0 (0.0%) |
| Retail Trade | 0 (0.0%) | 0 (0.0%) |
| Transportation & Warehousing | 0 (0.0%) | 0 (0.0%) |
| Utilities | 0 (0.0%) | 0 (0.0%) |
| Information | 1 (100.0%) | 0 (0.0%) |
| Finance & Insurance | 0 (0.0%) | 0 (0.0%) |
| Real Estate, Rental & Leasing | 0 (0.0%) | 8 (100.0%) |
| Professional & Scientific | 7 (100.0%) | 0 (0.0%) |
| Enterprise Management | 0 (0.0%) | 0 (0.0%) |
| Administrative & Support | 0 (0.0%) | 0 (0.0%) |
| Educational Services | 0 (0.0%) | 21 (100.0%) |
| Health Care & Social Assistance | 0 (0.0%) | 0 (0.0%) |
| Arts, Entertainment & Recreation | 0 (0.0%) | 0 (0.0%) |
| Accommodation & Food Services | 0 (0.0%) | 0 (0.0%) |
| Public Administration | 0 (0.0%) | 0 (0.0%) |
| Total | 16 (20.8%) | 61 (79.2%) |
Education in Burnt Ranch
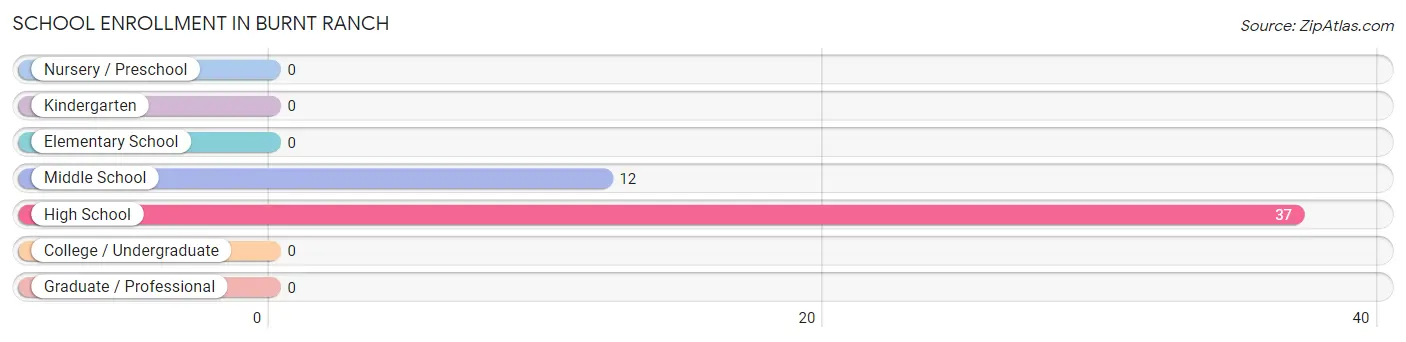
School Enrollment in Burnt Ranch
The most common levels of schooling among the 49 students in Burnt Ranch are high school (37 | 75.5%), and middle school (12 | 24.5%).
| School Level | # Students | % Students |
| Nursery / Preschool | 0 | 0.0% |
| Kindergarten | 0 | 0.0% |
| Elementary School | 0 | 0.0% |
| Middle School | 12 | 24.5% |
| High School | 37 | 75.5% |
| College / Undergraduate | 0 | 0.0% |
| Graduate / Professional | 0 | 0.0% |
| Total | 49 | 100.0% |
School Enrollment by Age by Funding Source in Burnt Ranch
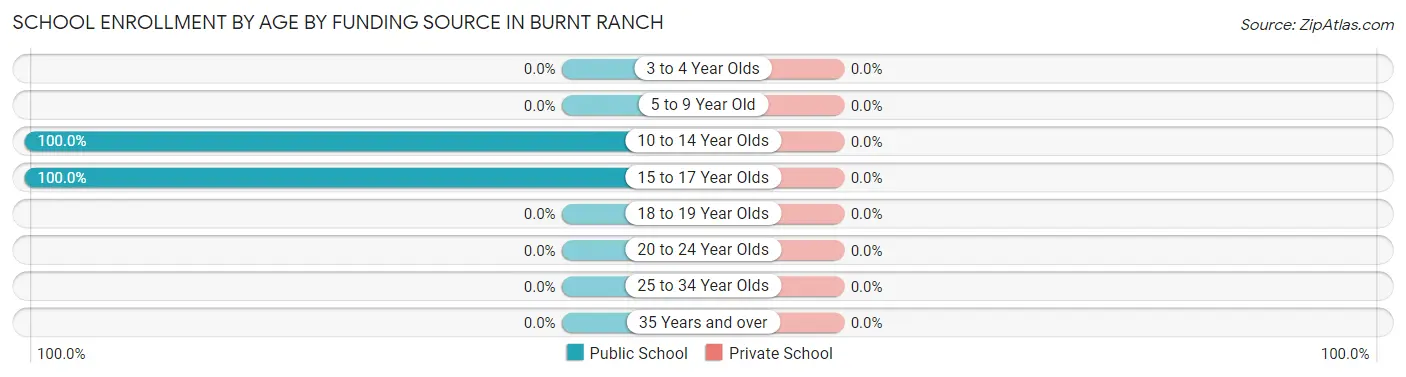
| Age Bracket | Public School | Private School |
| 3 to 4 Year Olds | 0 (0.0%) | 0 (0.0%) |
| 5 to 9 Year Old | 0 (0.0%) | 0 (0.0%) |
| 10 to 14 Year Olds | 28 (100.0%) | 0 (0.0%) |
| 15 to 17 Year Olds | 21 (100.0%) | 0 (0.0%) |
| 18 to 19 Year Olds | 0 (0.0%) | 0 (0.0%) |
| 20 to 24 Year Olds | 0 (0.0%) | 0 (0.0%) |
| 25 to 34 Year Olds | 0 (0.0%) | 0 (0.0%) |
| 35 Years and over | 0 (0.0%) | 0 (0.0%) |
| Total | 49 (100.0%) | 0 (0.0%) |
Educational Attainment by Field of Study in Burnt Ranch
Education (32 | 74.4%), engineering (7 | 16.3%), social sciences (3 | 7.0%), and arts & humanities (1 | 2.3%) are the most common fields of study among 43 individuals in Burnt Ranch who have obtained a bachelor's degree or higher.
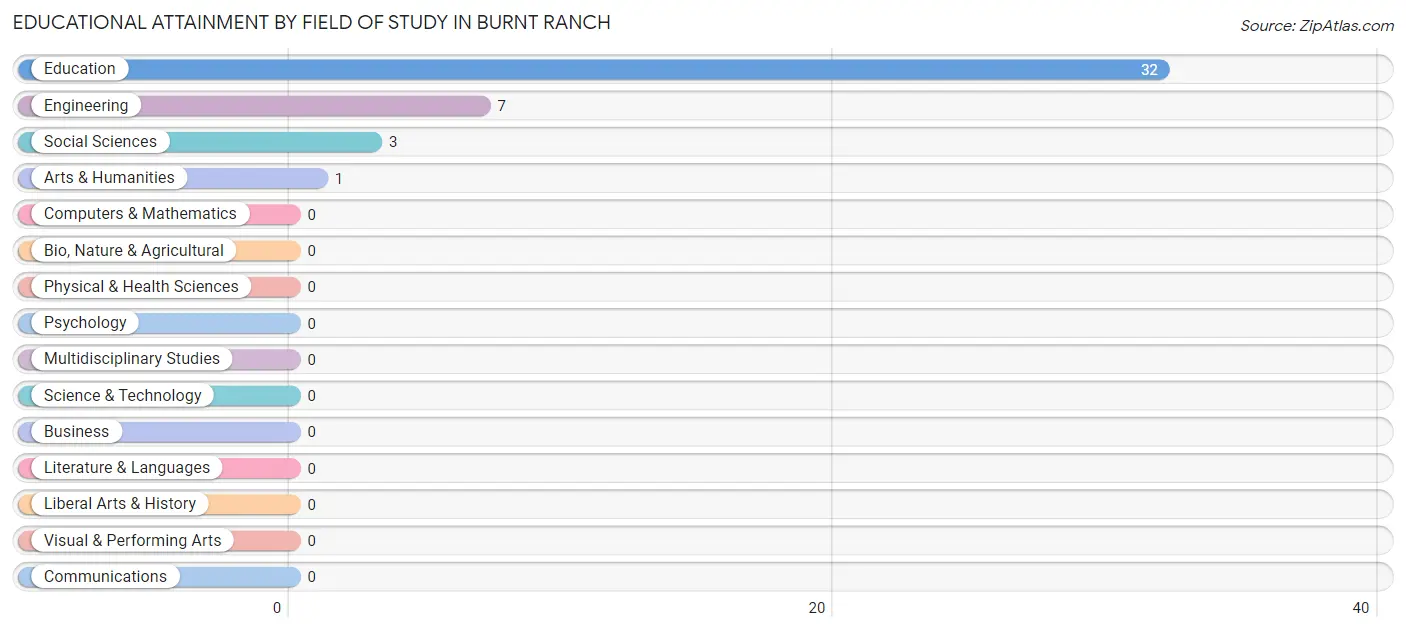
| Field of Study | # Graduates | % Graduates |
| Computers & Mathematics | 0 | 0.0% |
| Bio, Nature & Agricultural | 0 | 0.0% |
| Physical & Health Sciences | 0 | 0.0% |
| Psychology | 0 | 0.0% |
| Social Sciences | 3 | 7.0% |
| Engineering | 7 | 16.3% |
| Multidisciplinary Studies | 0 | 0.0% |
| Science & Technology | 0 | 0.0% |
| Business | 0 | 0.0% |
| Education | 32 | 74.4% |
| Literature & Languages | 0 | 0.0% |
| Liberal Arts & History | 0 | 0.0% |
| Visual & Performing Arts | 0 | 0.0% |
| Communications | 0 | 0.0% |
| Arts & Humanities | 1 | 2.3% |
| Total | 43 | 100.0% |
Transportation & Commute in Burnt Ranch
Vehicle Availability by Sex in Burnt Ranch
The most prevalent vehicle ownership categories in Burnt Ranch are males with 4 vehicles (8, accounting for 50.0%) and females with 4 vehicles (32, making up 13.1%).
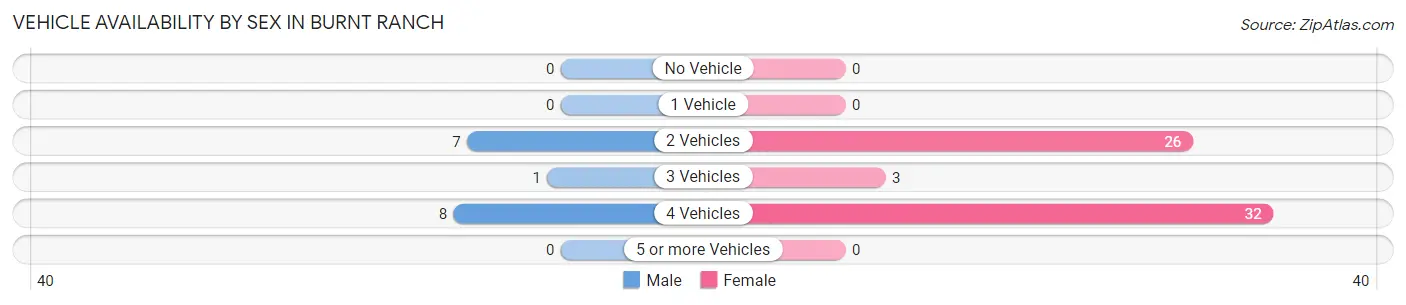
| Vehicles Available | Male | Female |
| No Vehicle | 0 (0.0%) | 0 (0.0%) |
| 1 Vehicle | 0 (0.0%) | 0 (0.0%) |
| 2 Vehicles | 7 (43.8%) | 26 (42.6%) |
| 3 Vehicles | 1 (6.2%) | 3 (4.9%) |
| 4 Vehicles | 8 (50.0%) | 32 (52.5%) |
| 5 or more Vehicles | 0 (0.0%) | 0 (0.0%) |
| Total | 16 (100.0%) | 61 (100.0%) |
Commute Time in Burnt Ranch
The most frequently occuring commute durations in Burnt Ranch are 5 to 9 minutes (20 commuters, 54.0%), 20 to 24 minutes (8 commuters, 21.6%), and less than 5 minutes (7 commuters, 18.9%).
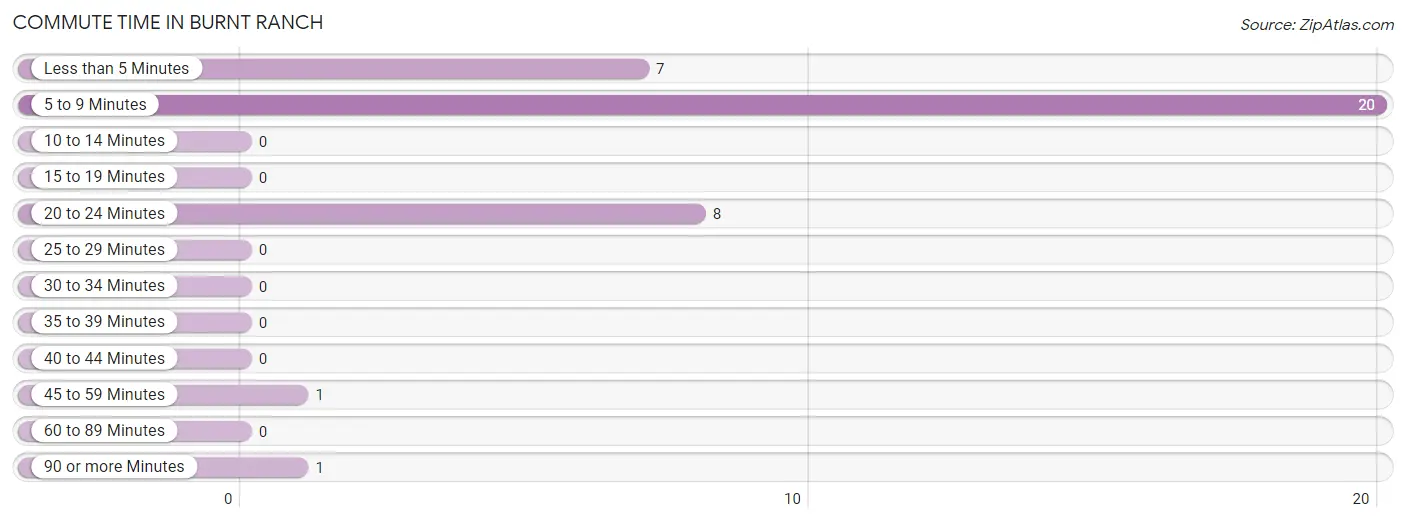
| Commute Time | # Commuters | % Commuters |
| Less than 5 Minutes | 7 | 18.9% |
| 5 to 9 Minutes | 20 | 54.0% |
| 10 to 14 Minutes | 0 | 0.0% |
| 15 to 19 Minutes | 0 | 0.0% |
| 20 to 24 Minutes | 8 | 21.6% |
| 25 to 29 Minutes | 0 | 0.0% |
| 30 to 34 Minutes | 0 | 0.0% |
| 35 to 39 Minutes | 0 | 0.0% |
| 40 to 44 Minutes | 0 | 0.0% |
| 45 to 59 Minutes | 1 | 2.7% |
| 60 to 89 Minutes | 0 | 0.0% |
| 90 or more Minutes | 1 | 2.7% |
Commute Time by Sex in Burnt Ranch
The most common commute times in Burnt Ranch are less than 5 minutes (7 commuters, 87.5%) for males and 5 to 9 minutes (20 commuters, 69.0%) for females.
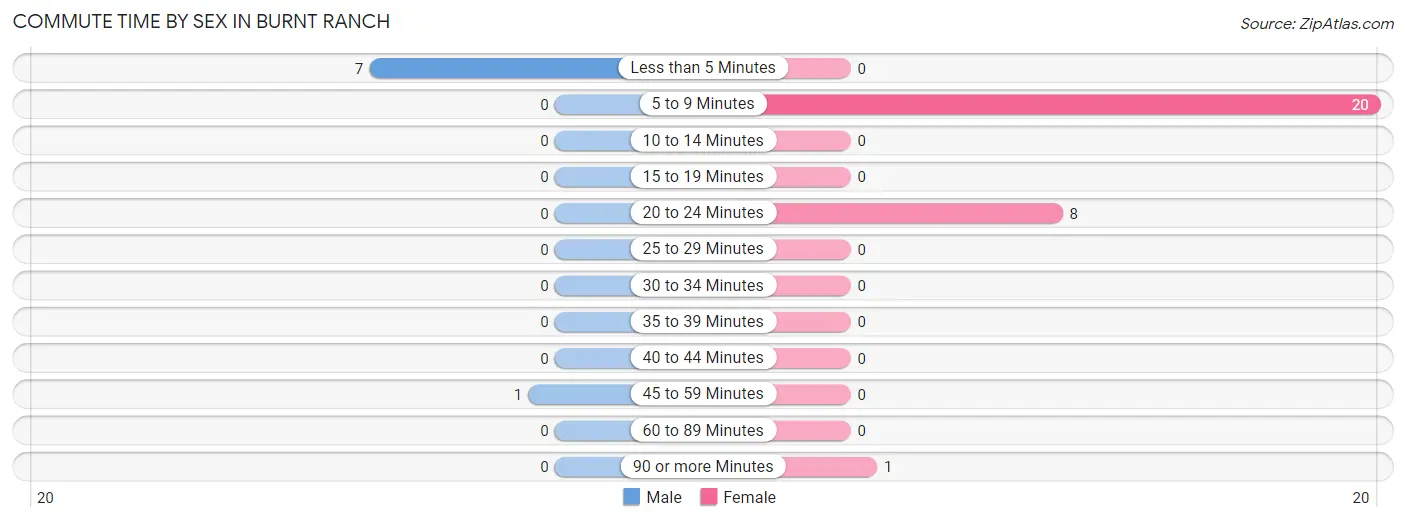
| Commute Time | Male | Female |
| Less than 5 Minutes | 7 (87.5%) | 0 (0.0%) |
| 5 to 9 Minutes | 0 (0.0%) | 20 (69.0%) |
| 10 to 14 Minutes | 0 (0.0%) | 0 (0.0%) |
| 15 to 19 Minutes | 0 (0.0%) | 0 (0.0%) |
| 20 to 24 Minutes | 0 (0.0%) | 8 (27.6%) |
| 25 to 29 Minutes | 0 (0.0%) | 0 (0.0%) |
| 30 to 34 Minutes | 0 (0.0%) | 0 (0.0%) |
| 35 to 39 Minutes | 0 (0.0%) | 0 (0.0%) |
| 40 to 44 Minutes | 0 (0.0%) | 0 (0.0%) |
| 45 to 59 Minutes | 1 (12.5%) | 0 (0.0%) |
| 60 to 89 Minutes | 0 (0.0%) | 0 (0.0%) |
| 90 or more Minutes | 0 (0.0%) | 1 (3.5%) |
Time of Departure to Work by Sex in Burnt Ranch
The most frequent times of departure to work in Burnt Ranch are 9:00 AM to 9:59 AM (7, 87.5%) for males and 9:00 AM to 9:59 AM (17, 58.6%) for females.
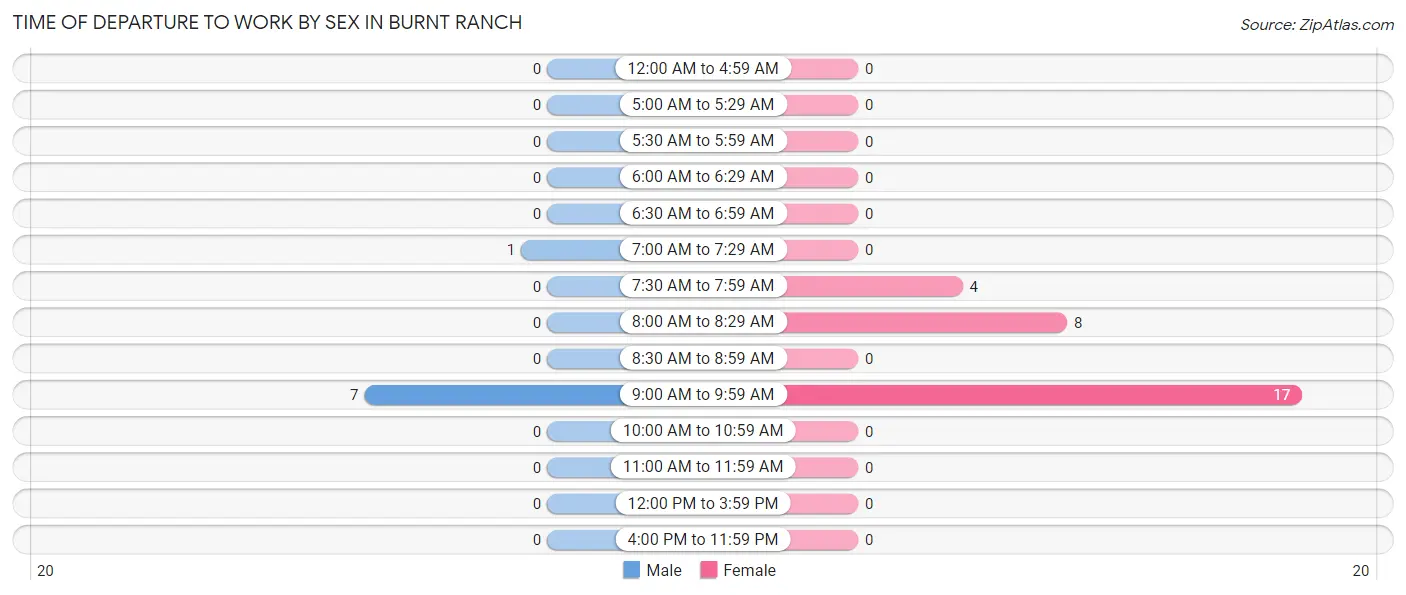
| Time of Departure | Male | Female |
| 12:00 AM to 4:59 AM | 0 (0.0%) | 0 (0.0%) |
| 5:00 AM to 5:29 AM | 0 (0.0%) | 0 (0.0%) |
| 5:30 AM to 5:59 AM | 0 (0.0%) | 0 (0.0%) |
| 6:00 AM to 6:29 AM | 0 (0.0%) | 0 (0.0%) |
| 6:30 AM to 6:59 AM | 0 (0.0%) | 0 (0.0%) |
| 7:00 AM to 7:29 AM | 1 (12.5%) | 0 (0.0%) |
| 7:30 AM to 7:59 AM | 0 (0.0%) | 4 (13.8%) |
| 8:00 AM to 8:29 AM | 0 (0.0%) | 8 (27.6%) |
| 8:30 AM to 8:59 AM | 0 (0.0%) | 0 (0.0%) |
| 9:00 AM to 9:59 AM | 7 (87.5%) | 17 (58.6%) |
| 10:00 AM to 10:59 AM | 0 (0.0%) | 0 (0.0%) |
| 11:00 AM to 11:59 AM | 0 (0.0%) | 0 (0.0%) |
| 12:00 PM to 3:59 PM | 0 (0.0%) | 0 (0.0%) |
| 4:00 PM to 11:59 PM | 0 (0.0%) | 0 (0.0%) |
| Total | 8 (100.0%) | 29 (100.0%) |
Housing Occupancy in Burnt Ranch
Occupancy by Ownership in Burnt Ranch
Of the total 88 dwellings in Burnt Ranch, owner-occupied units account for 56 (63.6%), while renter-occupied units make up 32 (36.4%).
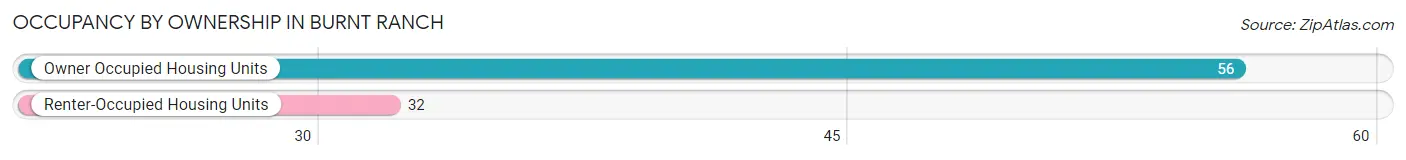
| Occupancy | # Housing Units | % Housing Units |
| Owner Occupied Housing Units | 56 | 63.6% |
| Renter-Occupied Housing Units | 32 | 36.4% |
| Total Occupied Housing Units | 88 | 100.0% |
Occupancy by Household Size in Burnt Ranch
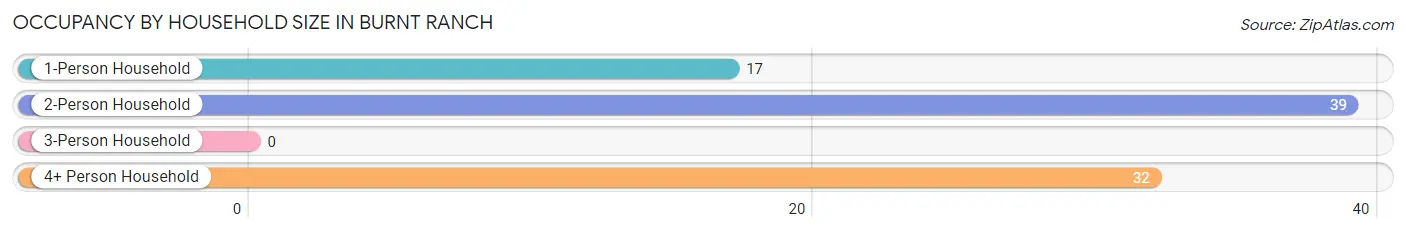
| Household Size | # Housing Units | % Housing Units |
| 1-Person Household | 17 | 19.3% |
| 2-Person Household | 39 | 44.3% |
| 3-Person Household | 0 | 0.0% |
| 4+ Person Household | 32 | 36.4% |
| Total Housing Units | 88 | 100.0% |
Occupancy by Ownership by Household Size in Burnt Ranch
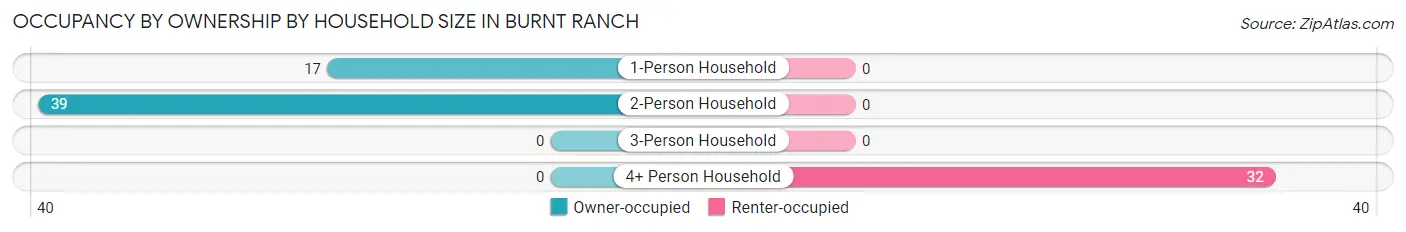
| Household Size | Owner-occupied | Renter-occupied |
| 1-Person Household | 17 (100.0%) | 0 (0.0%) |
| 2-Person Household | 39 (100.0%) | 0 (0.0%) |
| 3-Person Household | 0 (0.0%) | 0 (0.0%) |
| 4+ Person Household | 0 (0.0%) | 32 (100.0%) |
| Total Housing Units | 56 (63.6%) | 32 (36.4%) |
Occupancy by Educational Attainment in Burnt Ranch
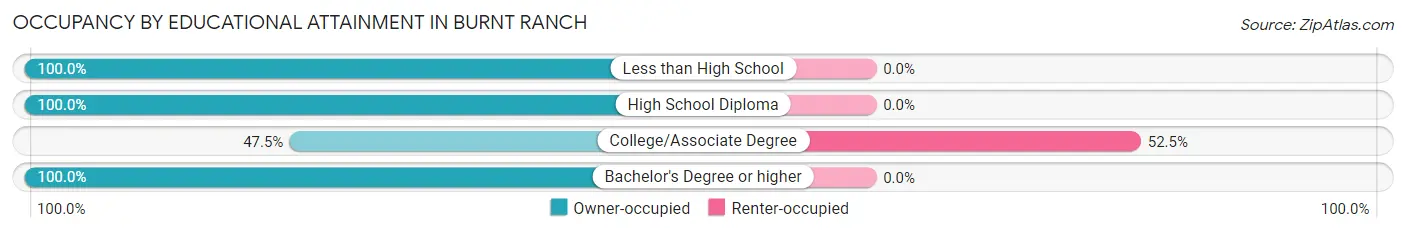
| Household Size | Owner-occupied | Renter-occupied |
| Less than High School | 6 (100.0%) | 0 (0.0%) |
| High School Diploma | 12 (100.0%) | 0 (0.0%) |
| College/Associate Degree | 29 (47.5%) | 32 (52.5%) |
| Bachelor's Degree or higher | 9 (100.0%) | 0 (0.0%) |
Occupancy by Age of Householder in Burnt Ranch
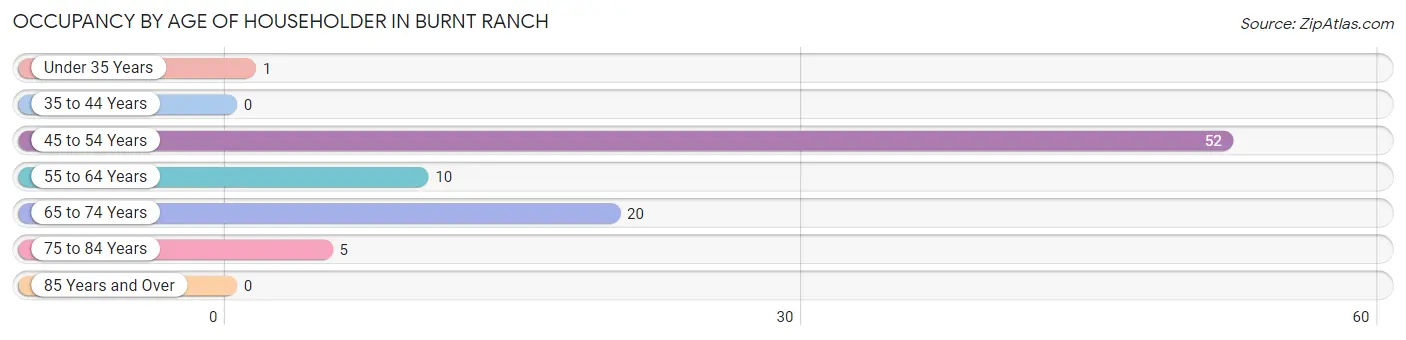
| Age Bracket | # Households | % Households |
| Under 35 Years | 1 | 1.1% |
| 35 to 44 Years | 0 | 0.0% |
| 45 to 54 Years | 52 | 59.1% |
| 55 to 64 Years | 10 | 11.4% |
| 65 to 74 Years | 20 | 22.7% |
| 75 to 84 Years | 5 | 5.7% |
| 85 Years and Over | 0 | 0.0% |
| Total | 88 | 100.0% |
Housing Finances in Burnt Ranch
Median Income by Occupancy in Burnt Ranch
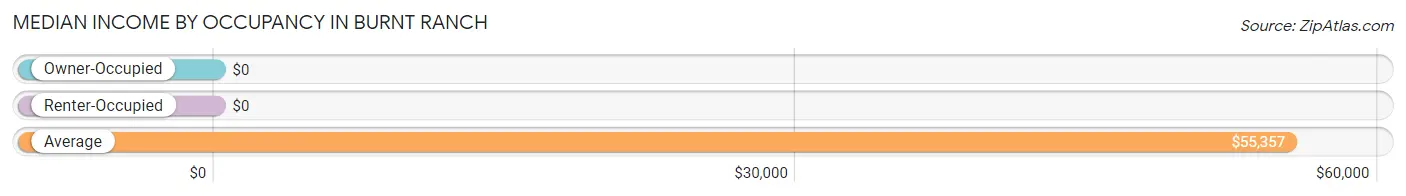
| Occupancy Type | # Households | Median Income |
| Owner-Occupied | 56 (63.6%) | $0 |
| Renter-Occupied | 32 (36.4%) | $0 |
| Average | 88 (100.0%) | $55,357 |
Occupancy by Householder Income Bracket in Burnt Ranch
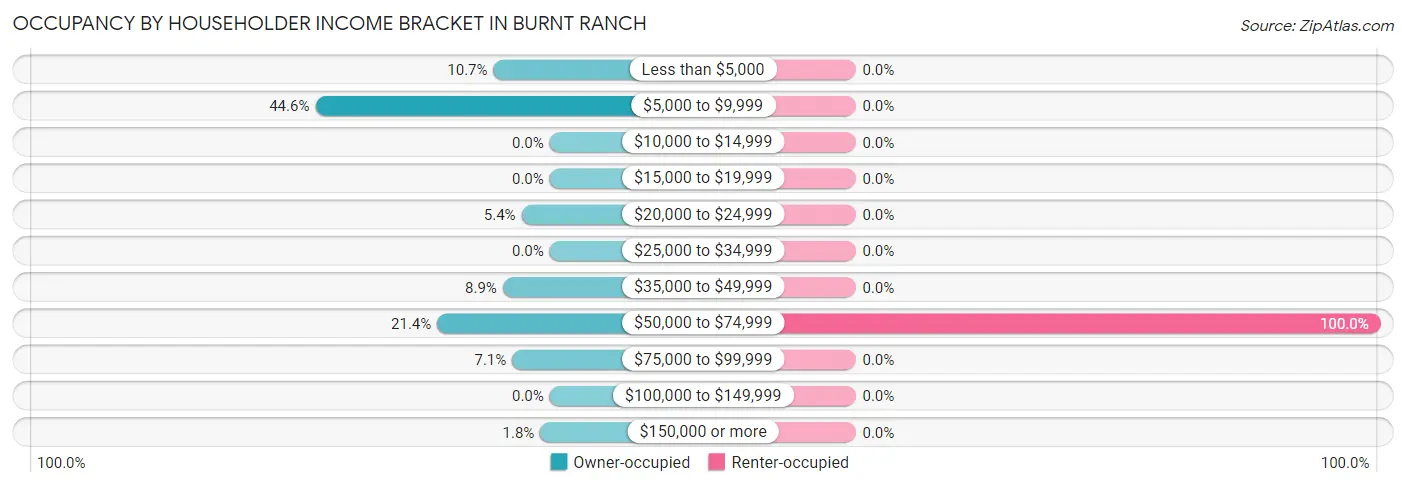
| Income Bracket | Owner-occupied | Renter-occupied |
| Less than $5,000 | 6 (10.7%) | 0 (0.0%) |
| $5,000 to $9,999 | 25 (44.6%) | 0 (0.0%) |
| $10,000 to $14,999 | 0 (0.0%) | 0 (0.0%) |
| $15,000 to $19,999 | 0 (0.0%) | 0 (0.0%) |
| $20,000 to $24,999 | 3 (5.4%) | 0 (0.0%) |
| $25,000 to $34,999 | 0 (0.0%) | 0 (0.0%) |
| $35,000 to $49,999 | 5 (8.9%) | 0 (0.0%) |
| $50,000 to $74,999 | 12 (21.4%) | 32 (100.0%) |
| $75,000 to $99,999 | 4 (7.1%) | 0 (0.0%) |
| $100,000 to $149,999 | 0 (0.0%) | 0 (0.0%) |
| $150,000 or more | 1 (1.8%) | 0 (0.0%) |
| Total | 56 (100.0%) | 32 (100.0%) |
Monthly Housing Cost Tiers in Burnt Ranch
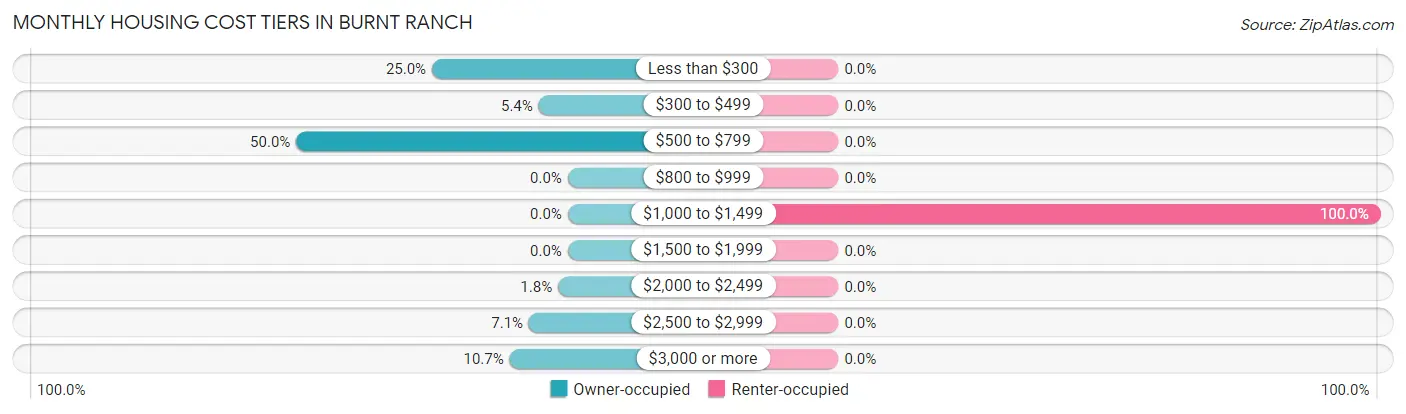
| Monthly Cost | Owner-occupied | Renter-occupied |
| Less than $300 | 14 (25.0%) | 0 (0.0%) |
| $300 to $499 | 3 (5.4%) | 0 (0.0%) |
| $500 to $799 | 28 (50.0%) | 0 (0.0%) |
| $800 to $999 | 0 (0.0%) | 0 (0.0%) |
| $1,000 to $1,499 | 0 (0.0%) | 32 (100.0%) |
| $1,500 to $1,999 | 0 (0.0%) | 0 (0.0%) |
| $2,000 to $2,499 | 1 (1.8%) | 0 (0.0%) |
| $2,500 to $2,999 | 4 (7.1%) | 0 (0.0%) |
| $3,000 or more | 6 (10.7%) | 0 (0.0%) |
| Total | 56 (100.0%) | 32 (100.0%) |
Physical Housing Characteristics in Burnt Ranch
Housing Structures in Burnt Ranch
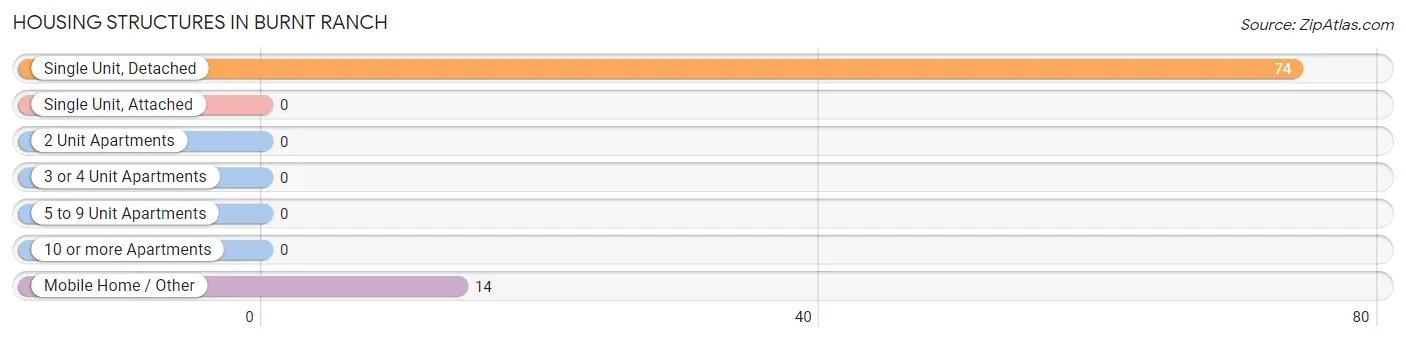
| Structure Type | # Housing Units | % Housing Units |
| Single Unit, Detached | 74 | 84.1% |
| Single Unit, Attached | 0 | 0.0% |
| 2 Unit Apartments | 0 | 0.0% |
| 3 or 4 Unit Apartments | 0 | 0.0% |
| 5 to 9 Unit Apartments | 0 | 0.0% |
| 10 or more Apartments | 0 | 0.0% |
| Mobile Home / Other | 14 | 15.9% |
| Total | 88 | 100.0% |
Housing Structures by Occupancy in Burnt Ranch
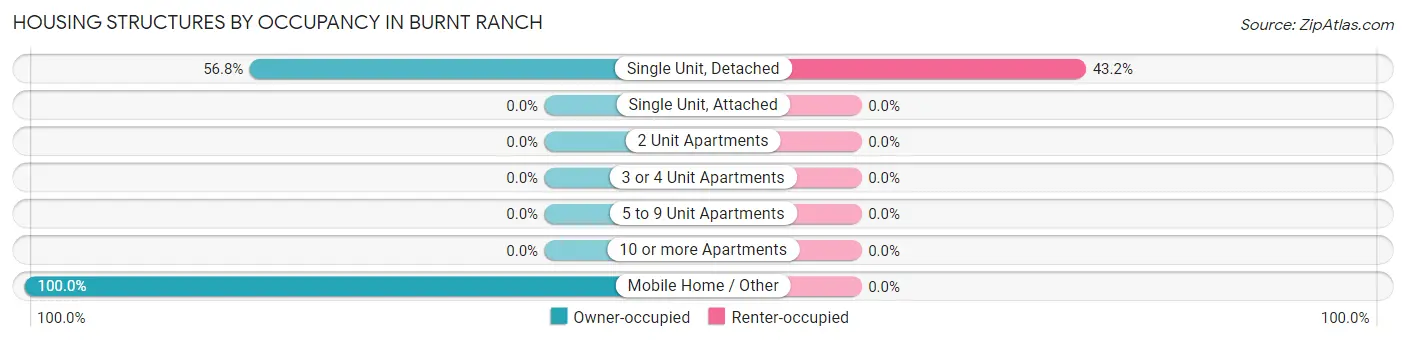
| Structure Type | Owner-occupied | Renter-occupied |
| Single Unit, Detached | 42 (56.8%) | 32 (43.2%) |
| Single Unit, Attached | 0 (0.0%) | 0 (0.0%) |
| 2 Unit Apartments | 0 (0.0%) | 0 (0.0%) |
| 3 or 4 Unit Apartments | 0 (0.0%) | 0 (0.0%) |
| 5 to 9 Unit Apartments | 0 (0.0%) | 0 (0.0%) |
| 10 or more Apartments | 0 (0.0%) | 0 (0.0%) |
| Mobile Home / Other | 14 (100.0%) | 0 (0.0%) |
| Total | 56 (63.6%) | 32 (36.4%) |
Housing Structures by Number of Rooms in Burnt Ranch
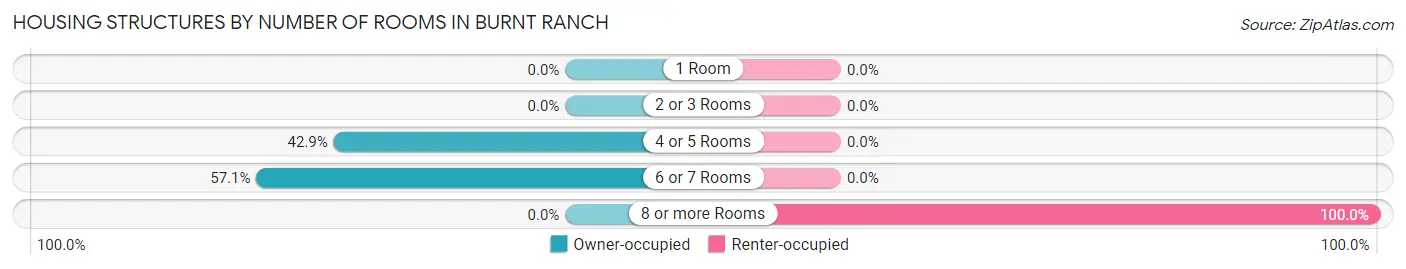
| Number of Rooms | Owner-occupied | Renter-occupied |
| 1 Room | 0 (0.0%) | 0 (0.0%) |
| 2 or 3 Rooms | 0 (0.0%) | 0 (0.0%) |
| 4 or 5 Rooms | 24 (42.9%) | 0 (0.0%) |
| 6 or 7 Rooms | 32 (57.1%) | 0 (0.0%) |
| 8 or more Rooms | 0 (0.0%) | 32 (100.0%) |
| Total | 56 (100.0%) | 32 (100.0%) |
Housing Structure by Heating Type in Burnt Ranch
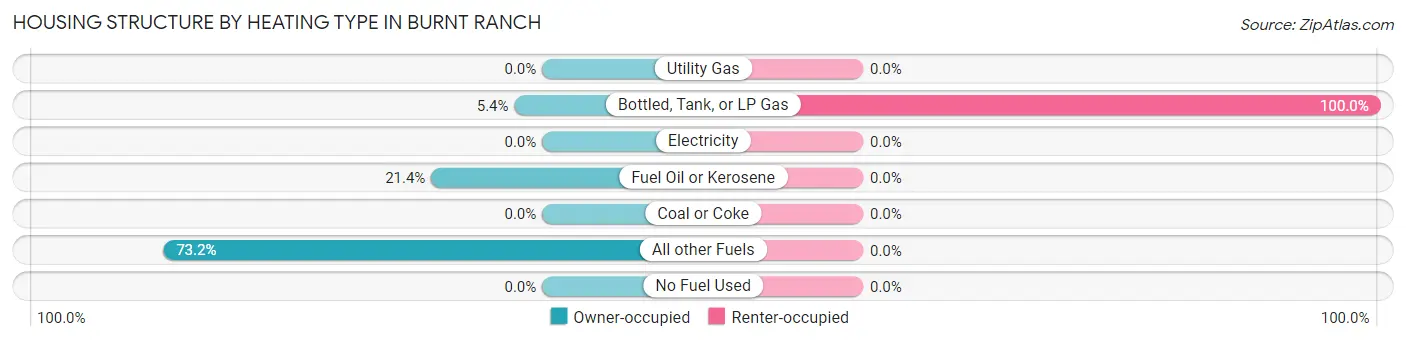
| Heating Type | Owner-occupied | Renter-occupied |
| Utility Gas | 0 (0.0%) | 0 (0.0%) |
| Bottled, Tank, or LP Gas | 3 (5.4%) | 32 (100.0%) |
| Electricity | 0 (0.0%) | 0 (0.0%) |
| Fuel Oil or Kerosene | 12 (21.4%) | 0 (0.0%) |
| Coal or Coke | 0 (0.0%) | 0 (0.0%) |
| All other Fuels | 41 (73.2%) | 0 (0.0%) |
| No Fuel Used | 0 (0.0%) | 0 (0.0%) |
| Total | 56 (100.0%) | 32 (100.0%) |
Household Vehicle Usage in Burnt Ranch
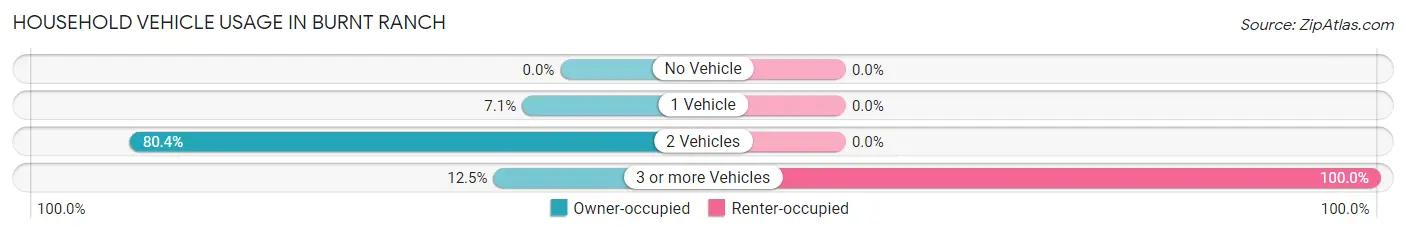
| Vehicles per Household | Owner-occupied | Renter-occupied |
| No Vehicle | 0 (0.0%) | 0 (0.0%) |
| 1 Vehicle | 4 (7.1%) | 0 (0.0%) |
| 2 Vehicles | 45 (80.4%) | 0 (0.0%) |
| 3 or more Vehicles | 7 (12.5%) | 32 (100.0%) |
| Total | 56 (100.0%) | 32 (100.0%) |
Real Estate & Mortgages in Burnt Ranch
Real Estate and Mortgage Overview in Burnt Ranch
| Characteristic | Without Mortgage | With Mortgage |
| Housing Units | 45 | 11 |
| Median Property Value | - | - |
| Median Household Income | - | - |
| Monthly Housing Costs | $569 | $6 |
| Real Estate Taxes | - | - |
Property Value by Mortgage Status in Burnt Ranch
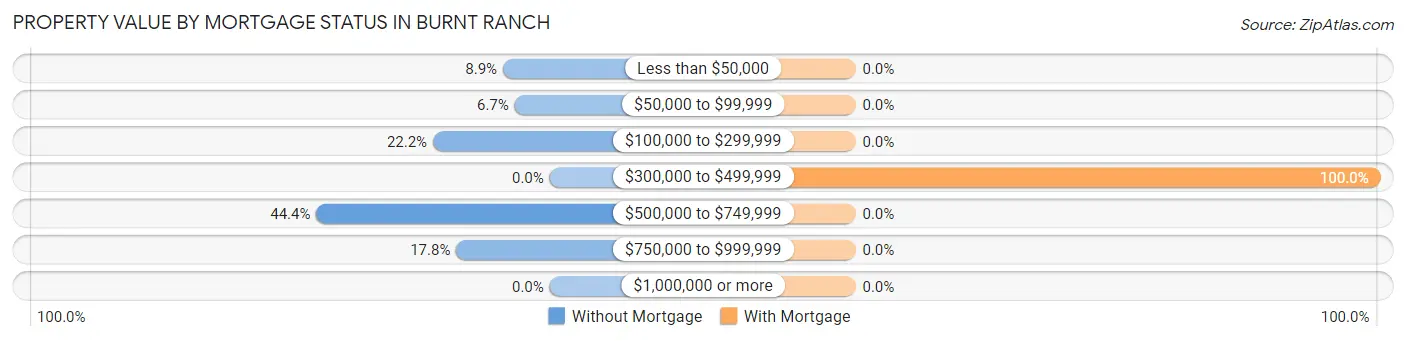
| Property Value | Without Mortgage | With Mortgage |
| Less than $50,000 | 4 (8.9%) | 0 (0.0%) |
| $50,000 to $99,999 | 3 (6.7%) | 0 (0.0%) |
| $100,000 to $299,999 | 10 (22.2%) | 0 (0.0%) |
| $300,000 to $499,999 | 0 (0.0%) | 11 (100.0%) |
| $500,000 to $749,999 | 20 (44.4%) | 0 (0.0%) |
| $750,000 to $999,999 | 8 (17.8%) | 0 (0.0%) |
| $1,000,000 or more | 0 (0.0%) | 0 (0.0%) |
| Total | 45 (100.0%) | 11 (100.0%) |
Household Income by Mortgage Status in Burnt Ranch
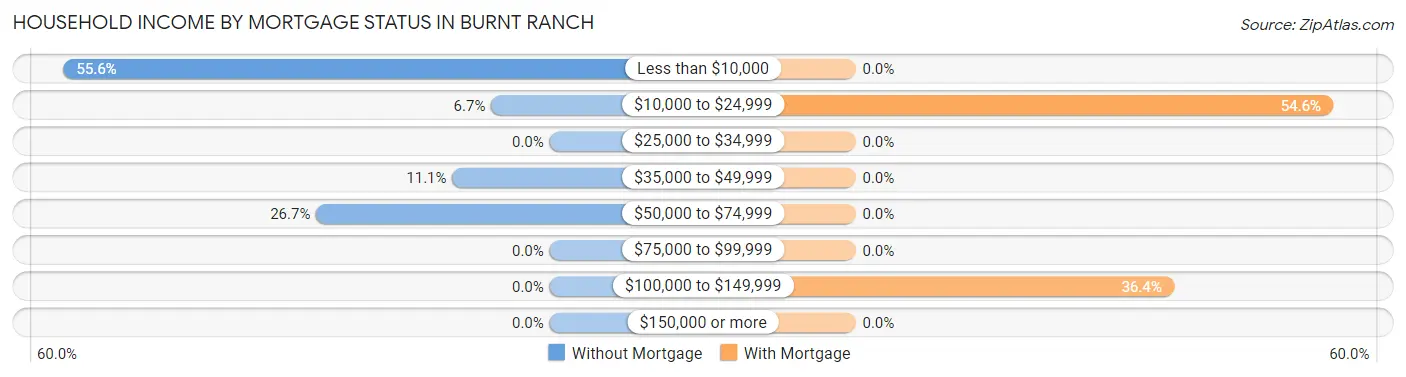
| Household Income | Without Mortgage | With Mortgage |
| Less than $10,000 | 25 (55.6%) | 0 (0.0%) |
| $10,000 to $24,999 | 3 (6.7%) | 6 (54.5%) |
| $25,000 to $34,999 | 0 (0.0%) | 0 (0.0%) |
| $35,000 to $49,999 | 5 (11.1%) | 0 (0.0%) |
| $50,000 to $74,999 | 12 (26.7%) | 0 (0.0%) |
| $75,000 to $99,999 | 0 (0.0%) | 0 (0.0%) |
| $100,000 to $149,999 | 0 (0.0%) | 4 (36.4%) |
| $150,000 or more | 0 (0.0%) | 0 (0.0%) |
| Total | 45 (100.0%) | 11 (100.0%) |
Property Value to Household Income Ratio in Burnt Ranch
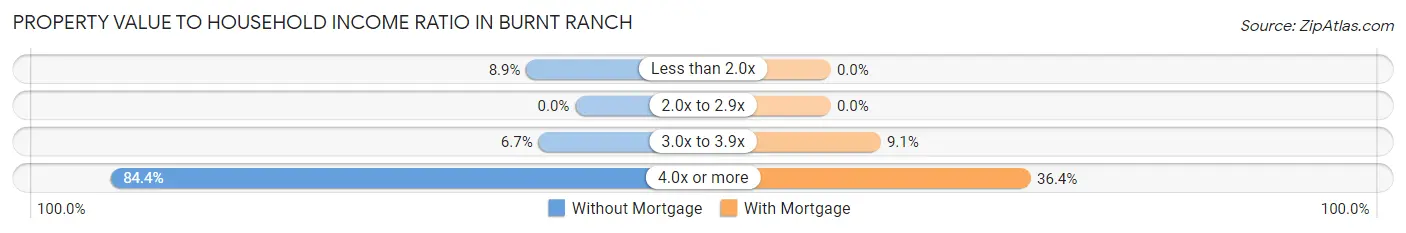
| Value-to-Income Ratio | Without Mortgage | With Mortgage |
| Less than 2.0x | 4 (8.9%) | 0 (0.0%) |
| 2.0x to 2.9x | 0 (0.0%) | 0 (0.0%) |
| 3.0x to 3.9x | 3 (6.7%) | 1 (9.1%) |
| 4.0x or more | 38 (84.4%) | 4 (36.4%) |
| Total | 45 (100.0%) | 11 (100.0%) |
Real Estate Taxes by Mortgage Status in Burnt Ranch
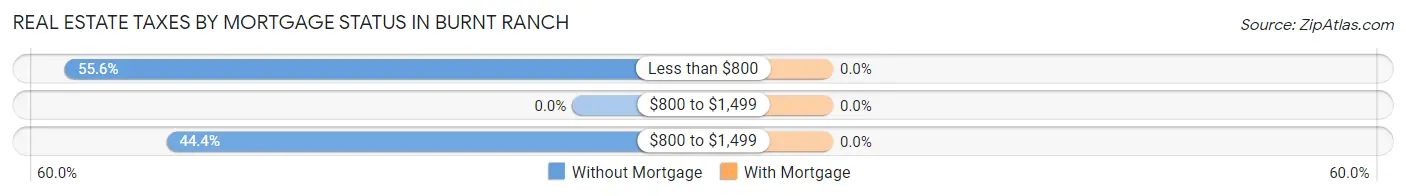
| Property Taxes | Without Mortgage | With Mortgage |
| Less than $800 | 25 (55.6%) | 0 (0.0%) |
| $800 to $1,499 | 0 (0.0%) | 0 (0.0%) |
| $800 to $1,499 | 20 (44.4%) | 0 (0.0%) |
| Total | 45 (100.0%) | 11 (100.0%) |
Health & Disability in Burnt Ranch
Health Insurance Coverage by Age in Burnt Ranch
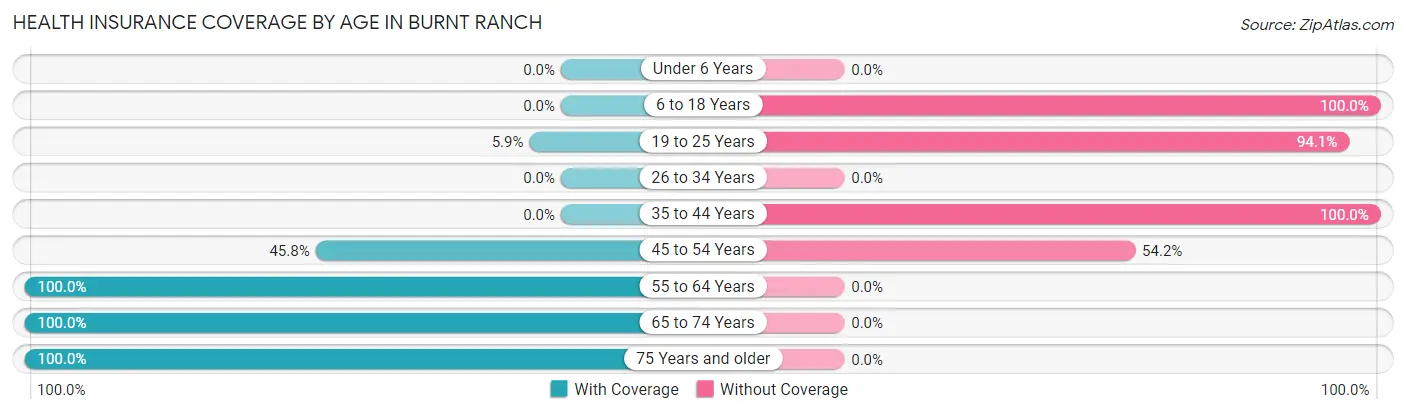
| Age Bracket | With Coverage | Without Coverage |
| Under 6 Years | 0 (0.0%) | 0 (0.0%) |
| 6 to 18 Years | 0 (0.0%) | 49 (100.0%) |
| 19 to 25 Years | 1 (5.9%) | 16 (94.1%) |
| 26 to 34 Years | 0 (0.0%) | 0 (0.0%) |
| 35 to 44 Years | 0 (0.0%) | 8 (100.0%) |
| 45 to 54 Years | 27 (45.8%) | 32 (54.2%) |
| 55 to 64 Years | 35 (100.0%) | 0 (0.0%) |
| 65 to 74 Years | 23 (100.0%) | 0 (0.0%) |
| 75 Years and older | 37 (100.0%) | 0 (0.0%) |
| Total | 123 (53.9%) | 105 (46.1%) |
Health Insurance Coverage by Citizenship Status in Burnt Ranch
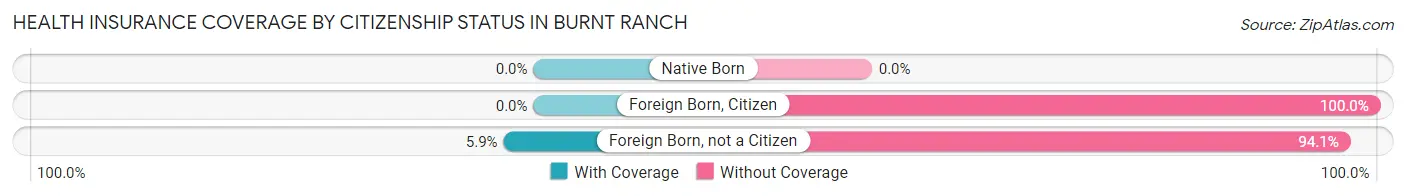
| Citizenship Status | With Coverage | Without Coverage |
| Native Born | 0 (0.0%) | 0 (0.0%) |
| Foreign Born, Citizen | 0 (0.0%) | 49 (100.0%) |
| Foreign Born, not a Citizen | 1 (5.9%) | 16 (94.1%) |
Health Insurance Coverage by Household Income in Burnt Ranch
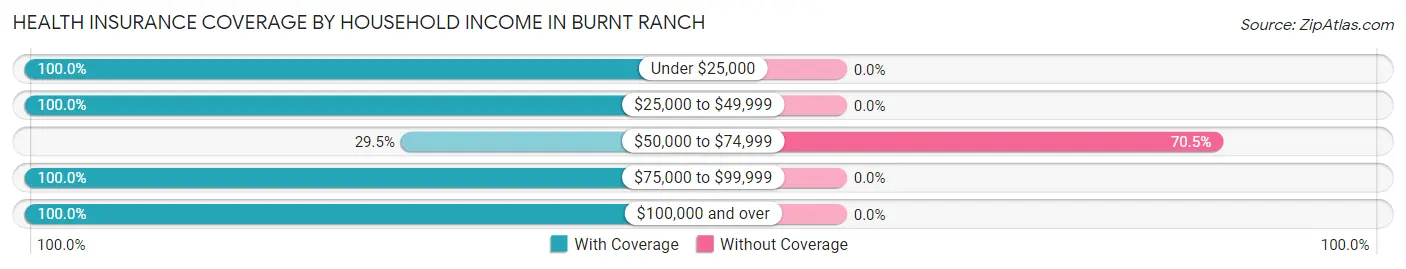
| Household Income | With Coverage | Without Coverage |
| Under $25,000 | 58 (100.0%) | 0 (0.0%) |
| $25,000 to $49,999 | 10 (100.0%) | 0 (0.0%) |
| $50,000 to $74,999 | 44 (29.5%) | 105 (70.5%) |
| $75,000 to $99,999 | 7 (100.0%) | 0 (0.0%) |
| $100,000 and over | 4 (100.0%) | 0 (0.0%) |
Public vs Private Health Insurance Coverage by Age in Burnt Ranch
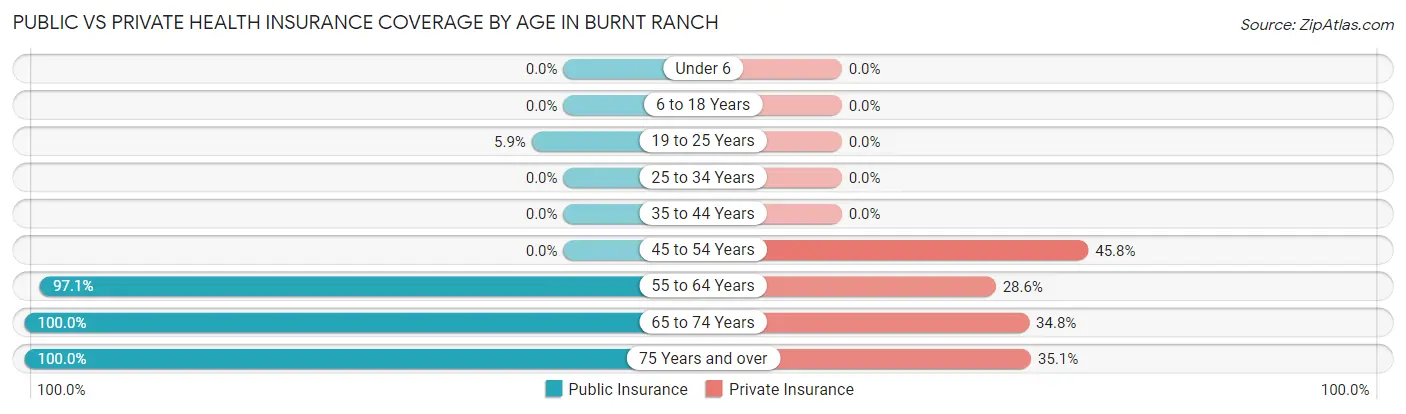
| Age Bracket | Public Insurance | Private Insurance |
| Under 6 | 0 (0.0%) | 0 (0.0%) |
| 6 to 18 Years | 0 (0.0%) | 0 (0.0%) |
| 19 to 25 Years | 1 (5.9%) | 0 (0.0%) |
| 25 to 34 Years | 0 (0.0%) | 0 (0.0%) |
| 35 to 44 Years | 0 (0.0%) | 0 (0.0%) |
| 45 to 54 Years | 0 (0.0%) | 27 (45.8%) |
| 55 to 64 Years | 34 (97.1%) | 10 (28.6%) |
| 65 to 74 Years | 23 (100.0%) | 8 (34.8%) |
| 75 Years and over | 37 (100.0%) | 13 (35.1%) |
| Total | 95 (41.7%) | 58 (25.4%) |
Disability Status by Sex by Age in Burnt Ranch
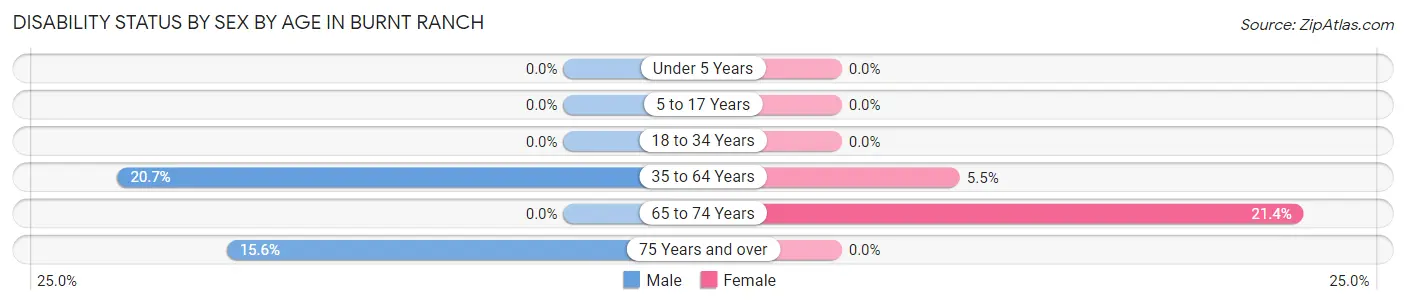
| Age Bracket | Male | Female |
| Under 5 Years | 0 (0.0%) | 0 (0.0%) |
| 5 to 17 Years | 0 (0.0%) | 0 (0.0%) |
| 18 to 34 Years | 0 (0.0%) | 0 (0.0%) |
| 35 to 64 Years | 6 (20.7%) | 4 (5.5%) |
| 65 to 74 Years | 0 (0.0%) | 3 (21.4%) |
| 75 Years and over | 5 (15.6%) | 0 (0.0%) |
Disability Class by Sex by Age in Burnt Ranch
Disability Class: Hearing Difficulty
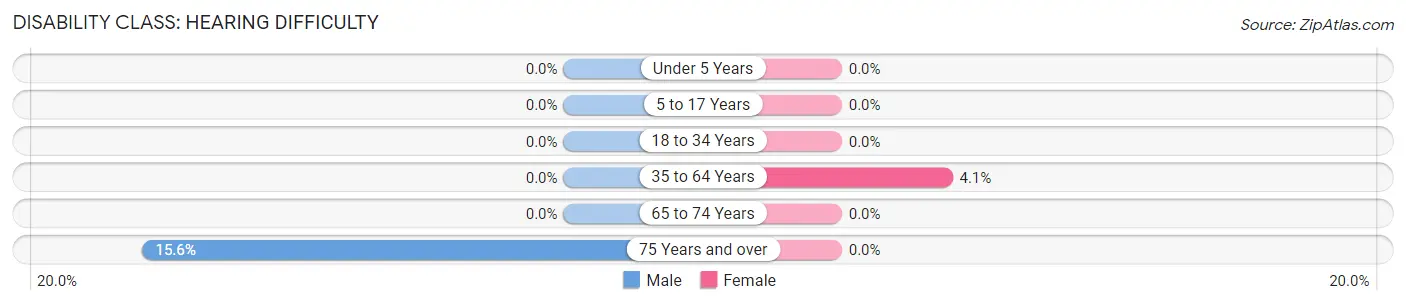
| Age Bracket | Male | Female |
| Under 5 Years | 0 (0.0%) | 0 (0.0%) |
| 5 to 17 Years | 0 (0.0%) | 0 (0.0%) |
| 18 to 34 Years | 0 (0.0%) | 0 (0.0%) |
| 35 to 64 Years | 0 (0.0%) | 3 (4.1%) |
| 65 to 74 Years | 0 (0.0%) | 0 (0.0%) |
| 75 Years and over | 5 (15.6%) | 0 (0.0%) |
Disability Class: Vision Difficulty
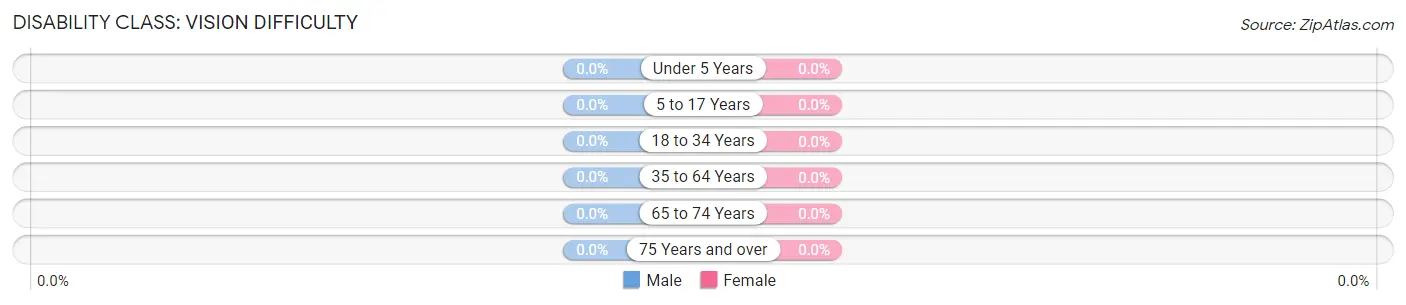
| Age Bracket | Male | Female |
| Under 5 Years | 0 (0.0%) | 0 (0.0%) |
| 5 to 17 Years | 0 (0.0%) | 0 (0.0%) |
| 18 to 34 Years | 0 (0.0%) | 0 (0.0%) |
| 35 to 64 Years | 0 (0.0%) | 0 (0.0%) |
| 65 to 74 Years | 0 (0.0%) | 0 (0.0%) |
| 75 Years and over | 0 (0.0%) | 0 (0.0%) |
Disability Class: Cognitive Difficulty
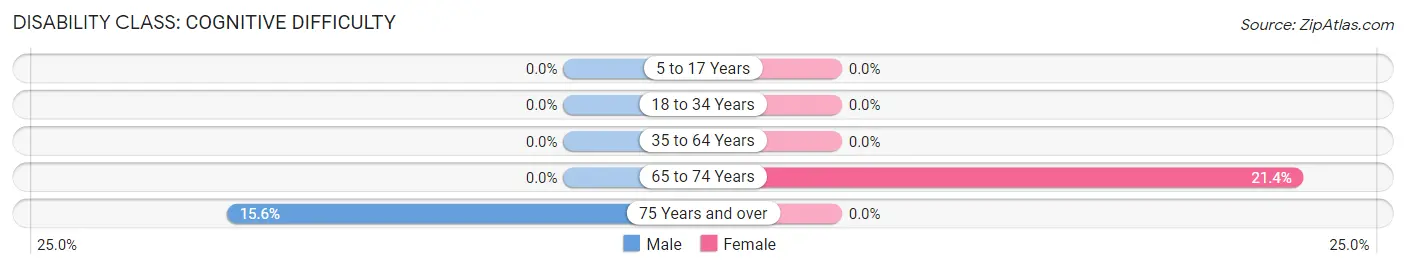
| Age Bracket | Male | Female |
| 5 to 17 Years | 0 (0.0%) | 0 (0.0%) |
| 18 to 34 Years | 0 (0.0%) | 0 (0.0%) |
| 35 to 64 Years | 0 (0.0%) | 0 (0.0%) |
| 65 to 74 Years | 0 (0.0%) | 3 (21.4%) |
| 75 Years and over | 5 (15.6%) | 0 (0.0%) |
Disability Class: Ambulatory Difficulty
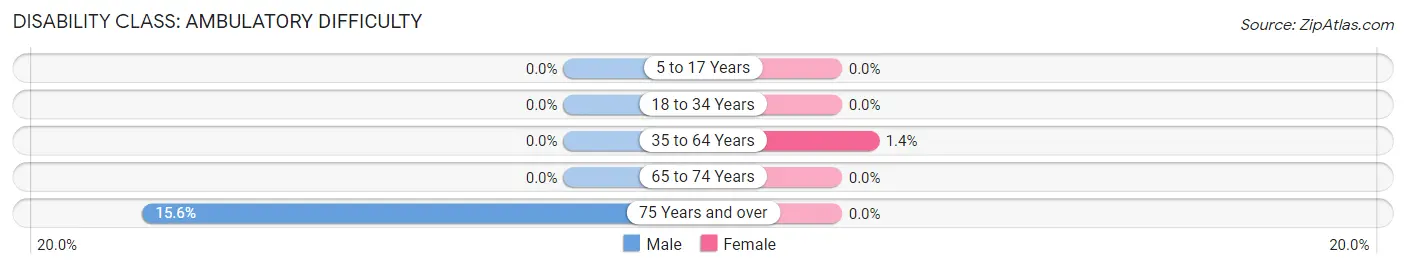
| Age Bracket | Male | Female |
| 5 to 17 Years | 0 (0.0%) | 0 (0.0%) |
| 18 to 34 Years | 0 (0.0%) | 0 (0.0%) |
| 35 to 64 Years | 0 (0.0%) | 1 (1.4%) |
| 65 to 74 Years | 0 (0.0%) | 0 (0.0%) |
| 75 Years and over | 5 (15.6%) | 0 (0.0%) |
Disability Class: Self-Care Difficulty
| Age Bracket | Male | Female |
| 5 to 17 Years | 0 (0.0%) | 0 (0.0%) |
| 18 to 34 Years | 0 (0.0%) | 0 (0.0%) |
| 35 to 64 Years | 0 (0.0%) | 0 (0.0%) |
| 65 to 74 Years | 0 (0.0%) | 0 (0.0%) |
| 75 Years and over | 0 (0.0%) | 0 (0.0%) |
Technology Access in Burnt Ranch
Computing Device Access in Burnt Ranch
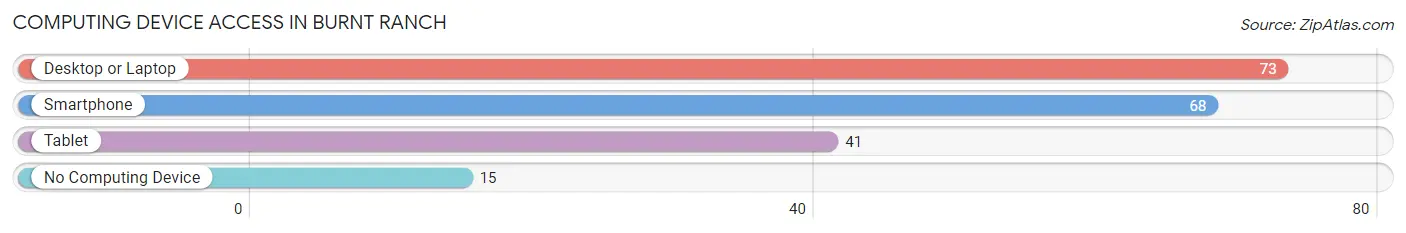
| Device Type | # Households | % Households |
| Desktop or Laptop | 73 | 83.0% |
| Smartphone | 68 | 77.3% |
| Tablet | 41 | 46.6% |
| No Computing Device | 15 | 17.1% |
| Total | 88 | 100.0% |
Internet Access in Burnt Ranch
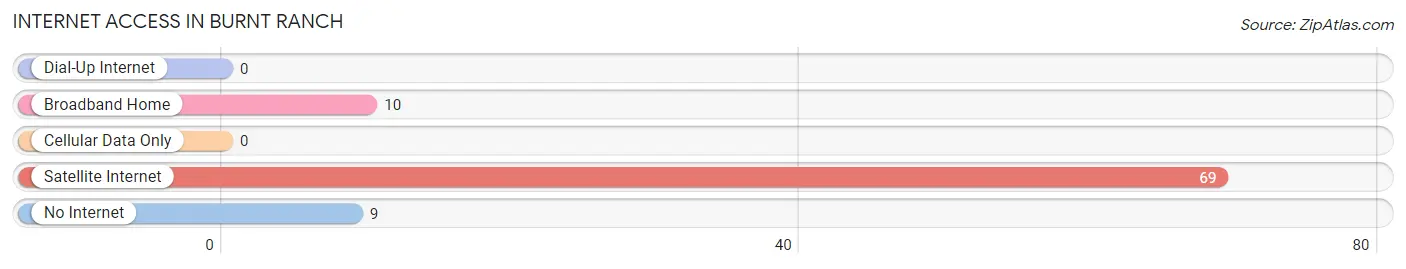
| Internet Type | # Households | % Households |
| Dial-Up Internet | 0 | 0.0% |
| Broadband Home | 10 | 11.4% |
| Cellular Data Only | 0 | 0.0% |
| Satellite Internet | 69 | 78.4% |
| No Internet | 9 | 10.2% |
| Total | 88 | 100.0% |
Burnt Ranch Summary
Burnt Ranch is an unincorporated community located in Trinity County, California. It is situated along State Route 299, approximately 10 miles east of the town of Weaverville. The community is located in the Trinity Alps of the Klamath Mountains, and is surrounded by the Shasta-Trinity National Forest. The population of Burnt Ranch was estimated to be around 200 in 2020.
History
The area now known as Burnt Ranch was originally inhabited by the Wintu people, who lived in the area for thousands of years before the arrival of European settlers. The first European settlers arrived in the area in the 1850s, and the town was established in 1854. The town was named after a nearby ranch that had been burned down by Native Americans.
The town was initially a mining community, with gold being the primary mineral mined in the area. The town also served as a supply center for miners and loggers in the surrounding area. In the late 19th century, the town was home to a number of saloons, hotels, and stores.
In the early 20th century, the town began to decline as the gold mines in the area were depleted. The town was largely abandoned by the 1940s, and the population dwindled to just a few dozen people. In the 1950s, the town began to experience a resurgence as a tourist destination, and the population began to grow again.
Geography
Burnt Ranch is located in the Trinity Alps of the Klamath Mountains, and is surrounded by the Shasta-Trinity National Forest. The town is situated along State Route 299, approximately 10 miles east of the town of Weaverville. The town is located at an elevation of 1,890 feet above sea level.
The climate in Burnt Ranch is classified as Mediterranean, with hot, dry summers and cool, wet winters. The average annual temperature is around 50°F, and the average annual precipitation is around 40 inches.
Economy
The economy of Burnt Ranch is largely based on tourism. The town is a popular destination for outdoor recreation, such as camping, fishing, hiking, and mountain biking. The town is also home to a number of small businesses, including restaurants, stores, and lodges.
Demographics
The population of Burnt Ranch was estimated to be around 200 in 2020. The town is predominantly white, with a small Hispanic population. The median household income in the town is around $45,000, and the median home value is around $200,000. The town has a high rate of homeownership, with around 80% of the population owning their own homes.
Common Questions
What is Per Capita Income in Burnt Ranch?
Per Capita income in Burnt Ranch is $15,540.
What is the Median Family Income in Burnt Ranch?
Median Family Income in Burnt Ranch is $28,516.
What is the Median Household income in Burnt Ranch?
Median Household Income in Burnt Ranch is $55,357.
What is Inequality or Gini Index in Burnt Ranch?
Inequality or Gini Index in Burnt Ranch is 0.38.
What is the Total Population of Burnt Ranch?
Total Population of Burnt Ranch is 228.
What is the Total Male Population of Burnt Ranch?
Total Male Population of Burnt Ranch is 120.
What is the Total Female Population of Burnt Ranch?
Total Female Population of Burnt Ranch is 108.
What is the Ratio of Males per 100 Females in Burnt Ranch?
There are 111.11 Males per 100 Females in Burnt Ranch.
What is the Ratio of Females per 100 Males in Burnt Ranch?
There are 90.00 Females per 100 Males in Burnt Ranch.
What is the Median Population Age in Burnt Ranch?
Median Population Age in Burnt Ranch is 45.7 Years.
What is the Average Family Size in Burnt Ranch
Average Family Size in Burnt Ranch is 2.7 People.
What is the Average Household Size in Burnt Ranch
Average Household Size in Burnt Ranch is 2.6 People.
How Large is the Labor Force in Burnt Ranch?
There are 77 People in the Labor Forcein in Burnt Ranch.
What is the Percentage of People in the Labor Force in Burnt Ranch?
38.5% of People are in the Labor Force in Burnt Ranch.