Zip Codes with the Highest Percentage of Population Employed in Architecture & Engineering in San Diego, CA
RELATED REPORTS & OPTIONS
Architecture & Engineering
San Diego
Compare Zip Codes
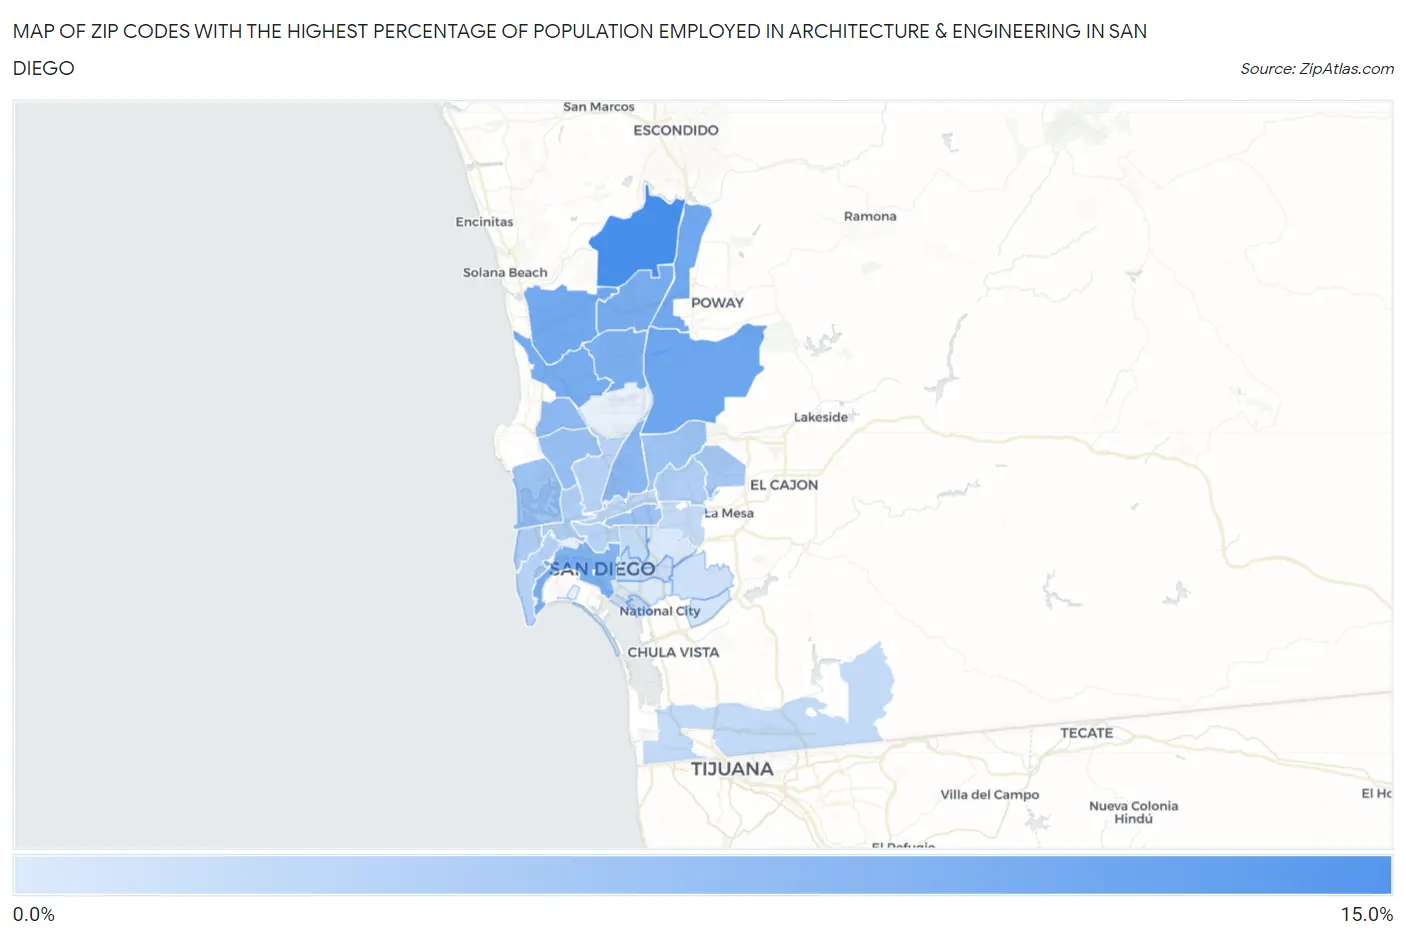
Map of Zip Codes with the Highest Percentage of Population Employed in Architecture & Engineering in San Diego
0.72%
10.8%
Zip Codes with the Highest Percentage of Population Employed in Architecture & Engineering in San Diego, CA
| Zip Code | % Employed | vs State | vs National | |
| 1. | 92127 | 10.8% | 2.6%(+8.25)#25 | 2.1%(+8.66)#293 |
| 2. | 92131 | 8.2% | 2.6%(+5.60)#52 | 2.1%(+6.00)#547 |
| 3. | 92128 | 7.9% | 2.6%(+5.33)#56 | 2.1%(+5.73)#590 |
| 4. | 92130 | 7.8% | 2.6%(+5.22)#57 | 2.1%(+5.63)#614 |
| 5. | 92121 | 7.5% | 2.6%(+4.96)#62 | 2.1%(+5.36)#654 |
| 6. | 92129 | 7.5% | 2.6%(+4.92)#63 | 2.1%(+5.33)#659 |
| 7. | 92126 | 7.1% | 2.6%(+4.50)#73 | 2.1%(+4.90)#739 |
| 8. | 92101 | 6.4% | 2.6%(+3.89)#88 | 2.1%(+4.29)#913 |
| 9. | 92123 | 6.1% | 2.6%(+3.58)#102 | 2.1%(+3.98)#1,025 |
| 10. | 92122 | 5.9% | 2.6%(+3.36)#113 | 2.1%(+3.76)#1,122 |
| 11. | 92117 | 5.2% | 2.6%(+2.63)#149 | 2.1%(+3.04)#1,525 |
| 12. | 92116 | 4.9% | 2.6%(+2.38)#165 | 2.1%(+2.79)#1,703 |
| 13. | 92124 | 4.8% | 2.6%(+2.20)#178 | 2.1%(+2.60)#1,878 |
| 14. | 92109 | 4.7% | 2.6%(+2.19)#179 | 2.1%(+2.60)#1,883 |
| 15. | 92119 | 4.3% | 2.6%(+1.77)#210 | 2.1%(+2.17)#2,347 |
| 16. | 92107 | 3.8% | 2.6%(+1.24)#265 | 2.1%(+1.65)#3,097 |
| 17. | 92120 | 3.6% | 2.6%(+1.08)#295 | 2.1%(+1.48)#3,444 |
| 18. | 92110 | 3.6% | 2.6%(+1.05)#305 | 2.1%(+1.45)#3,511 |
| 19. | 92106 | 3.3% | 2.6%(+0.777)#338 | 2.1%(+1.18)#4,119 |
| 20. | 92111 | 3.1% | 2.6%(+0.579)#369 | 2.1%(+0.984)#4,644 |
| 21. | 92103 | 3.1% | 2.6%(+0.508)#383 | 2.1%(+0.913)#4,845 |
| 22. | 92108 | 2.6% | 2.6%(+0.061)#497 | 2.1%(+0.466)#6,514 |
| 23. | 92154 | 2.4% | 2.6%(-0.130)#547 | 2.1%(+0.275)#7,357 |
| 24. | 92115 | 2.4% | 2.6%(-0.135)#551 | 2.1%(+0.270)#7,388 |
| 25. | 92104 | 2.3% | 2.6%(-0.281)#605 | 2.1%(+0.124)#8,080 |
| 26. | 92136 | 2.2% | 2.6%(-0.318)#616 | 2.1%(+0.087)#8,272 |
| 27. | 92102 | 1.9% | 2.6%(-0.690)#735 | 2.1%(-0.286)#10,464 |
| 28. | 92114 | 1.6% | 2.6%(-0.989)#842 | 2.1%(-0.584)#12,418 |
| 29. | 92139 | 1.4% | 2.6%(-1.19)#904 | 2.1%(-0.786)#13,853 |
| 30. | 92105 | 0.80% | 2.6%(-1.75)#1,124 | 2.1%(-1.35)#18,147 |
| 31. | 92113 | 0.72% | 2.6%(-1.83)#1,145 | 2.1%(-1.42)#18,734 |
1
Common Questions
What are the Top 10 Zip Codes with the Highest Percentage of Population Employed in Architecture & Engineering in San Diego, CA?
Top 10 Zip Codes with the Highest Percentage of Population Employed in Architecture & Engineering in San Diego, CA are:
What zip code has the Highest Percentage of Population Employed in Architecture & Engineering in San Diego, CA?
92127 has the Highest Percentage of Population Employed in Architecture & Engineering in San Diego, CA with 10.8%.
What is the Percentage of Population Employed in Architecture & Engineering in San Diego, CA?
Percentage of Population Employed in Architecture & Engineering in San Diego is 4.3%.
What is the Percentage of Population Employed in Architecture & Engineering in California?
Percentage of Population Employed in Architecture & Engineering in California is 2.6%.
What is the Percentage of Population Employed in Architecture & Engineering in the United States?
Percentage of Population Employed in Architecture & Engineering in the United States is 2.1%.