Zip Codes with the Highest Percentage of Population Employed in Architecture & Engineering in Los Angeles, CA
RELATED REPORTS & OPTIONS
Architecture & Engineering
Los Angeles
Compare Zip Codes
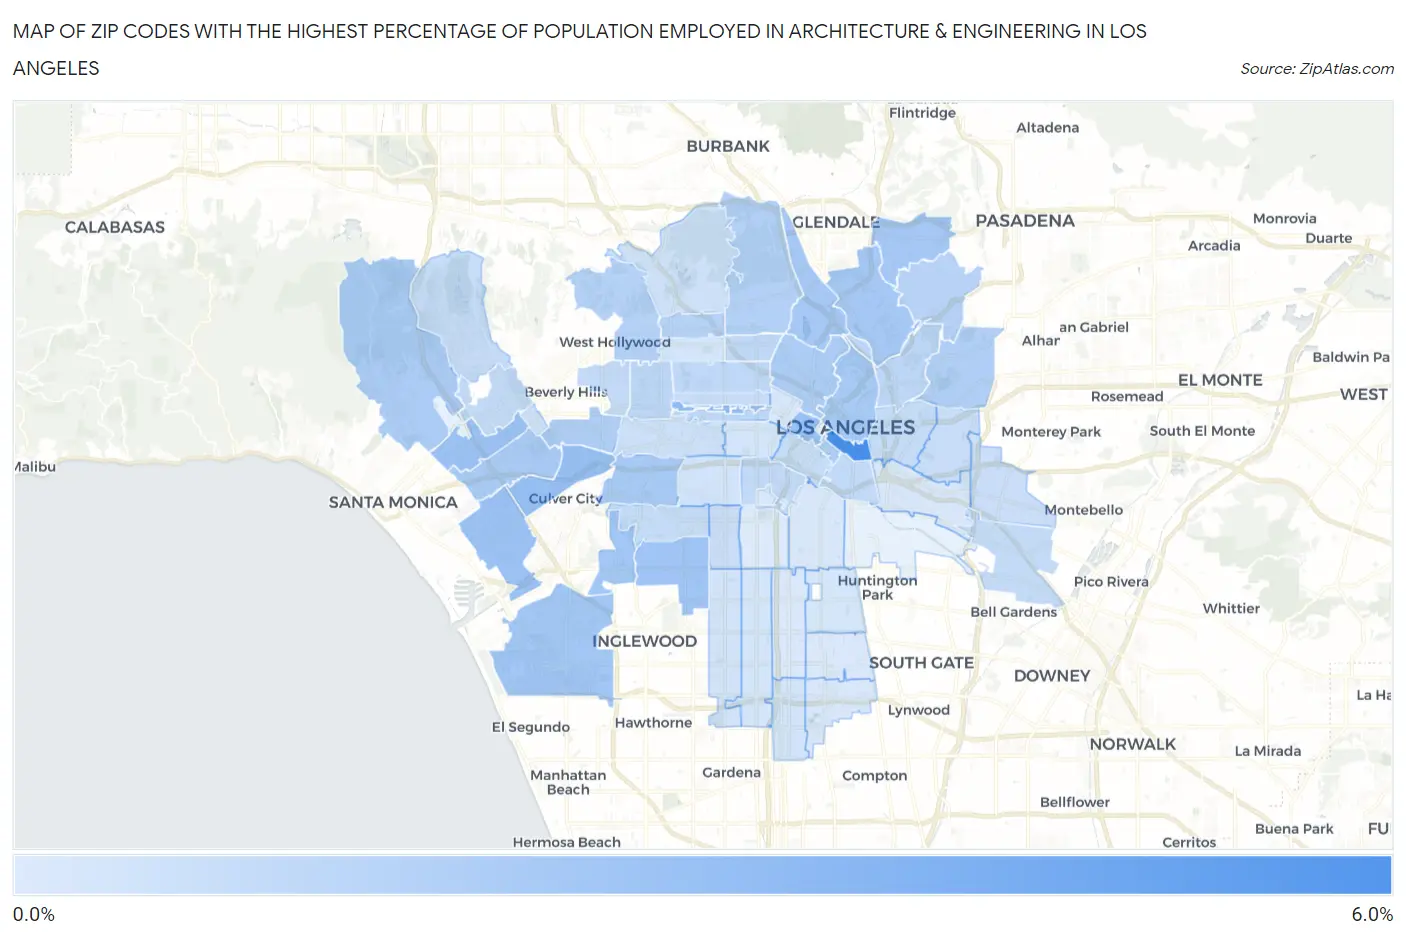
Map of Zip Codes with the Highest Percentage of Population Employed in Architecture & Engineering in Los Angeles
0.18%
5.6%
Zip Codes with the Highest Percentage of Population Employed in Architecture & Engineering in Los Angeles, CA
| Zip Code | % Employed | vs State | vs National | |
| 1. | 90013 | 5.6% | 2.6%(+3.09)#124 | 2.1%(+3.50)#1,251 |
| 2. | 90010 | 2.8% | 2.6%(+0.276)#434 | 2.1%(+0.680)#5,666 |
| 3. | 90017 | 2.6% | 2.6%(+0.094)#485 | 2.1%(+0.499)#6,376 |
| 4. | 90034 | 2.6% | 2.6%(+0.089)#488 | 2.1%(+0.493)#6,398 |
| 5. | 90025 | 2.5% | 2.6%(-0.011)#518 | 2.1%(+0.394)#6,823 |
| 6. | 90066 | 2.5% | 2.6%(-0.028)#520 | 2.1%(+0.377)#6,880 |
| 7. | 90043 | 2.4% | 2.6%(-0.197)#574 | 2.1%(+0.208)#7,686 |
| 8. | 90045 | 2.3% | 2.6%(-0.273)#604 | 2.1%(+0.132)#8,054 |
| 9. | 90056 | 2.2% | 2.6%(-0.317)#615 | 2.1%(+0.088)#8,268 |
| 10. | 90041 | 2.2% | 2.6%(-0.363)#629 | 2.1%(+0.042)#8,518 |
| 11. | 90039 | 2.2% | 2.6%(-0.363)#630 | 2.1%(+0.042)#8,520 |
| 12. | 90065 | 2.2% | 2.6%(-0.366)#633 | 2.1%(+0.038)#8,542 |
| 13. | 90012 | 2.1% | 2.6%(-0.467)#657 | 2.1%(-0.062)#9,120 |
| 14. | 90016 | 2.1% | 2.6%(-0.467)#658 | 2.1%(-0.062)#9,121 |
| 15. | 90064 | 2.0% | 2.6%(-0.567)#691 | 2.1%(-0.163)#9,697 |
| 16. | 90049 | 1.9% | 2.6%(-0.612)#710 | 2.1%(-0.208)#9,970 |
| 17. | 90014 | 1.9% | 2.6%(-0.658)#722 | 2.1%(-0.254)#10,279 |
| 18. | 90026 | 1.9% | 2.6%(-0.677)#733 | 2.1%(-0.273)#10,393 |
| 19. | 90035 | 1.8% | 2.6%(-0.734)#751 | 2.1%(-0.330)#10,716 |
| 20. | 90032 | 1.8% | 2.6%(-0.801)#771 | 2.1%(-0.397)#11,126 |
| 21. | 90027 | 1.6% | 2.6%(-0.916)#812 | 2.1%(-0.511)#11,925 |
| 22. | 90046 | 1.6% | 2.6%(-0.974)#836 | 2.1%(-0.570)#12,308 |
| 23. | 90028 | 1.6% | 2.6%(-0.989)#843 | 2.1%(-0.584)#12,421 |
| 24. | 90042 | 1.5% | 2.6%(-1.08)#871 | 2.1%(-0.676)#13,069 |
| 25. | 90031 | 1.4% | 2.6%(-1.19)#907 | 2.1%(-0.790)#13,885 |
| 26. | 90036 | 1.3% | 2.6%(-1.23)#912 | 2.1%(-0.820)#14,107 |
| 27. | 90005 | 1.3% | 2.6%(-1.23)#916 | 2.1%(-0.826)#14,157 |
| 28. | 90004 | 1.3% | 2.6%(-1.27)#932 | 2.1%(-0.868)#14,444 |
| 29. | 90029 | 1.2% | 2.6%(-1.32)#954 | 2.1%(-0.917)#14,825 |
| 30. | 90021 | 1.2% | 2.6%(-1.37)#968 | 2.1%(-0.968)#15,228 |
| 31. | 90007 | 1.1% | 2.6%(-1.43)#985 | 2.1%(-1.02)#15,623 |
| 32. | 90024 | 1.1% | 2.6%(-1.43)#986 | 2.1%(-1.03)#15,676 |
| 33. | 90048 | 1.1% | 2.6%(-1.46)#1,003 | 2.1%(-1.06)#15,921 |
| 34. | 90040 | 1.1% | 2.6%(-1.50)#1,020 | 2.1%(-1.10)#16,240 |
| 35. | 90033 | 1.0% | 2.6%(-1.51)#1,023 | 2.1%(-1.11)#16,287 |
| 36. | 90015 | 1.0% | 2.6%(-1.52)#1,027 | 2.1%(-1.11)#16,334 |
| 37. | 90008 | 1.0% | 2.6%(-1.53)#1,033 | 2.1%(-1.13)#16,437 |
| 38. | 90077 | 0.94% | 2.6%(-1.62)#1,064 | 2.1%(-1.21)#17,077 |
| 39. | 90020 | 0.93% | 2.6%(-1.62)#1,066 | 2.1%(-1.21)#17,084 |
| 40. | 90063 | 0.91% | 2.6%(-1.64)#1,074 | 2.1%(-1.24)#17,269 |
| 41. | 90022 | 0.85% | 2.6%(-1.71)#1,101 | 2.1%(-1.30)#17,790 |
| 42. | 90062 | 0.81% | 2.6%(-1.74)#1,118 | 2.1%(-1.34)#18,031 |
| 43. | 90019 | 0.79% | 2.6%(-1.76)#1,127 | 2.1%(-1.36)#18,173 |
| 44. | 90067 | 0.77% | 2.6%(-1.78)#1,132 | 2.1%(-1.37)#18,328 |
| 45. | 90068 | 0.70% | 2.6%(-1.85)#1,148 | 2.1%(-1.45)#18,878 |
| 46. | 90061 | 0.63% | 2.6%(-1.92)#1,177 | 2.1%(-1.52)#19,371 |
| 47. | 90047 | 0.62% | 2.6%(-1.93)#1,181 | 2.1%(-1.52)#19,442 |
| 48. | 90018 | 0.60% | 2.6%(-1.96)#1,191 | 2.1%(-1.55)#19,644 |
| 49. | 90006 | 0.53% | 2.6%(-2.03)#1,209 | 2.1%(-1.62)#20,096 |
| 50. | 90044 | 0.51% | 2.6%(-2.05)#1,213 | 2.1%(-1.64)#20,246 |
| 51. | 90038 | 0.49% | 2.6%(-2.06)#1,221 | 2.1%(-1.66)#20,330 |
| 52. | 90089 | 0.40% | 2.6%(-2.15)#1,244 | 2.1%(-1.75)#20,949 |
| 53. | 90001 | 0.40% | 2.6%(-2.16)#1,247 | 2.1%(-1.75)#20,962 |
| 54. | 90059 | 0.38% | 2.6%(-2.17)#1,256 | 2.1%(-1.77)#21,069 |
| 55. | 90011 | 0.36% | 2.6%(-2.20)#1,264 | 2.1%(-1.79)#21,242 |
| 56. | 90023 | 0.34% | 2.6%(-2.22)#1,269 | 2.1%(-1.81)#21,360 |
| 57. | 90057 | 0.34% | 2.6%(-2.22)#1,270 | 2.1%(-1.81)#21,361 |
| 58. | 90002 | 0.28% | 2.6%(-2.27)#1,281 | 2.1%(-1.87)#21,657 |
| 59. | 90003 | 0.27% | 2.6%(-2.29)#1,285 | 2.1%(-1.88)#21,738 |
| 60. | 90037 | 0.18% | 2.6%(-2.37)#1,301 | 2.1%(-1.97)#22,120 |
1
Common Questions
What are the Top 10 Zip Codes with the Highest Percentage of Population Employed in Architecture & Engineering in Los Angeles, CA?
Top 10 Zip Codes with the Highest Percentage of Population Employed in Architecture & Engineering in Los Angeles, CA are:
What zip code has the Highest Percentage of Population Employed in Architecture & Engineering in Los Angeles, CA?
90013 has the Highest Percentage of Population Employed in Architecture & Engineering in Los Angeles, CA with 5.6%.
What is the Percentage of Population Employed in Architecture & Engineering in Los Angeles, CA?
Percentage of Population Employed in Architecture & Engineering in Los Angeles is 1.5%.
What is the Percentage of Population Employed in Architecture & Engineering in California?
Percentage of Population Employed in Architecture & Engineering in California is 2.6%.
What is the Percentage of Population Employed in Architecture & Engineering in the United States?
Percentage of Population Employed in Architecture & Engineering in the United States is 2.1%.