Cities with the Highest Percentage of Population Employed in Architecture & Engineering in New Jersey
RELATED REPORTS & OPTIONS
Architecture & Engineering
New Jersey
Compare Cities
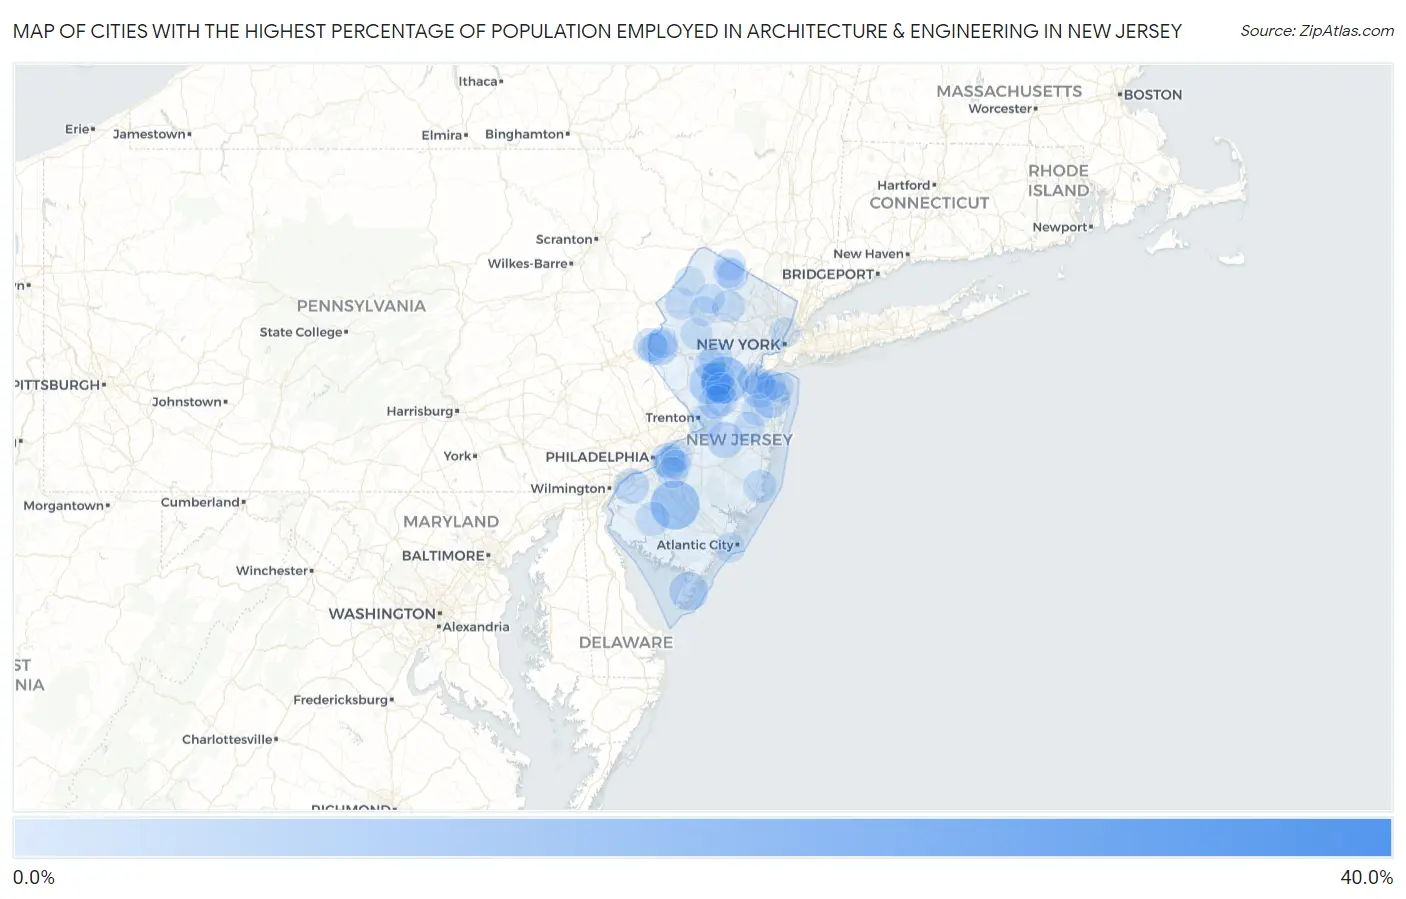
Map of Cities with the Highest Percentage of Population Employed in Architecture & Engineering in New Jersey
0.0%
40.0%
Cities with the Highest Percentage of Population Employed in Architecture & Engineering in New Jersey
| City | % Employed | vs State | vs National | |
| 1. | Nesco | 38.2% | 1.9%(+36.3)#1 | 2.1%(+36.1)#40 |
| 2. | Victory Lakes | 14.4% | 1.9%(+12.5)#2 | 2.1%(+12.2)#246 |
| 3. | Silver Lake Cdp Warren County | 13.9% | 1.9%(+12.0)#3 | 2.1%(+11.8)#267 |
| 4. | Six Mile Run | 13.0% | 1.9%(+11.1)#4 | 2.1%(+10.9)#302 |
| 5. | Pine Brook | 12.0% | 1.9%(+10.1)#5 | 2.1%(+9.82)#355 |
| 6. | Monroe Manor | 11.6% | 1.9%(+9.72)#6 | 2.1%(+9.46)#382 |
| 7. | Washington Crossing | 10.9% | 1.9%(+9.02)#7 | 2.1%(+8.76)#428 |
| 8. | Forsgate | 10.4% | 1.9%(+8.49)#8 | 2.1%(+8.24)#463 |
| 9. | Harlingen | 9.8% | 1.9%(+7.93)#9 | 2.1%(+7.68)#512 |
| 10. | Jobstown | 9.0% | 1.9%(+7.06)#10 | 2.1%(+6.81)#582 |
| 11. | Layton | 8.6% | 1.9%(+6.72)#11 | 2.1%(+6.46)#622 |
| 12. | Burleigh | 8.3% | 1.9%(+6.38)#12 | 2.1%(+6.13)#668 |
| 13. | Lincroft | 8.1% | 1.9%(+6.18)#13 | 2.1%(+5.92)#708 |
| 14. | Cranford | 7.4% | 1.9%(+5.51)#14 | 2.1%(+5.25)#825 |
| 15. | New Egypt | 6.9% | 1.9%(+5.02)#15 | 2.1%(+4.77)#954 |
| 16. | Stewartsville | 6.6% | 1.9%(+4.72)#16 | 2.1%(+4.46)#1,018 |
| 17. | Strathmore | 6.6% | 1.9%(+4.71)#17 | 2.1%(+4.45)#1,023 |
| 18. | Beckett | 6.5% | 1.9%(+4.65)#18 | 2.1%(+4.39)#1,038 |
| 19. | Marlboro | 6.5% | 1.9%(+4.56)#19 | 2.1%(+4.30)#1,063 |
| 20. | Bay Head Borough | 6.4% | 1.9%(+4.55)#20 | 2.1%(+4.30)#1,067 |
| 21. | Ship Bottom Borough | 6.0% | 1.9%(+4.06)#21 | 2.1%(+3.80)#1,265 |
| 22. | Griggstown | 5.8% | 1.9%(+3.93)#22 | 2.1%(+3.68)#1,329 |
| 23. | Golden Triangle | 5.8% | 1.9%(+3.93)#23 | 2.1%(+3.67)#1,331 |
| 24. | South Dennis | 5.7% | 1.9%(+3.85)#24 | 2.1%(+3.60)#1,366 |
| 25. | Blackwells Mills | 5.7% | 1.9%(+3.82)#25 | 2.1%(+3.56)#1,390 |
| 26. | White Horse | 5.7% | 1.9%(+3.81)#26 | 2.1%(+3.56)#1,392 |
| 27. | Dunellen Borough | 5.7% | 1.9%(+3.79)#27 | 2.1%(+3.53)#1,404 |
| 28. | Olivet | 5.6% | 1.9%(+3.75)#28 | 2.1%(+3.50)#1,418 |
| 29. | Neshanic Station | 5.6% | 1.9%(+3.74)#29 | 2.1%(+3.49)#1,424 |
| 30. | Springfield | 5.6% | 1.9%(+3.72)#30 | 2.1%(+3.47)#1,436 |
| 31. | Newtonville | 5.6% | 1.9%(+3.66)#31 | 2.1%(+3.41)#1,470 |
| 32. | Delaware Park | 5.4% | 1.9%(+3.48)#32 | 2.1%(+3.22)#1,577 |
| 33. | Avon By The Sea Borough | 5.3% | 1.9%(+3.42)#33 | 2.1%(+3.17)#1,618 |
| 34. | Princeton Junction | 5.3% | 1.9%(+3.42)#34 | 2.1%(+3.16)#1,619 |
| 35. | Green Knoll | 5.3% | 1.9%(+3.42)#35 | 2.1%(+3.16)#1,620 |
| 36. | Barnegat | 5.3% | 1.9%(+3.38)#36 | 2.1%(+3.13)#1,639 |
| 37. | Ellisburg | 5.2% | 1.9%(+3.33)#37 | 2.1%(+3.07)#1,680 |
| 38. | Wood Ridge Borough | 5.2% | 1.9%(+3.33)#38 | 2.1%(+3.07)#1,682 |
| 39. | West Wildwood Borough | 5.2% | 1.9%(+3.27)#39 | 2.1%(+3.01)#1,726 |
| 40. | Bridgewater Center | 5.1% | 1.9%(+3.25)#40 | 2.1%(+2.99)#1,742 |
| 41. | Seaside Heights Borough | 5.1% | 1.9%(+3.24)#41 | 2.1%(+2.98)#1,744 |
| 42. | Troy Hills | 5.1% | 1.9%(+3.17)#42 | 2.1%(+2.91)#1,791 |
| 43. | Princeton Meadows | 5.0% | 1.9%(+3.15)#43 | 2.1%(+2.90)#1,801 |
| 44. | Farmingdale Borough | 4.9% | 1.9%(+2.99)#44 | 2.1%(+2.73)#1,912 |
| 45. | Pleasantdale | 4.8% | 1.9%(+2.94)#45 | 2.1%(+2.68)#1,962 |
| 46. | Lake Telemark | 4.8% | 1.9%(+2.91)#46 | 2.1%(+2.65)#1,981 |
| 47. | Union | 4.6% | 1.9%(+2.73)#47 | 2.1%(+2.47)#2,125 |
| 48. | Moorestown Lenola | 4.6% | 1.9%(+2.70)#48 | 2.1%(+2.45)#2,146 |
| 49. | Riverton Borough | 4.6% | 1.9%(+2.69)#49 | 2.1%(+2.43)#2,157 |
| 50. | Bloomsbury Borough | 4.6% | 1.9%(+2.67)#50 | 2.1%(+2.42)#2,166 |
| 51. | Bradley Gardens | 4.5% | 1.9%(+2.65)#51 | 2.1%(+2.39)#2,197 |
| 52. | Marksboro | 4.4% | 1.9%(+2.52)#52 | 2.1%(+2.26)#2,299 |
| 53. | Netcong Borough | 4.4% | 1.9%(+2.51)#53 | 2.1%(+2.25)#2,308 |
| 54. | Carlls Corner | 4.4% | 1.9%(+2.49)#54 | 2.1%(+2.23)#2,332 |
| 55. | Long Valley | 4.4% | 1.9%(+2.47)#55 | 2.1%(+2.22)#2,345 |
| 56. | North Arlington Borough | 4.2% | 1.9%(+2.36)#56 | 2.1%(+2.10)#2,460 |
| 57. | Highland Lakes | 4.2% | 1.9%(+2.33)#57 | 2.1%(+2.07)#2,492 |
| 58. | Mickleton | 4.2% | 1.9%(+2.31)#58 | 2.1%(+2.05)#2,524 |
| 59. | South Amboy | 4.2% | 1.9%(+2.30)#59 | 2.1%(+2.05)#2,528 |
| 60. | Echelon | 4.2% | 1.9%(+2.26)#60 | 2.1%(+2.01)#2,585 |
| 61. | East Freehold | 4.2% | 1.9%(+2.26)#61 | 2.1%(+2.00)#2,586 |
| 62. | Kendall Park | 4.1% | 1.9%(+2.23)#62 | 2.1%(+1.97)#2,620 |
| 63. | Upper Pohatcong | 4.1% | 1.9%(+2.23)#63 | 2.1%(+1.97)#2,625 |
| 64. | Roseland Borough | 4.1% | 1.9%(+2.22)#64 | 2.1%(+1.97)#2,629 |
| 65. | Vista Center | 4.1% | 1.9%(+2.22)#65 | 2.1%(+1.96)#2,637 |
| 66. | Cookstown | 4.1% | 1.9%(+2.21)#66 | 2.1%(+1.95)#2,645 |
| 67. | Vernon Valley | 4.1% | 1.9%(+2.18)#67 | 2.1%(+1.92)#2,684 |
| 68. | Tinton Falls Borough | 4.0% | 1.9%(+2.15)#68 | 2.1%(+1.90)#2,720 |
| 69. | Morris Plains Borough | 4.0% | 1.9%(+2.14)#69 | 2.1%(+1.89)#2,734 |
| 70. | Parsippany | 4.0% | 1.9%(+2.14)#70 | 2.1%(+1.88)#2,742 |
| 71. | New Village | 4.0% | 1.9%(+2.13)#71 | 2.1%(+1.87)#2,754 |
| 72. | Manasquan Borough | 3.9% | 1.9%(+2.02)#72 | 2.1%(+1.76)#2,885 |
| 73. | Llewellyn Park | 3.9% | 1.9%(+2.01)#73 | 2.1%(+1.75)#2,896 |
| 74. | Vernon Center | 3.9% | 1.9%(+1.97)#74 | 2.1%(+1.71)#2,945 |
| 75. | Old Tappan Borough | 3.7% | 1.9%(+1.85)#75 | 2.1%(+1.59)#3,103 |
| 76. | Silver Lake | 3.7% | 1.9%(+1.85)#76 | 2.1%(+1.59)#3,104 |
| 77. | Flanders | 3.7% | 1.9%(+1.80)#77 | 2.1%(+1.54)#3,184 |
| 78. | Oradell Borough | 3.7% | 1.9%(+1.79)#78 | 2.1%(+1.54)#3,201 |
| 79. | Midland Park Borough | 3.7% | 1.9%(+1.79)#79 | 2.1%(+1.54)#3,202 |
| 80. | River Edge Borough | 3.7% | 1.9%(+1.77)#80 | 2.1%(+1.51)#3,246 |
| 81. | East Vineland | 3.6% | 1.9%(+1.75)#81 | 2.1%(+1.50)#3,274 |
| 82. | Guttenberg | 3.6% | 1.9%(+1.75)#82 | 2.1%(+1.49)#3,279 |
| 83. | Spring Lake Heights Borough | 3.6% | 1.9%(+1.72)#83 | 2.1%(+1.46)#3,325 |
| 84. | Ogdensburg Borough | 3.5% | 1.9%(+1.64)#84 | 2.1%(+1.38)#3,471 |
| 85. | Cliffwood Beach | 3.5% | 1.9%(+1.63)#85 | 2.1%(+1.37)#3,492 |
| 86. | Ventnor City | 3.4% | 1.9%(+1.56)#86 | 2.1%(+1.30)#3,607 |
| 87. | Tenafly Borough | 3.4% | 1.9%(+1.55)#87 | 2.1%(+1.30)#3,633 |
| 88. | Middlesex Borough | 3.4% | 1.9%(+1.54)#88 | 2.1%(+1.29)#3,649 |
| 89. | Edgewater Borough | 3.4% | 1.9%(+1.53)#89 | 2.1%(+1.28)#3,672 |
| 90. | Crandon Lakes | 3.4% | 1.9%(+1.53)#90 | 2.1%(+1.27)#3,678 |
| 91. | Greentree | 3.4% | 1.9%(+1.52)#91 | 2.1%(+1.27)#3,693 |
| 92. | Garwood Borough | 3.4% | 1.9%(+1.51)#92 | 2.1%(+1.25)#3,709 |
| 93. | Lake Hopatcong | 3.4% | 1.9%(+1.51)#93 | 2.1%(+1.25)#3,715 |
| 94. | Leonardo | 3.4% | 1.9%(+1.50)#94 | 2.1%(+1.25)#3,717 |
| 95. | Lyons | 3.4% | 1.9%(+1.49)#95 | 2.1%(+1.24)#3,747 |
| 96. | Oak Ridge | 3.4% | 1.9%(+1.49)#96 | 2.1%(+1.23)#3,753 |
| 97. | Grenloch | 3.4% | 1.9%(+1.47)#97 | 2.1%(+1.21)#3,805 |
| 98. | North Middletown | 3.4% | 1.9%(+1.46)#98 | 2.1%(+1.20)#3,815 |
| 99. | Byram Center | 3.4% | 1.9%(+1.46)#99 | 2.1%(+1.20)#3,818 |
| 100. | Lake Mohawk | 3.4% | 1.9%(+1.46)#100 | 2.1%(+1.20)#3,821 |
Common Questions
What are the Top 10 Cities with the Highest Percentage of Population Employed in Architecture & Engineering in New Jersey?
Top 10 Cities with the Highest Percentage of Population Employed in Architecture & Engineering in New Jersey are:
#1
14.4%
#2
13.0%
#3
9.8%
#4
8.3%
#5
8.1%
#6
6.9%
#7
6.6%
#8
6.6%
#9
6.5%
#10
5.8%
What city has the Highest Percentage of Population Employed in Architecture & Engineering in New Jersey?
Victory Lakes has the Highest Percentage of Population Employed in Architecture & Engineering in New Jersey with 14.4%.
What is the Percentage of Population Employed in Architecture & Engineering in the State of New Jersey?
Percentage of Population Employed in Architecture & Engineering in New Jersey is 1.9%.
What is the Percentage of Population Employed in Architecture & Engineering in the United States?
Percentage of Population Employed in Architecture & Engineering in the United States is 2.1%.