Zip Codes with the Highest Percentage of Population Employed in Architecture & Engineering in Santa Barbara, CA
RELATED REPORTS & OPTIONS
Architecture & Engineering
Santa Barbara
Compare Zip Codes
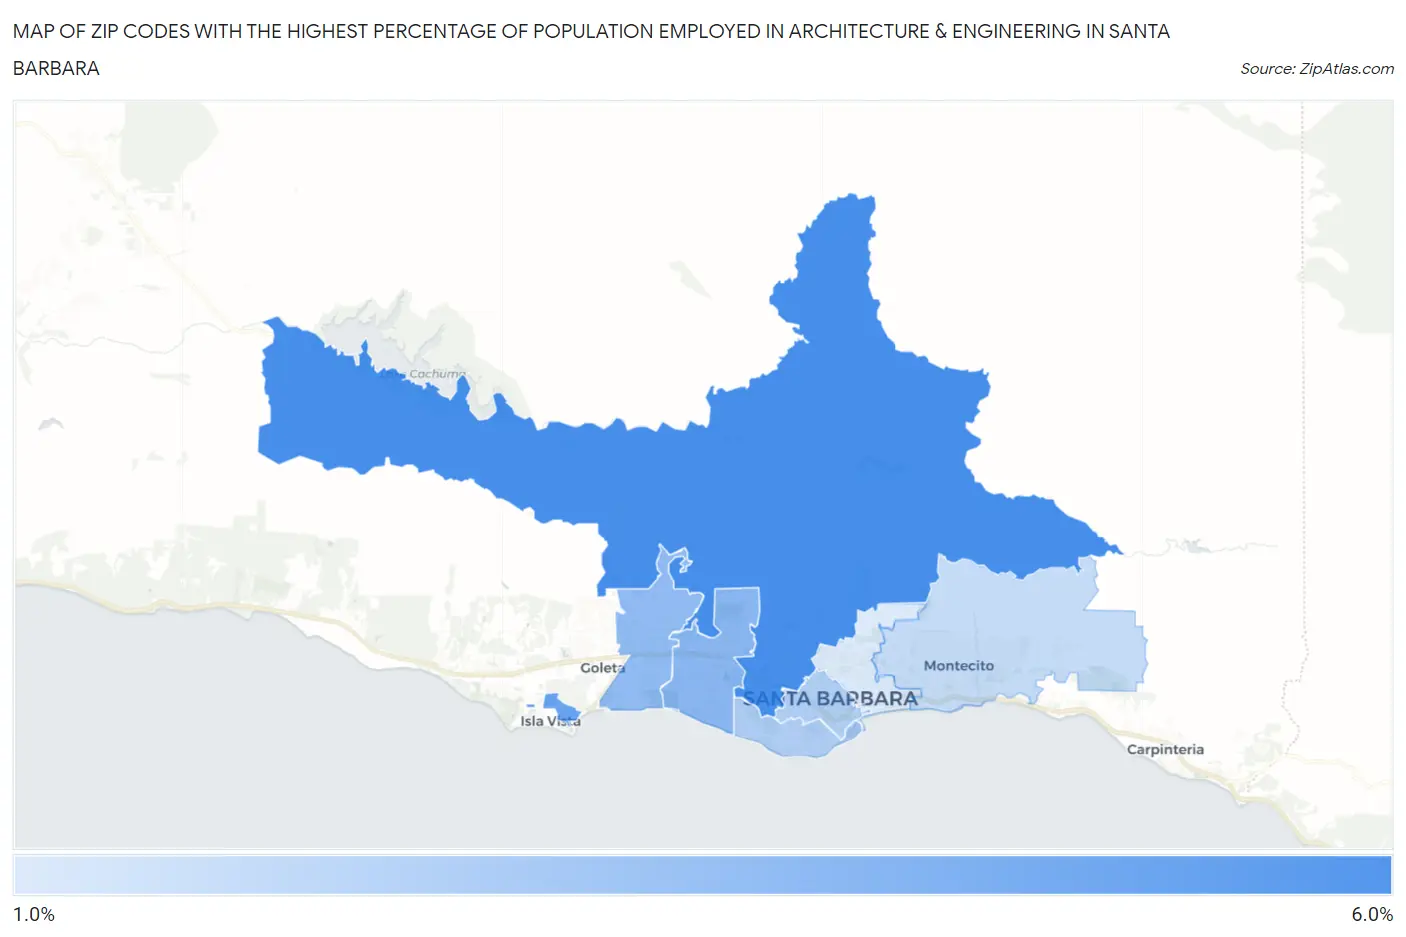
Map of Zip Codes with the Highest Percentage of Population Employed in Architecture & Engineering in Santa Barbara
1.8%
5.2%
Zip Codes with the Highest Percentage of Population Employed in Architecture & Engineering in Santa Barbara, CA
| Zip Code | % Employed | vs State | vs National | |
| 1. | 93105 | 5.2% | 2.6%(+2.65)#147 | 2.1%(+3.05)#1,515 |
| 2. | 93106 | 4.4% | 2.6%(+1.85)#202 | 2.1%(+2.26)#2,247 |
| 3. | 93110 | 3.7% | 2.6%(+1.14)#282 | 2.1%(+1.54)#3,308 |
| 4. | 93111 | 3.5% | 2.6%(+0.985)#310 | 2.1%(+1.39)#3,640 |
| 5. | 93109 | 2.9% | 2.6%(+0.318)#418 | 2.1%(+0.723)#5,522 |
| 6. | 93101 | 2.8% | 2.6%(+0.259)#440 | 2.1%(+0.663)#5,750 |
| 7. | 93108 | 2.4% | 2.6%(-0.203)#578 | 2.1%(+0.202)#7,713 |
| 8. | 93103 | 1.8% | 2.6%(-0.736)#752 | 2.1%(-0.331)#10,722 |
1
Common Questions
What are the Top 5 Zip Codes with the Highest Percentage of Population Employed in Architecture & Engineering in Santa Barbara, CA?
Top 5 Zip Codes with the Highest Percentage of Population Employed in Architecture & Engineering in Santa Barbara, CA are:
What zip code has the Highest Percentage of Population Employed in Architecture & Engineering in Santa Barbara, CA?
93105 has the Highest Percentage of Population Employed in Architecture & Engineering in Santa Barbara, CA with 5.2%.
What is the Percentage of Population Employed in Architecture & Engineering in Santa Barbara, CA?
Percentage of Population Employed in Architecture & Engineering in Santa Barbara is 3.3%.
What is the Percentage of Population Employed in Architecture & Engineering in California?
Percentage of Population Employed in Architecture & Engineering in California is 2.6%.
What is the Percentage of Population Employed in Architecture & Engineering in the United States?
Percentage of Population Employed in Architecture & Engineering in the United States is 2.1%.