Castle Hill, CA Map & Demographics
Castle Hill Map
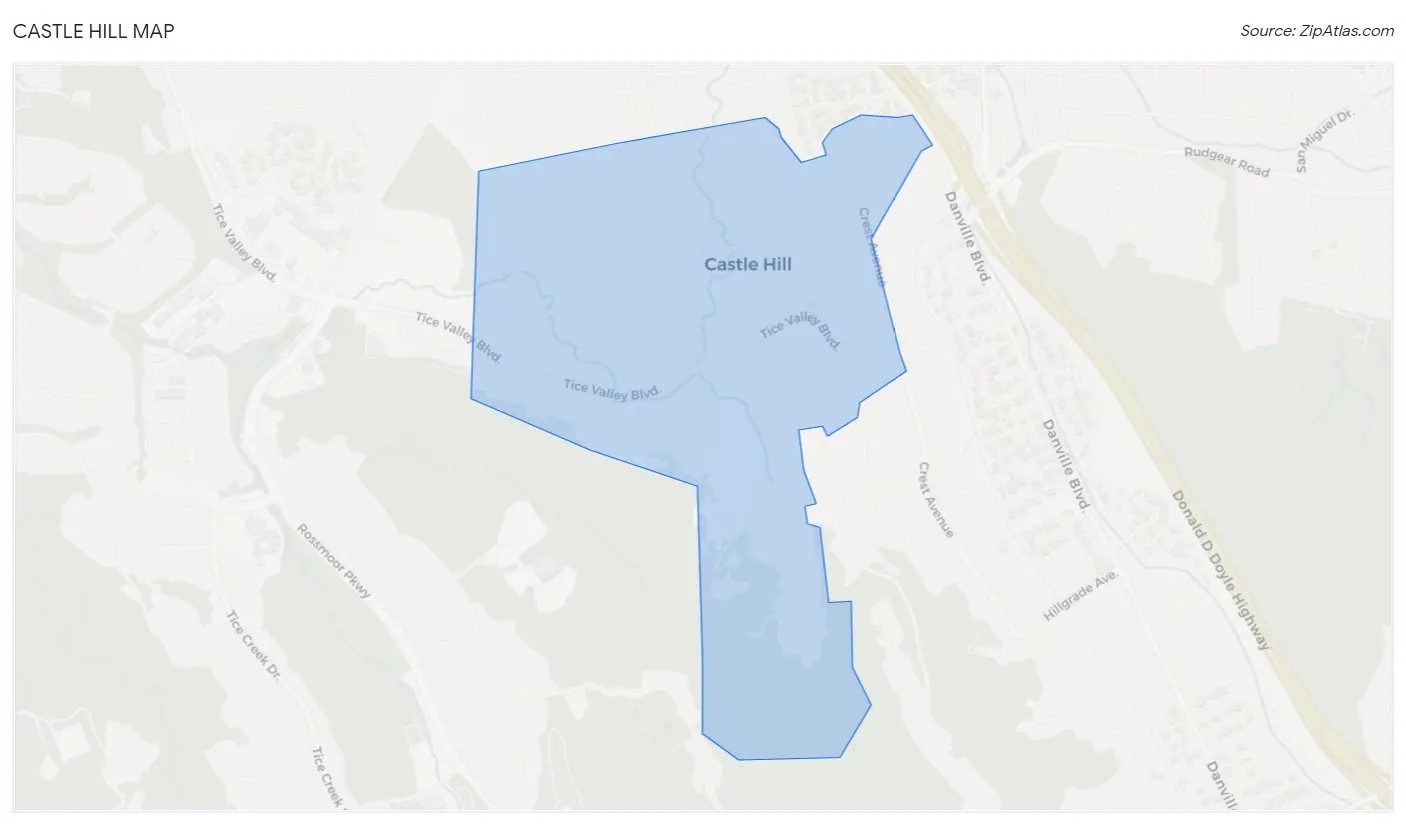
Castle Hill Overview
$100,270
PER CAPITA INCOME
$250,001
AVG FAMILY INCOME
$233,879
AVG HOUSEHOLD INCOME
14.9%
WAGE / INCOME GAP [ % ]
85.1¢/ $1
WAGE / INCOME GAP [ $ ]
0.31
INEQUALITY / GINI INDEX
1,010
TOTAL POPULATION
460
MALE POPULATION
550
FEMALE POPULATION
83.64
MALES / 100 FEMALES
119.57
FEMALES / 100 MALES
43.2
MEDIAN AGE
3.1
AVG FAMILY SIZE
2.6
AVG HOUSEHOLD SIZE
443
LABOR FORCE [ PEOPLE ]
62.2%
PERCENT IN LABOR FORCE
Income in Castle Hill
Income Overview in Castle Hill
Per Capita Income in Castle Hill is $100,270, while median incomes of families and households are $250,001 and $233,879 respectively.
| Characteristic | Number | Measure |
| Per Capita Income | 1,010 | $100,270 |
| Median Family Income | 301 | $250,001 |
| Mean Family Income | 301 | $297,636 |
| Median Household Income | 380 | $233,879 |
| Mean Household Income | 380 | $270,330 |
| Income Deficit | 301 | $0 |
| Wage / Income Gap (%) | 1,010 | 14.90% |
| Wage / Income Gap ($) | 1,010 | 85.10¢ per $1 |
| Gini / Inequality Index | 1,010 | 0.31 |
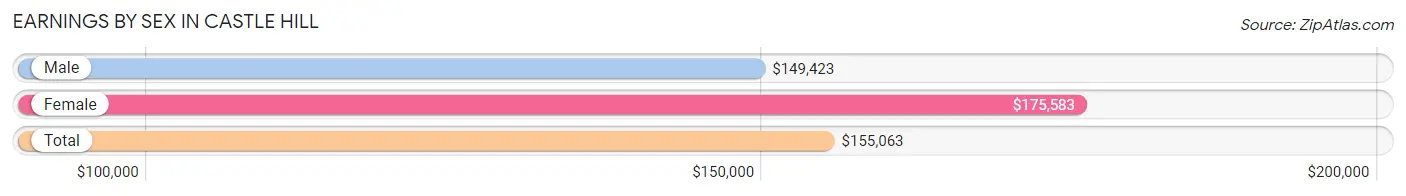
Earnings by Sex in Castle Hill
Average Earnings in Castle Hill are $155,063, $149,423 for men and $175,583 for women, a difference of 14.9%.
| Sex | Number | Average Earnings |
| Male | 226 (47.4%) | $149,423 |
| Female | 251 (52.6%) | $175,583 |
| Total | 477 (100.0%) | $155,063 |
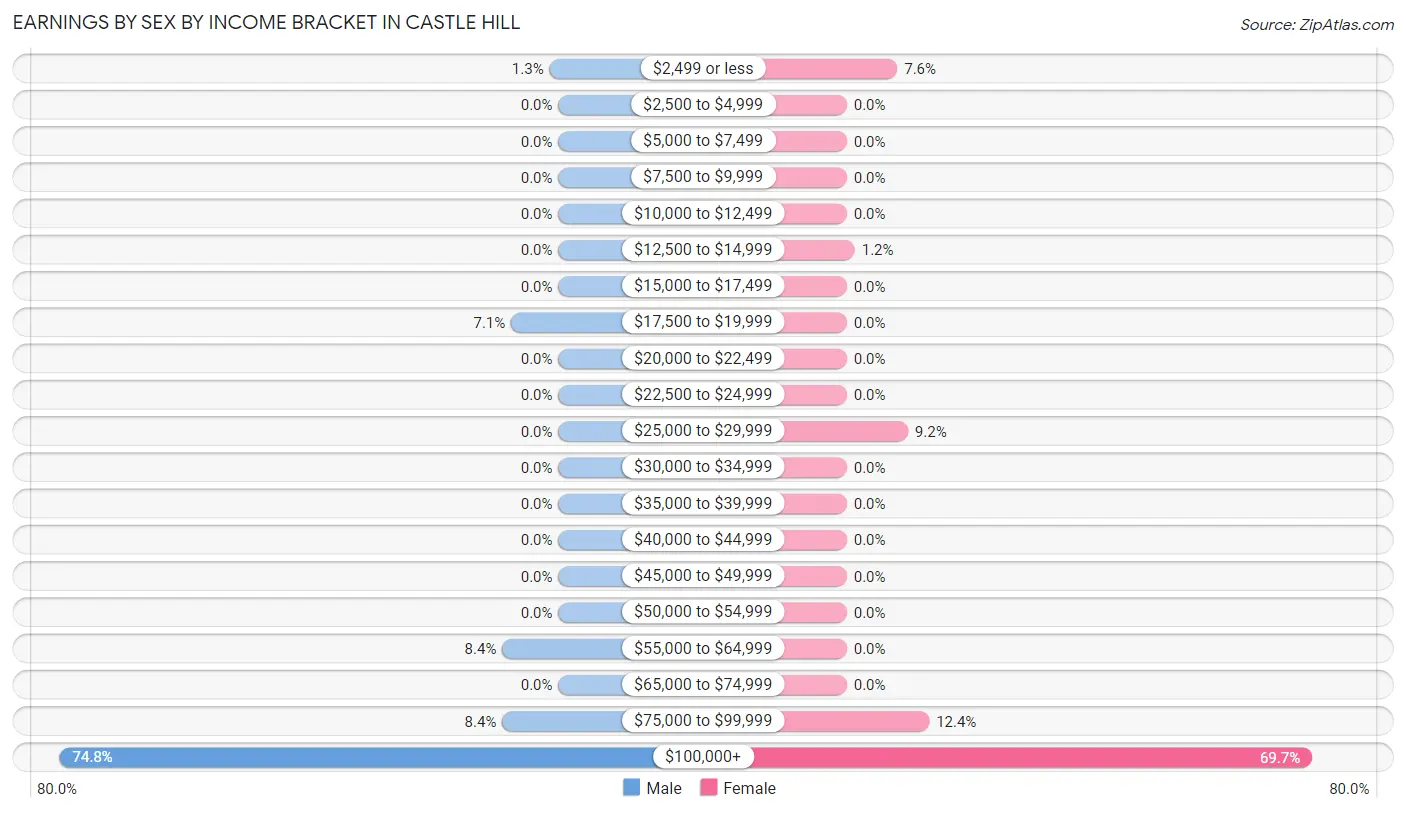
Earnings by Sex by Income Bracket in Castle Hill
The most common earnings brackets in Castle Hill are $100,000+ for men (169 | 74.8%) and $100,000+ for women (175 | 69.7%).
| Income | Male | Female |
| $2,499 or less | 3 (1.3%) | 19 (7.6%) |
| $2,500 to $4,999 | 0 (0.0%) | 0 (0.0%) |
| $5,000 to $7,499 | 0 (0.0%) | 0 (0.0%) |
| $7,500 to $9,999 | 0 (0.0%) | 0 (0.0%) |
| $10,000 to $12,499 | 0 (0.0%) | 0 (0.0%) |
| $12,500 to $14,999 | 0 (0.0%) | 3 (1.2%) |
| $15,000 to $17,499 | 0 (0.0%) | 0 (0.0%) |
| $17,500 to $19,999 | 16 (7.1%) | 0 (0.0%) |
| $20,000 to $22,499 | 0 (0.0%) | 0 (0.0%) |
| $22,500 to $24,999 | 0 (0.0%) | 0 (0.0%) |
| $25,000 to $29,999 | 0 (0.0%) | 23 (9.2%) |
| $30,000 to $34,999 | 0 (0.0%) | 0 (0.0%) |
| $35,000 to $39,999 | 0 (0.0%) | 0 (0.0%) |
| $40,000 to $44,999 | 0 (0.0%) | 0 (0.0%) |
| $45,000 to $49,999 | 0 (0.0%) | 0 (0.0%) |
| $50,000 to $54,999 | 0 (0.0%) | 0 (0.0%) |
| $55,000 to $64,999 | 19 (8.4%) | 0 (0.0%) |
| $65,000 to $74,999 | 0 (0.0%) | 0 (0.0%) |
| $75,000 to $99,999 | 19 (8.4%) | 31 (12.3%) |
| $100,000+ | 169 (74.8%) | 175 (69.7%) |
| Total | 226 (100.0%) | 251 (100.0%) |
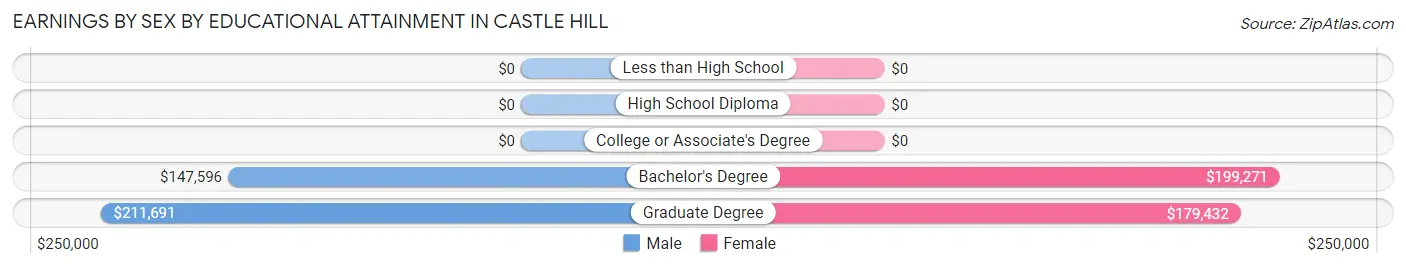
Earnings by Sex by Educational Attainment in Castle Hill
Average earnings in Castle Hill are $149,712 for men and $177,841 for women, a difference of 15.8%. Men with an educational attainment of graduate degree enjoy the highest average annual earnings of $211,691, while those with bachelor's degree education earn the least with $147,596. Women with an educational attainment of bachelor's degree earn the most with the average annual earnings of $199,271, while those with graduate degree education have the smallest earnings of $179,432.
| Educational Attainment | Male Income | Female Income |
| Less than High School | - | - |
| High School Diploma | - | - |
| College or Associate's Degree | - | - |
| Bachelor's Degree | $147,596 | $199,271 |
| Graduate Degree | $211,691 | $179,432 |
| Total | $149,712 | $177,841 |
Family Income in Castle Hill
Family Income Brackets in Castle Hill
According to the Castle Hill family income data, there are 221 families falling into the $200,000+ income range, which is the most common income bracket and makes up 73.4% of all families.
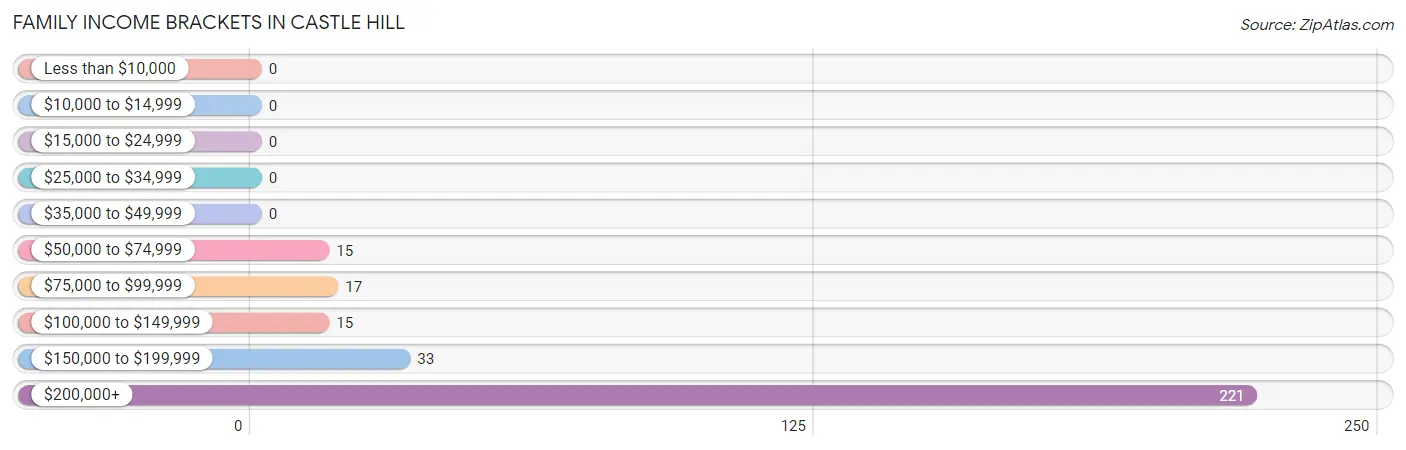
| Income Bracket | # Families | % Families |
| Less than $10,000 | 0 | 0.0% |
| $10,000 to $14,999 | 0 | 0.0% |
| $15,000 to $24,999 | 0 | 0.0% |
| $25,000 to $34,999 | 0 | 0.0% |
| $35,000 to $49,999 | 0 | 0.0% |
| $50,000 to $74,999 | 15 | 5.0% |
| $75,000 to $99,999 | 17 | 5.6% |
| $100,000 to $149,999 | 15 | 5.0% |
| $150,000 to $199,999 | 33 | 11.0% |
| $200,000+ | 221 | 73.4% |
Family Income by Famaliy Size in Castle Hill
4-person families (148 | 49.2%) account for the highest median family income in Castle Hill with $250,001 per family, while 2-person families (111 | 36.9%) have the highest median income of $98,125 per family member.
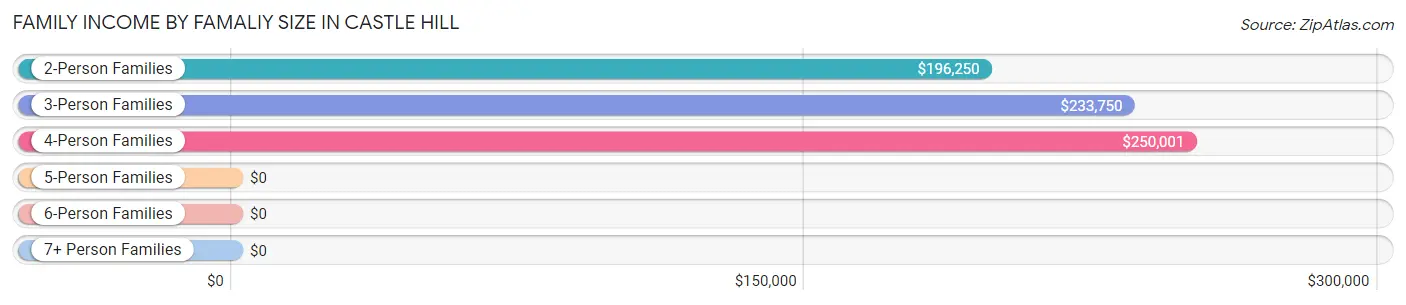
| Income Bracket | # Families | Median Income |
| 2-Person Families | 111 (36.9%) | $196,250 |
| 3-Person Families | 42 (14.0%) | $233,750 |
| 4-Person Families | 148 (49.2%) | $250,001 |
| 5-Person Families | 0 (0.0%) | $0 |
| 6-Person Families | 0 (0.0%) | $0 |
| 7+ Person Families | 0 (0.0%) | $0 |
| Total | 301 (100.0%) | $250,001 |
Family Income by Number of Earners in Castle Hill
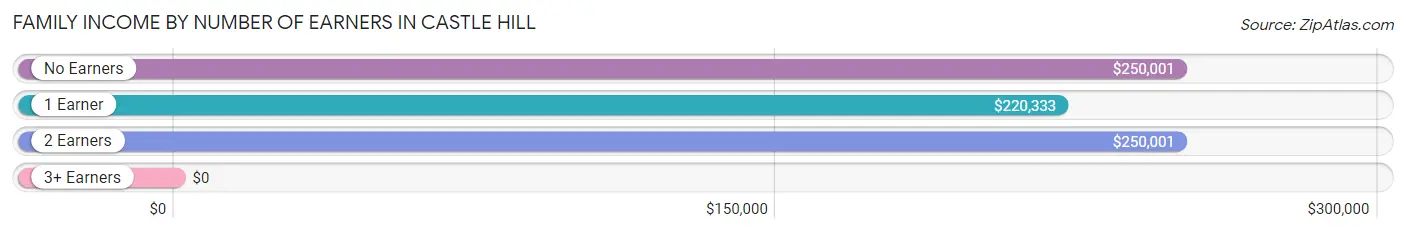
| Number of Earners | # Families | Median Income |
| No Earners | 48 (16.0%) | $250,001 |
| 1 Earner | 100 (33.2%) | $220,333 |
| 2 Earners | 138 (45.9%) | $250,001 |
| 3+ Earners | 15 (5.0%) | $0 |
| Total | 301 (100.0%) | $250,001 |
Household Income in Castle Hill
Household Income Brackets in Castle Hill
With 253 households falling in the category, the $200,000+ income range is the most frequent in Castle Hill, accounting for 66.6% of all households.
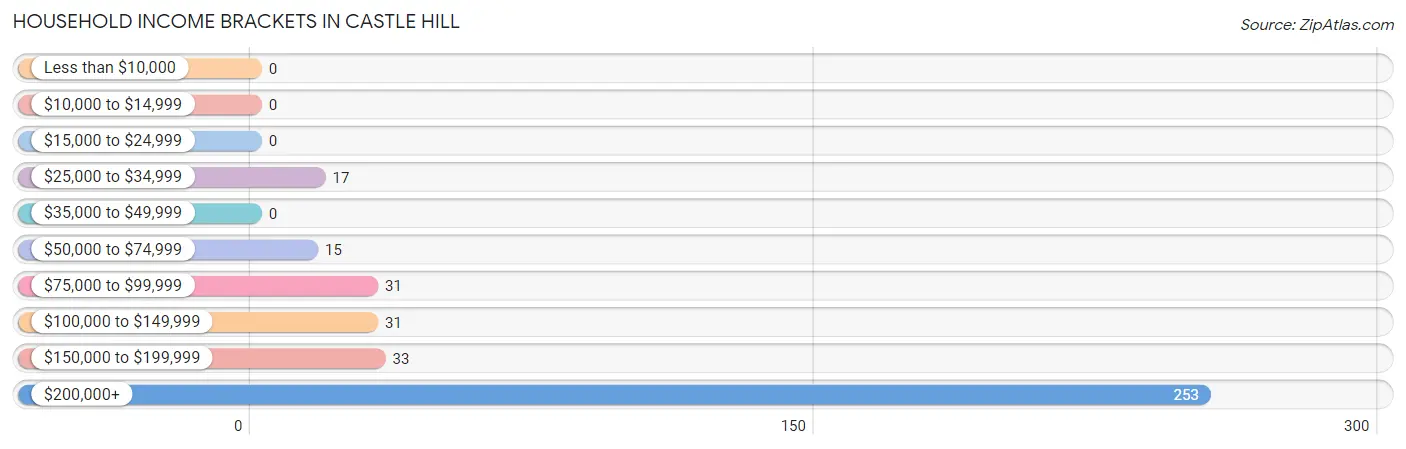
| Income Bracket | # Households | % Households |
| Less than $10,000 | 0 | 0.0% |
| $10,000 to $14,999 | 0 | 0.0% |
| $15,000 to $24,999 | 0 | 0.0% |
| $25,000 to $34,999 | 17 | 4.5% |
| $35,000 to $49,999 | 0 | 0.0% |
| $50,000 to $74,999 | 15 | 3.9% |
| $75,000 to $99,999 | 31 | 8.2% |
| $100,000 to $149,999 | 31 | 8.2% |
| $150,000 to $199,999 | 33 | 8.7% |
| $200,000+ | 253 | 66.6% |
Household Income by Householder Age in Castle Hill
The median household income in Castle Hill is $233,879, with the highest median household income of $250,001 found in the 25 to 44 years age bracket for the primary householder. A total of 100 households (26.3%) fall into this category.
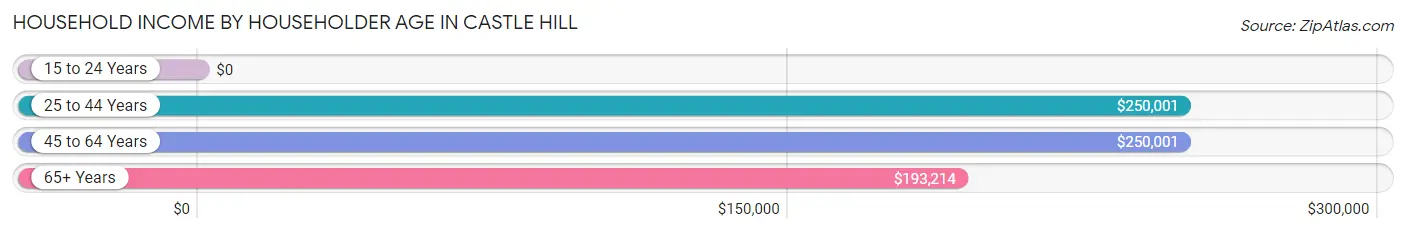
| Income Bracket | # Households | Median Income |
| 15 to 24 Years | 0 (0.0%) | $0 |
| 25 to 44 Years | 100 (26.3%) | $250,001 |
| 45 to 64 Years | 114 (30.0%) | $250,001 |
| 65+ Years | 166 (43.7%) | $193,214 |
| Total | 380 (100.0%) | $233,879 |
Poverty in Castle Hill
Income Below Poverty by Sex and Age in Castle Hill
With 1.1% poverty level for males and 0.5% for females among the residents of Castle Hill, 18 to 24 year old males and 18 to 24 year old females are the most vulnerable to poverty, with 3 males (100.0%) and 3 females (11.5%) in their respective age groups living below the poverty level.
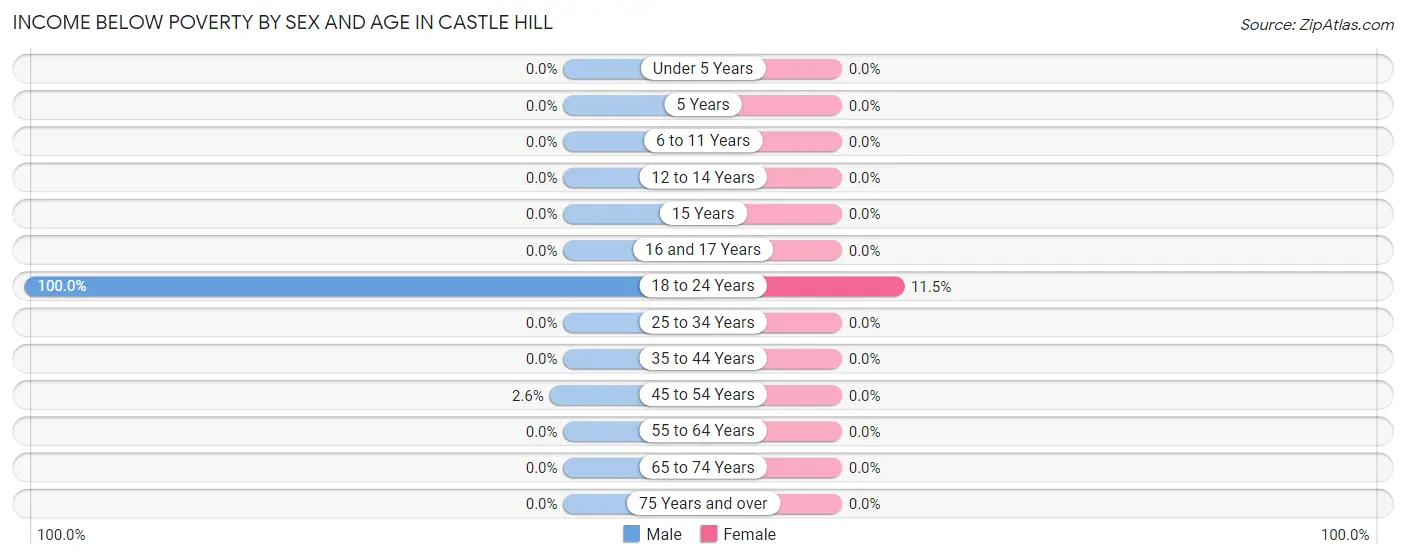
| Age Bracket | Male | Female |
| Under 5 Years | 0 (0.0%) | 0 (0.0%) |
| 5 Years | 0 (0.0%) | 0 (0.0%) |
| 6 to 11 Years | 0 (0.0%) | 0 (0.0%) |
| 12 to 14 Years | 0 (0.0%) | 0 (0.0%) |
| 15 Years | 0 (0.0%) | 0 (0.0%) |
| 16 and 17 Years | 0 (0.0%) | 0 (0.0%) |
| 18 to 24 Years | 3 (100.0%) | 3 (11.5%) |
| 25 to 34 Years | 0 (0.0%) | 0 (0.0%) |
| 35 to 44 Years | 0 (0.0%) | 0 (0.0%) |
| 45 to 54 Years | 2 (2.6%) | 0 (0.0%) |
| 55 to 64 Years | 0 (0.0%) | 0 (0.0%) |
| 65 to 74 Years | 0 (0.0%) | 0 (0.0%) |
| 75 Years and over | 0 (0.0%) | 0 (0.0%) |
| Total | 5 (1.1%) | 3 (0.5%) |
Income Above Poverty by Sex and Age in Castle Hill
According to the poverty statistics in Castle Hill, males aged under 5 years and females aged under 5 years are the age groups that are most secure financially, with 100.0% of males and 100.0% of females in these age groups living above the poverty line.
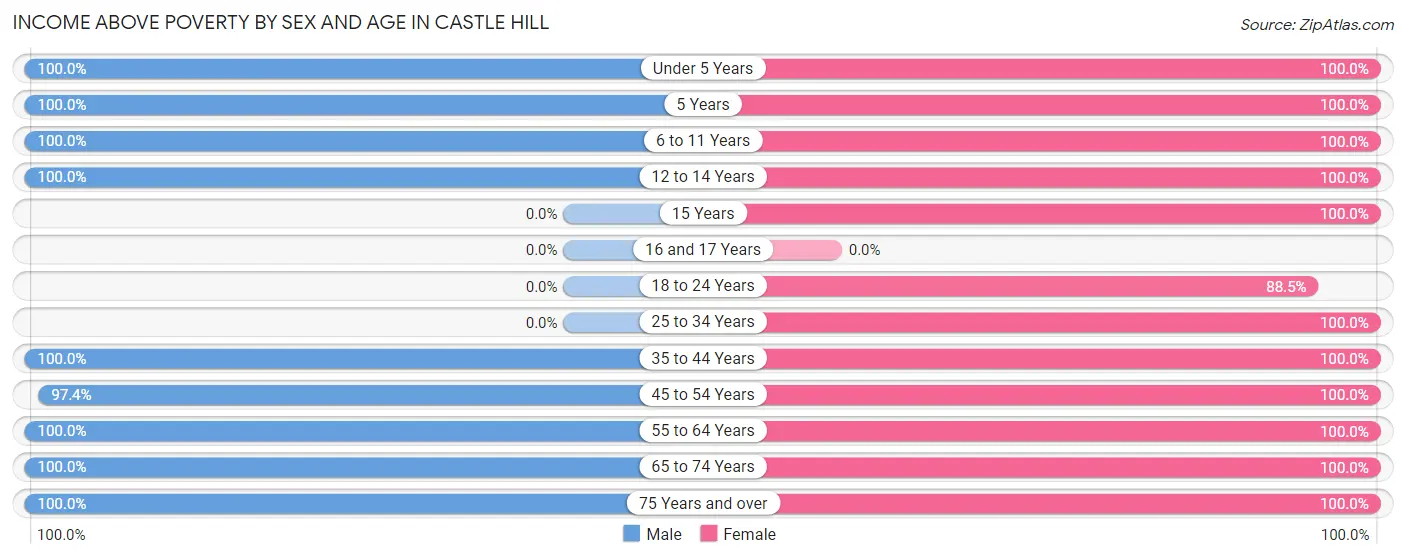
| Age Bracket | Male | Female |
| Under 5 Years | 41 (100.0%) | 38 (100.0%) |
| 5 Years | 13 (100.0%) | 15 (100.0%) |
| 6 to 11 Years | 32 (100.0%) | 52 (100.0%) |
| 12 to 14 Years | 55 (100.0%) | 34 (100.0%) |
| 15 Years | 0 (0.0%) | 18 (100.0%) |
| 16 and 17 Years | 0 (0.0%) | 0 (0.0%) |
| 18 to 24 Years | 0 (0.0%) | 23 (88.5%) |
| 25 to 34 Years | 0 (0.0%) | 12 (100.0%) |
| 35 to 44 Years | 96 (100.0%) | 83 (100.0%) |
| 45 to 54 Years | 76 (97.4%) | 57 (100.0%) |
| 55 to 64 Years | 51 (100.0%) | 51 (100.0%) |
| 65 to 74 Years | 61 (100.0%) | 118 (100.0%) |
| 75 Years and over | 30 (100.0%) | 46 (100.0%) |
| Total | 455 (98.9%) | 547 (99.5%) |
Income Below Poverty Among Married-Couple Families in Castle Hill
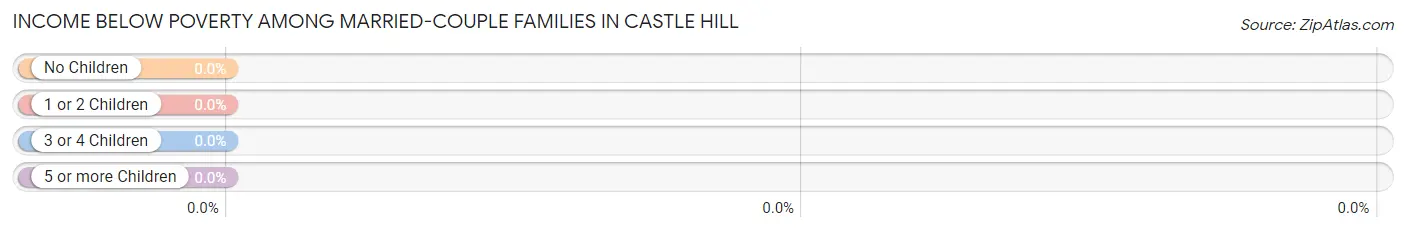
| Children | Above Poverty | Below Poverty |
| No Children | 138 (100.0%) | 0 (0.0%) |
| 1 or 2 Children | 163 (100.0%) | 0 (0.0%) |
| 3 or 4 Children | 0 (0.0%) | 0 (0.0%) |
| 5 or more Children | 0 (0.0%) | 0 (0.0%) |
| Total | 301 (100.0%) | 0 (0.0%) |
Income Below Poverty Among Single-Parent Households in Castle Hill
| Children | Single Father | Single Mother |
| No Children | 0 (0.0%) | 0 (0.0%) |
| 1 or 2 Children | 0 (0.0%) | 0 (0.0%) |
| 3 or 4 Children | 0 (0.0%) | 0 (0.0%) |
| 5 or more Children | 0 (0.0%) | 0 (0.0%) |
| Total | 0 (0.0%) | 0 (0.0%) |
Income Below Poverty Among Married-Couple vs Single-Parent Households in Castle Hill
| Children | Married-Couple Families | Single-Parent Households |
| No Children | 0 (0.0%) | 0 (0.0%) |
| 1 or 2 Children | 0 (0.0%) | 0 (0.0%) |
| 3 or 4 Children | 0 (0.0%) | 0 (0.0%) |
| 5 or more Children | 0 (0.0%) | 0 (0.0%) |
| Total | 0 (0.0%) | 0 (0.0%) |
Race in Castle Hill
The most populous races in Castle Hill are White / Caucasian (691 | 68.4%), Two or more Races (131 | 13.0%), and Asian (126 | 12.5%).
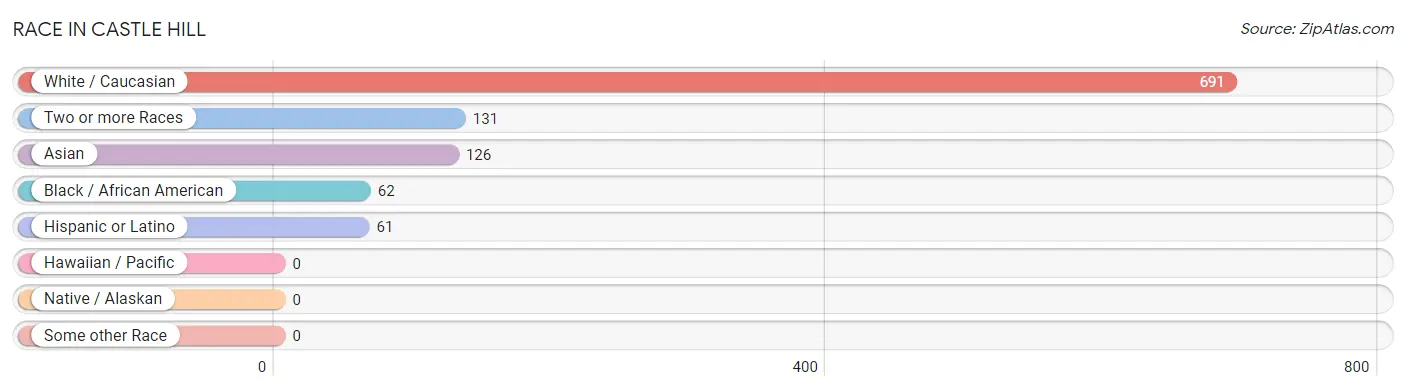
| Race | # Population | % Population |
| Asian | 126 | 12.5% |
| Black / African American | 62 | 6.1% |
| Hawaiian / Pacific | 0 | 0.0% |
| Hispanic or Latino | 61 | 6.0% |
| Native / Alaskan | 0 | 0.0% |
| White / Caucasian | 691 | 68.4% |
| Two or more Races | 131 | 13.0% |
| Some other Race | 0 | 0.0% |
| Total | 1,010 | 100.0% |
Ancestry in Castle Hill
The most populous ancestries reported in Castle Hill are Ukrainian (74 | 7.3%), Welsh (72 | 7.1%), English (58 | 5.7%), Scottish (57 | 5.6%), and Mexican (45 | 4.5%), together accounting for 30.3% of all Castle Hill residents.
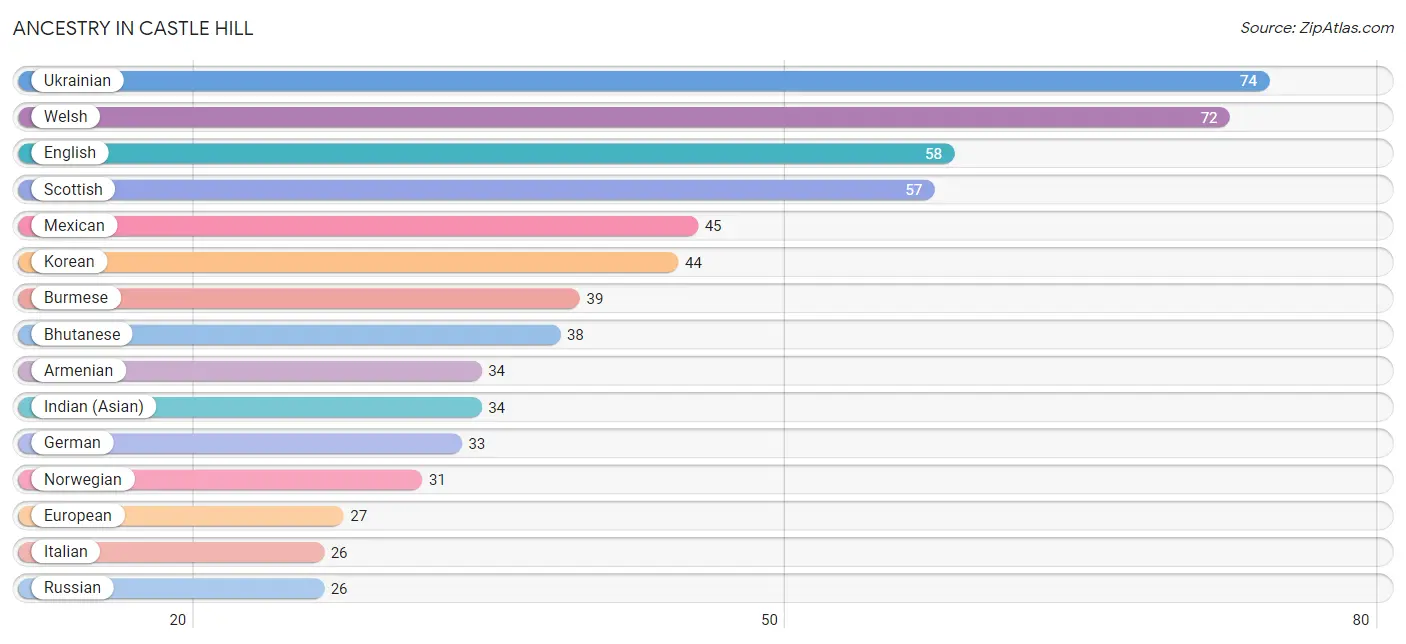
| Ancestry | # Population | % Population |
| Armenian | 34 | 3.4% |
| Bhutanese | 38 | 3.8% |
| British | 16 | 1.6% |
| Burmese | 39 | 3.9% |
| Central American | 16 | 1.6% |
| Eastern European | 19 | 1.9% |
| English | 58 | 5.7% |
| European | 27 | 2.7% |
| German | 33 | 3.3% |
| Indian (Asian) | 34 | 3.4% |
| Irish | 15 | 1.5% |
| Italian | 26 | 2.6% |
| Korean | 44 | 4.4% |
| Mexican | 45 | 4.5% |
| Northern European | 20 | 2.0% |
| Norwegian | 31 | 3.1% |
| Russian | 26 | 2.6% |
| Salvadoran | 16 | 1.6% |
| Scandinavian | 3 | 0.3% |
| Scottish | 57 | 5.6% |
| Sri Lankan | 11 | 1.1% |
| Thai | 25 | 2.5% |
| Ukrainian | 74 | 7.3% |
| Welsh | 72 | 7.1% | View All 24 Rows |
Immigrants in Castle Hill
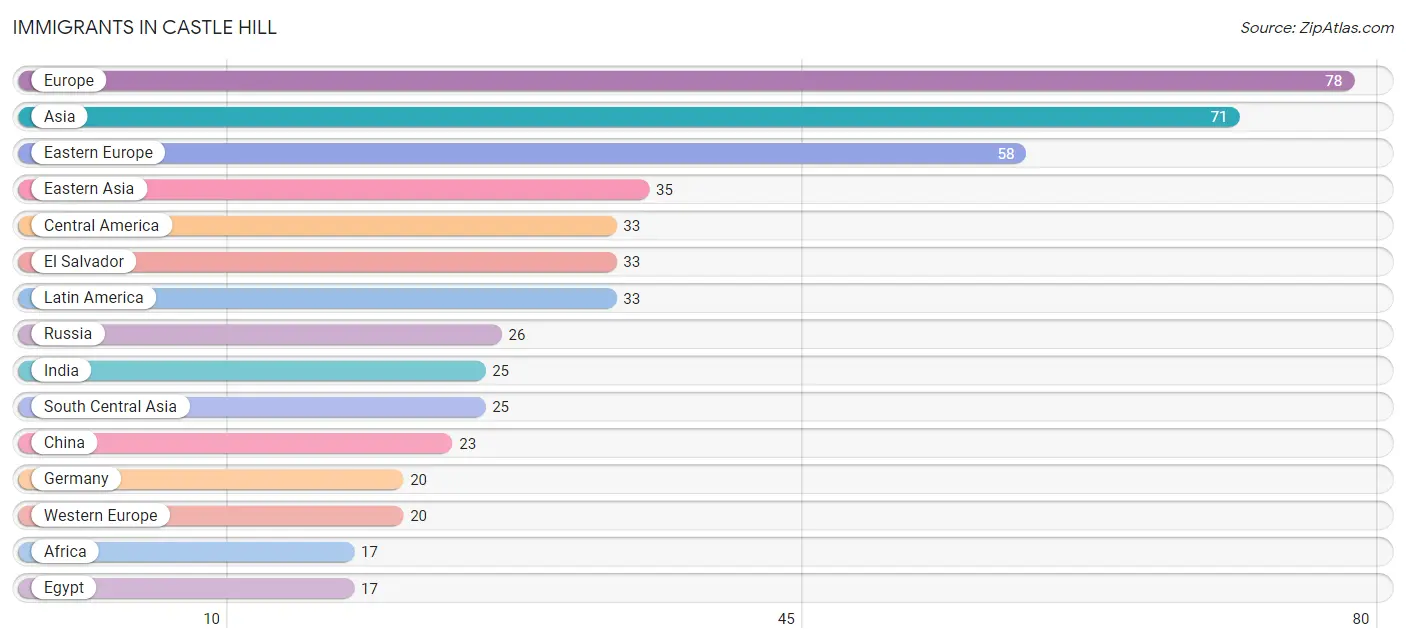
The most numerous immigrant groups reported in Castle Hill came from Europe (78 | 7.7%), Asia (71 | 7.0%), Eastern Europe (58 | 5.7%), Eastern Asia (35 | 3.5%), and Central America (33 | 3.3%), together accounting for 27.2% of all Castle Hill residents.
| Immigration Origin | # Population | % Population |
| Africa | 17 | 1.7% |
| Asia | 71 | 7.0% |
| Central America | 33 | 3.3% |
| China | 23 | 2.3% |
| Eastern Asia | 35 | 3.5% |
| Eastern Europe | 58 | 5.7% |
| Egypt | 17 | 1.7% |
| El Salvador | 33 | 3.3% |
| Europe | 78 | 7.7% |
| Germany | 20 | 2.0% |
| Hong Kong | 12 | 1.2% |
| India | 25 | 2.5% |
| Korea | 12 | 1.2% |
| Latin America | 33 | 3.3% |
| Lithuania | 15 | 1.5% |
| Northern Africa | 17 | 1.7% |
| Russia | 26 | 2.6% |
| South Central Asia | 25 | 2.5% |
| South Eastern Asia | 11 | 1.1% |
| Taiwan | 11 | 1.1% |
| Ukraine | 17 | 1.7% |
| Vietnam | 11 | 1.1% |
| Western Europe | 20 | 2.0% | View All 23 Rows |
Sex and Age in Castle Hill
Sex and Age in Castle Hill
The most populous age groups in Castle Hill are 45 to 49 Years (78 | 17.0%) for men and 65 to 69 Years (61 | 11.1%) for women.
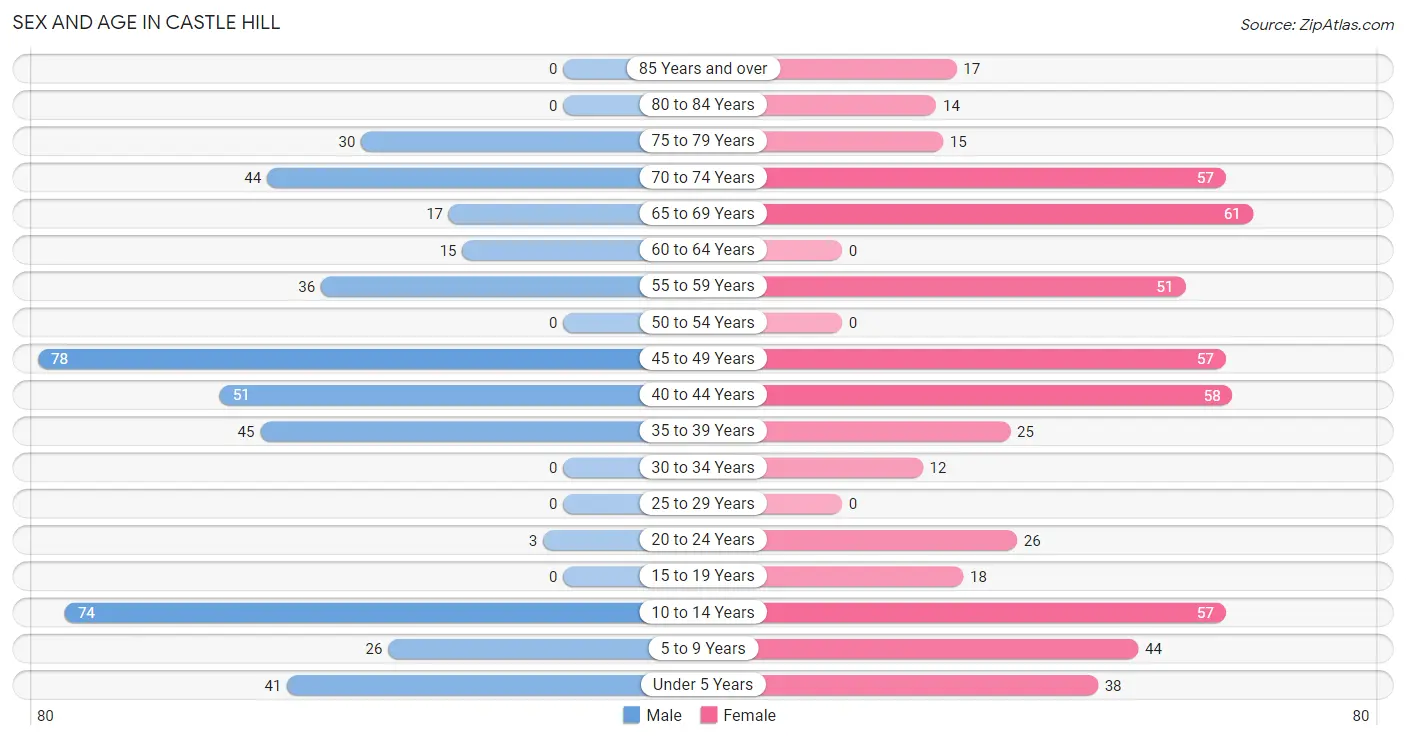
| Age Bracket | Male | Female |
| Under 5 Years | 41 (8.9%) | 38 (6.9%) |
| 5 to 9 Years | 26 (5.7%) | 44 (8.0%) |
| 10 to 14 Years | 74 (16.1%) | 57 (10.4%) |
| 15 to 19 Years | 0 (0.0%) | 18 (3.3%) |
| 20 to 24 Years | 3 (0.6%) | 26 (4.7%) |
| 25 to 29 Years | 0 (0.0%) | 0 (0.0%) |
| 30 to 34 Years | 0 (0.0%) | 12 (2.2%) |
| 35 to 39 Years | 45 (9.8%) | 25 (4.5%) |
| 40 to 44 Years | 51 (11.1%) | 58 (10.5%) |
| 45 to 49 Years | 78 (17.0%) | 57 (10.4%) |
| 50 to 54 Years | 0 (0.0%) | 0 (0.0%) |
| 55 to 59 Years | 36 (7.8%) | 51 (9.3%) |
| 60 to 64 Years | 15 (3.3%) | 0 (0.0%) |
| 65 to 69 Years | 17 (3.7%) | 61 (11.1%) |
| 70 to 74 Years | 44 (9.6%) | 57 (10.4%) |
| 75 to 79 Years | 30 (6.5%) | 15 (2.7%) |
| 80 to 84 Years | 0 (0.0%) | 14 (2.5%) |
| 85 Years and over | 0 (0.0%) | 17 (3.1%) |
| Total | 460 (100.0%) | 550 (100.0%) |
Families and Households in Castle Hill
Median Family Size in Castle Hill
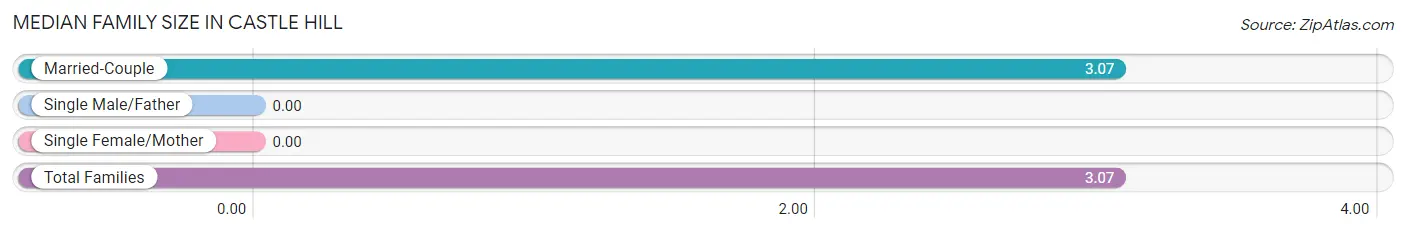
| Family Type | # Families | Family Size |
| Married-Couple | 301 (100.0%) | 3.07 |
| Single Male/Father | 0 (0.0%) | - |
| Single Female/Mother | 0 (0.0%) | - |
| Total Families | 301 (100.0%) | 3.07 |
Median Household Size in Castle Hill
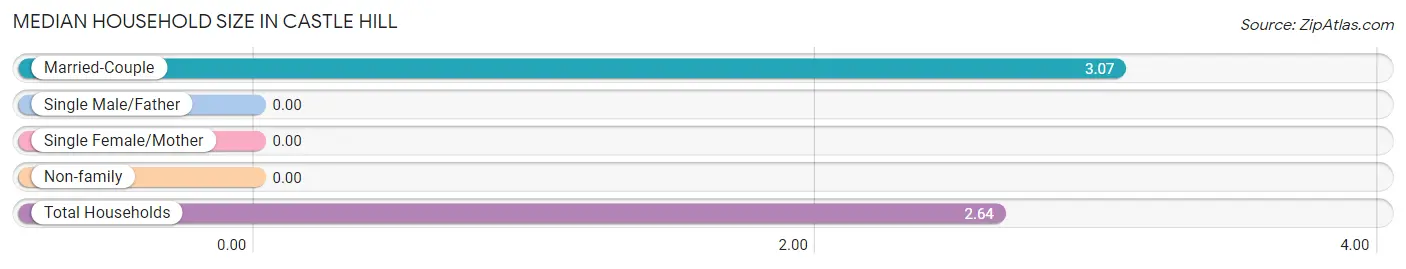
| Household Type | # Households | Household Size |
| Married-Couple | 301 (79.2%) | 3.07 |
| Single Male/Father | 0 (0.0%) | - |
| Single Female/Mother | 0 (0.0%) | - |
| Non-family | 79 (20.8%) | - |
| Total Households | 380 (100.0%) | 2.64 |
Household Size by Marriage Status in Castle Hill
Out of a total of 380 households in Castle Hill, 301 (79.2%) are family households, while 79 (20.8%) are nonfamily households. The most numerous type of family households are 4-person households, comprising 148, and the most common type of nonfamily households are 1-person households, comprising 79.
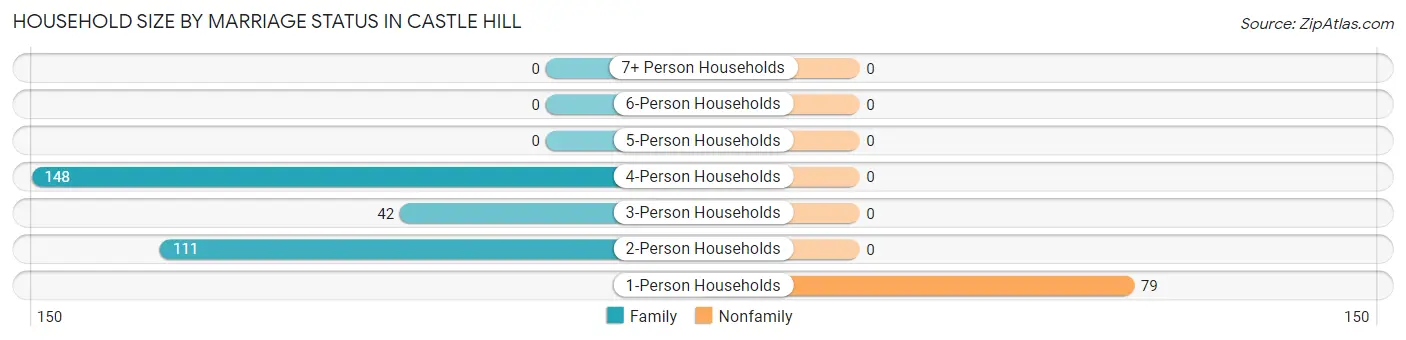
| Household Size | Family Households | Nonfamily Households |
| 1-Person Households | - | 79 (20.8%) |
| 2-Person Households | 111 (29.2%) | 0 (0.0%) |
| 3-Person Households | 42 (11.1%) | 0 (0.0%) |
| 4-Person Households | 148 (39.0%) | 0 (0.0%) |
| 5-Person Households | 0 (0.0%) | 0 (0.0%) |
| 6-Person Households | 0 (0.0%) | 0 (0.0%) |
| 7+ Person Households | 0 (0.0%) | 0 (0.0%) |
| Total | 301 (79.2%) | 79 (20.8%) |
Female Fertility in Castle Hill
Fertility by Age in Castle Hill
Average fertility rate in Castle Hill is 133.0 births per 1,000 women. Women in the age bracket of 35 to 50 years have the highest fertility rate with 186.0 births per 1,000 women. Women in the age bracket of 35 to 50 years acount for 100.0% of all women with births.
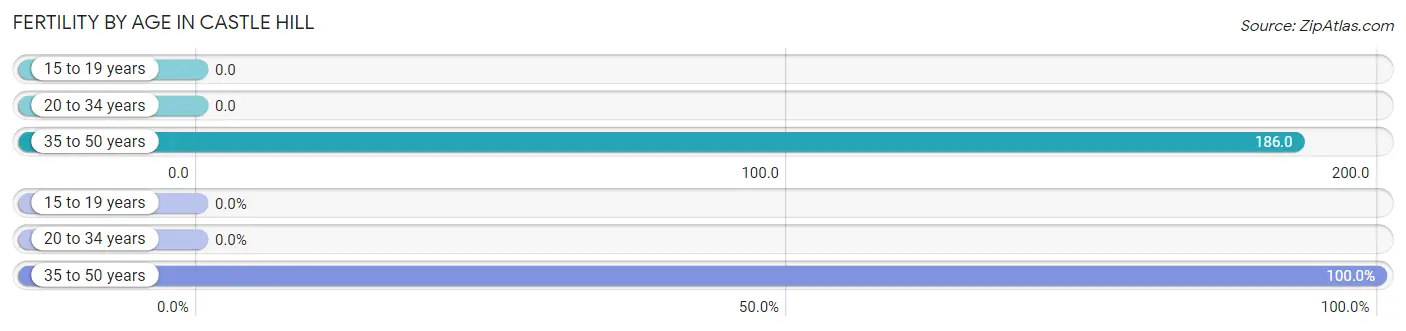
| Age Bracket | Women with Births | Births / 1,000 Women |
| 15 to 19 years | 0 (0.0%) | 0.0 |
| 20 to 34 years | 0 (0.0%) | 0.0 |
| 35 to 50 years | 26 (100.0%) | 186.0 |
| Total | 26 (100.0%) | 133.0 |
Fertility by Age by Marriage Status in Castle Hill
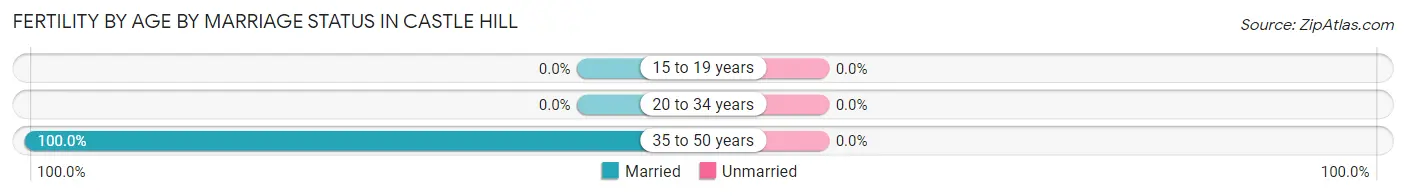
| Age Bracket | Married | Unmarried |
| 15 to 19 years | 0 (0.0%) | 0 (0.0%) |
| 20 to 34 years | 0 (0.0%) | 0 (0.0%) |
| 35 to 50 years | 26 (100.0%) | 0 (0.0%) |
| Total | 26 (100.0%) | 0 (0.0%) |
Fertility by Education in Castle Hill
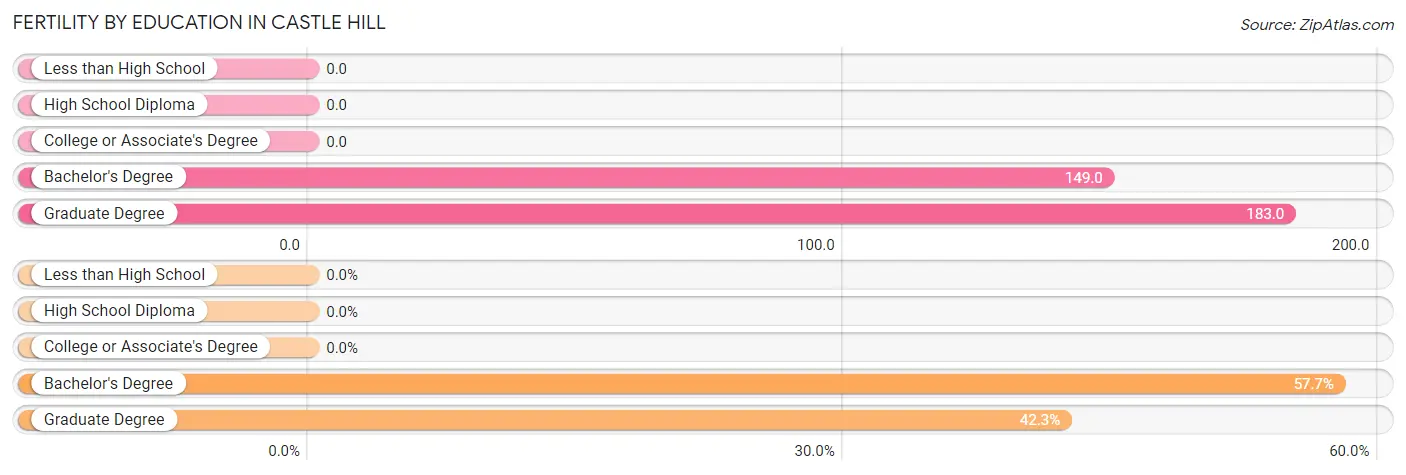
| Educational Attainment | Women with Births | Births / 1,000 Women |
| Less than High School | 0 (0.0%) | 0.0 |
| High School Diploma | 0 (0.0%) | 0.0 |
| College or Associate's Degree | 0 (0.0%) | 0.0 |
| Bachelor's Degree | 15 (57.7%) | 149.0 |
| Graduate Degree | 11 (42.3%) | 183.0 |
| Total | 26 (100.0%) | 133.0 |
Fertility by Education by Marriage Status in Castle Hill
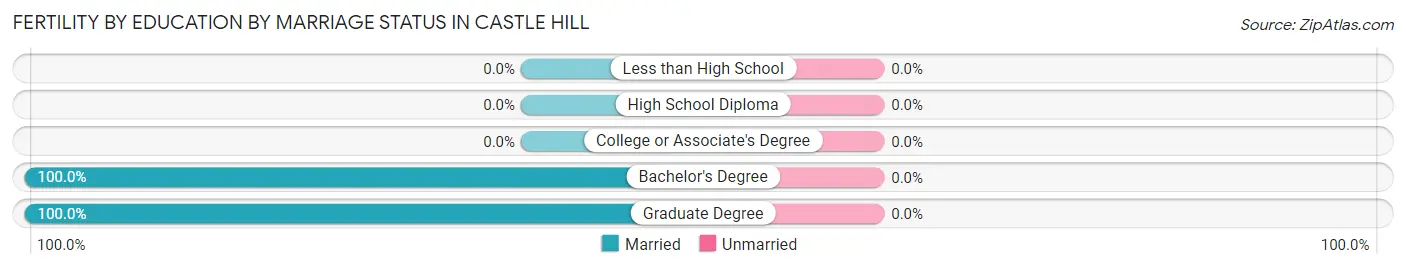
| Educational Attainment | Married | Unmarried |
| Less than High School | 0 (0.0%) | 0 (0.0%) |
| High School Diploma | 0 (0.0%) | 0 (0.0%) |
| College or Associate's Degree | 0 (0.0%) | 0 (0.0%) |
| Bachelor's Degree | 15 (100.0%) | 0 (0.0%) |
| Graduate Degree | 11 (100.0%) | 0 (0.0%) |
| Total | 26 (100.0%) | 0 (0.0%) |
Employment Characteristics in Castle Hill
Employment by Class of Employer in Castle Hill
Among the 429 employed individuals in Castle Hill, private company employees (381 | 88.8%), state government employees (32 | 7.5%), and local government employees (16 | 3.7%) make up the most common classes of employment.
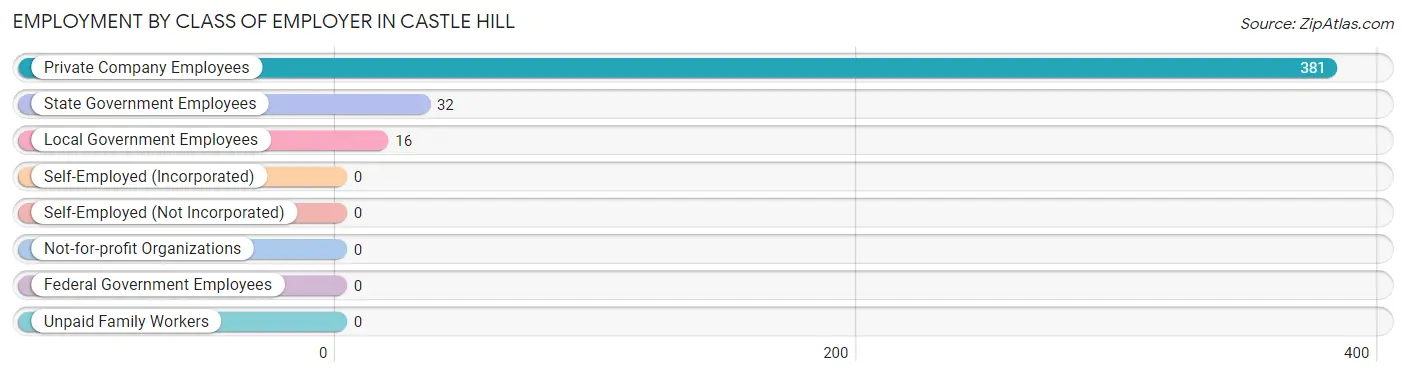
| Employer Class | # Employees | % Employees |
| Private Company Employees | 381 | 88.8% |
| Self-Employed (Incorporated) | 0 | 0.0% |
| Self-Employed (Not Incorporated) | 0 | 0.0% |
| Not-for-profit Organizations | 0 | 0.0% |
| Local Government Employees | 16 | 3.7% |
| State Government Employees | 32 | 7.5% |
| Federal Government Employees | 0 | 0.0% |
| Unpaid Family Workers | 0 | 0.0% |
| Total | 429 | 100.0% |
Employment Status by Age in Castle Hill
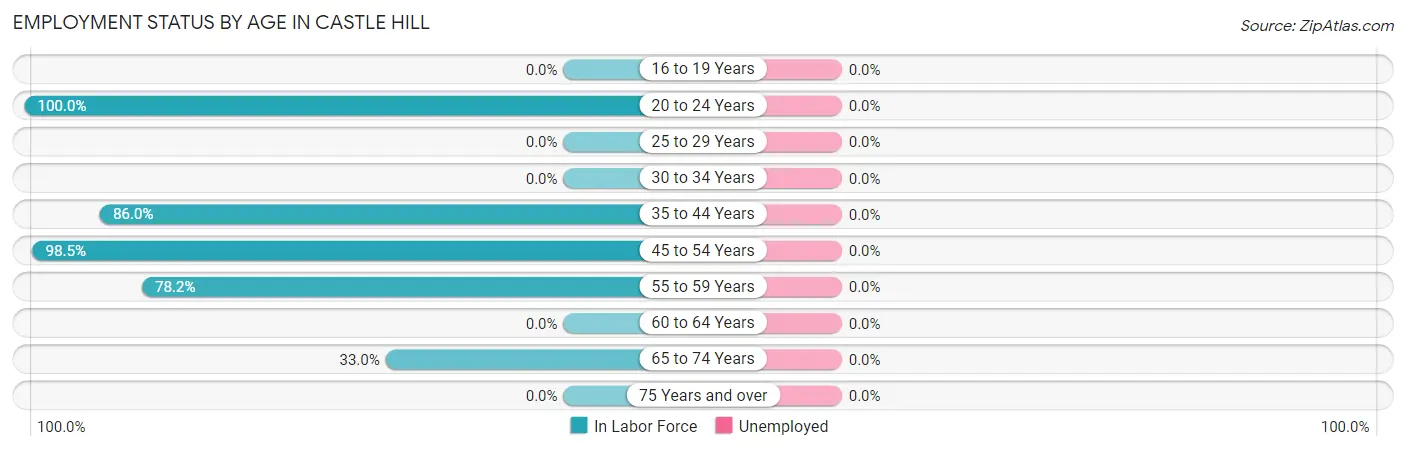
| Age Bracket | In Labor Force | Unemployed |
| 16 to 19 Years | 0 (0.0%) | 0 (0.0%) |
| 20 to 24 Years | 29 (100.0%) | 0 (0.0%) |
| 25 to 29 Years | 0 (0.0%) | 0 (0.0%) |
| 30 to 34 Years | 0 (0.0%) | 0 (0.0%) |
| 35 to 44 Years | 154 (86.0%) | 0 (0.0%) |
| 45 to 54 Years | 133 (98.5%) | 0 (0.0%) |
| 55 to 59 Years | 68 (78.2%) | 0 (0.0%) |
| 60 to 64 Years | 0 (0.0%) | 0 (0.0%) |
| 65 to 74 Years | 59 (33.0%) | 0 (0.0%) |
| 75 Years and over | 0 (0.0%) | 0 (0.0%) |
| Total | 443 (62.2%) | 0 (0.0%) |
Employment Status by Educational Attainment in Castle Hill
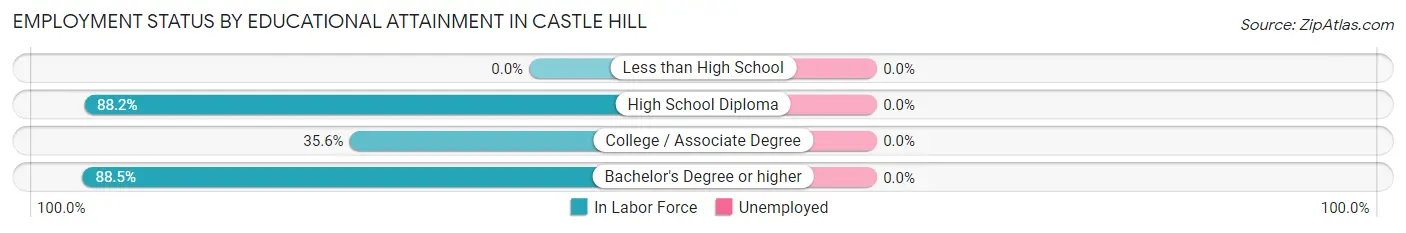
| Educational Attainment | In Labor Force | Unemployed |
| Less than High School | 0 (0.0%) | 0 (0.0%) |
| High School Diploma | 15 (88.2%) | 0 (0.0%) |
| College / Associate Degree | 16 (35.6%) | 0 (0.0%) |
| Bachelor's Degree or higher | 324 (88.5%) | 0 (0.0%) |
| Total | 355 (82.9%) | 0 (0.0%) |
Employment Occupations by Sex in Castle Hill
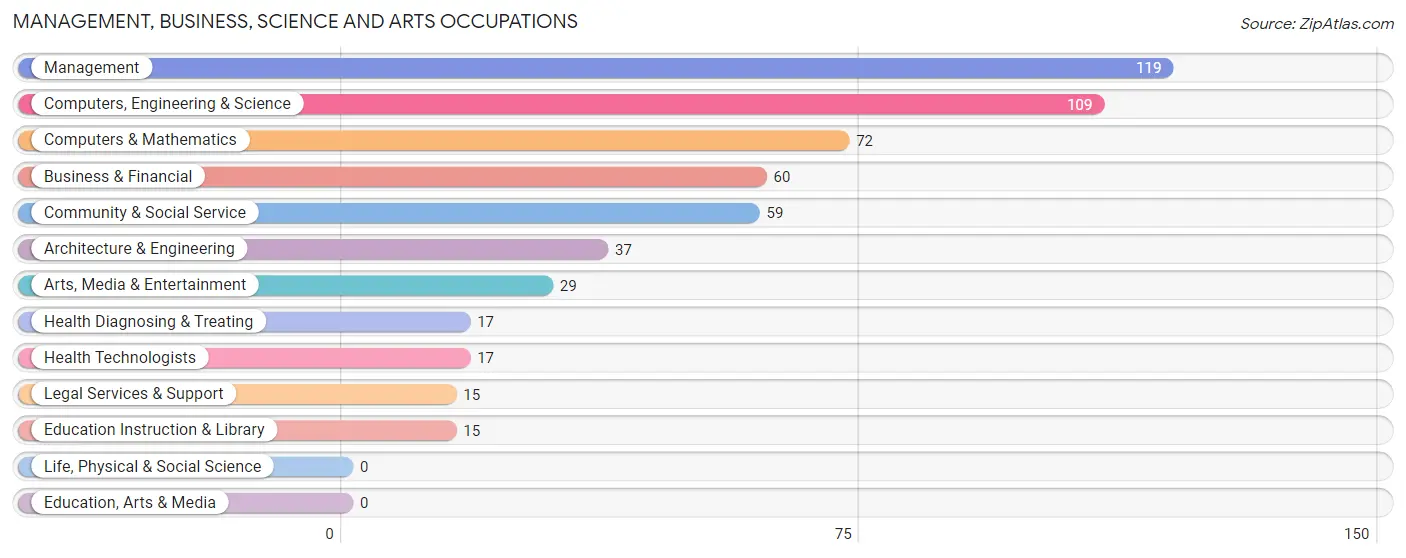
Management, Business, Science and Arts Occupations
The most common Management, Business, Science and Arts occupations in Castle Hill are Management (119 | 26.9%), Computers, Engineering & Science (109 | 24.6%), Computers & Mathematics (72 | 16.3%), Business & Financial (60 | 13.5%), and Community & Social Service (59 | 13.3%).
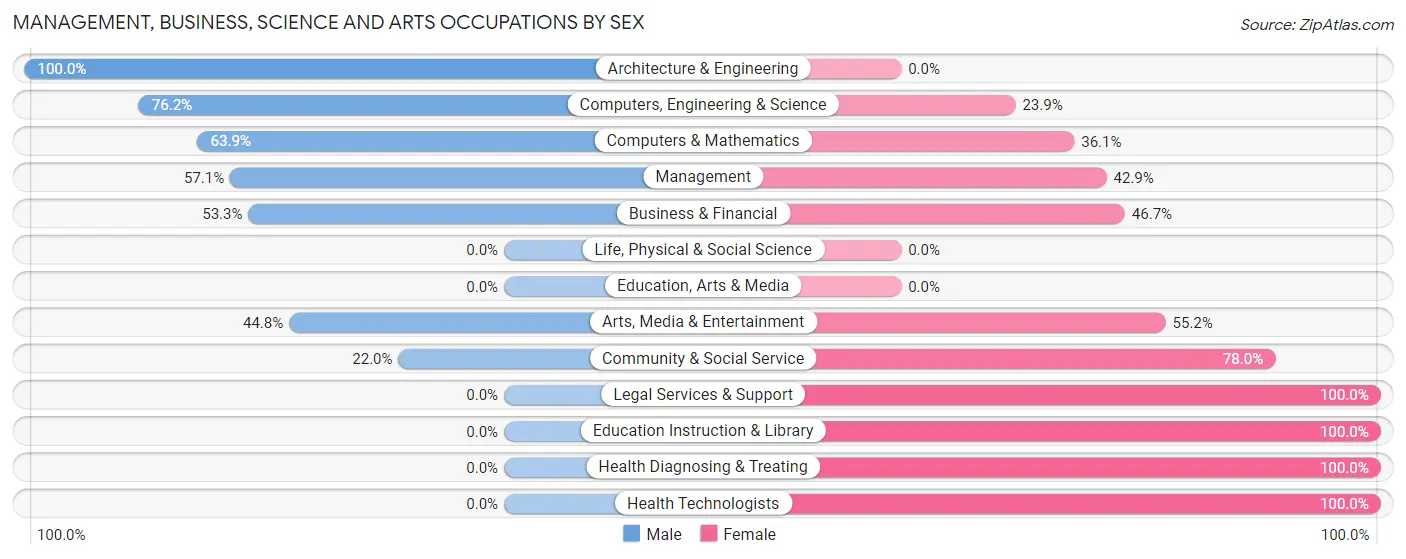
Management, Business, Science and Arts Occupations by Sex
Within the Management, Business, Science and Arts occupations in Castle Hill, the most male-oriented occupations are Architecture & Engineering (100.0%), Computers, Engineering & Science (76.1%), and Computers & Mathematics (63.9%), while the most female-oriented occupations are Legal Services & Support (100.0%), Education Instruction & Library (100.0%), and Health Diagnosing & Treating (100.0%).
| Occupation | Male | Female |
| Management | 68 (57.1%) | 51 (42.9%) |
| Business & Financial | 32 (53.3%) | 28 (46.7%) |
| Computers, Engineering & Science | 83 (76.1%) | 26 (23.8%) |
| Computers & Mathematics | 46 (63.9%) | 26 (36.1%) |
| Architecture & Engineering | 37 (100.0%) | 0 (0.0%) |
| Life, Physical & Social Science | 0 (0.0%) | 0 (0.0%) |
| Community & Social Service | 13 (22.0%) | 46 (78.0%) |
| Education, Arts & Media | 0 (0.0%) | 0 (0.0%) |
| Legal Services & Support | 0 (0.0%) | 15 (100.0%) |
| Education Instruction & Library | 0 (0.0%) | 15 (100.0%) |
| Arts, Media & Entertainment | 13 (44.8%) | 16 (55.2%) |
| Health Diagnosing & Treating | 0 (0.0%) | 17 (100.0%) |
| Health Technologists | 0 (0.0%) | 17 (100.0%) |
| Total (Category) | 196 (53.8%) | 168 (46.2%) |
| Total (Overall) | 211 (47.6%) | 232 (52.4%) |
Services Occupations
Services Occupations by Sex
| Occupation | Male | Female |
| Healthcare Support | 0 (0.0%) | 0 (0.0%) |
| Security & Protection | 0 (0.0%) | 0 (0.0%) |
| Firefighting & Prevention | 0 (0.0%) | 0 (0.0%) |
| Law Enforcement | 0 (0.0%) | 0 (0.0%) |
| Food Preparation & Serving | 0 (0.0%) | 0 (0.0%) |
| Cleaning & Maintenance | 0 (0.0%) | 0 (0.0%) |
| Personal Care & Service | 0 (0.0%) | 0 (0.0%) |
| Total (Category) | 0 (0.0%) | 0 (0.0%) |
| Total (Overall) | 211 (47.6%) | 232 (52.4%) |
Sales and Office Occupations
The most common Sales and Office occupations in Castle Hill are Sales & Related (39 | 8.8%), and Office & Administration (37 | 8.4%).
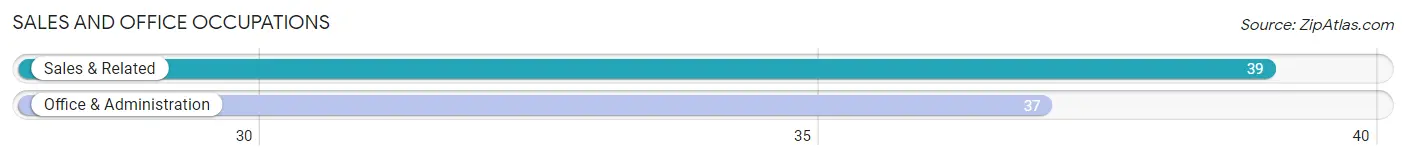
Sales and Office Occupations by Sex
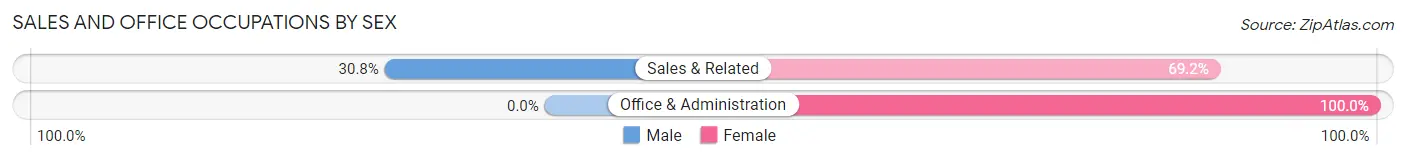
| Occupation | Male | Female |
| Sales & Related | 12 (30.8%) | 27 (69.2%) |
| Office & Administration | 0 (0.0%) | 37 (100.0%) |
| Total (Category) | 12 (15.8%) | 64 (84.2%) |
| Total (Overall) | 211 (47.6%) | 232 (52.4%) |
Natural Resources, Construction and Maintenance Occupations
The most common Natural Resources, Construction and Maintenance occupations in Castle Hill are , and Construction & Extraction (3 | 0.7%).
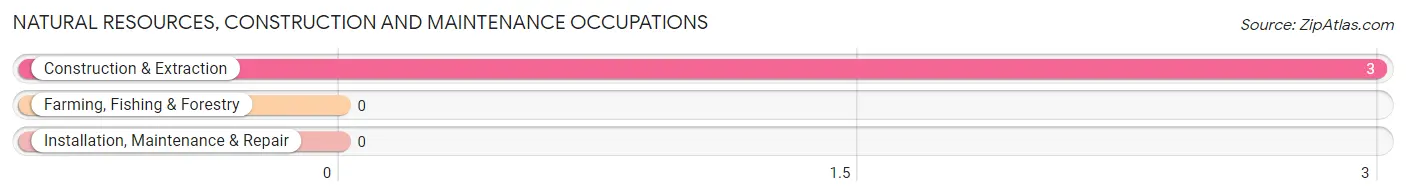
Natural Resources, Construction and Maintenance Occupations by Sex
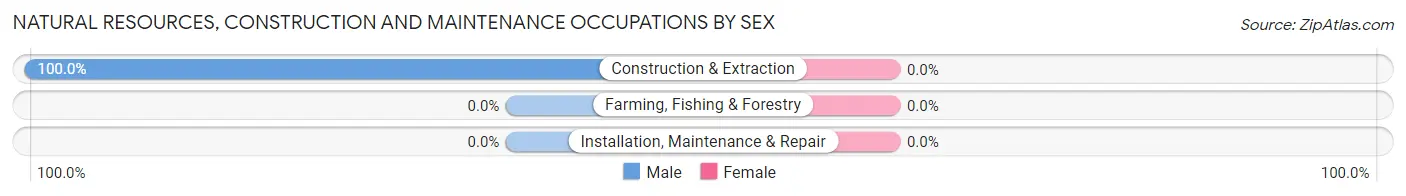
| Occupation | Male | Female |
| Farming, Fishing & Forestry | 0 (0.0%) | 0 (0.0%) |
| Construction & Extraction | 3 (100.0%) | 0 (0.0%) |
| Installation, Maintenance & Repair | 0 (0.0%) | 0 (0.0%) |
| Total (Category) | 3 (100.0%) | 0 (0.0%) |
| Total (Overall) | 211 (47.6%) | 232 (52.4%) |
Production, Transportation and Moving Occupations
Production, Transportation and Moving Occupations by Sex
| Occupation | Male | Female |
| Production | 0 (0.0%) | 0 (0.0%) |
| Transportation | 0 (0.0%) | 0 (0.0%) |
| Material Moving | 0 (0.0%) | 0 (0.0%) |
| Total (Category) | 0 (0.0%) | 0 (0.0%) |
| Total (Overall) | 211 (47.6%) | 232 (52.4%) |
Employment Industries by Sex in Castle Hill
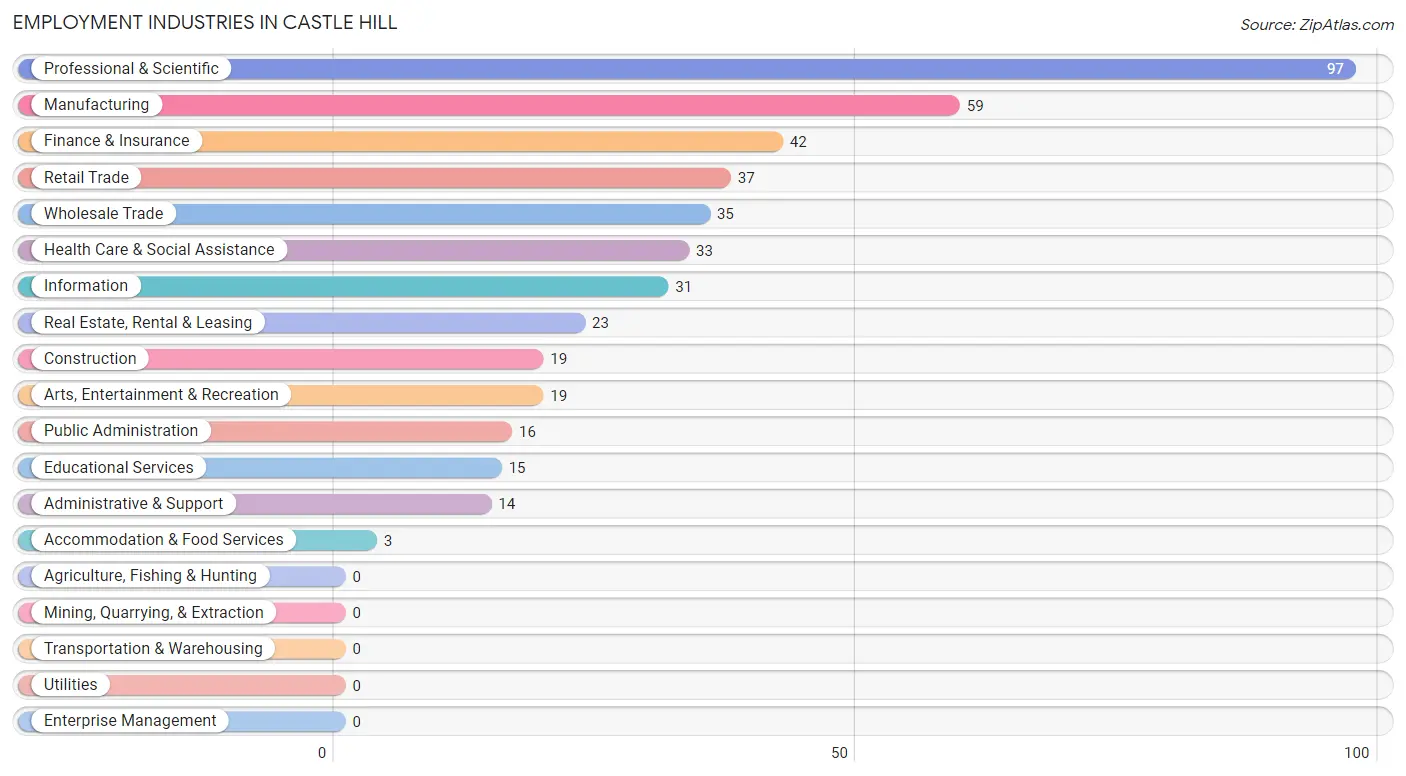
Employment Industries in Castle Hill
The major employment industries in Castle Hill include Professional & Scientific (97 | 21.9%), Manufacturing (59 | 13.3%), Finance & Insurance (42 | 9.5%), Retail Trade (37 | 8.4%), and Wholesale Trade (35 | 7.9%).
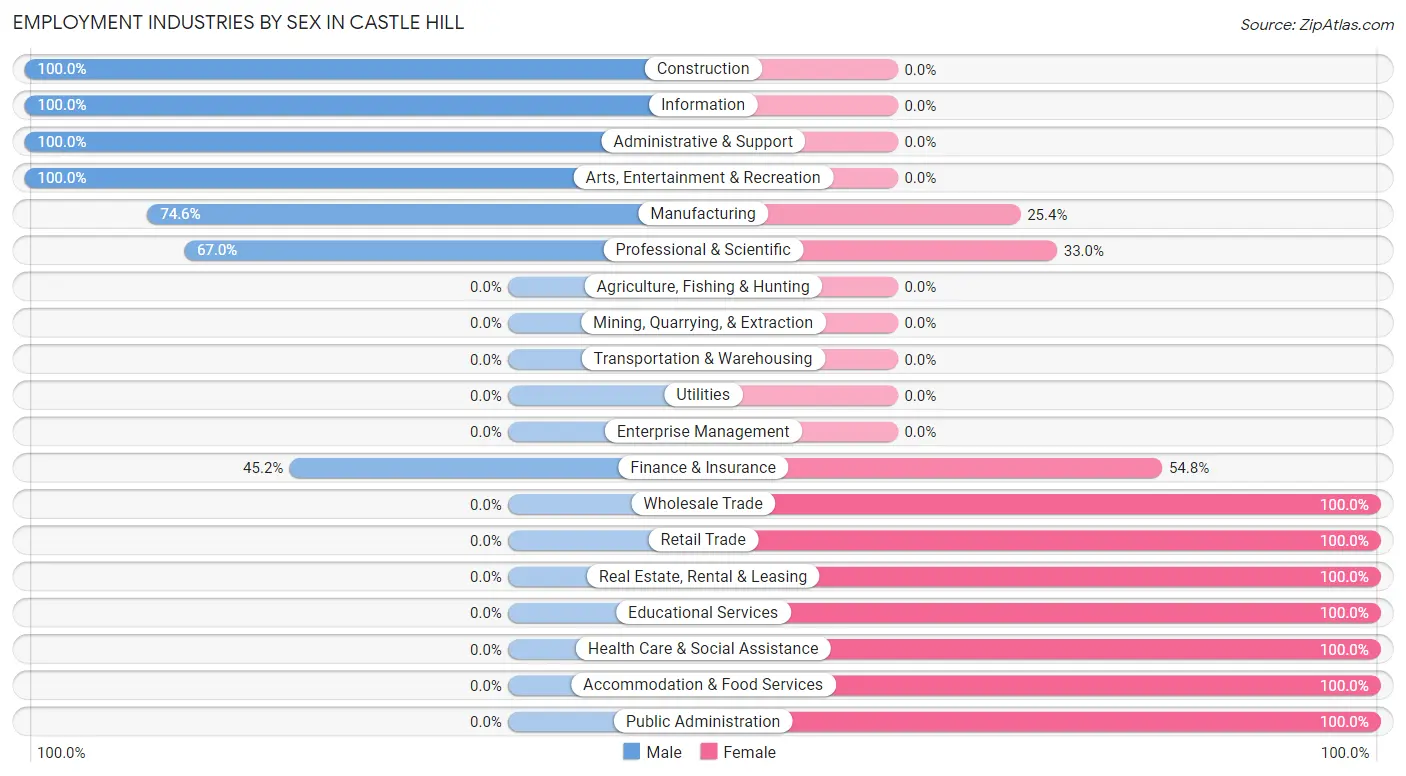
Employment Industries by Sex in Castle Hill
The Castle Hill industries that see more men than women are Construction (100.0%), Information (100.0%), and Administrative & Support (100.0%), whereas the industries that tend to have a higher number of women are Wholesale Trade (100.0%), Retail Trade (100.0%), and Real Estate, Rental & Leasing (100.0%).
| Industry | Male | Female |
| Agriculture, Fishing & Hunting | 0 (0.0%) | 0 (0.0%) |
| Mining, Quarrying, & Extraction | 0 (0.0%) | 0 (0.0%) |
| Construction | 19 (100.0%) | 0 (0.0%) |
| Manufacturing | 44 (74.6%) | 15 (25.4%) |
| Wholesale Trade | 0 (0.0%) | 35 (100.0%) |
| Retail Trade | 0 (0.0%) | 37 (100.0%) |
| Transportation & Warehousing | 0 (0.0%) | 0 (0.0%) |
| Utilities | 0 (0.0%) | 0 (0.0%) |
| Information | 31 (100.0%) | 0 (0.0%) |
| Finance & Insurance | 19 (45.2%) | 23 (54.8%) |
| Real Estate, Rental & Leasing | 0 (0.0%) | 23 (100.0%) |
| Professional & Scientific | 65 (67.0%) | 32 (33.0%) |
| Enterprise Management | 0 (0.0%) | 0 (0.0%) |
| Administrative & Support | 14 (100.0%) | 0 (0.0%) |
| Educational Services | 0 (0.0%) | 15 (100.0%) |
| Health Care & Social Assistance | 0 (0.0%) | 33 (100.0%) |
| Arts, Entertainment & Recreation | 19 (100.0%) | 0 (0.0%) |
| Accommodation & Food Services | 0 (0.0%) | 3 (100.0%) |
| Public Administration | 0 (0.0%) | 16 (100.0%) |
| Total | 211 (47.6%) | 232 (52.4%) |
Education in Castle Hill
School Enrollment in Castle Hill
The most common levels of schooling among the 301 students in Castle Hill are middle school (109 | 36.2%), high school (40 | 13.3%), and college / undergraduate (40 | 13.3%).
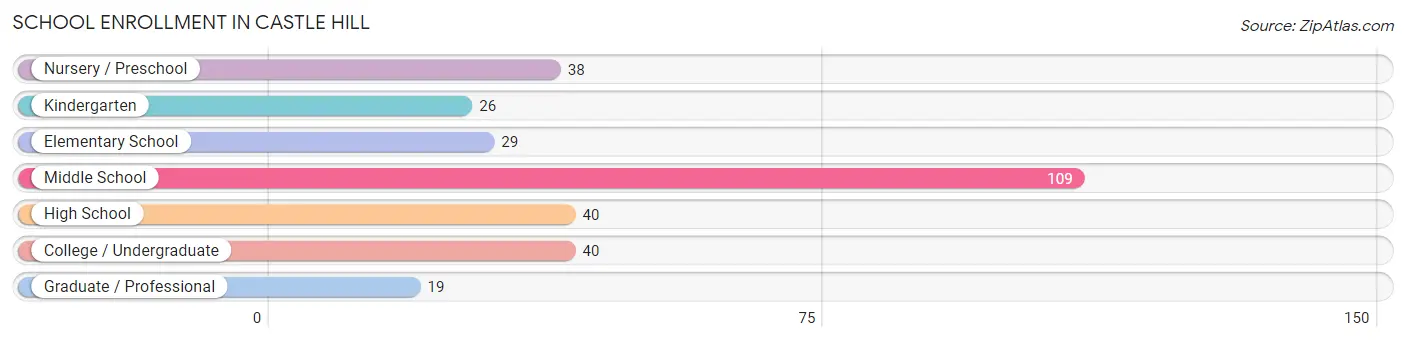
| School Level | # Students | % Students |
| Nursery / Preschool | 38 | 12.6% |
| Kindergarten | 26 | 8.6% |
| Elementary School | 29 | 9.6% |
| Middle School | 109 | 36.2% |
| High School | 40 | 13.3% |
| College / Undergraduate | 40 | 13.3% |
| Graduate / Professional | 19 | 6.3% |
| Total | 301 | 100.0% |
School Enrollment by Age by Funding Source in Castle Hill
Out of a total of 301 students who are enrolled in schools in Castle Hill, 47 (15.6%) attend a private institution, while the remaining 254 (84.4%) are enrolled in public schools. The age group of 35 years and over has the highest likelihood of being enrolled in private schools, with 19 (57.6% in the age bracket) enrolled. Conversely, the age group of 10 to 14 year olds has the lowest likelihood of being enrolled in a private school, with 131 (100.0% in the age bracket) attending a public institution.
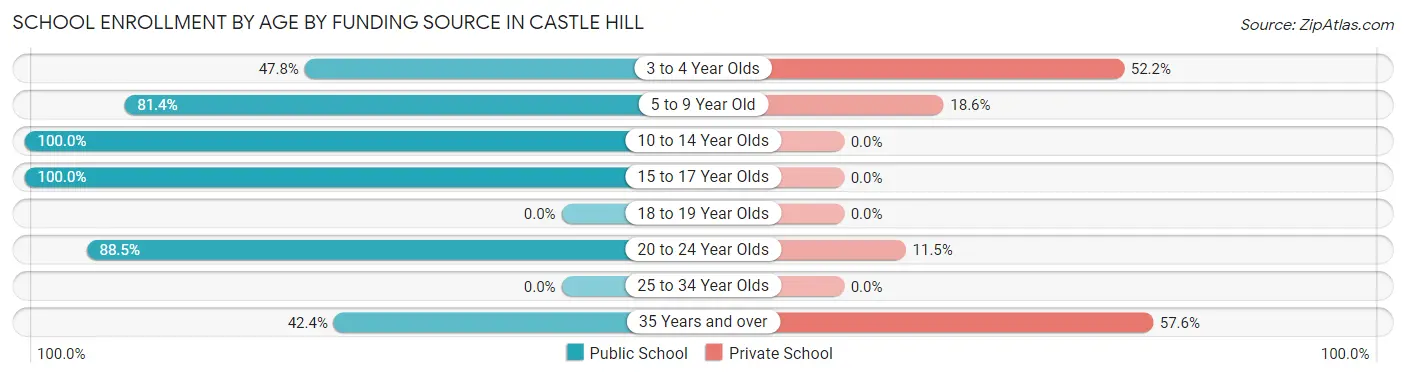
| Age Bracket | Public School | Private School |
| 3 to 4 Year Olds | 11 (47.8%) | 12 (52.2%) |
| 5 to 9 Year Old | 57 (81.4%) | 13 (18.6%) |
| 10 to 14 Year Olds | 131 (100.0%) | 0 (0.0%) |
| 15 to 17 Year Olds | 18 (100.0%) | 0 (0.0%) |
| 18 to 19 Year Olds | 0 (0.0%) | 0 (0.0%) |
| 20 to 24 Year Olds | 23 (88.5%) | 3 (11.5%) |
| 25 to 34 Year Olds | 0 (0.0%) | 0 (0.0%) |
| 35 Years and over | 14 (42.4%) | 19 (57.6%) |
| Total | 254 (84.4%) | 47 (15.6%) |
Educational Attainment by Field of Study in Castle Hill
Engineering (87 | 15.9%), business (84 | 15.3%), literature & languages (61 | 11.1%), social sciences (60 | 11.0%), and liberal arts & history (55 | 10.0%) are the most common fields of study among 548 individuals in Castle Hill who have obtained a bachelor's degree or higher.
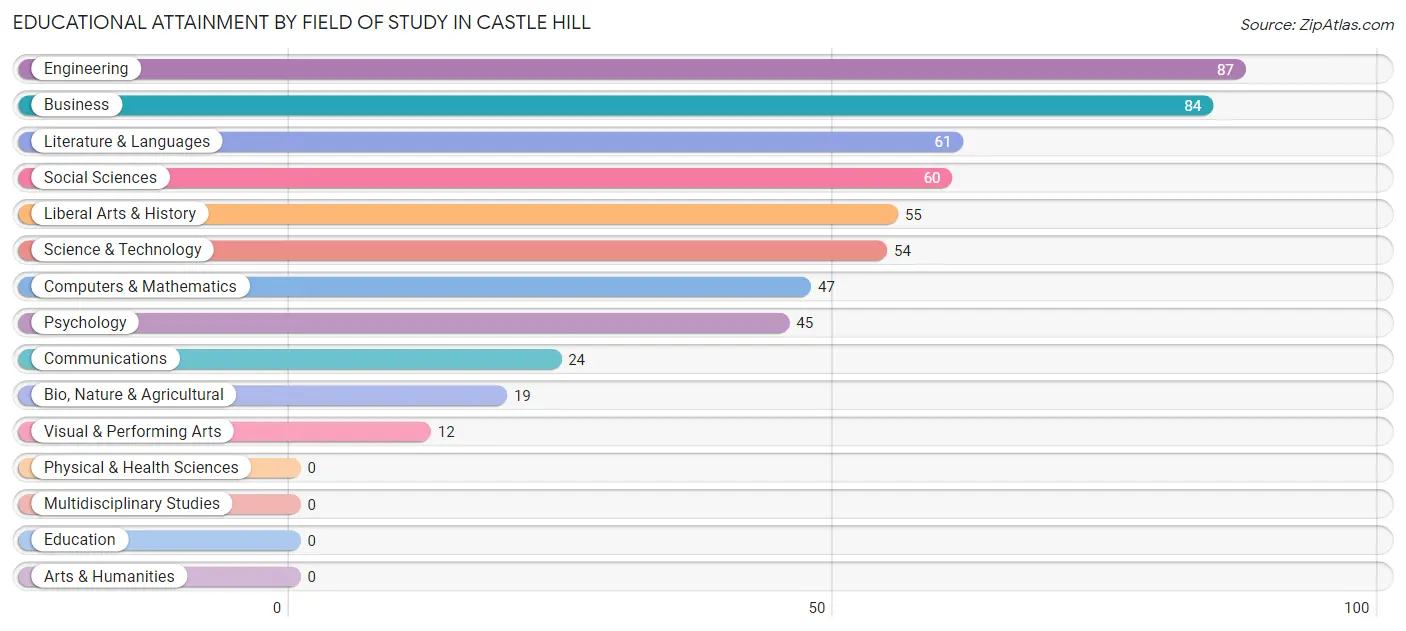
| Field of Study | # Graduates | % Graduates |
| Computers & Mathematics | 47 | 8.6% |
| Bio, Nature & Agricultural | 19 | 3.5% |
| Physical & Health Sciences | 0 | 0.0% |
| Psychology | 45 | 8.2% |
| Social Sciences | 60 | 11.0% |
| Engineering | 87 | 15.9% |
| Multidisciplinary Studies | 0 | 0.0% |
| Science & Technology | 54 | 9.9% |
| Business | 84 | 15.3% |
| Education | 0 | 0.0% |
| Literature & Languages | 61 | 11.1% |
| Liberal Arts & History | 55 | 10.0% |
| Visual & Performing Arts | 12 | 2.2% |
| Communications | 24 | 4.4% |
| Arts & Humanities | 0 | 0.0% |
| Total | 548 | 100.0% |
Transportation & Commute in Castle Hill
Vehicle Availability by Sex in Castle Hill
The most prevalent vehicle ownership categories in Castle Hill are males with 2 vehicles (142, accounting for 68.3%) and females with 2 vehicles (107, making up 65.1%).
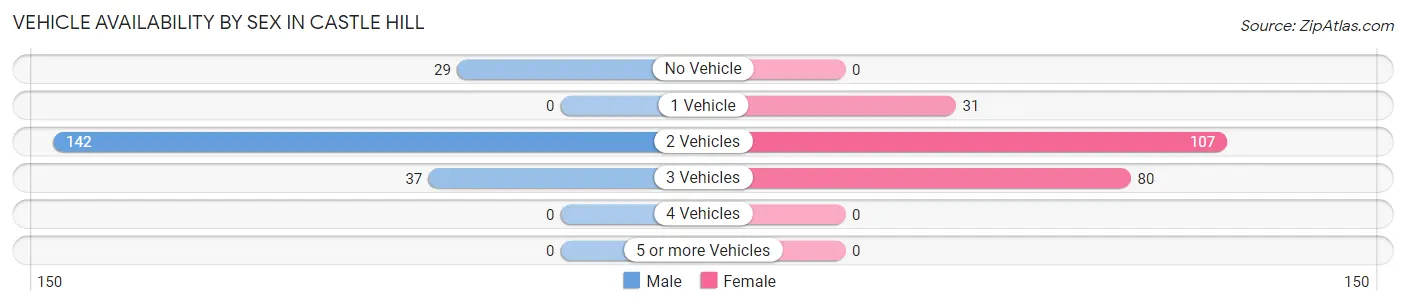
| Vehicles Available | Male | Female |
| No Vehicle | 29 (13.9%) | 0 (0.0%) |
| 1 Vehicle | 0 (0.0%) | 31 (14.2%) |
| 2 Vehicles | 142 (68.3%) | 107 (49.1%) |
| 3 Vehicles | 37 (17.8%) | 80 (36.7%) |
| 4 Vehicles | 0 (0.0%) | 0 (0.0%) |
| 5 or more Vehicles | 0 (0.0%) | 0 (0.0%) |
| Total | 208 (100.0%) | 218 (100.0%) |
Commute Time in Castle Hill
The most frequently occuring commute durations in Castle Hill are 60 to 89 minutes (61 commuters, 30.0%), 10 to 14 minutes (33 commuters, 16.3%), and 20 to 24 minutes (31 commuters, 15.3%).
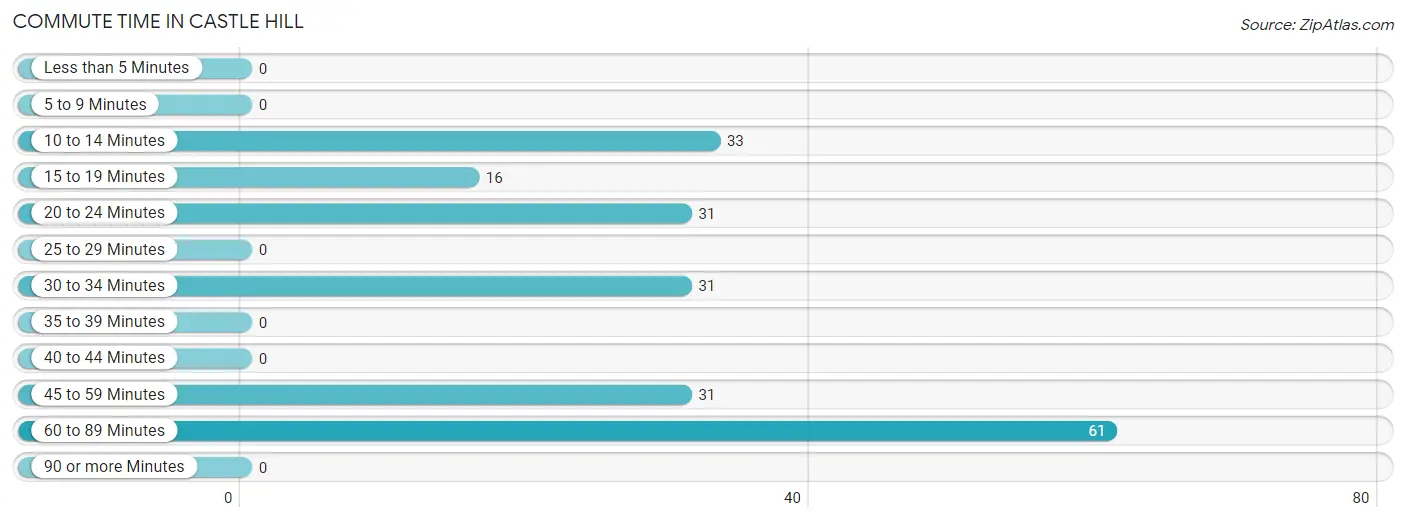
| Commute Time | # Commuters | % Commuters |
| Less than 5 Minutes | 0 | 0.0% |
| 5 to 9 Minutes | 0 | 0.0% |
| 10 to 14 Minutes | 33 | 16.3% |
| 15 to 19 Minutes | 16 | 7.9% |
| 20 to 24 Minutes | 31 | 15.3% |
| 25 to 29 Minutes | 0 | 0.0% |
| 30 to 34 Minutes | 31 | 15.3% |
| 35 to 39 Minutes | 0 | 0.0% |
| 40 to 44 Minutes | 0 | 0.0% |
| 45 to 59 Minutes | 31 | 15.3% |
| 60 to 89 Minutes | 61 | 30.0% |
| 90 or more Minutes | 0 | 0.0% |
Commute Time by Sex in Castle Hill
The most common commute times in Castle Hill are 60 to 89 minutes (24 commuters, 25.8%) for males and 60 to 89 minutes (37 commuters, 33.6%) for females.
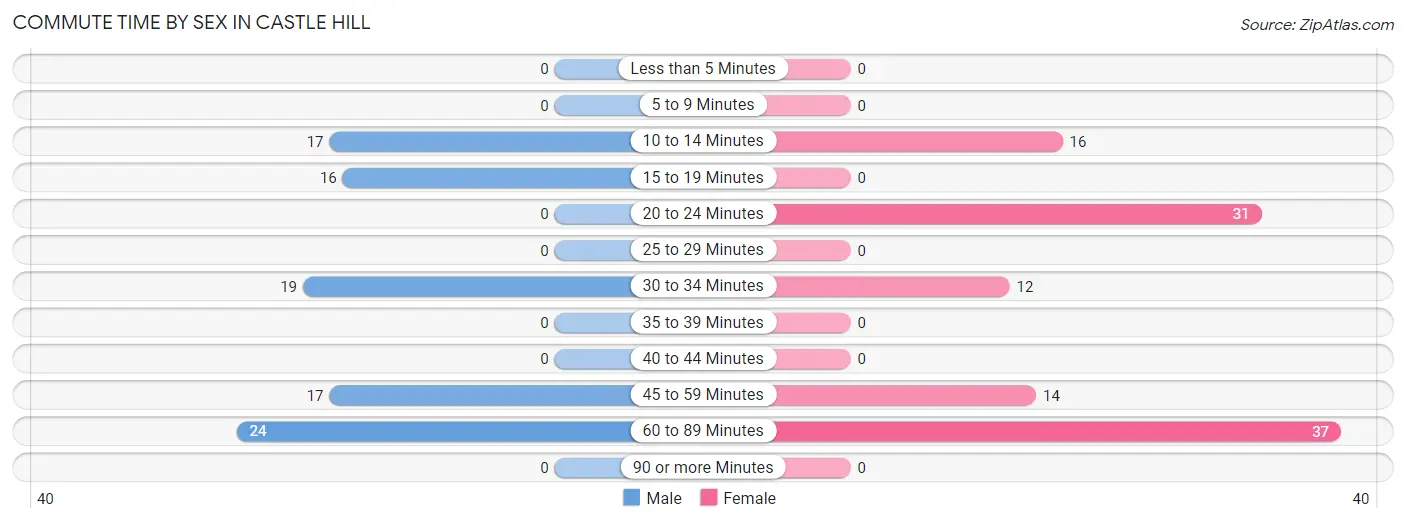
| Commute Time | Male | Female |
| Less than 5 Minutes | 0 (0.0%) | 0 (0.0%) |
| 5 to 9 Minutes | 0 (0.0%) | 0 (0.0%) |
| 10 to 14 Minutes | 17 (18.3%) | 16 (14.5%) |
| 15 to 19 Minutes | 16 (17.2%) | 0 (0.0%) |
| 20 to 24 Minutes | 0 (0.0%) | 31 (28.2%) |
| 25 to 29 Minutes | 0 (0.0%) | 0 (0.0%) |
| 30 to 34 Minutes | 19 (20.4%) | 12 (10.9%) |
| 35 to 39 Minutes | 0 (0.0%) | 0 (0.0%) |
| 40 to 44 Minutes | 0 (0.0%) | 0 (0.0%) |
| 45 to 59 Minutes | 17 (18.3%) | 14 (12.7%) |
| 60 to 89 Minutes | 24 (25.8%) | 37 (33.6%) |
| 90 or more Minutes | 0 (0.0%) | 0 (0.0%) |
Time of Departure to Work by Sex in Castle Hill
The most frequent times of departure to work in Castle Hill are 8:00 AM to 8:29 AM (36, 38.7%) for males and 8:30 AM to 8:59 AM (36, 32.7%) for females.
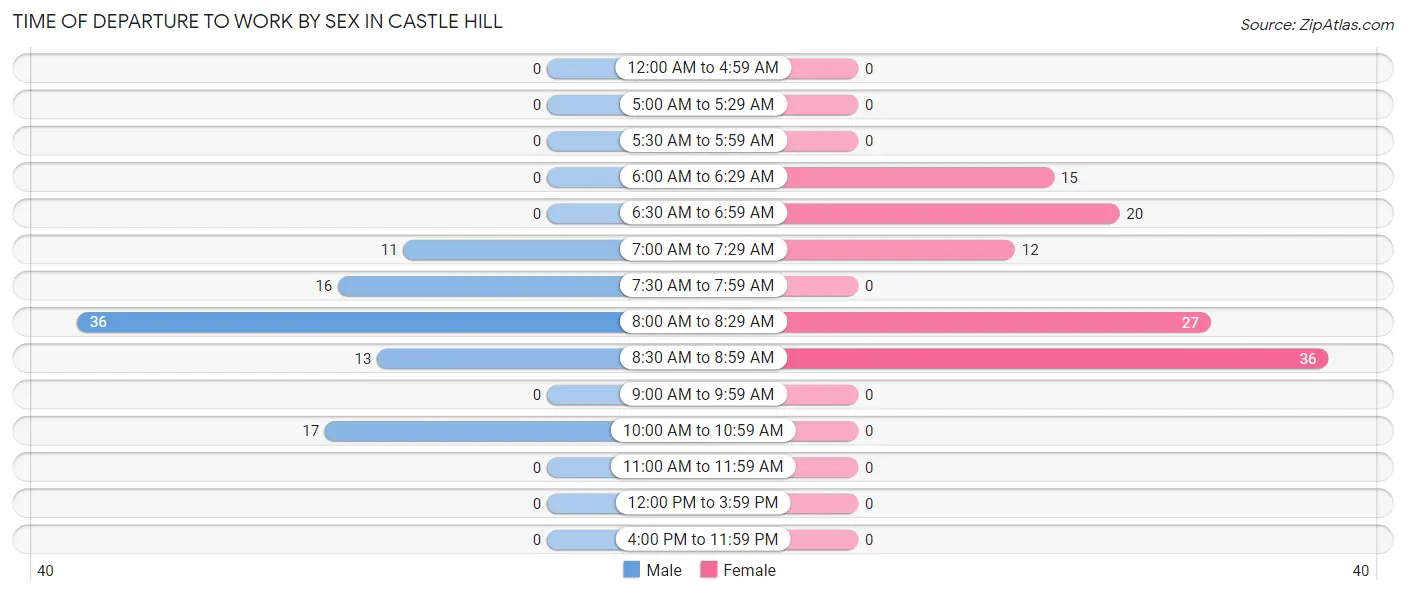
| Time of Departure | Male | Female |
| 12:00 AM to 4:59 AM | 0 (0.0%) | 0 (0.0%) |
| 5:00 AM to 5:29 AM | 0 (0.0%) | 0 (0.0%) |
| 5:30 AM to 5:59 AM | 0 (0.0%) | 0 (0.0%) |
| 6:00 AM to 6:29 AM | 0 (0.0%) | 15 (13.6%) |
| 6:30 AM to 6:59 AM | 0 (0.0%) | 20 (18.2%) |
| 7:00 AM to 7:29 AM | 11 (11.8%) | 12 (10.9%) |
| 7:30 AM to 7:59 AM | 16 (17.2%) | 0 (0.0%) |
| 8:00 AM to 8:29 AM | 36 (38.7%) | 27 (24.5%) |
| 8:30 AM to 8:59 AM | 13 (14.0%) | 36 (32.7%) |
| 9:00 AM to 9:59 AM | 0 (0.0%) | 0 (0.0%) |
| 10:00 AM to 10:59 AM | 17 (18.3%) | 0 (0.0%) |
| 11:00 AM to 11:59 AM | 0 (0.0%) | 0 (0.0%) |
| 12:00 PM to 3:59 PM | 0 (0.0%) | 0 (0.0%) |
| 4:00 PM to 11:59 PM | 0 (0.0%) | 0 (0.0%) |
| Total | 93 (100.0%) | 110 (100.0%) |
Housing Occupancy in Castle Hill
Occupancy by Ownership in Castle Hill
Of the total 380 dwellings in Castle Hill, owner-occupied units account for 363 (95.5%), while renter-occupied units make up 17 (4.5%).
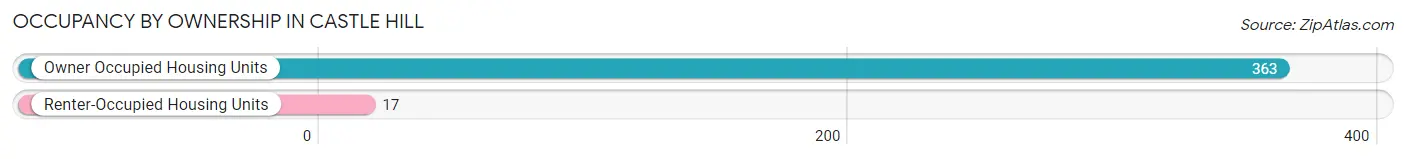
| Occupancy | # Housing Units | % Housing Units |
| Owner Occupied Housing Units | 363 | 95.5% |
| Renter-Occupied Housing Units | 17 | 4.5% |
| Total Occupied Housing Units | 380 | 100.0% |
Occupancy by Household Size in Castle Hill
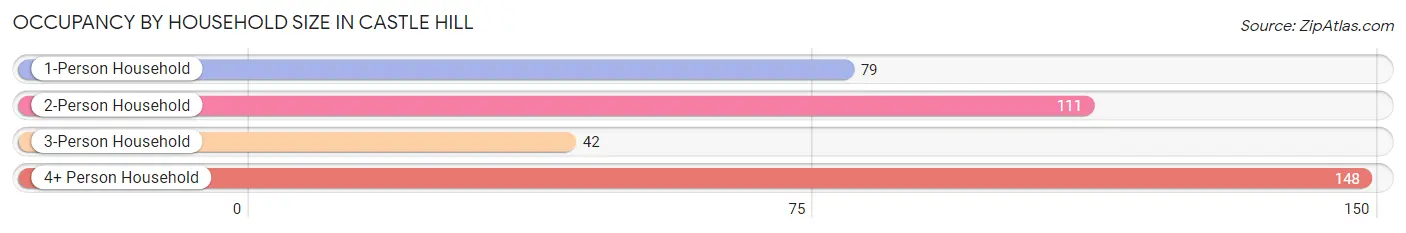
| Household Size | # Housing Units | % Housing Units |
| 1-Person Household | 79 | 20.8% |
| 2-Person Household | 111 | 29.2% |
| 3-Person Household | 42 | 11.1% |
| 4+ Person Household | 148 | 39.0% |
| Total Housing Units | 380 | 100.0% |
Occupancy by Ownership by Household Size in Castle Hill
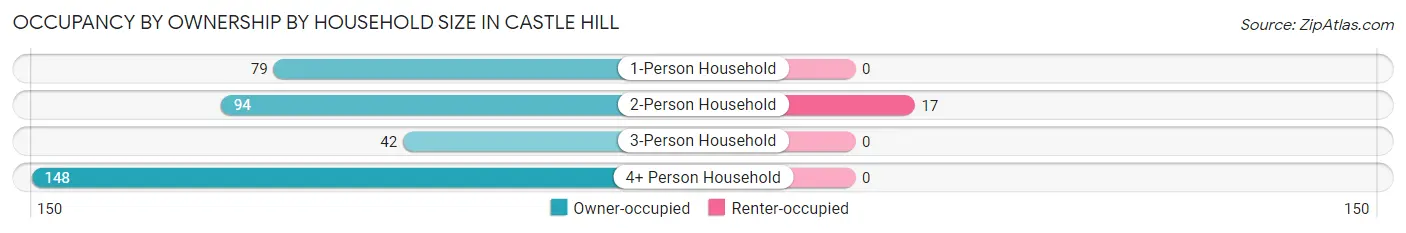
| Household Size | Owner-occupied | Renter-occupied |
| 1-Person Household | 79 (100.0%) | 0 (0.0%) |
| 2-Person Household | 94 (84.7%) | 17 (15.3%) |
| 3-Person Household | 42 (100.0%) | 0 (0.0%) |
| 4+ Person Household | 148 (100.0%) | 0 (0.0%) |
| Total Housing Units | 363 (95.5%) | 17 (4.5%) |
Occupancy by Educational Attainment in Castle Hill
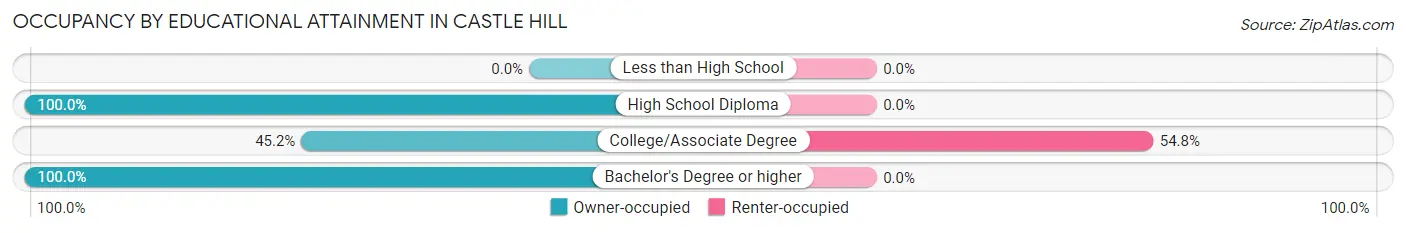
| Household Size | Owner-occupied | Renter-occupied |
| Less than High School | 0 (0.0%) | 0 (0.0%) |
| High School Diploma | 44 (100.0%) | 0 (0.0%) |
| College/Associate Degree | 14 (45.2%) | 17 (54.8%) |
| Bachelor's Degree or higher | 305 (100.0%) | 0 (0.0%) |
Occupancy by Age of Householder in Castle Hill
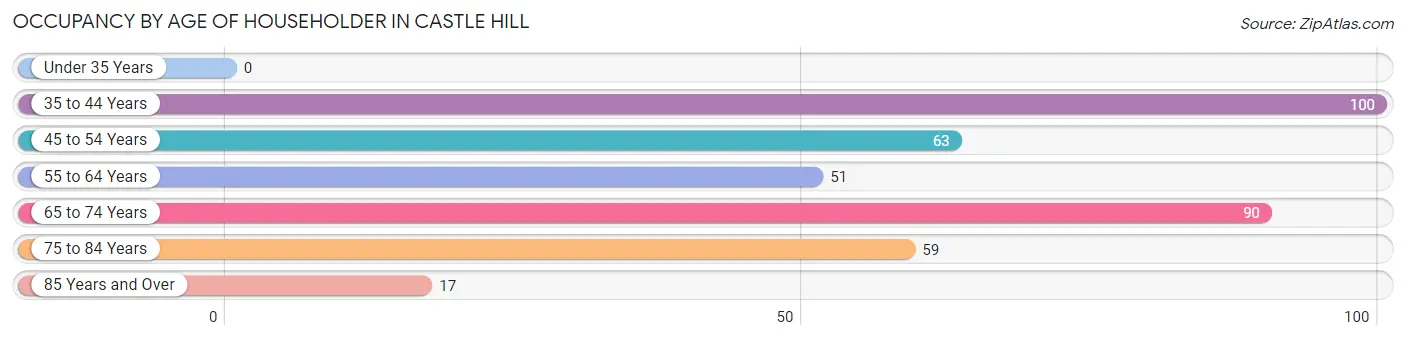
| Age Bracket | # Households | % Households |
| Under 35 Years | 0 | 0.0% |
| 35 to 44 Years | 100 | 26.3% |
| 45 to 54 Years | 63 | 16.6% |
| 55 to 64 Years | 51 | 13.4% |
| 65 to 74 Years | 90 | 23.7% |
| 75 to 84 Years | 59 | 15.5% |
| 85 Years and Over | 17 | 4.5% |
| Total | 380 | 100.0% |
Housing Finances in Castle Hill
Median Income by Occupancy in Castle Hill
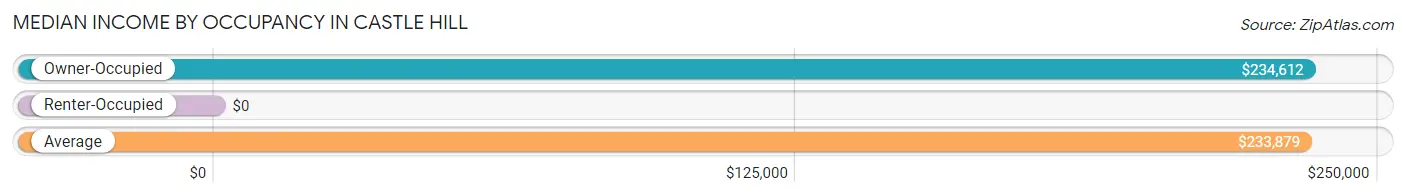
| Occupancy Type | # Households | Median Income |
| Owner-Occupied | 363 (95.5%) | $234,612 |
| Renter-Occupied | 17 (4.5%) | $0 |
| Average | 380 (100.0%) | $233,879 |
Occupancy by Householder Income Bracket in Castle Hill
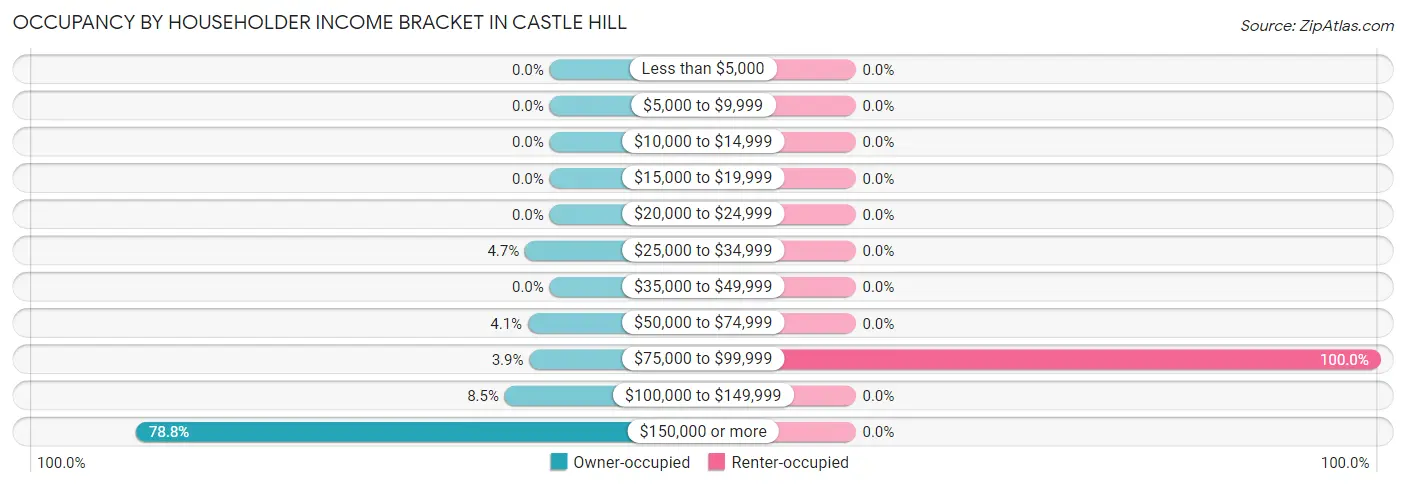
| Income Bracket | Owner-occupied | Renter-occupied |
| Less than $5,000 | 0 (0.0%) | 0 (0.0%) |
| $5,000 to $9,999 | 0 (0.0%) | 0 (0.0%) |
| $10,000 to $14,999 | 0 (0.0%) | 0 (0.0%) |
| $15,000 to $19,999 | 0 (0.0%) | 0 (0.0%) |
| $20,000 to $24,999 | 0 (0.0%) | 0 (0.0%) |
| $25,000 to $34,999 | 17 (4.7%) | 0 (0.0%) |
| $35,000 to $49,999 | 0 (0.0%) | 0 (0.0%) |
| $50,000 to $74,999 | 15 (4.1%) | 0 (0.0%) |
| $75,000 to $99,999 | 14 (3.9%) | 17 (100.0%) |
| $100,000 to $149,999 | 31 (8.5%) | 0 (0.0%) |
| $150,000 or more | 286 (78.8%) | 0 (0.0%) |
| Total | 363 (100.0%) | 17 (100.0%) |
Monthly Housing Cost Tiers in Castle Hill
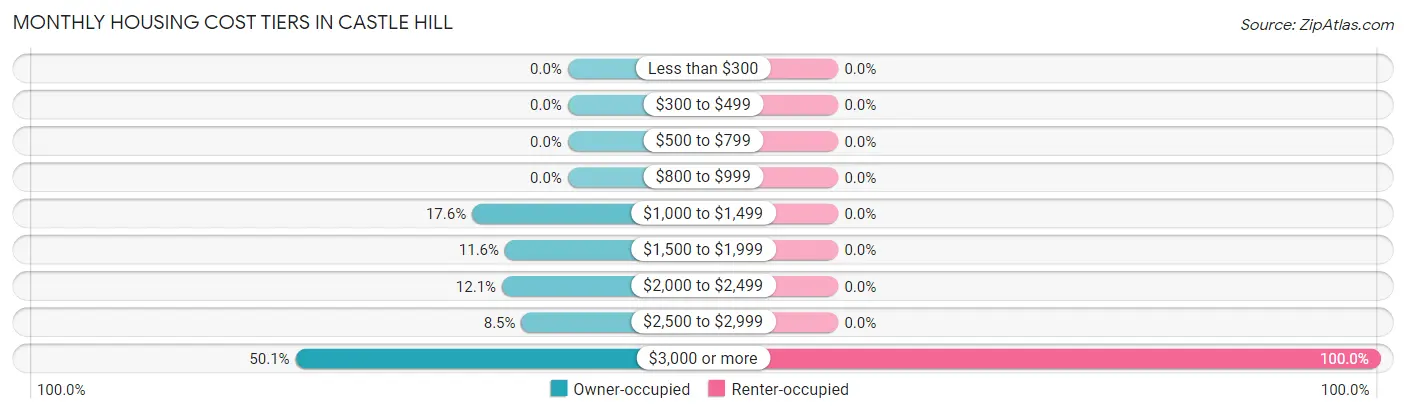
| Monthly Cost | Owner-occupied | Renter-occupied |
| Less than $300 | 0 (0.0%) | 0 (0.0%) |
| $300 to $499 | 0 (0.0%) | 0 (0.0%) |
| $500 to $799 | 0 (0.0%) | 0 (0.0%) |
| $800 to $999 | 0 (0.0%) | 0 (0.0%) |
| $1,000 to $1,499 | 64 (17.6%) | 0 (0.0%) |
| $1,500 to $1,999 | 42 (11.6%) | 0 (0.0%) |
| $2,000 to $2,499 | 44 (12.1%) | 0 (0.0%) |
| $2,500 to $2,999 | 31 (8.5%) | 0 (0.0%) |
| $3,000 or more | 182 (50.1%) | 17 (100.0%) |
| Total | 363 (100.0%) | 17 (100.0%) |
Physical Housing Characteristics in Castle Hill
Housing Structures in Castle Hill
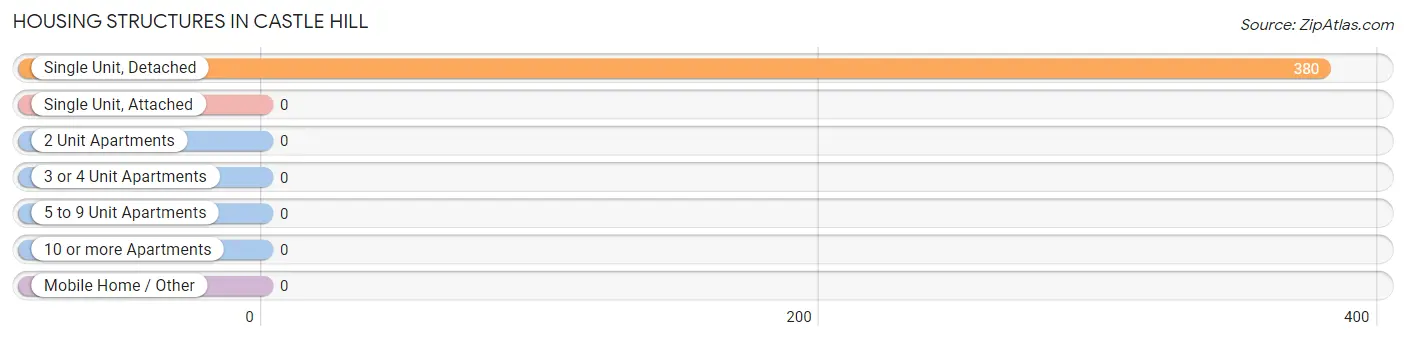
| Structure Type | # Housing Units | % Housing Units |
| Single Unit, Detached | 380 | 100.0% |
| Single Unit, Attached | 0 | 0.0% |
| 2 Unit Apartments | 0 | 0.0% |
| 3 or 4 Unit Apartments | 0 | 0.0% |
| 5 to 9 Unit Apartments | 0 | 0.0% |
| 10 or more Apartments | 0 | 0.0% |
| Mobile Home / Other | 0 | 0.0% |
| Total | 380 | 100.0% |
Housing Structures by Occupancy in Castle Hill
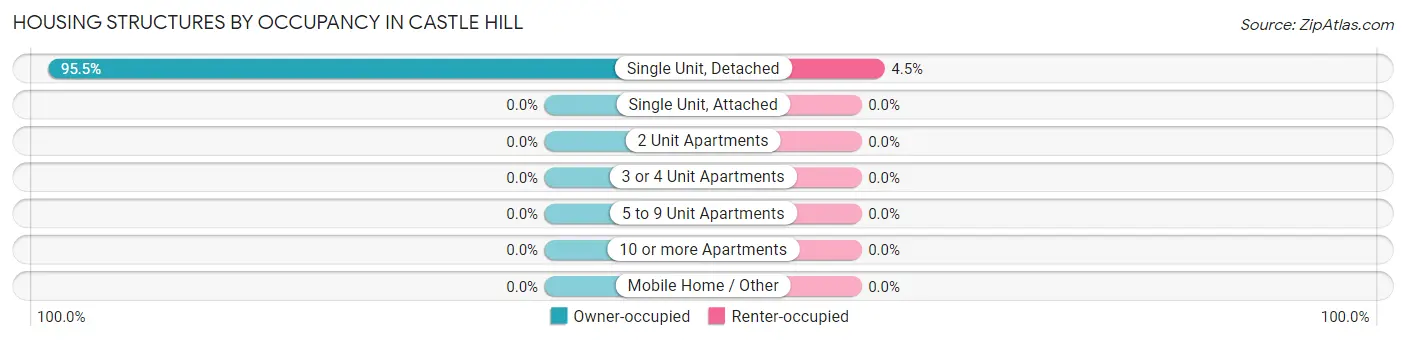
| Structure Type | Owner-occupied | Renter-occupied |
| Single Unit, Detached | 363 (95.5%) | 17 (4.5%) |
| Single Unit, Attached | 0 (0.0%) | 0 (0.0%) |
| 2 Unit Apartments | 0 (0.0%) | 0 (0.0%) |
| 3 or 4 Unit Apartments | 0 (0.0%) | 0 (0.0%) |
| 5 to 9 Unit Apartments | 0 (0.0%) | 0 (0.0%) |
| 10 or more Apartments | 0 (0.0%) | 0 (0.0%) |
| Mobile Home / Other | 0 (0.0%) | 0 (0.0%) |
| Total | 363 (95.5%) | 17 (4.5%) |
Housing Structures by Number of Rooms in Castle Hill
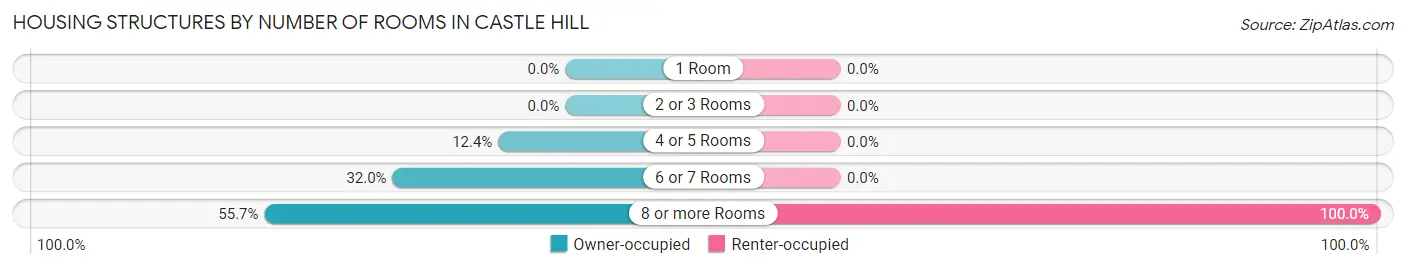
| Number of Rooms | Owner-occupied | Renter-occupied |
| 1 Room | 0 (0.0%) | 0 (0.0%) |
| 2 or 3 Rooms | 0 (0.0%) | 0 (0.0%) |
| 4 or 5 Rooms | 45 (12.4%) | 0 (0.0%) |
| 6 or 7 Rooms | 116 (32.0%) | 0 (0.0%) |
| 8 or more Rooms | 202 (55.6%) | 17 (100.0%) |
| Total | 363 (100.0%) | 17 (100.0%) |
Housing Structure by Heating Type in Castle Hill
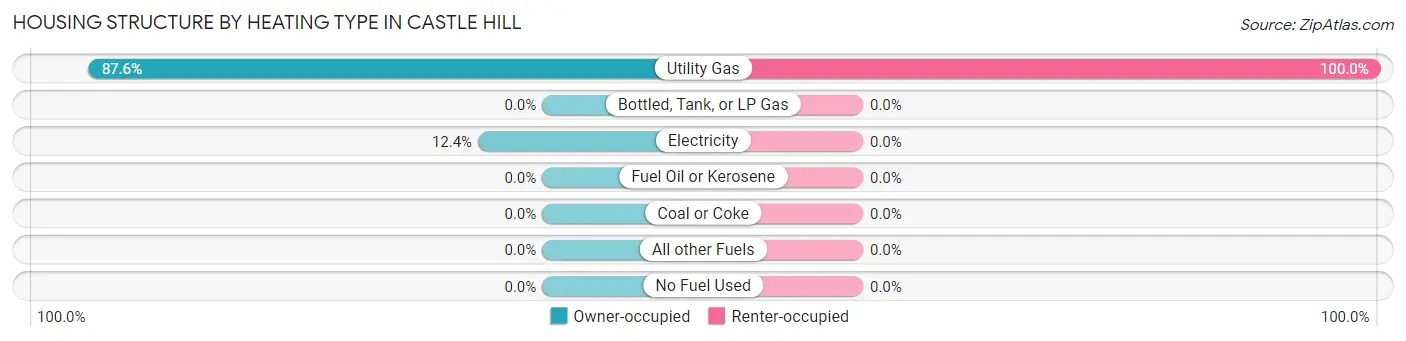
| Heating Type | Owner-occupied | Renter-occupied |
| Utility Gas | 318 (87.6%) | 17 (100.0%) |
| Bottled, Tank, or LP Gas | 0 (0.0%) | 0 (0.0%) |
| Electricity | 45 (12.4%) | 0 (0.0%) |
| Fuel Oil or Kerosene | 0 (0.0%) | 0 (0.0%) |
| Coal or Coke | 0 (0.0%) | 0 (0.0%) |
| All other Fuels | 0 (0.0%) | 0 (0.0%) |
| No Fuel Used | 0 (0.0%) | 0 (0.0%) |
| Total | 363 (100.0%) | 17 (100.0%) |
Household Vehicle Usage in Castle Hill
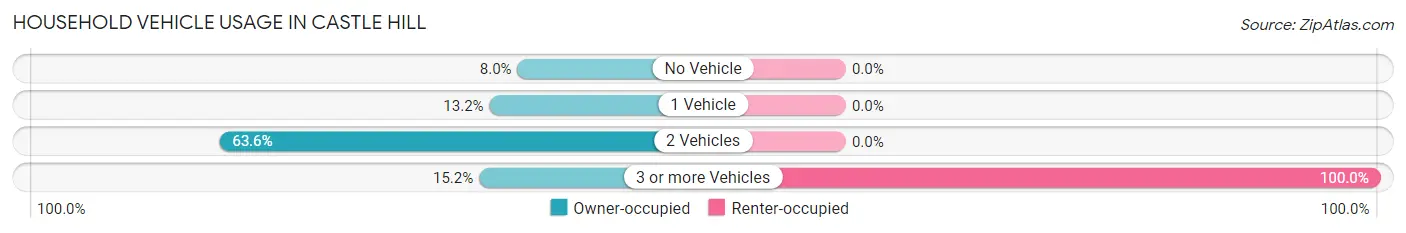
| Vehicles per Household | Owner-occupied | Renter-occupied |
| No Vehicle | 29 (8.0%) | 0 (0.0%) |
| 1 Vehicle | 48 (13.2%) | 0 (0.0%) |
| 2 Vehicles | 231 (63.6%) | 0 (0.0%) |
| 3 or more Vehicles | 55 (15.1%) | 17 (100.0%) |
| Total | 363 (100.0%) | 17 (100.0%) |
Real Estate & Mortgages in Castle Hill
Real Estate and Mortgage Overview in Castle Hill
| Characteristic | Without Mortgage | With Mortgage |
| Housing Units | 118 | 245 |
| Median Property Value | $1,941,200 | $1,627,700 |
| Median Household Income | $242,500 | $200 |
| Monthly Housing Costs | $1,501 | $182 |
| Real Estate Taxes | $10,001 | $0 |
Property Value by Mortgage Status in Castle Hill
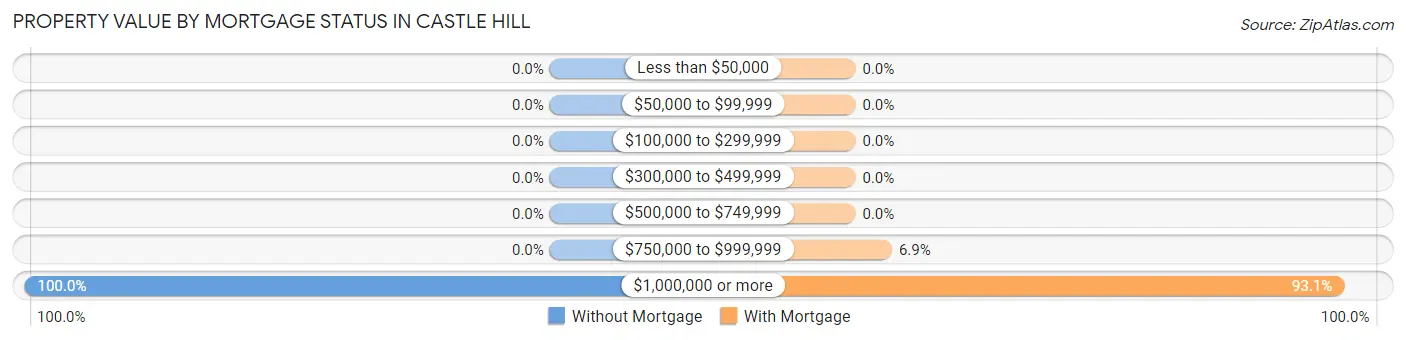
| Property Value | Without Mortgage | With Mortgage |
| Less than $50,000 | 0 (0.0%) | 0 (0.0%) |
| $50,000 to $99,999 | 0 (0.0%) | 0 (0.0%) |
| $100,000 to $299,999 | 0 (0.0%) | 0 (0.0%) |
| $300,000 to $499,999 | 0 (0.0%) | 0 (0.0%) |
| $500,000 to $749,999 | 0 (0.0%) | 0 (0.0%) |
| $750,000 to $999,999 | 0 (0.0%) | 17 (6.9%) |
| $1,000,000 or more | 118 (100.0%) | 228 (93.1%) |
| Total | 118 (100.0%) | 245 (100.0%) |
Household Income by Mortgage Status in Castle Hill
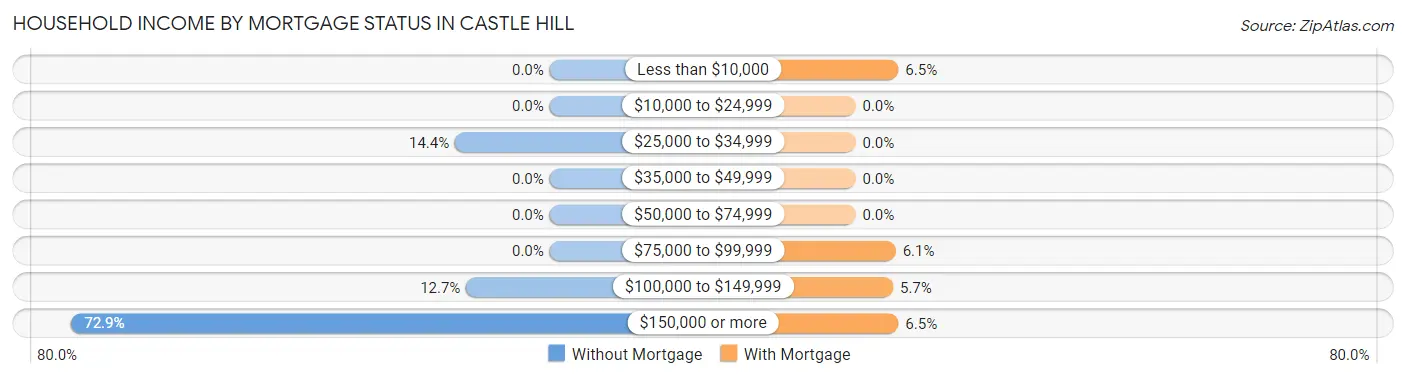
| Household Income | Without Mortgage | With Mortgage |
| Less than $10,000 | 0 (0.0%) | 16 (6.5%) |
| $10,000 to $24,999 | 0 (0.0%) | 0 (0.0%) |
| $25,000 to $34,999 | 17 (14.4%) | 0 (0.0%) |
| $35,000 to $49,999 | 0 (0.0%) | 0 (0.0%) |
| $50,000 to $74,999 | 0 (0.0%) | 0 (0.0%) |
| $75,000 to $99,999 | 0 (0.0%) | 15 (6.1%) |
| $100,000 to $149,999 | 15 (12.7%) | 14 (5.7%) |
| $150,000 or more | 86 (72.9%) | 16 (6.5%) |
| Total | 118 (100.0%) | 245 (100.0%) |
Property Value to Household Income Ratio in Castle Hill
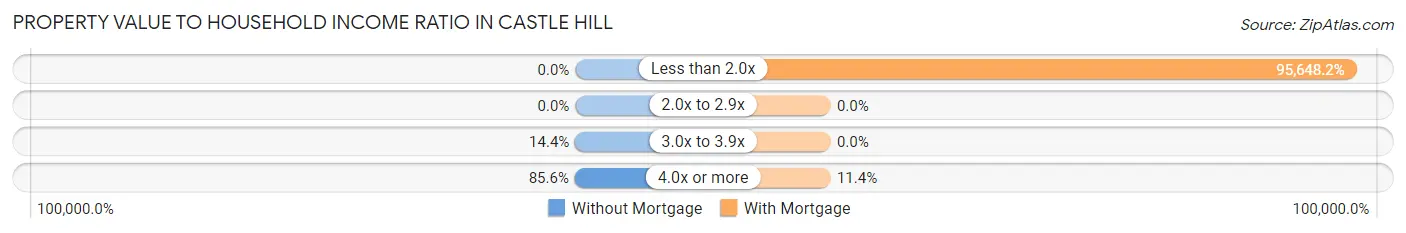
| Value-to-Income Ratio | Without Mortgage | With Mortgage |
| Less than 2.0x | 0 (0.0%) | 234,338 (95,648.2%) |
| 2.0x to 2.9x | 0 (0.0%) | 0 (0.0%) |
| 3.0x to 3.9x | 17 (14.4%) | 0 (0.0%) |
| 4.0x or more | 101 (85.6%) | 28 (11.4%) |
| Total | 118 (100.0%) | 245 (100.0%) |
Real Estate Taxes by Mortgage Status in Castle Hill
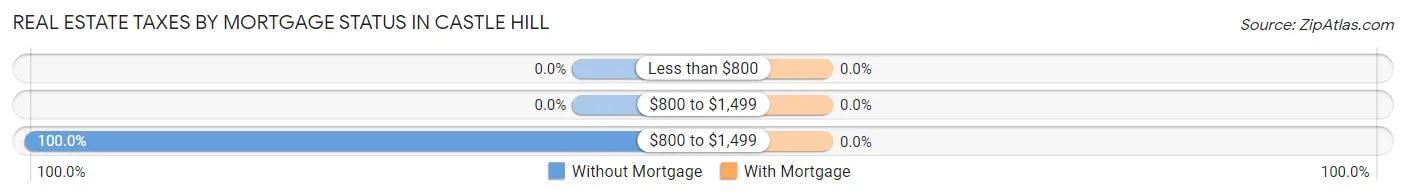
| Property Taxes | Without Mortgage | With Mortgage |
| Less than $800 | 0 (0.0%) | 0 (0.0%) |
| $800 to $1,499 | 0 (0.0%) | 0 (0.0%) |
| $800 to $1,499 | 118 (100.0%) | 0 (0.0%) |
| Total | 118 (100.0%) | 245 (100.0%) |
Health & Disability in Castle Hill
Health Insurance Coverage by Age in Castle Hill
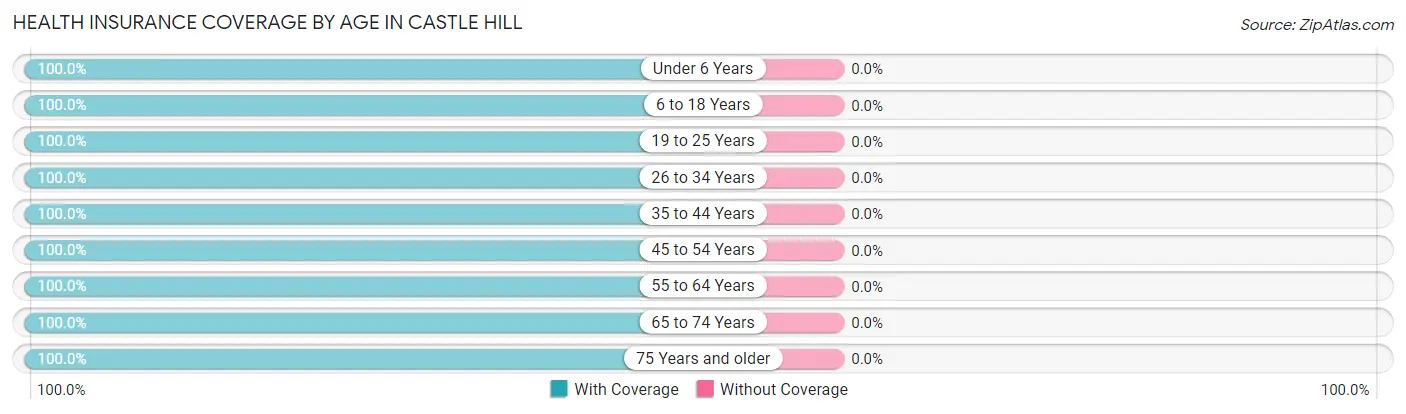
| Age Bracket | With Coverage | Without Coverage |
| Under 6 Years | 107 (100.0%) | 0 (0.0%) |
| 6 to 18 Years | 191 (100.0%) | 0 (0.0%) |
| 19 to 25 Years | 29 (100.0%) | 0 (0.0%) |
| 26 to 34 Years | 12 (100.0%) | 0 (0.0%) |
| 35 to 44 Years | 179 (100.0%) | 0 (0.0%) |
| 45 to 54 Years | 135 (100.0%) | 0 (0.0%) |
| 55 to 64 Years | 102 (100.0%) | 0 (0.0%) |
| 65 to 74 Years | 179 (100.0%) | 0 (0.0%) |
| 75 Years and older | 76 (100.0%) | 0 (0.0%) |
| Total | 1,010 (100.0%) | 0 (0.0%) |
Health Insurance Coverage by Citizenship Status in Castle Hill
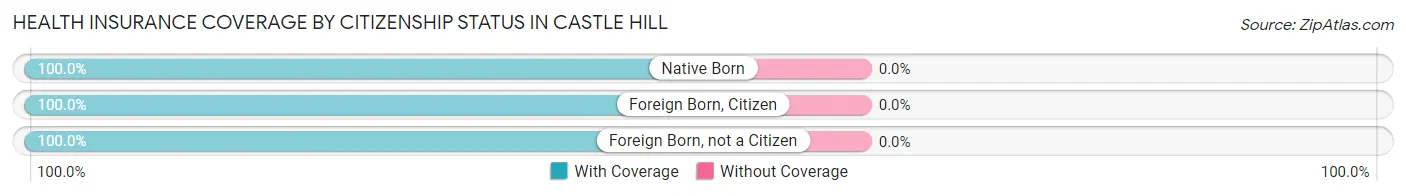
| Citizenship Status | With Coverage | Without Coverage |
| Native Born | 107 (100.0%) | 0 (0.0%) |
| Foreign Born, Citizen | 191 (100.0%) | 0 (0.0%) |
| Foreign Born, not a Citizen | 29 (100.0%) | 0 (0.0%) |
Health Insurance Coverage by Household Income in Castle Hill
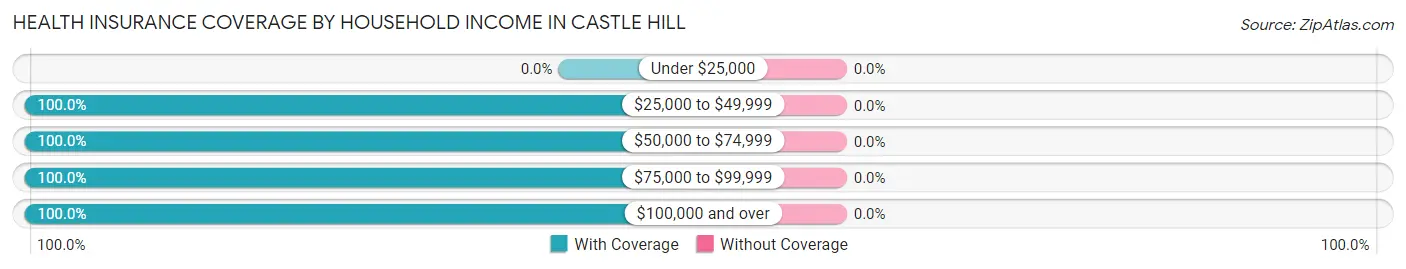
| Household Income | With Coverage | Without Coverage |
| Under $25,000 | 0 (0.0%) | 0 (0.0%) |
| $25,000 to $49,999 | 17 (100.0%) | 0 (0.0%) |
| $50,000 to $74,999 | 31 (100.0%) | 0 (0.0%) |
| $75,000 to $99,999 | 47 (100.0%) | 0 (0.0%) |
| $100,000 and over | 907 (100.0%) | 0 (0.0%) |
Public vs Private Health Insurance Coverage by Age in Castle Hill
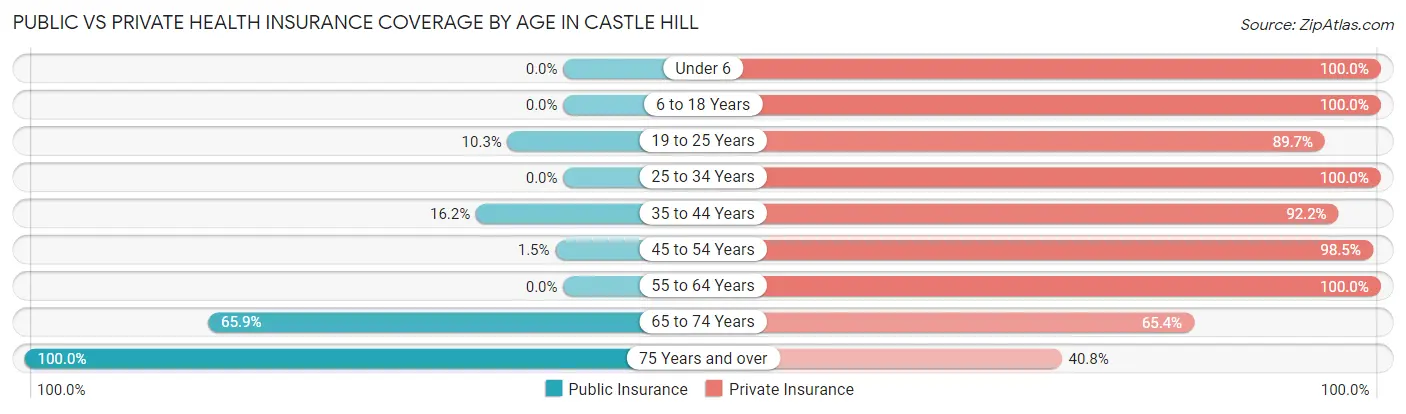
| Age Bracket | Public Insurance | Private Insurance |
| Under 6 | 0 (0.0%) | 107 (100.0%) |
| 6 to 18 Years | 0 (0.0%) | 191 (100.0%) |
| 19 to 25 Years | 3 (10.3%) | 26 (89.7%) |
| 25 to 34 Years | 0 (0.0%) | 12 (100.0%) |
| 35 to 44 Years | 29 (16.2%) | 165 (92.2%) |
| 45 to 54 Years | 2 (1.5%) | 133 (98.5%) |
| 55 to 64 Years | 0 (0.0%) | 102 (100.0%) |
| 65 to 74 Years | 118 (65.9%) | 117 (65.4%) |
| 75 Years and over | 76 (100.0%) | 31 (40.8%) |
| Total | 228 (22.6%) | 884 (87.5%) |
Disability Status by Sex by Age in Castle Hill
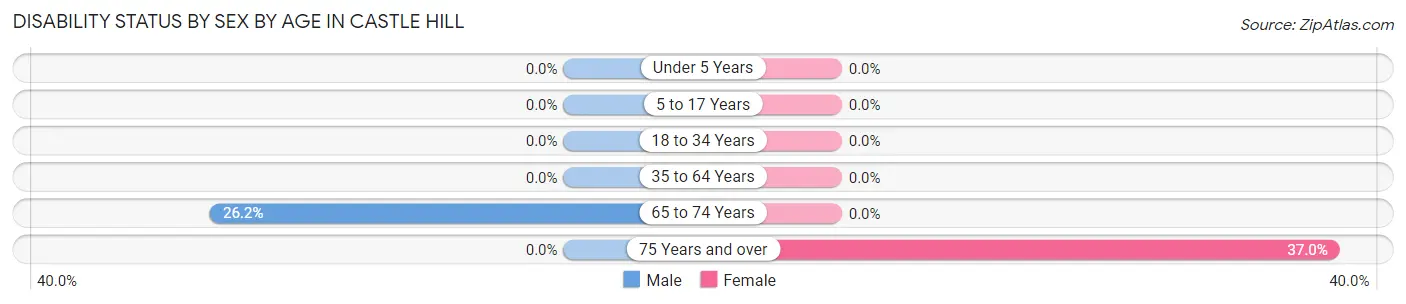
| Age Bracket | Male | Female |
| Under 5 Years | 0 (0.0%) | 0 (0.0%) |
| 5 to 17 Years | 0 (0.0%) | 0 (0.0%) |
| 18 to 34 Years | 0 (0.0%) | 0 (0.0%) |
| 35 to 64 Years | 0 (0.0%) | 0 (0.0%) |
| 65 to 74 Years | 16 (26.2%) | 0 (0.0%) |
| 75 Years and over | 0 (0.0%) | 17 (37.0%) |
Disability Class by Sex by Age in Castle Hill
Disability Class: Hearing Difficulty
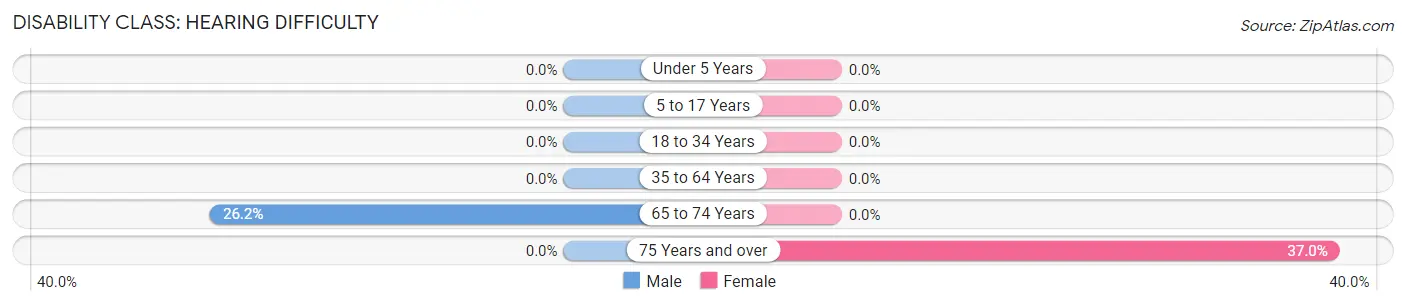
| Age Bracket | Male | Female |
| Under 5 Years | 0 (0.0%) | 0 (0.0%) |
| 5 to 17 Years | 0 (0.0%) | 0 (0.0%) |
| 18 to 34 Years | 0 (0.0%) | 0 (0.0%) |
| 35 to 64 Years | 0 (0.0%) | 0 (0.0%) |
| 65 to 74 Years | 16 (26.2%) | 0 (0.0%) |
| 75 Years and over | 0 (0.0%) | 17 (37.0%) |
Disability Class: Vision Difficulty
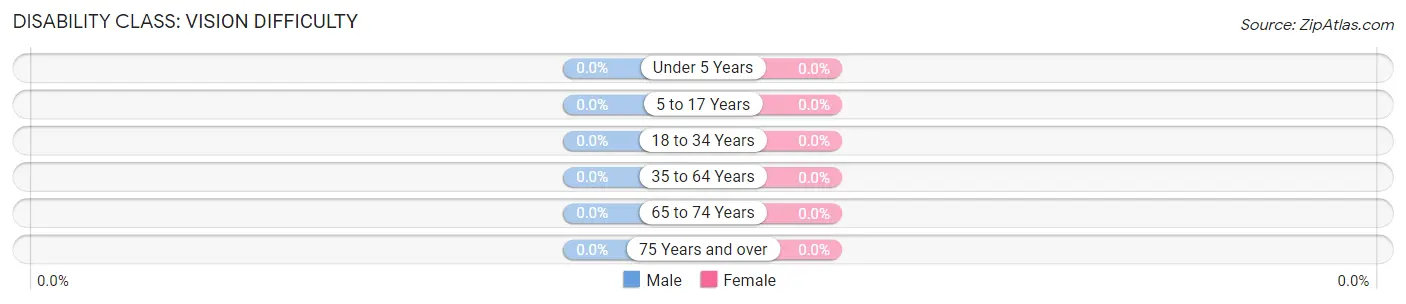
| Age Bracket | Male | Female |
| Under 5 Years | 0 (0.0%) | 0 (0.0%) |
| 5 to 17 Years | 0 (0.0%) | 0 (0.0%) |
| 18 to 34 Years | 0 (0.0%) | 0 (0.0%) |
| 35 to 64 Years | 0 (0.0%) | 0 (0.0%) |
| 65 to 74 Years | 0 (0.0%) | 0 (0.0%) |
| 75 Years and over | 0 (0.0%) | 0 (0.0%) |
Disability Class: Cognitive Difficulty
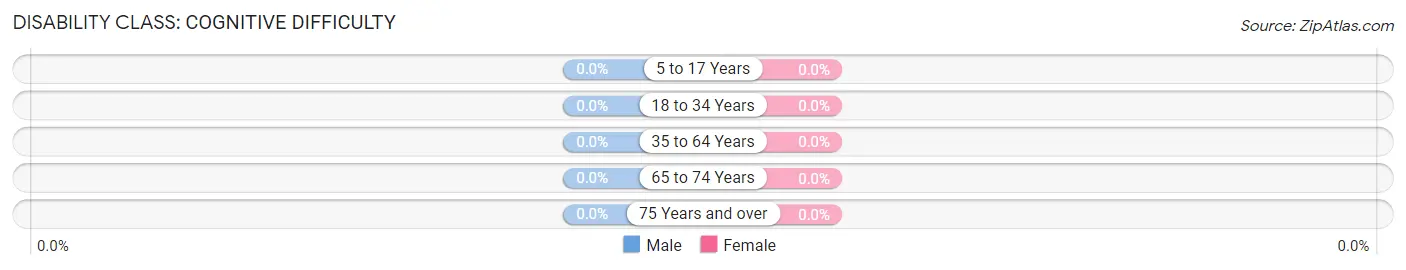
| Age Bracket | Male | Female |
| 5 to 17 Years | 0 (0.0%) | 0 (0.0%) |
| 18 to 34 Years | 0 (0.0%) | 0 (0.0%) |
| 35 to 64 Years | 0 (0.0%) | 0 (0.0%) |
| 65 to 74 Years | 0 (0.0%) | 0 (0.0%) |
| 75 Years and over | 0 (0.0%) | 0 (0.0%) |
Disability Class: Ambulatory Difficulty
| Age Bracket | Male | Female |
| 5 to 17 Years | 0 (0.0%) | 0 (0.0%) |
| 18 to 34 Years | 0 (0.0%) | 0 (0.0%) |
| 35 to 64 Years | 0 (0.0%) | 0 (0.0%) |
| 65 to 74 Years | 0 (0.0%) | 0 (0.0%) |
| 75 Years and over | 0 (0.0%) | 0 (0.0%) |
Disability Class: Self-Care Difficulty
| Age Bracket | Male | Female |
| 5 to 17 Years | 0 (0.0%) | 0 (0.0%) |
| 18 to 34 Years | 0 (0.0%) | 0 (0.0%) |
| 35 to 64 Years | 0 (0.0%) | 0 (0.0%) |
| 65 to 74 Years | 0 (0.0%) | 0 (0.0%) |
| 75 Years and over | 0 (0.0%) | 0 (0.0%) |
Technology Access in Castle Hill
Computing Device Access in Castle Hill
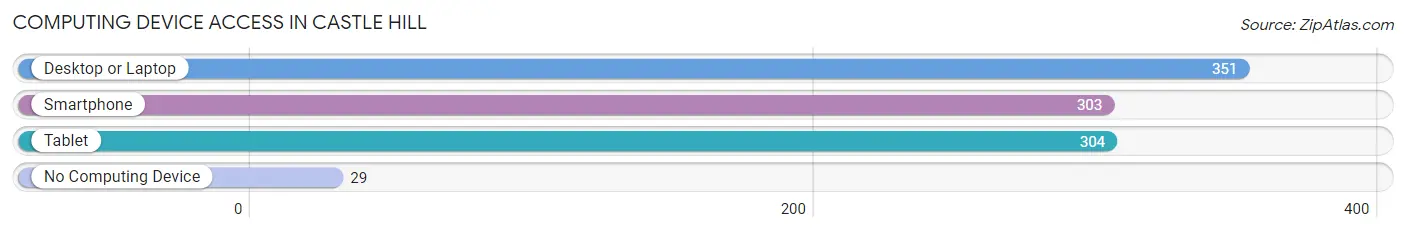
| Device Type | # Households | % Households |
| Desktop or Laptop | 351 | 92.4% |
| Smartphone | 303 | 79.7% |
| Tablet | 304 | 80.0% |
| No Computing Device | 29 | 7.6% |
| Total | 380 | 100.0% |
Internet Access in Castle Hill
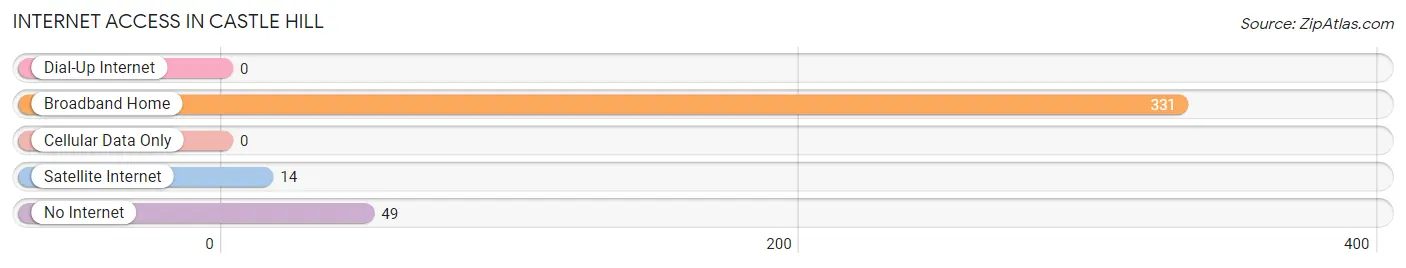
| Internet Type | # Households | % Households |
| Dial-Up Internet | 0 | 0.0% |
| Broadband Home | 331 | 87.1% |
| Cellular Data Only | 0 | 0.0% |
| Satellite Internet | 14 | 3.7% |
| No Internet | 49 | 12.9% |
| Total | 380 | 100.0% |
Castle Hill Summary
Castle Hill is a small unincorporated community located in the foothills of the Sierra Nevada Mountains in California. It is situated in the northern part of the state, approximately 30 miles east of the city of Sacramento. The community is located in El Dorado County and is part of the greater Sacramento metropolitan area.
History
The area that is now Castle Hill was originally inhabited by the Nisenan Native Americans. The first European settlers arrived in the area in the early 1850s and began to establish farms and ranches. The community was named after a nearby hill that was shaped like a castle. The area was primarily used for cattle ranching and farming until the early 1900s when the timber industry began to take off. The timber industry was the primary source of employment for the area until the late 1950s when the timber industry began to decline.
Geography
Castle Hill is located in the foothills of the Sierra Nevada Mountains in California. It is situated in the northern part of the state, approximately 30 miles east of the city of Sacramento. The community is located in El Dorado County and is part of the greater Sacramento metropolitan area. The area is characterized by rolling hills and valleys, with elevations ranging from 1,000 to 2,000 feet. The climate is generally mild, with hot summers and cool winters.
Economy
The economy of Castle Hill is primarily based on agriculture and tourism. The area is home to several wineries and vineyards, as well as a number of small farms and ranches. Tourism is also an important part of the local economy, with visitors coming to the area to enjoy the scenic beauty and outdoor activities. The area is also home to a number of small businesses, including restaurants, shops, and other services.
Demographics
As of the 2010 census, the population of Castle Hill was 1,845. The population is primarily white (90.2%), with a small percentage of African Americans (2.2%), Asians (2.1%), and Native Americans (1.2%). The median household income is $50,945, and the median age is 44. The area is served by the El Dorado County School District, which includes two elementary schools, one middle school, and one high school.
Conclusion
Castle Hill is a small unincorporated community located in the foothills of the Sierra Nevada Mountains in California. It is situated in the northern part of the state, approximately 30 miles east of the city of Sacramento. The community is characterized by rolling hills and valleys, with elevations ranging from 1,000 to 2,000 feet. The economy of Castle Hill is primarily based on agriculture and tourism, with visitors coming to the area to enjoy the scenic beauty and outdoor activities. The population of Castle Hill is primarily white, with a median household income of $50,945 and a median age of 44.
Common Questions
What is Per Capita Income in Castle Hill?
Per Capita income in Castle Hill is $100,270.
What is the Median Family Income in Castle Hill?
Median Family Income in Castle Hill is $250,001.
What is the Median Household income in Castle Hill?
Median Household Income in Castle Hill is $233,879.
What is Income or Wage Gap in Castle Hill?
Income or Wage Gap in Castle Hill is 14.9%.
Women in Castle Hill earn 85.1 cents for every dollar earned by a man.
What is Inequality or Gini Index in Castle Hill?
Inequality or Gini Index in Castle Hill is 0.31.
What is the Total Population of Castle Hill?
Total Population of Castle Hill is 1,010.
What is the Total Male Population of Castle Hill?
Total Male Population of Castle Hill is 460.
What is the Total Female Population of Castle Hill?
Total Female Population of Castle Hill is 550.
What is the Ratio of Males per 100 Females in Castle Hill?
There are 83.64 Males per 100 Females in Castle Hill.
What is the Ratio of Females per 100 Males in Castle Hill?
There are 119.57 Females per 100 Males in Castle Hill.
What is the Median Population Age in Castle Hill?
Median Population Age in Castle Hill is 43.2 Years.
What is the Average Family Size in Castle Hill
Average Family Size in Castle Hill is 3.1 People.
What is the Average Household Size in Castle Hill
Average Household Size in Castle Hill is 2.6 People.
How Large is the Labor Force in Castle Hill?
There are 443 People in the Labor Forcein in Castle Hill.
What is the Percentage of People in the Labor Force in Castle Hill?
62.2% of People are in the Labor Force in Castle Hill.