Zip Codes with the Highest Percentage of Population Employed in Architecture & Engineering in Rancho Santa Fe, CA
RELATED REPORTS & OPTIONS
Architecture & Engineering
Rancho Santa Fe
Compare Zip Codes
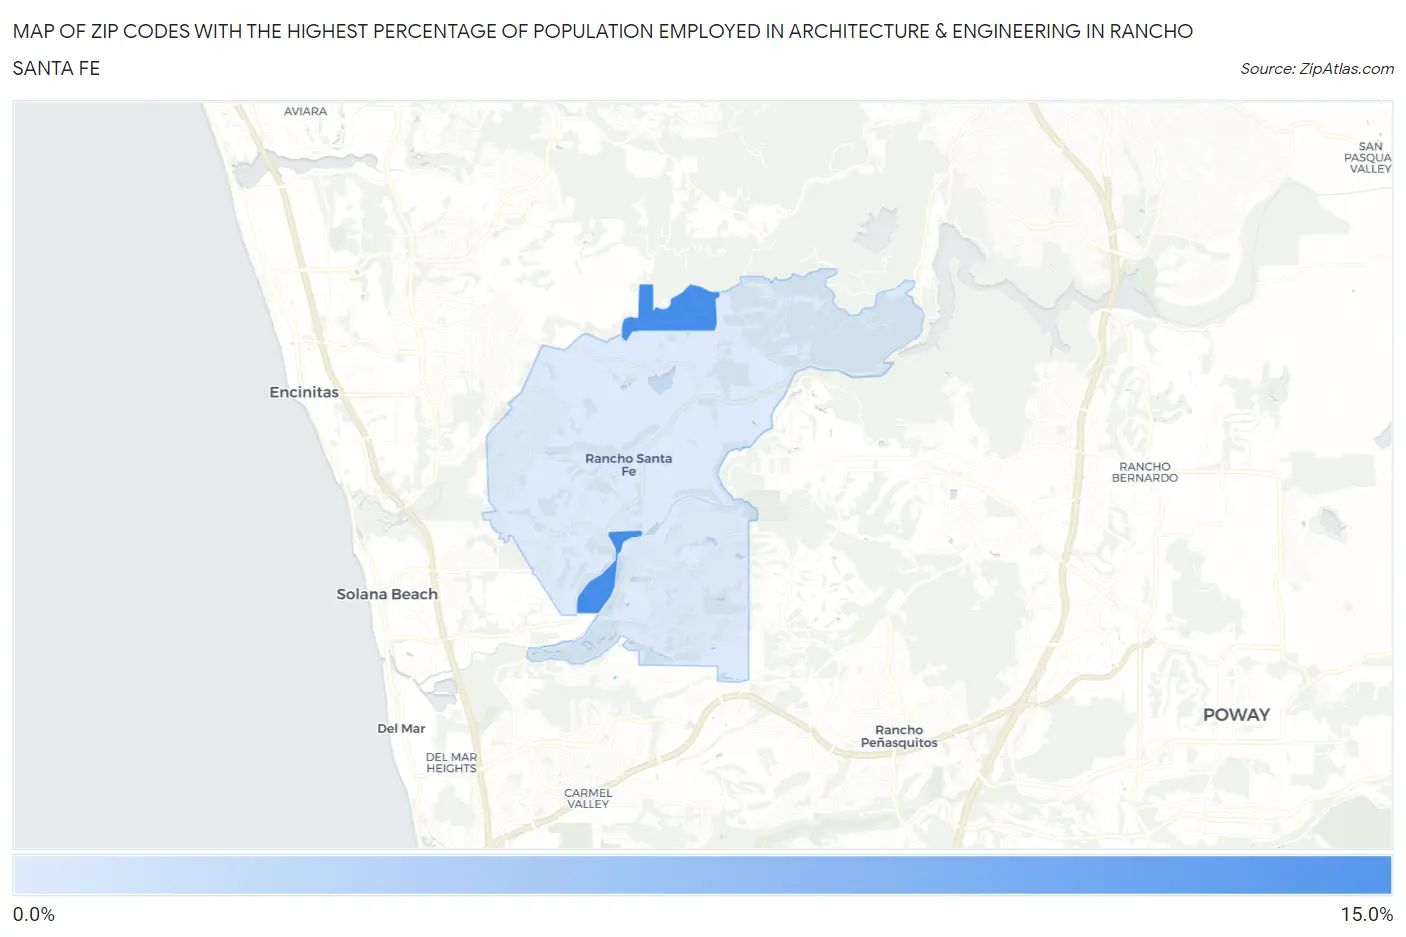
Map of Zip Codes with the Highest Percentage of Population Employed in Architecture & Engineering in Rancho Santa Fe
4.8%
12.9%
Zip Codes with the Highest Percentage of Population Employed in Architecture & Engineering in Rancho Santa Fe, CA
| Zip Code | % Employed | vs State | vs National | |
| 1. | 92091 | 12.9% | 2.6%(+10.4)#17 | 2.1%(+10.8)#201 |
| 2. | 92067 | 4.8% | 2.6%(+2.26)#174 | 2.1%(+2.67)#1,818 |
1
Common Questions
What are the Top Zip Codes with the Highest Percentage of Population Employed in Architecture & Engineering in Rancho Santa Fe, CA?
Top Zip Codes with the Highest Percentage of Population Employed in Architecture & Engineering in Rancho Santa Fe, CA are:
What zip code has the Highest Percentage of Population Employed in Architecture & Engineering in Rancho Santa Fe, CA?
92091 has the Highest Percentage of Population Employed in Architecture & Engineering in Rancho Santa Fe, CA with 12.9%.
What is the Percentage of Population Employed in Architecture & Engineering in Rancho Santa Fe, CA?
Percentage of Population Employed in Architecture & Engineering in Rancho Santa Fe is 1.8%.
What is the Percentage of Population Employed in Architecture & Engineering in California?
Percentage of Population Employed in Architecture & Engineering in California is 2.6%.
What is the Percentage of Population Employed in Architecture & Engineering in the United States?
Percentage of Population Employed in Architecture & Engineering in the United States is 2.1%.