La Habra Heights, CA Map & Demographics
La Habra Heights Map
La Habra Heights Overview
$89,507
PER CAPITA INCOME
$195,250
AVG FAMILY INCOME
$179,990
AVG HOUSEHOLD INCOME
49.7%
WAGE / INCOME GAP [ % ]
50.3¢/ $1
WAGE / INCOME GAP [ $ ]
$13,919
FAMILY INCOME DEFICIT
0.46
INEQUALITY / GINI INDEX
5,599
TOTAL POPULATION
2,748
MALE POPULATION
2,851
FEMALE POPULATION
96.39
MALES / 100 FEMALES
103.75
FEMALES / 100 MALES
47.6
MEDIAN AGE
3.2
AVG FAMILY SIZE
2.9
AVG HOUSEHOLD SIZE
3,046
LABOR FORCE [ PEOPLE ]
63.5%
PERCENT IN LABOR FORCE
1.8%
UNEMPLOYMENT RATE
La Habra Heights Area Codes
Income in La Habra Heights
Income Overview in La Habra Heights
Per Capita Income in La Habra Heights is $89,507, while median incomes of families and households are $195,250 and $179,990 respectively.
| Characteristic | Number | Measure |
| Per Capita Income | 5,599 | $89,507 |
| Median Family Income | 1,473 | $195,250 |
| Mean Family Income | 1,473 | $255,509 |
| Median Household Income | 1,927 | $179,990 |
| Mean Household Income | 1,927 | $256,205 |
| Income Deficit | 1,473 | $13,919 |
| Wage / Income Gap (%) | 5,599 | 49.70% |
| Wage / Income Gap ($) | 5,599 | 50.30¢ per $1 |
| Gini / Inequality Index | 5,599 | 0.46 |
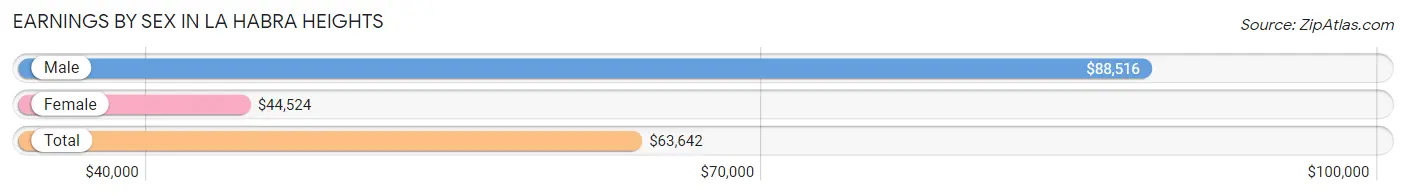
Earnings by Sex in La Habra Heights
Average Earnings in La Habra Heights are $63,642, $88,516 for men and $44,524 for women, a difference of 49.7%.
| Sex | Number | Average Earnings |
| Male | 1,829 (55.9%) | $88,516 |
| Female | 1,440 (44.1%) | $44,524 |
| Total | 3,269 (100.0%) | $63,642 |
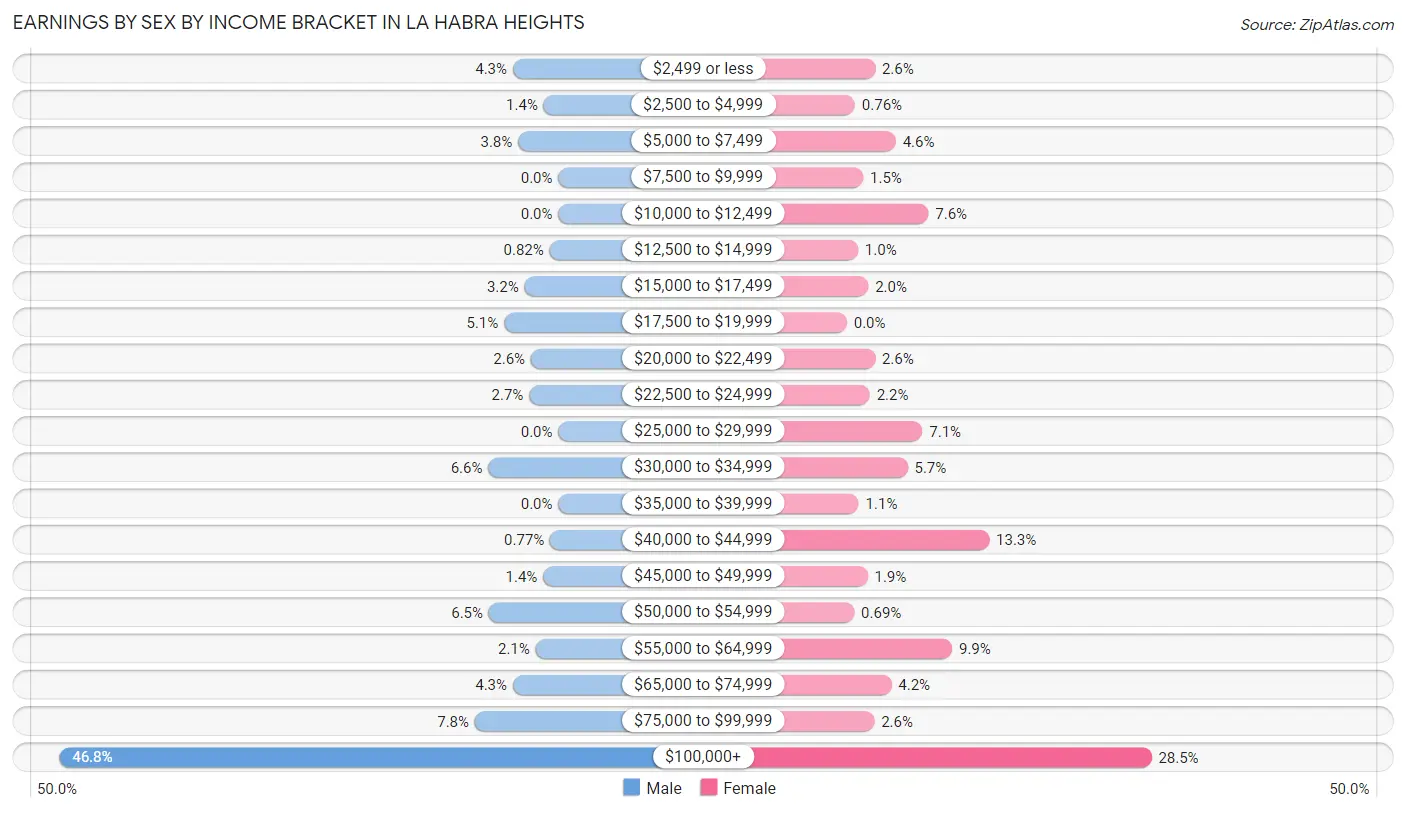
Earnings by Sex by Income Bracket in La Habra Heights
The most common earnings brackets in La Habra Heights are $100,000+ for men (855 | 46.8%) and $100,000+ for women (411 | 28.5%).
| Income | Male | Female |
| $2,499 or less | 78 (4.3%) | 38 (2.6%) |
| $2,500 to $4,999 | 25 (1.4%) | 11 (0.8%) |
| $5,000 to $7,499 | 69 (3.8%) | 66 (4.6%) |
| $7,500 to $9,999 | 0 (0.0%) | 22 (1.5%) |
| $10,000 to $12,499 | 0 (0.0%) | 110 (7.6%) |
| $12,500 to $14,999 | 15 (0.8%) | 15 (1.0%) |
| $15,000 to $17,499 | 58 (3.2%) | 29 (2.0%) |
| $17,500 to $19,999 | 93 (5.1%) | 0 (0.0%) |
| $20,000 to $22,499 | 47 (2.6%) | 38 (2.6%) |
| $22,500 to $24,999 | 50 (2.7%) | 31 (2.1%) |
| $25,000 to $29,999 | 0 (0.0%) | 102 (7.1%) |
| $30,000 to $34,999 | 120 (6.6%) | 82 (5.7%) |
| $35,000 to $39,999 | 0 (0.0%) | 16 (1.1%) |
| $40,000 to $44,999 | 14 (0.8%) | 192 (13.3%) |
| $45,000 to $49,999 | 26 (1.4%) | 28 (1.9%) |
| $50,000 to $54,999 | 119 (6.5%) | 10 (0.7%) |
| $55,000 to $64,999 | 39 (2.1%) | 142 (9.9%) |
| $65,000 to $74,999 | 78 (4.3%) | 60 (4.2%) |
| $75,000 to $99,999 | 143 (7.8%) | 37 (2.6%) |
| $100,000+ | 855 (46.8%) | 411 (28.5%) |
| Total | 1,829 (100.0%) | 1,440 (100.0%) |
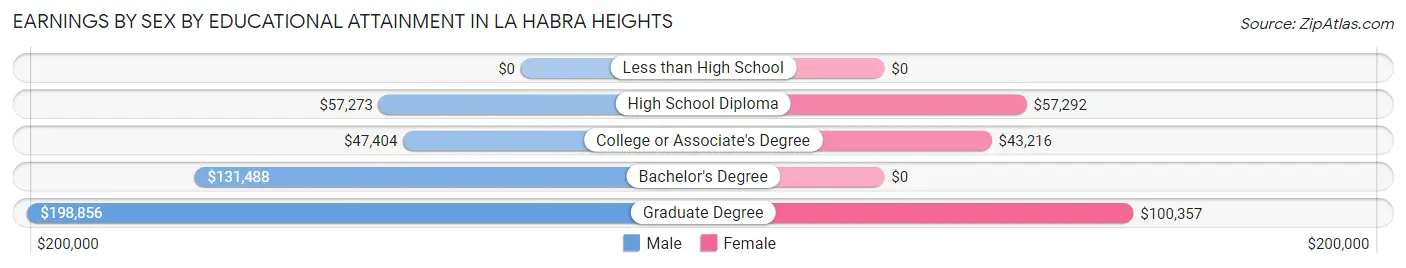
Earnings by Sex by Educational Attainment in La Habra Heights
Average earnings in La Habra Heights are $99,659 for men and $55,652 for women, a difference of 44.2%. Men with an educational attainment of graduate degree enjoy the highest average annual earnings of $198,856, while those with college or associate's degree education earn the least with $47,404. Women with an educational attainment of graduate degree earn the most with the average annual earnings of $100,357, while those with college or associate's degree education have the smallest earnings of $43,216.
| Educational Attainment | Male Income | Female Income |
| Less than High School | - | - |
| High School Diploma | $57,273 | $57,292 |
| College or Associate's Degree | $47,404 | $43,216 |
| Bachelor's Degree | $131,488 | $0 |
| Graduate Degree | $198,856 | $100,357 |
| Total | $99,659 | $55,652 |
Family Income in La Habra Heights
Family Income Brackets in La Habra Heights
According to the La Habra Heights family income data, there are 707 families falling into the $200,000+ income range, which is the most common income bracket and makes up 48.0% of all families.
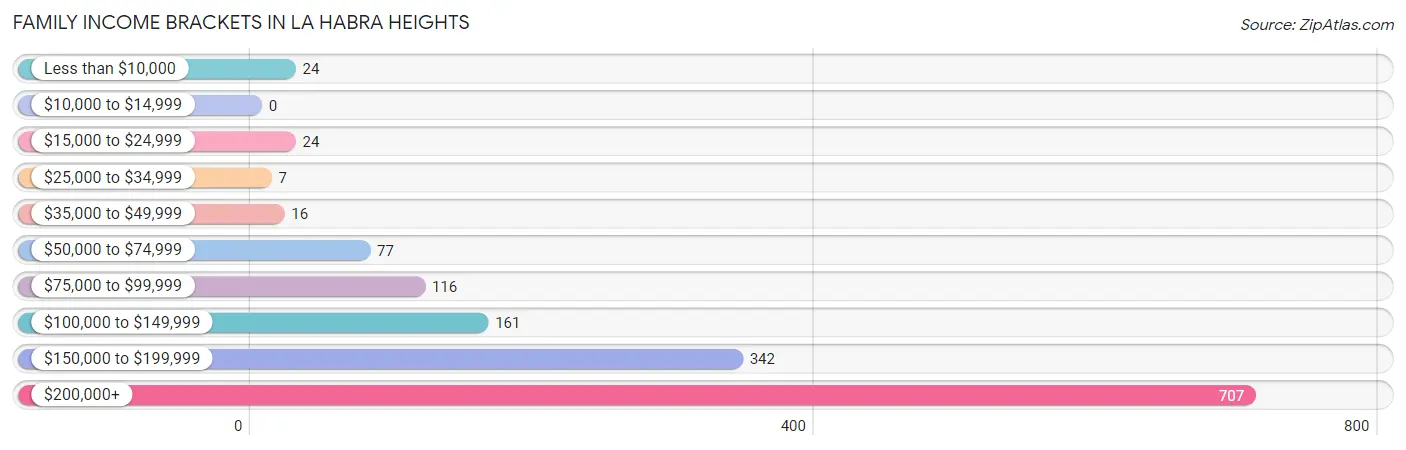
| Income Bracket | # Families | % Families |
| Less than $10,000 | 24 | 1.6% |
| $10,000 to $14,999 | 0 | 0.0% |
| $15,000 to $24,999 | 24 | 1.6% |
| $25,000 to $34,999 | 7 | 0.5% |
| $35,000 to $49,999 | 16 | 1.1% |
| $50,000 to $74,999 | 77 | 5.2% |
| $75,000 to $99,999 | 116 | 7.9% |
| $100,000 to $149,999 | 161 | 10.9% |
| $150,000 to $199,999 | 342 | 23.2% |
| $200,000+ | 707 | 48.0% |
Family Income by Famaliy Size in La Habra Heights
4-person families (307 | 20.8%) account for the highest median family income in La Habra Heights with $250,001 per family, while 2-person families (608 | 41.3%) have the highest median income of $85,368 per family member.
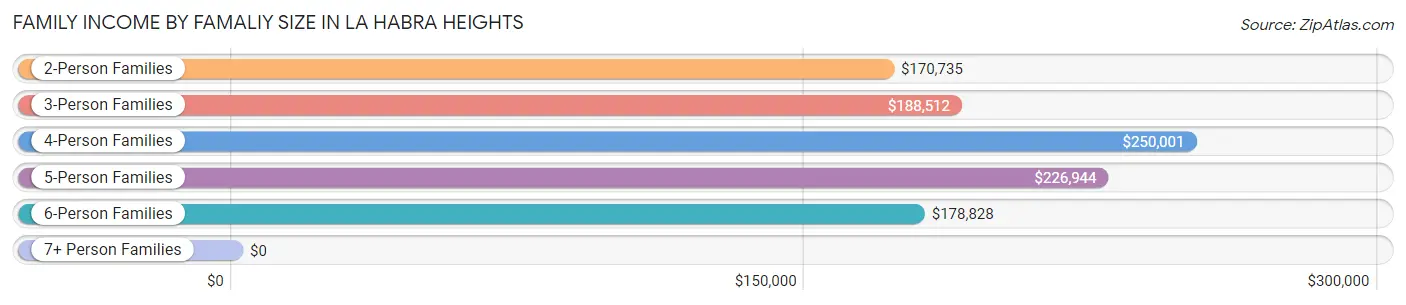
| Income Bracket | # Families | Median Income |
| 2-Person Families | 608 (41.3%) | $170,735 |
| 3-Person Families | 357 (24.2%) | $188,512 |
| 4-Person Families | 307 (20.8%) | $250,001 |
| 5-Person Families | 98 (6.7%) | $226,944 |
| 6-Person Families | 76 (5.2%) | $178,828 |
| 7+ Person Families | 27 (1.8%) | $0 |
| Total | 1,473 (100.0%) | $195,250 |
Family Income by Number of Earners in La Habra Heights
The median family income in La Habra Heights is $195,250, with families comprising 3+ earners (284) having the highest median family income of $250,001, while families with no earners (183) have the lowest median family income of $116,563, accounting for 19.3% and 12.4% of families, respectively.
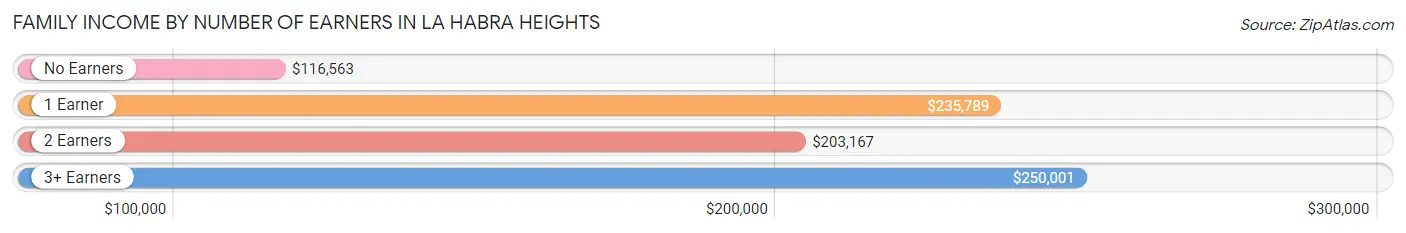
| Number of Earners | # Families | Median Income |
| No Earners | 183 (12.4%) | $116,563 |
| 1 Earner | 364 (24.7%) | $235,789 |
| 2 Earners | 642 (43.6%) | $203,167 |
| 3+ Earners | 284 (19.3%) | $250,001 |
| Total | 1,473 (100.0%) | $195,250 |
Household Income in La Habra Heights
Household Income Brackets in La Habra Heights
With 900 households falling in the category, the $200,000+ income range is the most frequent in La Habra Heights, accounting for 46.7% of all households.
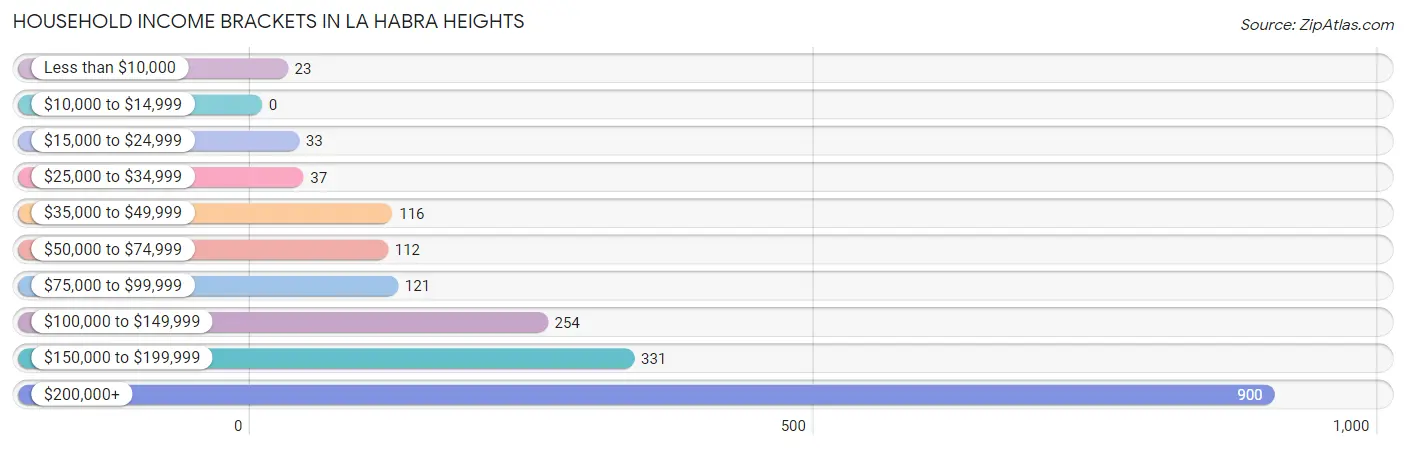
| Income Bracket | # Households | % Households |
| Less than $10,000 | 23 | 1.2% |
| $10,000 to $14,999 | 0 | 0.0% |
| $15,000 to $24,999 | 33 | 1.7% |
| $25,000 to $34,999 | 37 | 1.9% |
| $35,000 to $49,999 | 116 | 6.0% |
| $50,000 to $74,999 | 112 | 5.8% |
| $75,000 to $99,999 | 121 | 6.3% |
| $100,000 to $149,999 | 254 | 13.2% |
| $150,000 to $199,999 | 331 | 17.2% |
| $200,000+ | 900 | 46.7% |
Household Income by Householder Age in La Habra Heights
The median household income in La Habra Heights is $179,990, with the highest median household income of $221,265 found in the 45 to 64 years age bracket for the primary householder. A total of 882 households (45.8%) fall into this category. Meanwhile, the 15 to 24 years age bracket for the primary householder has the lowest median household income of $0, with 7 households (0.4%) in this group.
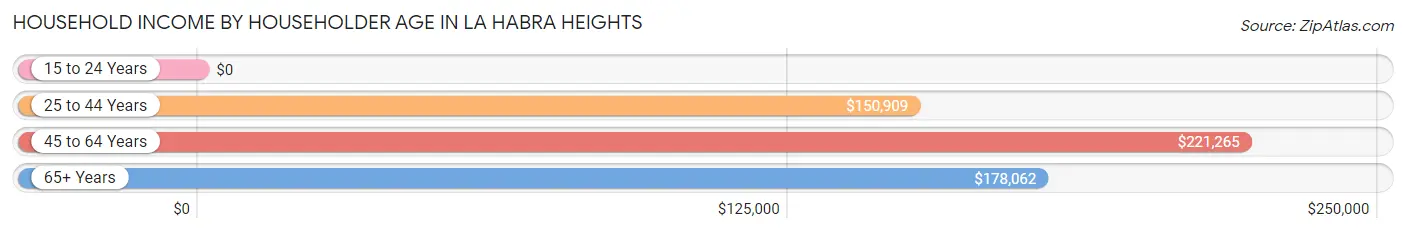
| Income Bracket | # Households | Median Income |
| 15 to 24 Years | 7 (0.4%) | $0 |
| 25 to 44 Years | 342 (17.7%) | $150,909 |
| 45 to 64 Years | 882 (45.8%) | $221,265 |
| 65+ Years | 696 (36.1%) | $178,062 |
| Total | 1,927 (100.0%) | $179,990 |
Poverty in La Habra Heights
Income Below Poverty by Sex and Age in La Habra Heights
With 3.7% poverty level for males and 4.5% for females among the residents of La Habra Heights, 45 to 54 year old males and 25 to 34 year old females are the most vulnerable to poverty, with 59 males (16.2%) and 39 females (10.9%) in their respective age groups living below the poverty level.
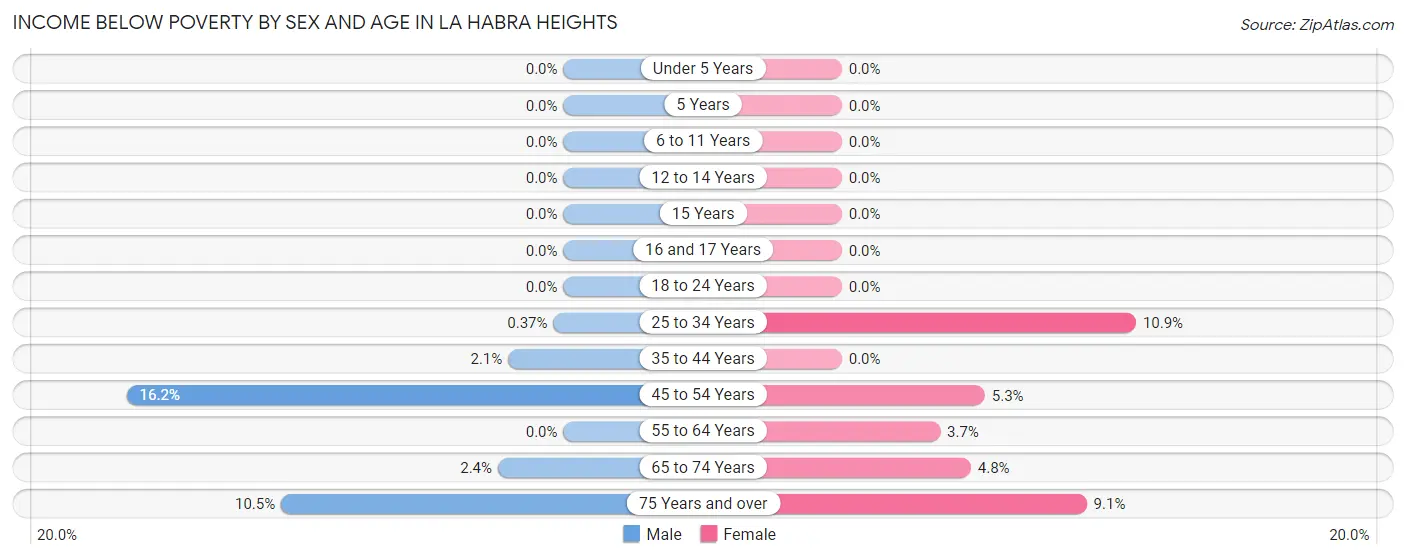
| Age Bracket | Male | Female |
| Under 5 Years | 0 (0.0%) | 0 (0.0%) |
| 5 Years | 0 (0.0%) | 0 (0.0%) |
| 6 to 11 Years | 0 (0.0%) | 0 (0.0%) |
| 12 to 14 Years | 0 (0.0%) | 0 (0.0%) |
| 15 Years | 0 (0.0%) | 0 (0.0%) |
| 16 and 17 Years | 0 (0.0%) | 0 (0.0%) |
| 18 to 24 Years | 0 (0.0%) | 0 (0.0%) |
| 25 to 34 Years | 1 (0.4%) | 39 (10.9%) |
| 35 to 44 Years | 8 (2.1%) | 0 (0.0%) |
| 45 to 54 Years | 59 (16.2%) | 31 (5.3%) |
| 55 to 64 Years | 0 (0.0%) | 10 (3.6%) |
| 65 to 74 Years | 9 (2.4%) | 22 (4.8%) |
| 75 Years and over | 24 (10.5%) | 25 (9.1%) |
| Total | 101 (3.7%) | 127 (4.5%) |
Income Above Poverty by Sex and Age in La Habra Heights
According to the poverty statistics in La Habra Heights, males aged under 5 years and females aged under 5 years are the age groups that are most secure financially, with 100.0% of males and 100.0% of females in these age groups living above the poverty line.
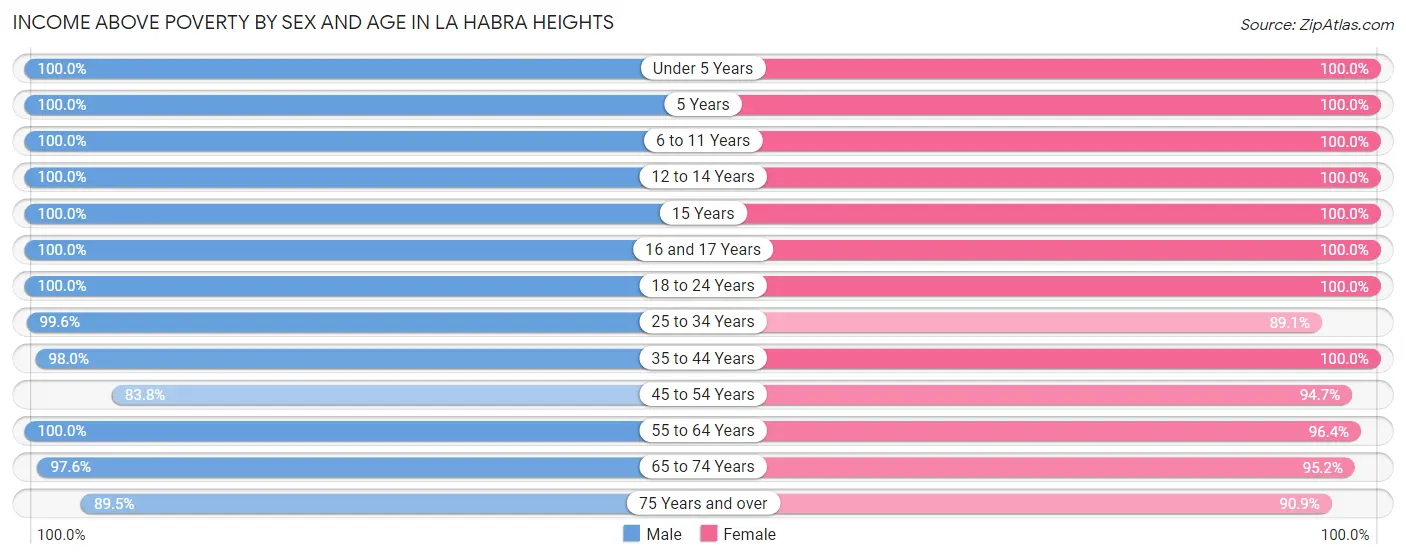
| Age Bracket | Male | Female |
| Under 5 Years | 201 (100.0%) | 140 (100.0%) |
| 5 Years | 21 (100.0%) | 74 (100.0%) |
| 6 to 11 Years | 102 (100.0%) | 126 (100.0%) |
| 12 to 14 Years | 92 (100.0%) | 24 (100.0%) |
| 15 Years | 10 (100.0%) | 10 (100.0%) |
| 16 and 17 Years | 34 (100.0%) | 72 (100.0%) |
| 18 to 24 Years | 212 (100.0%) | 215 (100.0%) |
| 25 to 34 Years | 269 (99.6%) | 318 (89.1%) |
| 35 to 44 Years | 382 (98.0%) | 236 (100.0%) |
| 45 to 54 Years | 305 (83.8%) | 553 (94.7%) |
| 55 to 64 Years | 453 (100.0%) | 264 (96.4%) |
| 65 to 74 Years | 361 (97.6%) | 437 (95.2%) |
| 75 Years and over | 205 (89.5%) | 250 (90.9%) |
| Total | 2,647 (96.3%) | 2,719 (95.5%) |
Income Below Poverty Among Married-Couple Families in La Habra Heights
The poverty statistics for married-couple families in La Habra Heights show that 2.6% or 32 of the total 1,212 families live below the poverty line. Families with no children have the highest poverty rate of 3.7%, comprising of 32 families. On the other hand, families with 1 or 2 children have the lowest poverty rate of 0.0%, which includes 0 families.
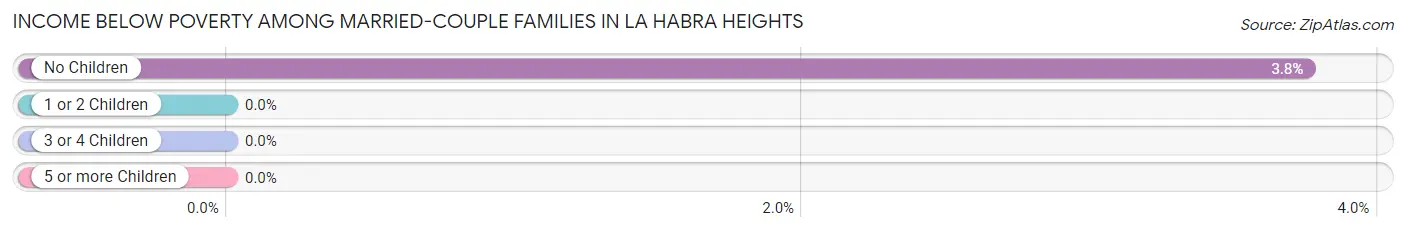
| Children | Above Poverty | Below Poverty |
| No Children | 821 (96.3%) | 32 (3.7%) |
| 1 or 2 Children | 324 (100.0%) | 0 (0.0%) |
| 3 or 4 Children | 35 (100.0%) | 0 (0.0%) |
| 5 or more Children | 0 (0.0%) | 0 (0.0%) |
| Total | 1,180 (97.4%) | 32 (2.6%) |
Income Below Poverty Among Single-Parent Households in La Habra Heights
| Children | Single Father | Single Mother |
| No Children | 0 (0.0%) | 0 (0.0%) |
| 1 or 2 Children | 0 (0.0%) | 0 (0.0%) |
| 3 or 4 Children | 0 (0.0%) | 0 (0.0%) |
| 5 or more Children | 0 (0.0%) | 0 (0.0%) |
| Total | 0 (0.0%) | 0 (0.0%) |
Income Below Poverty Among Married-Couple vs Single-Parent Households in La Habra Heights
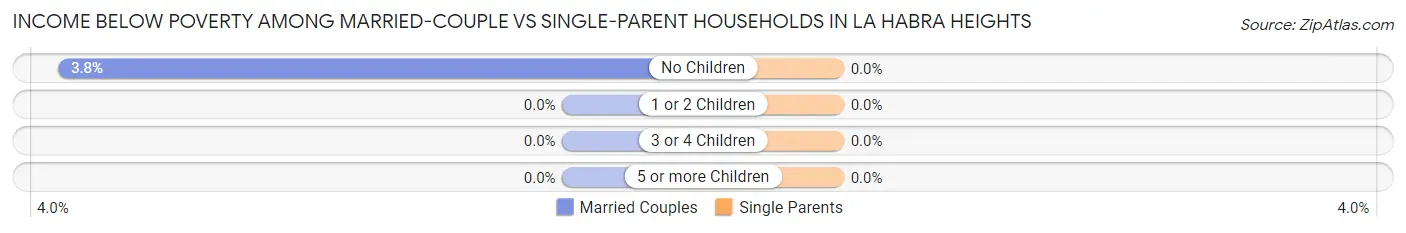
| Children | Married-Couple Families | Single-Parent Households |
| No Children | 32 (3.7%) | 0 (0.0%) |
| 1 or 2 Children | 0 (0.0%) | 0 (0.0%) |
| 3 or 4 Children | 0 (0.0%) | 0 (0.0%) |
| 5 or more Children | 0 (0.0%) | 0 (0.0%) |
| Total | 32 (2.6%) | 0 (0.0%) |
Race in La Habra Heights
The most populous races in La Habra Heights are White / Caucasian (3,004 | 53.6%), Hispanic or Latino (1,305 | 23.3%), and Asian (1,075 | 19.2%).
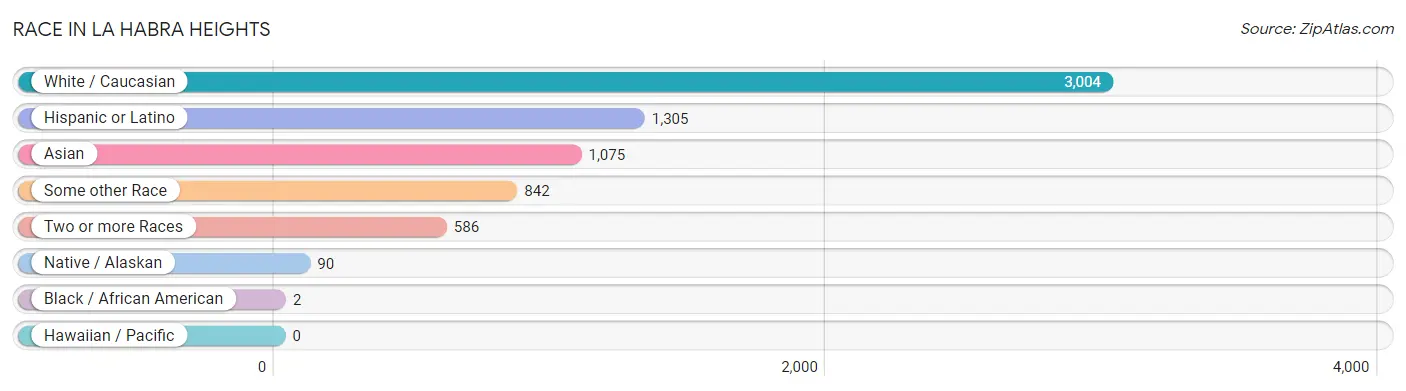
| Race | # Population | % Population |
| Asian | 1,075 | 19.2% |
| Black / African American | 2 | 0.0% |
| Hawaiian / Pacific | 0 | 0.0% |
| Hispanic or Latino | 1,305 | 23.3% |
| Native / Alaskan | 90 | 1.6% |
| White / Caucasian | 3,004 | 53.6% |
| Two or more Races | 586 | 10.5% |
| Some other Race | 842 | 15.0% |
| Total | 5,599 | 100.0% |
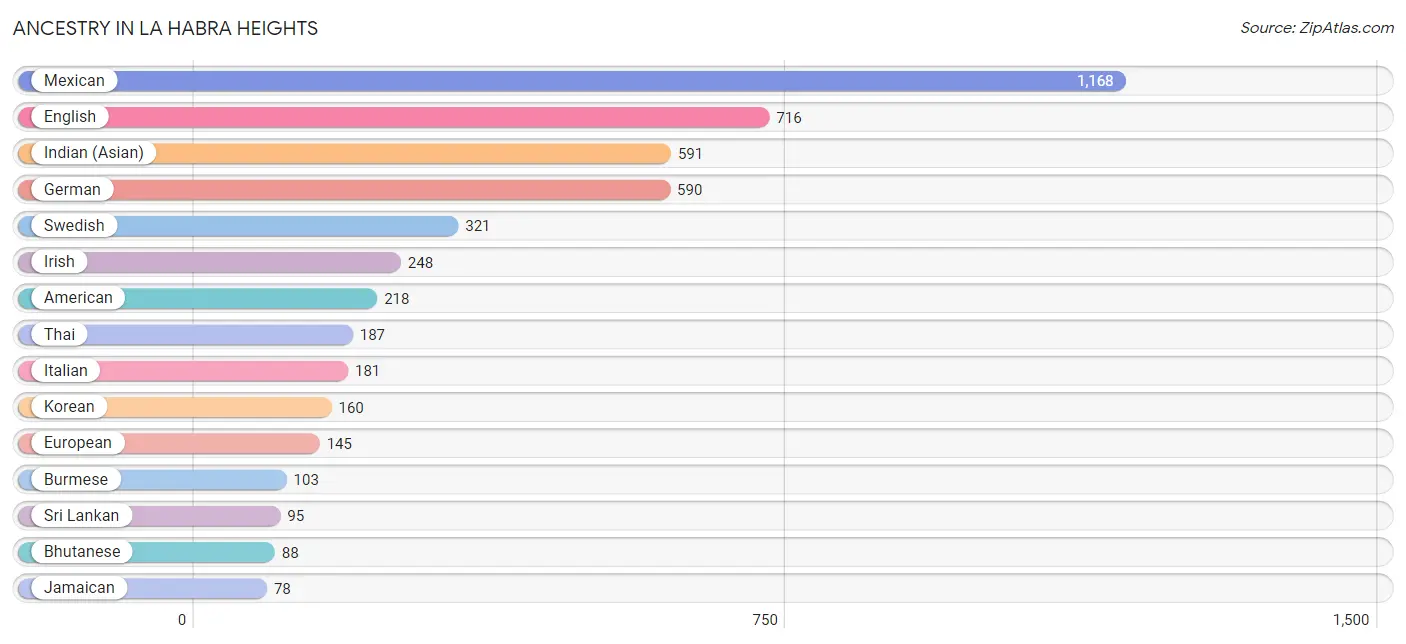
Ancestry in La Habra Heights
The most populous ancestries reported in La Habra Heights are Mexican (1,168 | 20.9%), English (716 | 12.8%), Indian (Asian) (591 | 10.6%), German (590 | 10.5%), and Swedish (321 | 5.7%), together accounting for 60.5% of all La Habra Heights residents.
| Ancestry | # Population | % Population |
| Albanian | 7 | 0.1% |
| American | 218 | 3.9% |
| Apache | 6 | 0.1% |
| Arab | 65 | 1.2% |
| Armenian | 8 | 0.1% |
| Bhutanese | 88 | 1.6% |
| British | 8 | 0.1% |
| Burmese | 103 | 1.8% |
| Canadian | 8 | 0.1% |
| Central American | 29 | 0.5% |
| Central American Indian | 10 | 0.2% |
| Costa Rican | 11 | 0.2% |
| Croatian | 6 | 0.1% |
| Cuban | 7 | 0.1% |
| Czech | 16 | 0.3% |
| Danish | 76 | 1.4% |
| Dutch | 43 | 0.8% |
| Eastern European | 11 | 0.2% |
| Egyptian | 11 | 0.2% |
| English | 716 | 12.8% |
| European | 145 | 2.6% |
| Filipino | 35 | 0.6% |
| Finnish | 29 | 0.5% |
| French | 46 | 0.8% |
| French Canadian | 25 | 0.4% |
| German | 590 | 10.5% |
| Greek | 43 | 0.8% |
| Honduran | 10 | 0.2% |
| Hungarian | 6 | 0.1% |
| Indian (Asian) | 591 | 10.6% |
| Indonesian | 8 | 0.1% |
| Iranian | 48 | 0.9% |
| Irish | 248 | 4.4% |
| Italian | 181 | 3.2% |
| Jamaican | 78 | 1.4% |
| Japanese | 37 | 0.7% |
| Korean | 160 | 2.9% |
| Lebanese | 10 | 0.2% |
| Mexican | 1,168 | 20.9% |
| Northern European | 65 | 1.2% |
| Norwegian | 46 | 0.8% |
| Palestinian | 9 | 0.2% |
| Polish | 34 | 0.6% |
| Romanian | 1 | 0.0% |
| Russian | 34 | 0.6% |
| Salvadoran | 8 | 0.1% |
| Scottish | 62 | 1.1% |
| South American | 15 | 0.3% |
| Spaniard | 66 | 1.2% |
| Spanish | 11 | 0.2% |
| Sri Lankan | 95 | 1.7% |
| Swedish | 321 | 5.7% |
| Thai | 187 | 3.3% |
| Venezuelan | 15 | 0.3% |
| Welsh | 8 | 0.1% | View All 55 Rows |
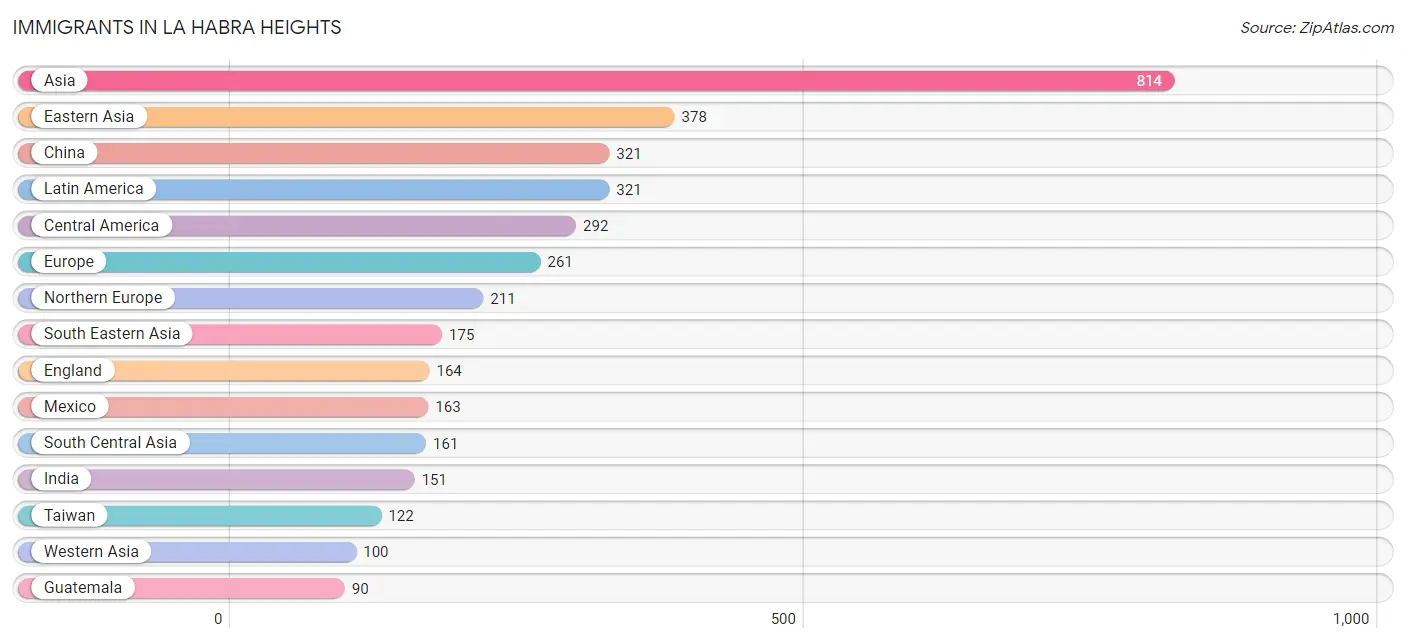
Immigrants in La Habra Heights
The most numerous immigrant groups reported in La Habra Heights came from Asia (814 | 14.5%), Eastern Asia (378 | 6.8%), China (321 | 5.7%), Latin America (321 | 5.7%), and Central America (292 | 5.2%), together accounting for 38.0% of all La Habra Heights residents.
| Immigration Origin | # Population | % Population |
| Armenia | 65 | 1.2% |
| Asia | 814 | 14.5% |
| Brazil | 9 | 0.2% |
| Cambodia | 22 | 0.4% |
| Canada | 35 | 0.6% |
| Caribbean | 5 | 0.1% |
| Central America | 292 | 5.2% |
| China | 321 | 5.7% |
| Costa Rica | 11 | 0.2% |
| Cuba | 5 | 0.1% |
| Eastern Asia | 378 | 6.8% |
| Eastern Europe | 34 | 0.6% |
| England | 164 | 2.9% |
| Europe | 261 | 4.7% |
| Germany | 16 | 0.3% |
| Guatemala | 90 | 1.6% |
| Honduras | 19 | 0.3% |
| Hong Kong | 9 | 0.2% |
| India | 151 | 2.7% |
| Iran | 10 | 0.2% |
| Jordan | 35 | 0.6% |
| Korea | 57 | 1.0% |
| Latin America | 321 | 5.7% |
| Mexico | 163 | 2.9% |
| Nicaragua | 9 | 0.2% |
| Northern Europe | 211 | 3.8% |
| Philippines | 52 | 0.9% |
| Romania | 34 | 0.6% |
| South America | 24 | 0.4% |
| South Central Asia | 161 | 2.9% |
| South Eastern Asia | 175 | 3.1% |
| Taiwan | 122 | 2.2% |
| Venezuela | 15 | 0.3% |
| Western Asia | 100 | 1.8% |
| Western Europe | 16 | 0.3% | View All 35 Rows |
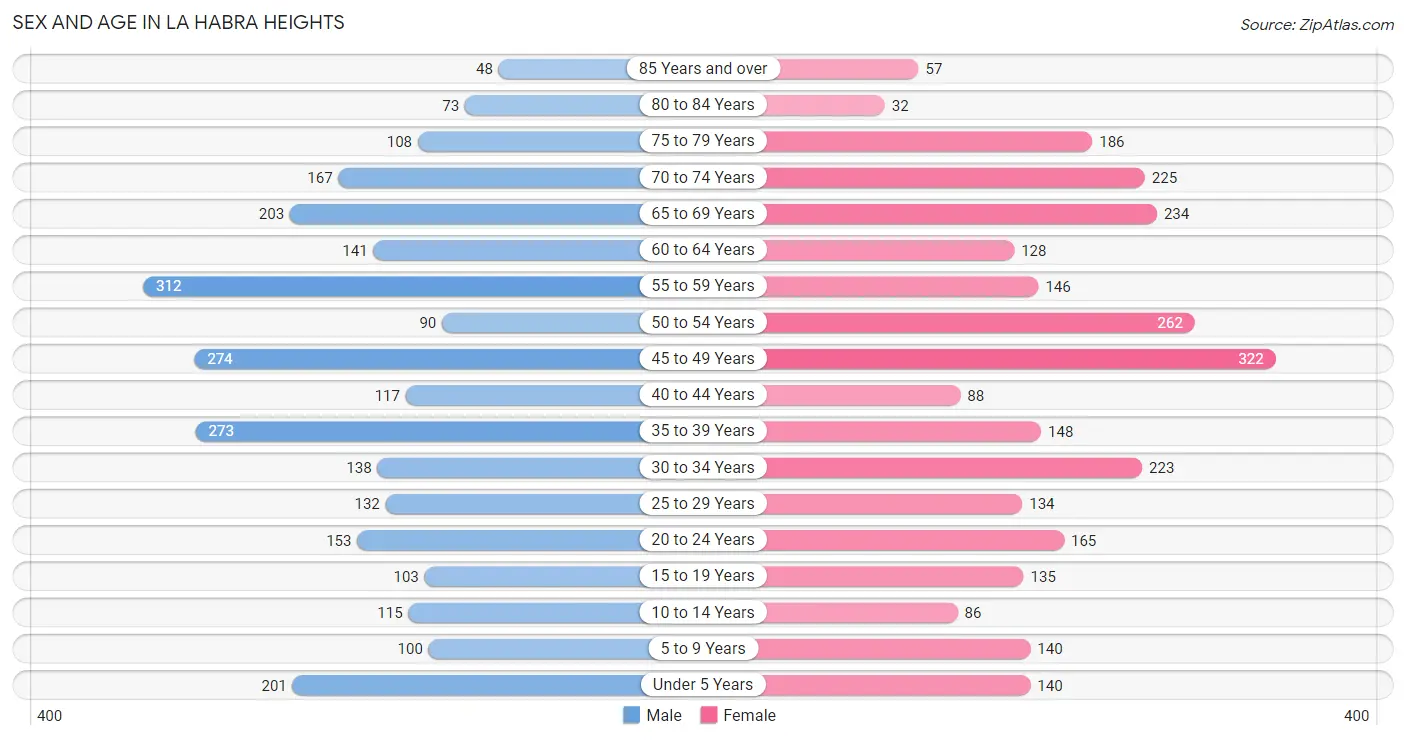
Sex and Age in La Habra Heights
Sex and Age in La Habra Heights
The most populous age groups in La Habra Heights are 55 to 59 Years (312 | 11.4%) for men and 45 to 49 Years (322 | 11.3%) for women.
| Age Bracket | Male | Female |
| Under 5 Years | 201 (7.3%) | 140 (4.9%) |
| 5 to 9 Years | 100 (3.6%) | 140 (4.9%) |
| 10 to 14 Years | 115 (4.2%) | 86 (3.0%) |
| 15 to 19 Years | 103 (3.7%) | 135 (4.7%) |
| 20 to 24 Years | 153 (5.6%) | 165 (5.8%) |
| 25 to 29 Years | 132 (4.8%) | 134 (4.7%) |
| 30 to 34 Years | 138 (5.0%) | 223 (7.8%) |
| 35 to 39 Years | 273 (9.9%) | 148 (5.2%) |
| 40 to 44 Years | 117 (4.3%) | 88 (3.1%) |
| 45 to 49 Years | 274 (10.0%) | 322 (11.3%) |
| 50 to 54 Years | 90 (3.3%) | 262 (9.2%) |
| 55 to 59 Years | 312 (11.4%) | 146 (5.1%) |
| 60 to 64 Years | 141 (5.1%) | 128 (4.5%) |
| 65 to 69 Years | 203 (7.4%) | 234 (8.2%) |
| 70 to 74 Years | 167 (6.1%) | 225 (7.9%) |
| 75 to 79 Years | 108 (3.9%) | 186 (6.5%) |
| 80 to 84 Years | 73 (2.7%) | 32 (1.1%) |
| 85 Years and over | 48 (1.8%) | 57 (2.0%) |
| Total | 2,748 (100.0%) | 2,851 (100.0%) |
Families and Households in La Habra Heights
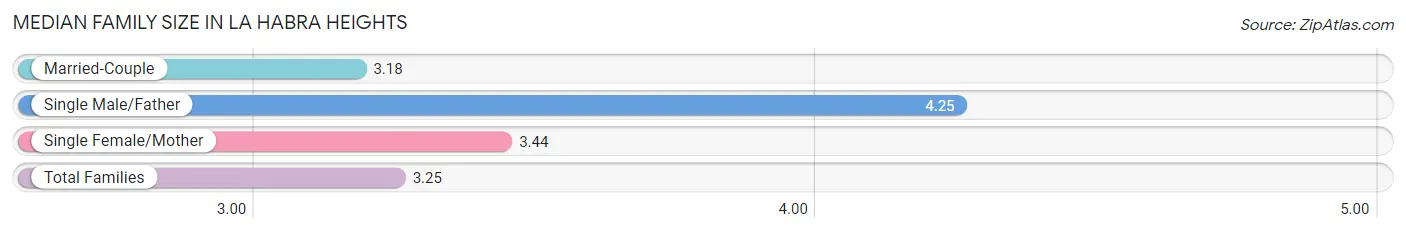
Median Family Size in La Habra Heights
The median family size in La Habra Heights is 3.25 persons per family, with single male/father families (53 | 3.6%) accounting for the largest median family size of 4.25 persons per family. On the other hand, married-couple families (1,212 | 82.3%) represent the smallest median family size with 3.18 persons per family.
| Family Type | # Families | Family Size |
| Married-Couple | 1,212 (82.3%) | 3.18 |
| Single Male/Father | 53 (3.6%) | 4.25 |
| Single Female/Mother | 208 (14.1%) | 3.44 |
| Total Families | 1,473 (100.0%) | 3.25 |
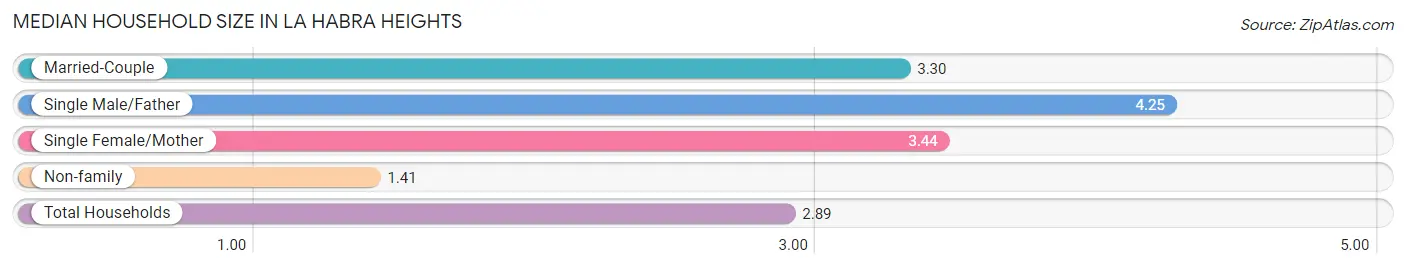
Median Household Size in La Habra Heights
The median household size in La Habra Heights is 2.89 persons per household, with single male/father households (53 | 2.8%) accounting for the largest median household size of 4.25 persons per household. non-family households (454 | 23.6%) represent the smallest median household size with 1.41 persons per household.
| Household Type | # Households | Household Size |
| Married-Couple | 1,212 (62.9%) | 3.30 |
| Single Male/Father | 53 (2.8%) | 4.25 |
| Single Female/Mother | 208 (10.8%) | 3.44 |
| Non-family | 454 (23.6%) | 1.41 |
| Total Households | 1,927 (100.0%) | 2.89 |
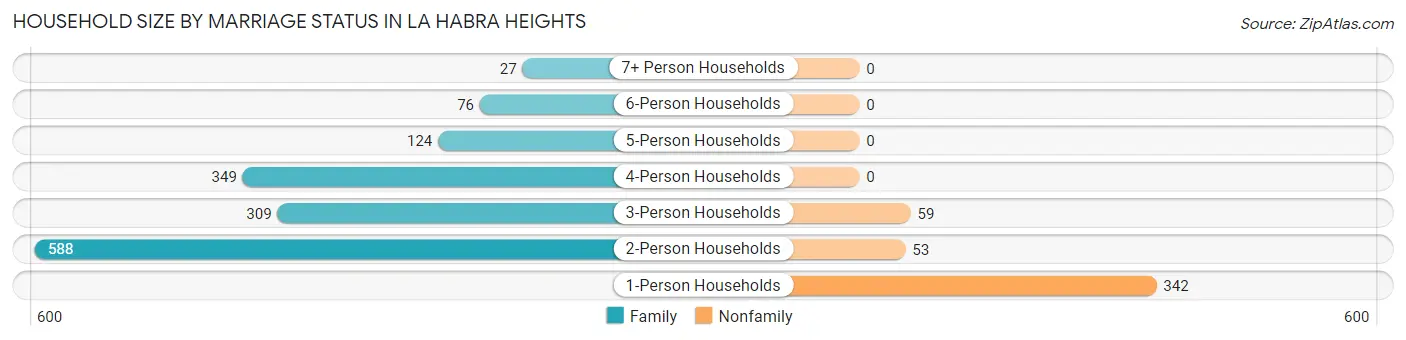
Household Size by Marriage Status in La Habra Heights
Out of a total of 1,927 households in La Habra Heights, 1,473 (76.4%) are family households, while 454 (23.6%) are nonfamily households. The most numerous type of family households are 2-person households, comprising 588, and the most common type of nonfamily households are 1-person households, comprising 342.
| Household Size | Family Households | Nonfamily Households |
| 1-Person Households | - | 342 (17.7%) |
| 2-Person Households | 588 (30.5%) | 53 (2.8%) |
| 3-Person Households | 309 (16.0%) | 59 (3.1%) |
| 4-Person Households | 349 (18.1%) | 0 (0.0%) |
| 5-Person Households | 124 (6.4%) | 0 (0.0%) |
| 6-Person Households | 76 (3.9%) | 0 (0.0%) |
| 7+ Person Households | 27 (1.4%) | 0 (0.0%) |
| Total | 1,473 (76.4%) | 454 (23.6%) |
Female Fertility in La Habra Heights
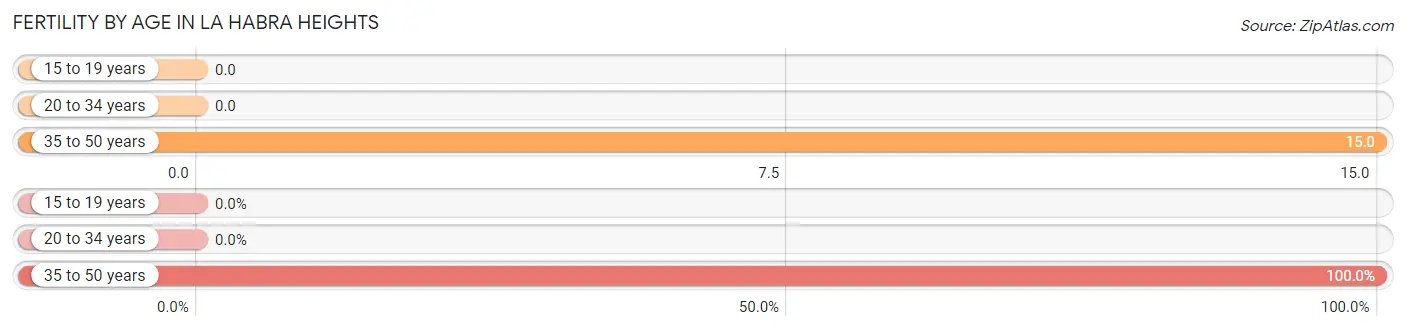
Fertility by Age in La Habra Heights
Average fertility rate in La Habra Heights is 8.0 births per 1,000 women. Women in the age bracket of 35 to 50 years have the highest fertility rate with 15.0 births per 1,000 women. Women in the age bracket of 35 to 50 years acount for 100.0% of all women with births.
| Age Bracket | Women with Births | Births / 1,000 Women |
| 15 to 19 years | 0 (0.0%) | 0.0 |
| 20 to 34 years | 0 (0.0%) | 0.0 |
| 35 to 50 years | 10 (100.0%) | 15.0 |
| Total | 10 (100.0%) | 8.0 |
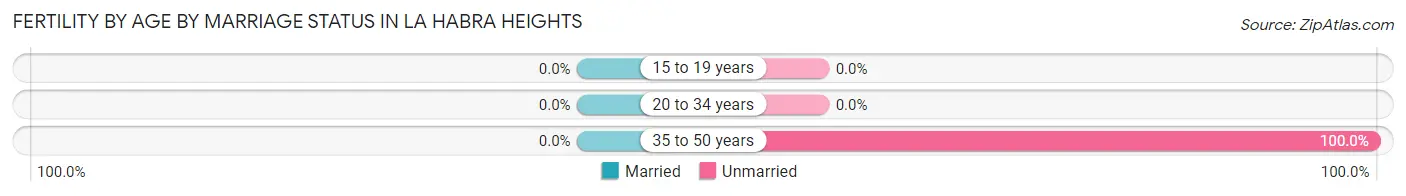
Fertility by Age by Marriage Status in La Habra Heights
| Age Bracket | Married | Unmarried |
| 15 to 19 years | 0 (0.0%) | 0 (0.0%) |
| 20 to 34 years | 0 (0.0%) | 0 (0.0%) |
| 35 to 50 years | 0 (0.0%) | 10 (100.0%) |
| Total | 0 (0.0%) | 10 (100.0%) |
Fertility by Education in La Habra Heights
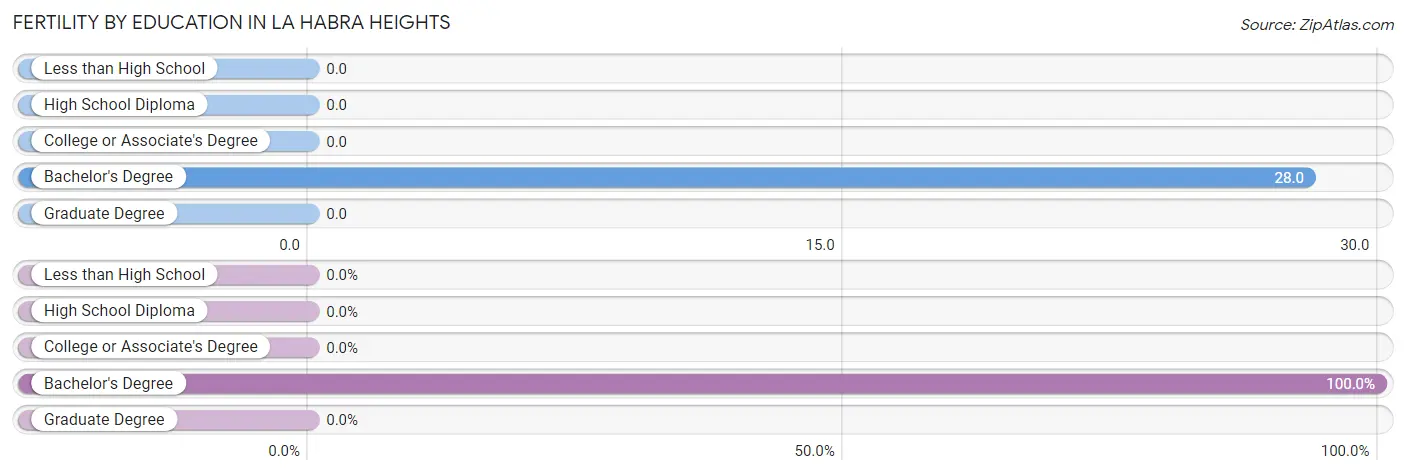
| Educational Attainment | Women with Births | Births / 1,000 Women |
| Less than High School | 0 (0.0%) | 0.0 |
| High School Diploma | 0 (0.0%) | 0.0 |
| College or Associate's Degree | 0 (0.0%) | 0.0 |
| Bachelor's Degree | 10 (100.0%) | 28.0 |
| Graduate Degree | 0 (0.0%) | 0.0 |
| Total | 10 (100.0%) | 8.0 |
Fertility by Education by Marriage Status in La Habra Heights
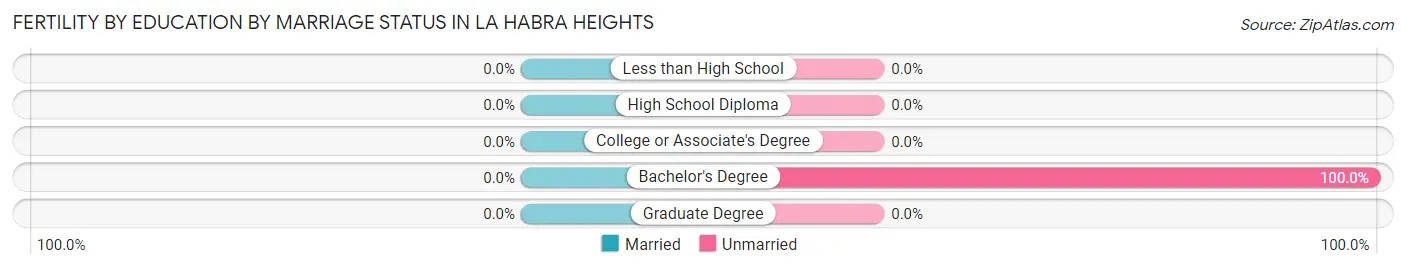
| Educational Attainment | Married | Unmarried |
| Less than High School | 0 (0.0%) | 0 (0.0%) |
| High School Diploma | 0 (0.0%) | 0 (0.0%) |
| College or Associate's Degree | 0 (0.0%) | 0 (0.0%) |
| Bachelor's Degree | 0 (0.0%) | 10 (100.0%) |
| Graduate Degree | 0 (0.0%) | 0 (0.0%) |
| Total | 0 (0.0%) | 10 (100.0%) |
Employment Characteristics in La Habra Heights
Employment by Class of Employer in La Habra Heights
Among the 2,855 employed individuals in La Habra Heights, private company employees (1,856 | 65.0%), self-employed (incorporated) (241 | 8.4%), and self-employed (not incorporated) (221 | 7.7%) make up the most common classes of employment.
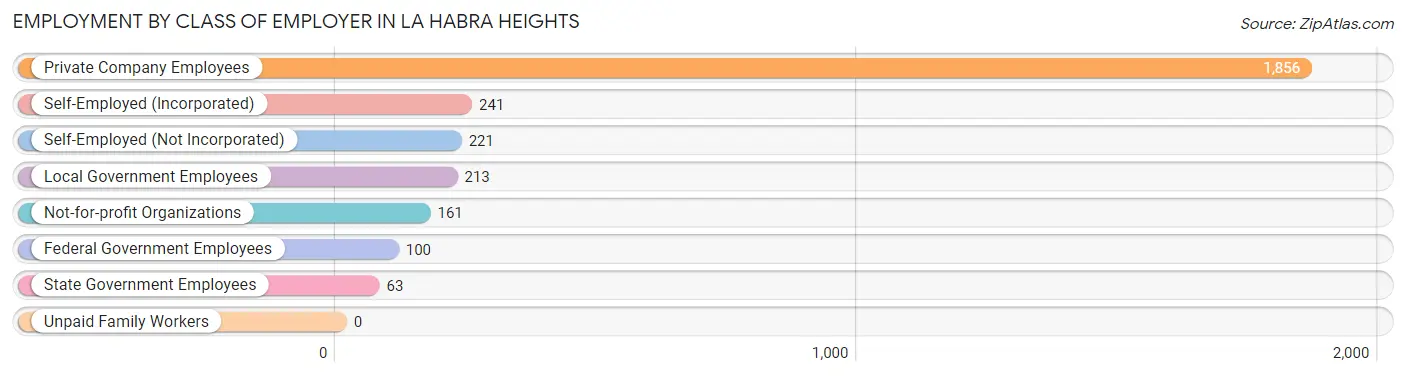
| Employer Class | # Employees | % Employees |
| Private Company Employees | 1,856 | 65.0% |
| Self-Employed (Incorporated) | 241 | 8.4% |
| Self-Employed (Not Incorporated) | 221 | 7.7% |
| Not-for-profit Organizations | 161 | 5.6% |
| Local Government Employees | 213 | 7.5% |
| State Government Employees | 63 | 2.2% |
| Federal Government Employees | 100 | 3.5% |
| Unpaid Family Workers | 0 | 0.0% |
| Total | 2,855 | 100.0% |
Employment Status by Age in La Habra Heights
According to the labor force statistics for La Habra Heights, out of the total population over 16 years of age (4,797), 63.5% or 3,046 individuals are in the labor force, with 1.8% or 55 of them unemployed. The age group with the highest labor force participation rate is 35 to 44 years, with 88.8% or 556 individuals in the labor force. Within the labor force, the 16 to 19 years age range has the highest percentage of unemployed individuals, with 35.6% or 21 of them being unemployed.
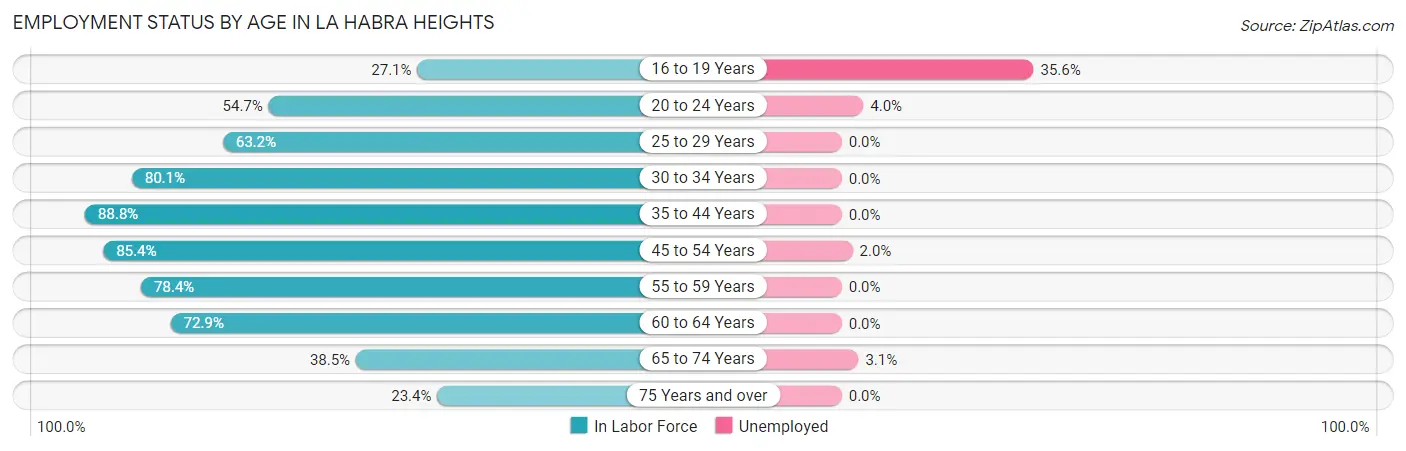
| Age Bracket | In Labor Force | Unemployed |
| 16 to 19 Years | 59 (27.1%) | 21 (35.6%) |
| 20 to 24 Years | 174 (54.7%) | 7 (4.0%) |
| 25 to 29 Years | 168 (63.2%) | 0 (0.0%) |
| 30 to 34 Years | 289 (80.1%) | 0 (0.0%) |
| 35 to 44 Years | 556 (88.8%) | 0 (0.0%) |
| 45 to 54 Years | 810 (85.4%) | 16 (2.0%) |
| 55 to 59 Years | 359 (78.4%) | 0 (0.0%) |
| 60 to 64 Years | 196 (72.9%) | 0 (0.0%) |
| 65 to 74 Years | 319 (38.5%) | 10 (3.1%) |
| 75 Years and over | 118 (23.4%) | 0 (0.0%) |
| Total | 3,046 (63.5%) | 55 (1.8%) |
Employment Status by Educational Attainment in La Habra Heights
According to labor force statistics for La Habra Heights, 81.2% of individuals (2,378) out of the total population between 25 and 64 years of age (2,928) are in the labor force, with 0.7% or 17 of them being unemployed. The group with the highest labor force participation rate are those with the educational attainment of bachelor's degree or higher, with 84.5% or 1,279 individuals in the labor force. Within the labor force, individuals with college / associate degree education have the highest percentage of unemployment, with 2.2% or 18 of them being unemployed.
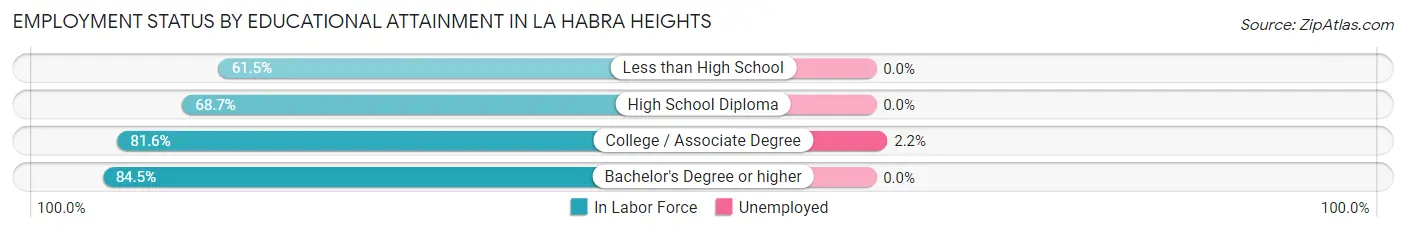
| Educational Attainment | In Labor Force | Unemployed |
| Less than High School | 32 (61.5%) | 0 (0.0%) |
| High School Diploma | 244 (68.7%) | 0 (0.0%) |
| College / Associate Degree | 822 (81.6%) | 22 (2.2%) |
| Bachelor's Degree or higher | 1,279 (84.5%) | 0 (0.0%) |
| Total | 2,378 (81.2%) | 20 (0.7%) |
Employment Occupations by Sex in La Habra Heights
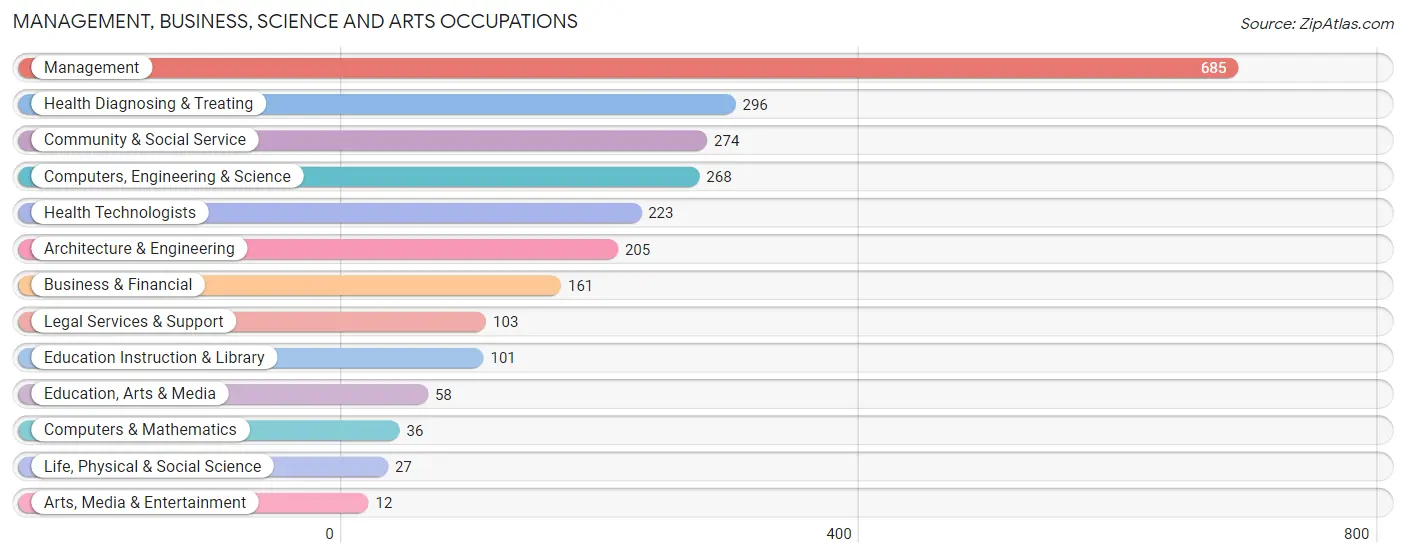
Management, Business, Science and Arts Occupations
The most common Management, Business, Science and Arts occupations in La Habra Heights are Management (685 | 23.6%), Health Diagnosing & Treating (296 | 10.2%), Community & Social Service (274 | 9.4%), Computers, Engineering & Science (268 | 9.2%), and Health Technologists (223 | 7.7%).
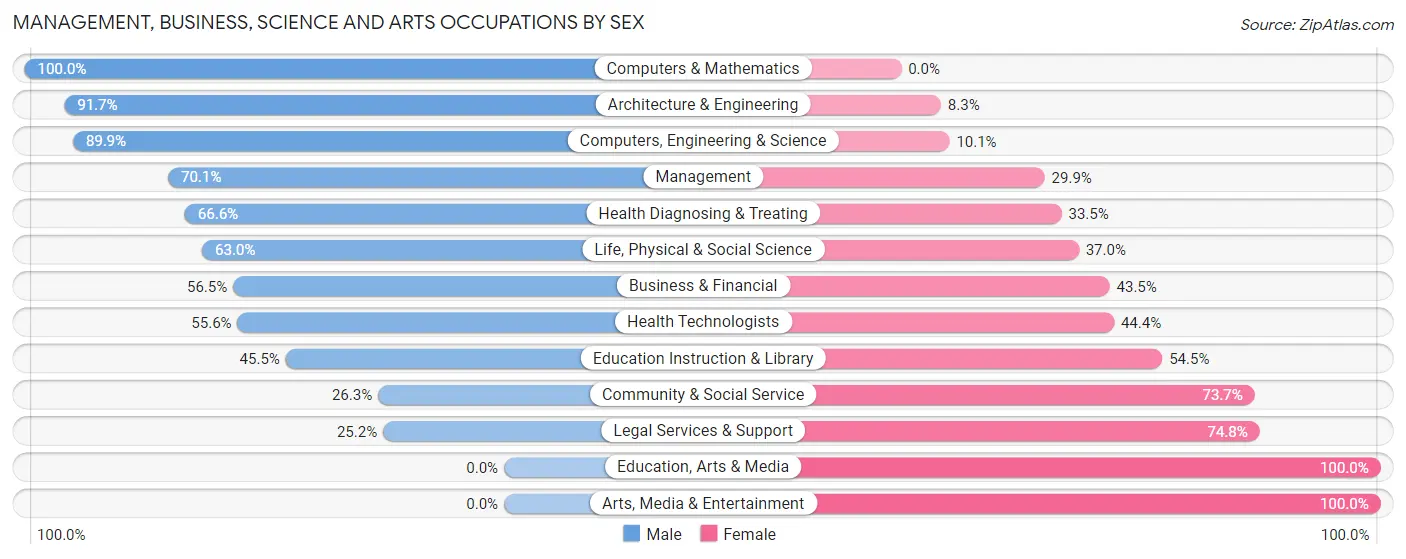
Management, Business, Science and Arts Occupations by Sex
Within the Management, Business, Science and Arts occupations in La Habra Heights, the most male-oriented occupations are Computers & Mathematics (100.0%), Architecture & Engineering (91.7%), and Computers, Engineering & Science (89.9%), while the most female-oriented occupations are Education, Arts & Media (100.0%), Arts, Media & Entertainment (100.0%), and Legal Services & Support (74.8%).
| Occupation | Male | Female |
| Management | 480 (70.1%) | 205 (29.9%) |
| Business & Financial | 91 (56.5%) | 70 (43.5%) |
| Computers, Engineering & Science | 241 (89.9%) | 27 (10.1%) |
| Computers & Mathematics | 36 (100.0%) | 0 (0.0%) |
| Architecture & Engineering | 188 (91.7%) | 17 (8.3%) |
| Life, Physical & Social Science | 17 (63.0%) | 10 (37.0%) |
| Community & Social Service | 72 (26.3%) | 202 (73.7%) |
| Education, Arts & Media | 0 (0.0%) | 58 (100.0%) |
| Legal Services & Support | 26 (25.2%) | 77 (74.8%) |
| Education Instruction & Library | 46 (45.5%) | 55 (54.5%) |
| Arts, Media & Entertainment | 0 (0.0%) | 12 (100.0%) |
| Health Diagnosing & Treating | 197 (66.5%) | 99 (33.5%) |
| Health Technologists | 124 (55.6%) | 99 (44.4%) |
| Total (Category) | 1,081 (64.2%) | 603 (35.8%) |
| Total (Overall) | 1,574 (54.2%) | 1,330 (45.8%) |
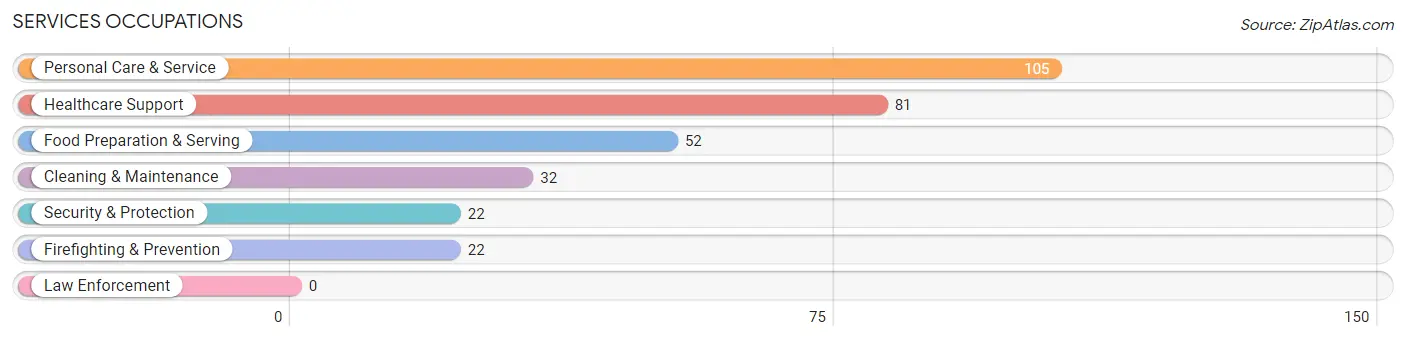
Services Occupations
The most common Services occupations in La Habra Heights are Personal Care & Service (105 | 3.6%), Healthcare Support (81 | 2.8%), Food Preparation & Serving (52 | 1.8%), Cleaning & Maintenance (32 | 1.1%), and Security & Protection (22 | 0.8%).
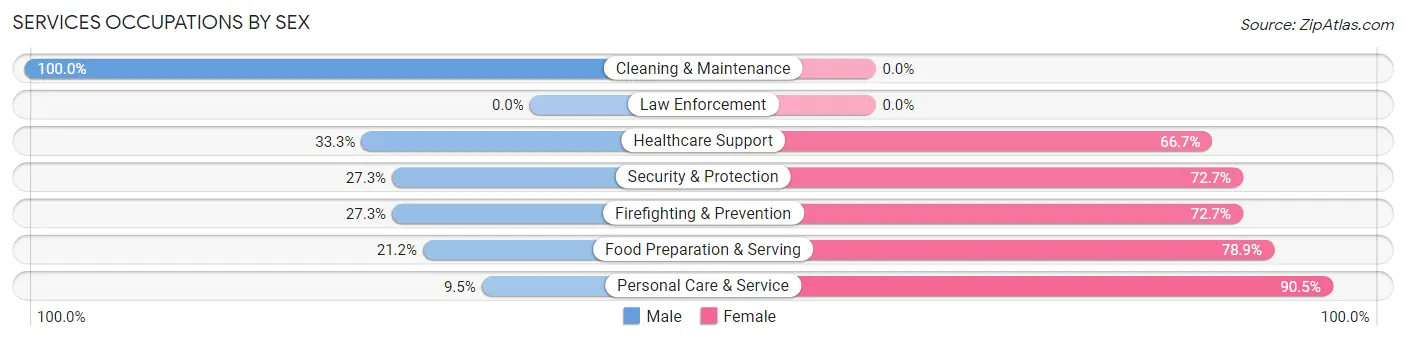
Services Occupations by Sex
Within the Services occupations in La Habra Heights, the most male-oriented occupations are Cleaning & Maintenance (100.0%), Healthcare Support (33.3%), and Security & Protection (27.3%), while the most female-oriented occupations are Personal Care & Service (90.5%), Food Preparation & Serving (78.8%), and Security & Protection (72.7%).
| Occupation | Male | Female |
| Healthcare Support | 27 (33.3%) | 54 (66.7%) |
| Security & Protection | 6 (27.3%) | 16 (72.7%) |
| Firefighting & Prevention | 6 (27.3%) | 16 (72.7%) |
| Law Enforcement | 0 (0.0%) | 0 (0.0%) |
| Food Preparation & Serving | 11 (21.1%) | 41 (78.8%) |
| Cleaning & Maintenance | 32 (100.0%) | 0 (0.0%) |
| Personal Care & Service | 10 (9.5%) | 95 (90.5%) |
| Total (Category) | 86 (29.4%) | 206 (70.6%) |
| Total (Overall) | 1,574 (54.2%) | 1,330 (45.8%) |
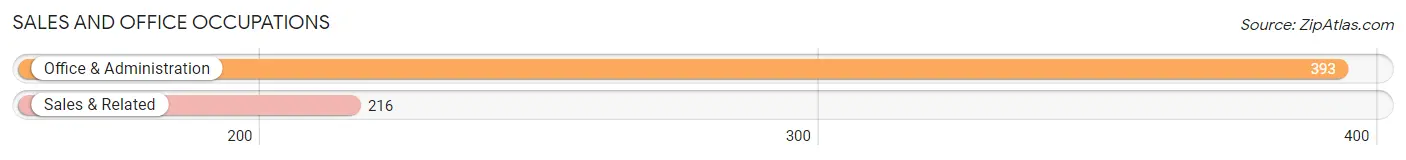
Sales and Office Occupations
The most common Sales and Office occupations in La Habra Heights are Office & Administration (393 | 13.5%), and Sales & Related (216 | 7.4%).
Sales and Office Occupations by Sex
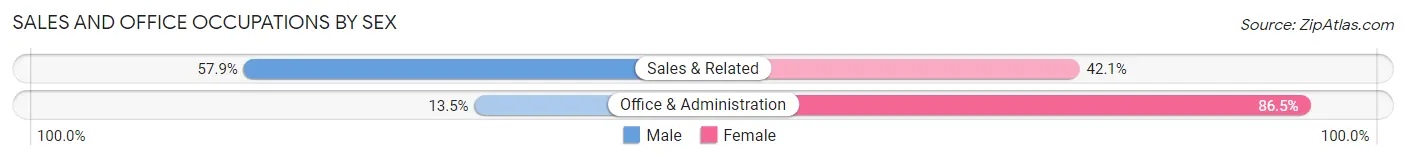
| Occupation | Male | Female |
| Sales & Related | 125 (57.9%) | 91 (42.1%) |
| Office & Administration | 53 (13.5%) | 340 (86.5%) |
| Total (Category) | 178 (29.2%) | 431 (70.8%) |
| Total (Overall) | 1,574 (54.2%) | 1,330 (45.8%) |
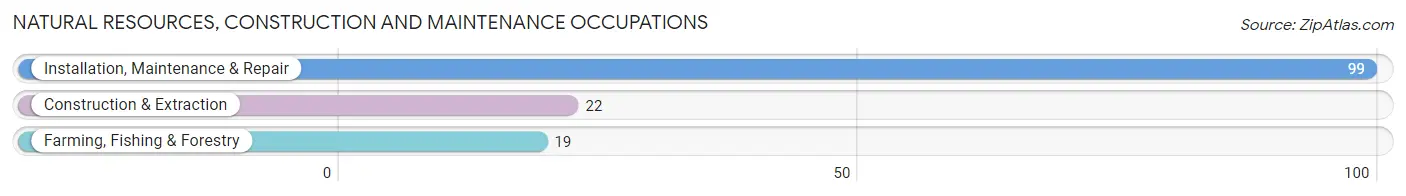
Natural Resources, Construction and Maintenance Occupations
The most common Natural Resources, Construction and Maintenance occupations in La Habra Heights are Installation, Maintenance & Repair (99 | 3.4%), Construction & Extraction (22 | 0.8%), and Farming, Fishing & Forestry (19 | 0.6%).
Natural Resources, Construction and Maintenance Occupations by Sex
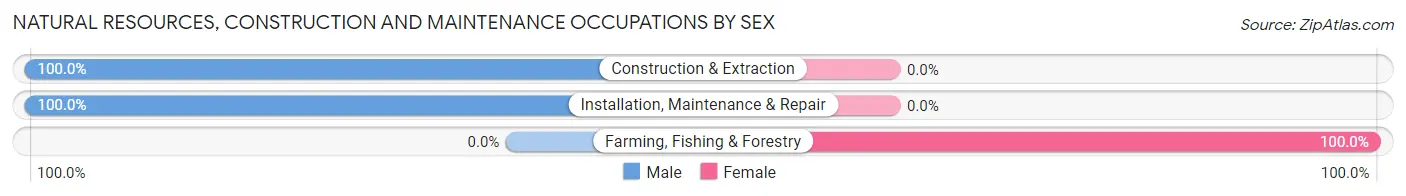
| Occupation | Male | Female |
| Farming, Fishing & Forestry | 0 (0.0%) | 19 (100.0%) |
| Construction & Extraction | 22 (100.0%) | 0 (0.0%) |
| Installation, Maintenance & Repair | 99 (100.0%) | 0 (0.0%) |
| Total (Category) | 121 (86.4%) | 19 (13.6%) |
| Total (Overall) | 1,574 (54.2%) | 1,330 (45.8%) |
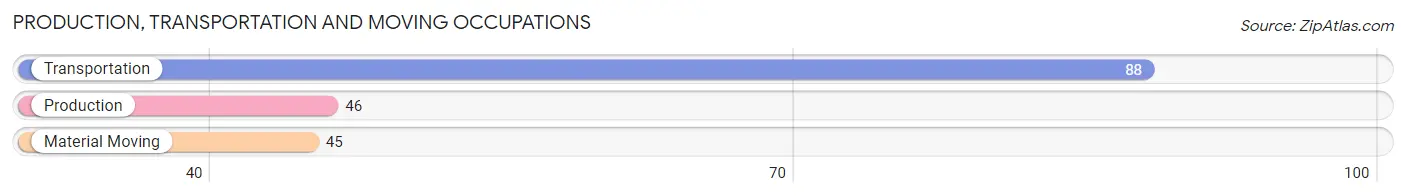
Production, Transportation and Moving Occupations
The most common Production, Transportation and Moving occupations in La Habra Heights are Transportation (88 | 3.0%), Production (46 | 1.6%), and Material Moving (45 | 1.5%).
Production, Transportation and Moving Occupations by Sex
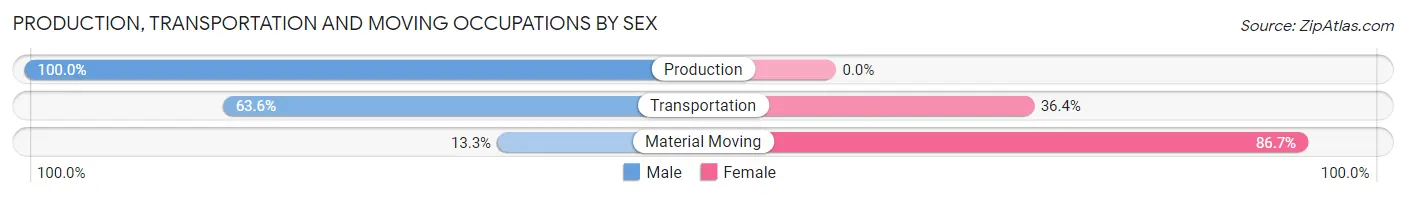
| Occupation | Male | Female |
| Production | 46 (100.0%) | 0 (0.0%) |
| Transportation | 56 (63.6%) | 32 (36.4%) |
| Material Moving | 6 (13.3%) | 39 (86.7%) |
| Total (Category) | 108 (60.3%) | 71 (39.7%) |
| Total (Overall) | 1,574 (54.2%) | 1,330 (45.8%) |
Employment Industries by Sex in La Habra Heights
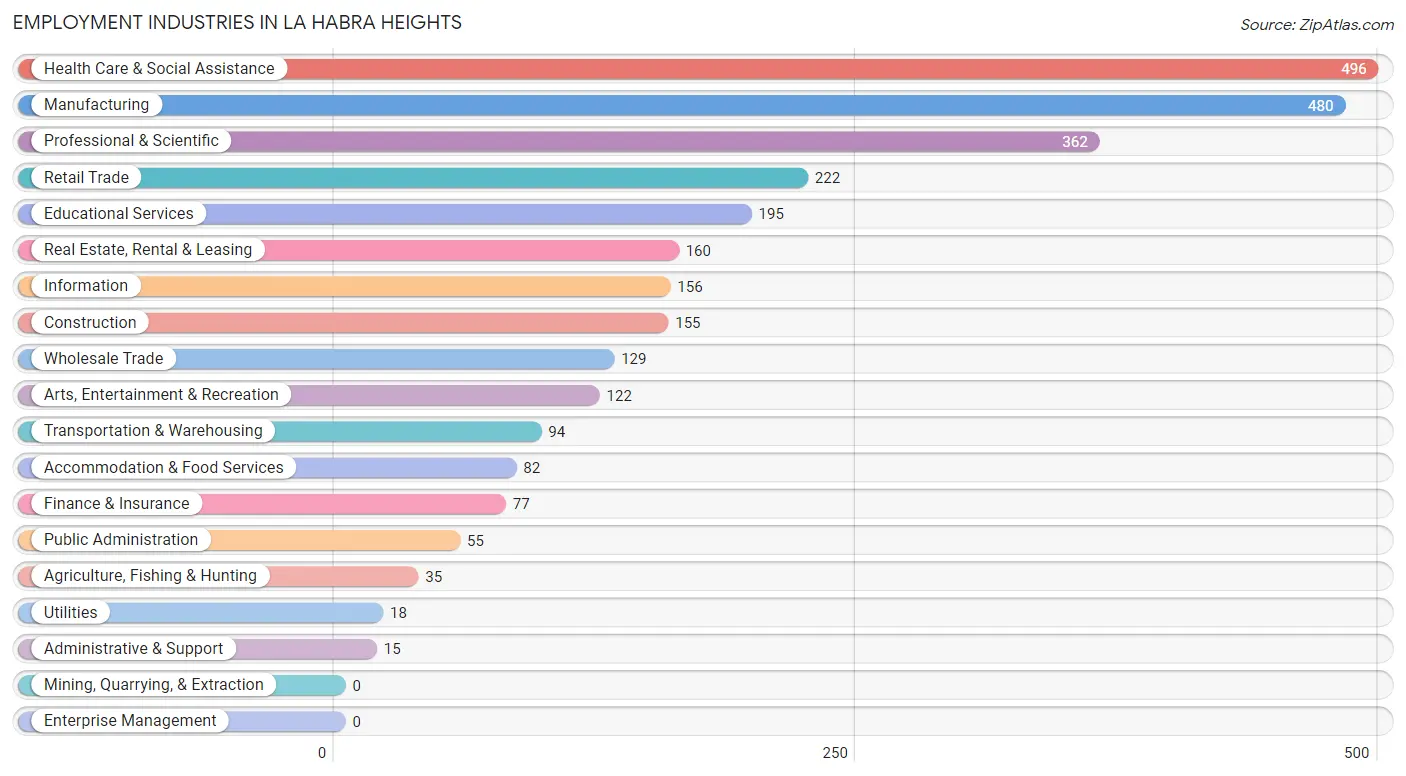
Employment Industries in La Habra Heights
The major employment industries in La Habra Heights include Health Care & Social Assistance (496 | 17.1%), Manufacturing (480 | 16.5%), Professional & Scientific (362 | 12.5%), Retail Trade (222 | 7.6%), and Educational Services (195 | 6.7%).
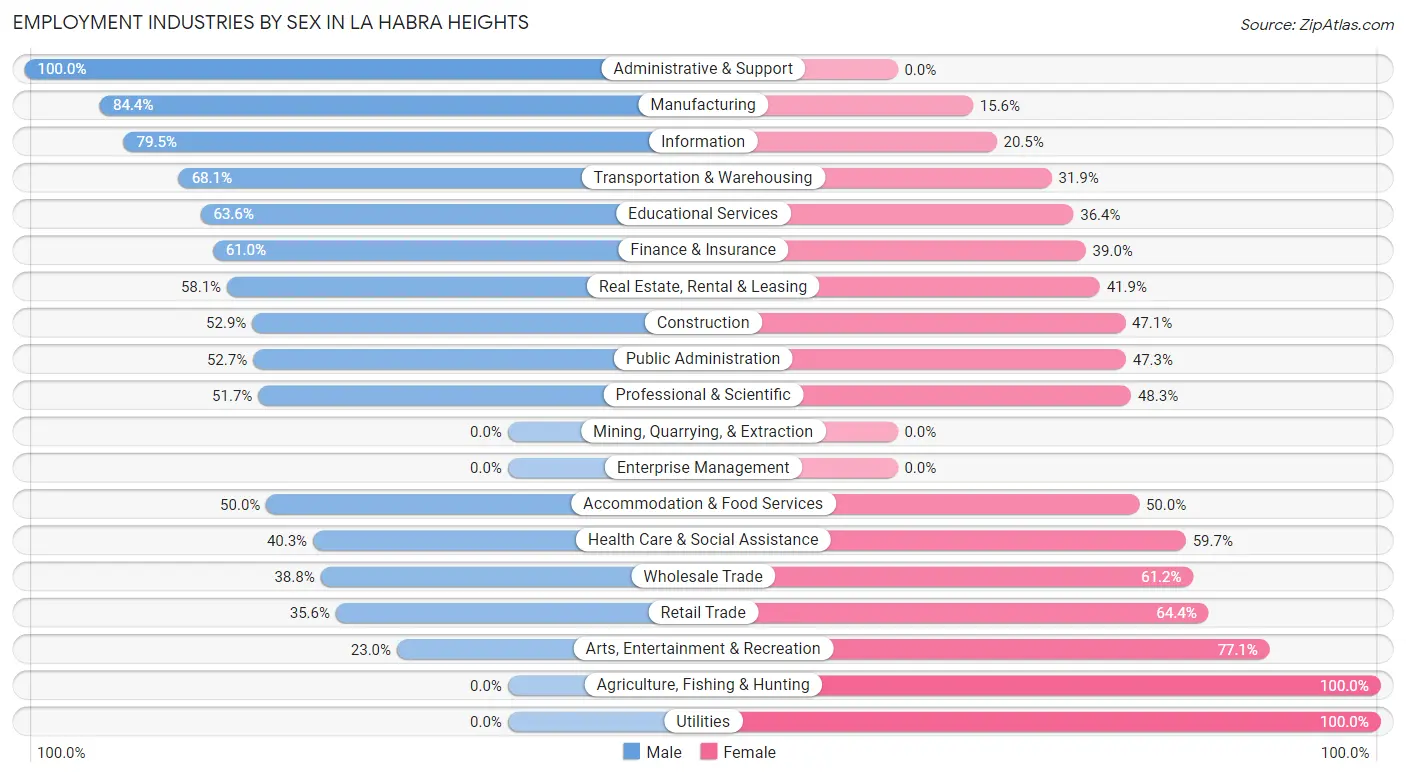
Employment Industries by Sex in La Habra Heights
The La Habra Heights industries that see more men than women are Administrative & Support (100.0%), Manufacturing (84.4%), and Information (79.5%), whereas the industries that tend to have a higher number of women are Agriculture, Fishing & Hunting (100.0%), Utilities (100.0%), and Arts, Entertainment & Recreation (77.0%).
| Industry | Male | Female |
| Agriculture, Fishing & Hunting | 0 (0.0%) | 35 (100.0%) |
| Mining, Quarrying, & Extraction | 0 (0.0%) | 0 (0.0%) |
| Construction | 82 (52.9%) | 73 (47.1%) |
| Manufacturing | 405 (84.4%) | 75 (15.6%) |
| Wholesale Trade | 50 (38.8%) | 79 (61.2%) |
| Retail Trade | 79 (35.6%) | 143 (64.4%) |
| Transportation & Warehousing | 64 (68.1%) | 30 (31.9%) |
| Utilities | 0 (0.0%) | 18 (100.0%) |
| Information | 124 (79.5%) | 32 (20.5%) |
| Finance & Insurance | 47 (61.0%) | 30 (39.0%) |
| Real Estate, Rental & Leasing | 93 (58.1%) | 67 (41.9%) |
| Professional & Scientific | 187 (51.7%) | 175 (48.3%) |
| Enterprise Management | 0 (0.0%) | 0 (0.0%) |
| Administrative & Support | 15 (100.0%) | 0 (0.0%) |
| Educational Services | 124 (63.6%) | 71 (36.4%) |
| Health Care & Social Assistance | 200 (40.3%) | 296 (59.7%) |
| Arts, Entertainment & Recreation | 28 (23.0%) | 94 (77.0%) |
| Accommodation & Food Services | 41 (50.0%) | 41 (50.0%) |
| Public Administration | 29 (52.7%) | 26 (47.3%) |
| Total | 1,574 (54.2%) | 1,330 (45.8%) |
Education in La Habra Heights
School Enrollment in La Habra Heights
The most common levels of schooling among the 1,076 students in La Habra Heights are college / undergraduate (326 | 30.3%), high school (192 | 17.8%), and middle school (159 | 14.8%).
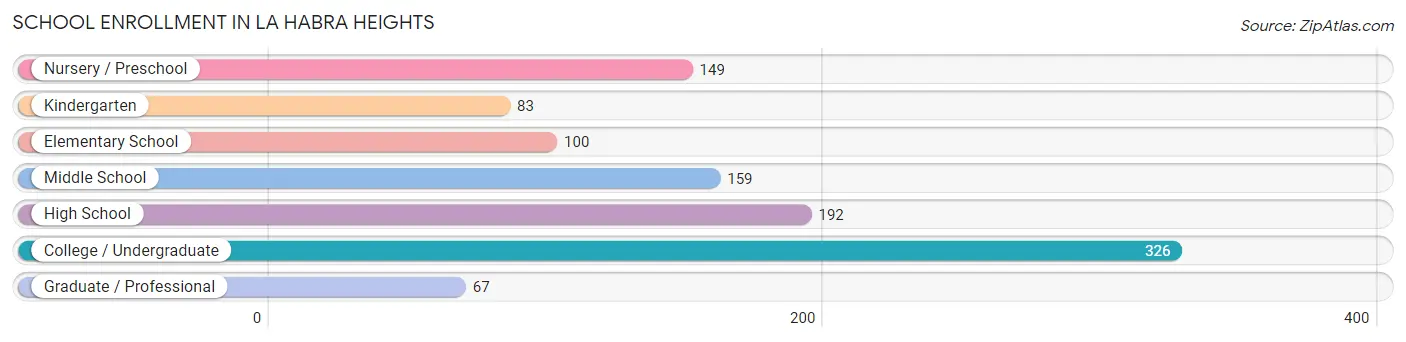
| School Level | # Students | % Students |
| Nursery / Preschool | 149 | 13.9% |
| Kindergarten | 83 | 7.7% |
| Elementary School | 100 | 9.3% |
| Middle School | 159 | 14.8% |
| High School | 192 | 17.8% |
| College / Undergraduate | 326 | 30.3% |
| Graduate / Professional | 67 | 6.2% |
| Total | 1,076 | 100.0% |
School Enrollment by Age by Funding Source in La Habra Heights
Out of a total of 1,076 students who are enrolled in schools in La Habra Heights, 426 (39.6%) attend a private institution, while the remaining 650 (60.4%) are enrolled in public schools. The age group of 3 to 4 year olds has the highest likelihood of being enrolled in private schools, with 125 (100.0% in the age bracket) enrolled. Conversely, the age group of 5 to 9 year old has the lowest likelihood of being enrolled in a private school, with 177 (86.3% in the age bracket) attending a public institution.
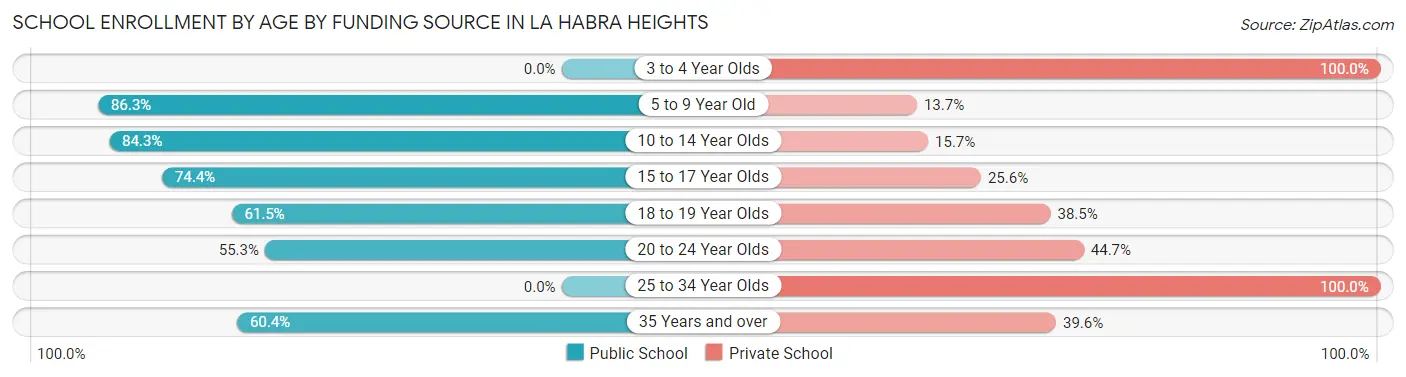
| Age Bracket | Public School | Private School |
| 3 to 4 Year Olds | 0 (0.0%) | 125 (100.0%) |
| 5 to 9 Year Old | 177 (86.3%) | 28 (13.7%) |
| 10 to 14 Year Olds | 150 (84.3%) | 28 (15.7%) |
| 15 to 17 Year Olds | 96 (74.4%) | 33 (25.6%) |
| 18 to 19 Year Olds | 67 (61.5%) | 42 (38.5%) |
| 20 to 24 Year Olds | 105 (55.3%) | 85 (44.7%) |
| 25 to 34 Year Olds | 0 (0.0%) | 49 (100.0%) |
| 35 Years and over | 55 (60.4%) | 36 (39.6%) |
| Total | 650 (60.4%) | 426 (39.6%) |
Educational Attainment by Field of Study in La Habra Heights
Business (472 | 18.8%), engineering (339 | 13.5%), science & technology (251 | 10.0%), education (236 | 9.4%), and bio, nature & agricultural (219 | 8.7%) are the most common fields of study among 2,514 individuals in La Habra Heights who have obtained a bachelor's degree or higher.
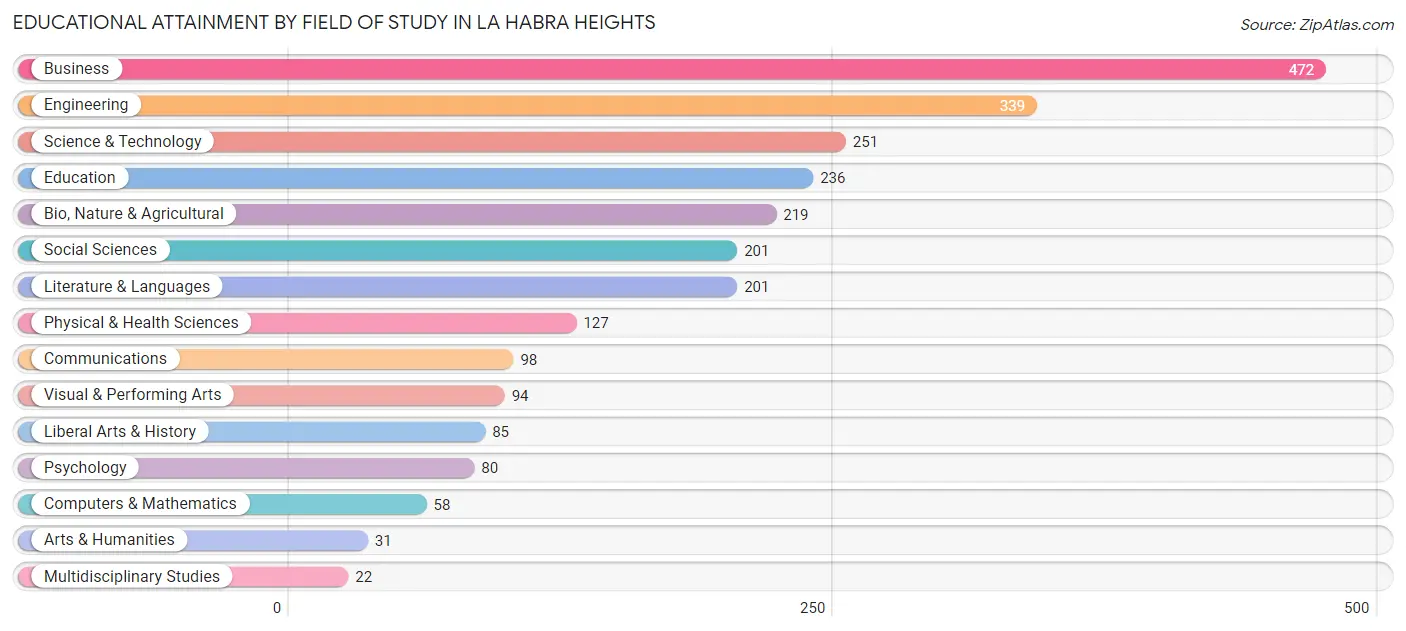
| Field of Study | # Graduates | % Graduates |
| Computers & Mathematics | 58 | 2.3% |
| Bio, Nature & Agricultural | 219 | 8.7% |
| Physical & Health Sciences | 127 | 5.1% |
| Psychology | 80 | 3.2% |
| Social Sciences | 201 | 8.0% |
| Engineering | 339 | 13.5% |
| Multidisciplinary Studies | 22 | 0.9% |
| Science & Technology | 251 | 10.0% |
| Business | 472 | 18.8% |
| Education | 236 | 9.4% |
| Literature & Languages | 201 | 8.0% |
| Liberal Arts & History | 85 | 3.4% |
| Visual & Performing Arts | 94 | 3.7% |
| Communications | 98 | 3.9% |
| Arts & Humanities | 31 | 1.2% |
| Total | 2,514 | 100.0% |
Transportation & Commute in La Habra Heights
Vehicle Availability by Sex in La Habra Heights
The most prevalent vehicle ownership categories in La Habra Heights are males with 2 vehicles (508, accounting for 31.5%) and females with 2 vehicles (356, making up 40.9%).
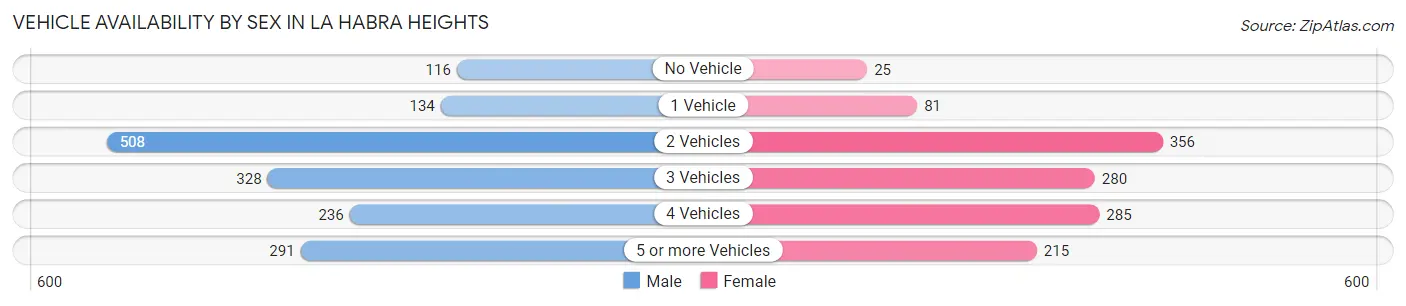
| Vehicles Available | Male | Female |
| No Vehicle | 116 (7.2%) | 25 (2.0%) |
| 1 Vehicle | 134 (8.3%) | 81 (6.5%) |
| 2 Vehicles | 508 (31.5%) | 356 (28.7%) |
| 3 Vehicles | 328 (20.3%) | 280 (22.5%) |
| 4 Vehicles | 236 (14.6%) | 285 (23.0%) |
| 5 or more Vehicles | 291 (18.0%) | 215 (17.3%) |
| Total | 1,613 (100.0%) | 1,242 (100.0%) |
Commute Time in La Habra Heights
The most frequently occuring commute durations in La Habra Heights are 45 to 59 minutes (549 commuters, 22.0%), 20 to 24 minutes (395 commuters, 15.8%), and 40 to 44 minutes (326 commuters, 13.1%).
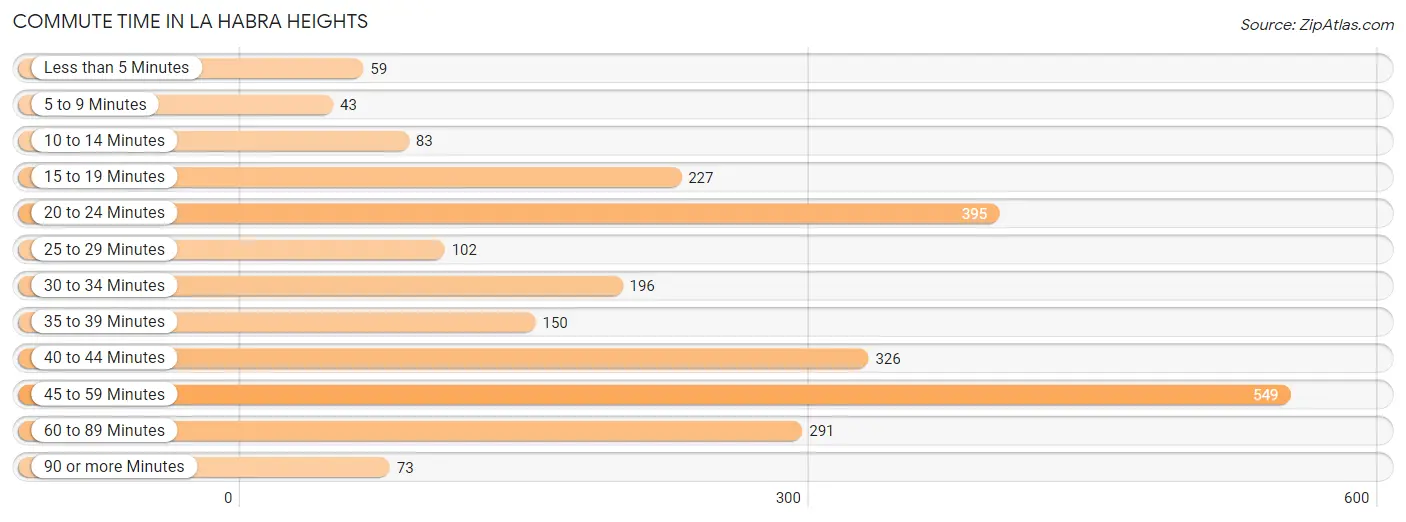
| Commute Time | # Commuters | % Commuters |
| Less than 5 Minutes | 59 | 2.4% |
| 5 to 9 Minutes | 43 | 1.7% |
| 10 to 14 Minutes | 83 | 3.3% |
| 15 to 19 Minutes | 227 | 9.1% |
| 20 to 24 Minutes | 395 | 15.8% |
| 25 to 29 Minutes | 102 | 4.1% |
| 30 to 34 Minutes | 196 | 7.9% |
| 35 to 39 Minutes | 150 | 6.0% |
| 40 to 44 Minutes | 326 | 13.1% |
| 45 to 59 Minutes | 549 | 22.0% |
| 60 to 89 Minutes | 291 | 11.7% |
| 90 or more Minutes | 73 | 2.9% |
Commute Time by Sex in La Habra Heights
The most common commute times in La Habra Heights are 45 to 59 minutes (263 commuters, 19.4%) for males and 45 to 59 minutes (286 commuters, 25.2%) for females.
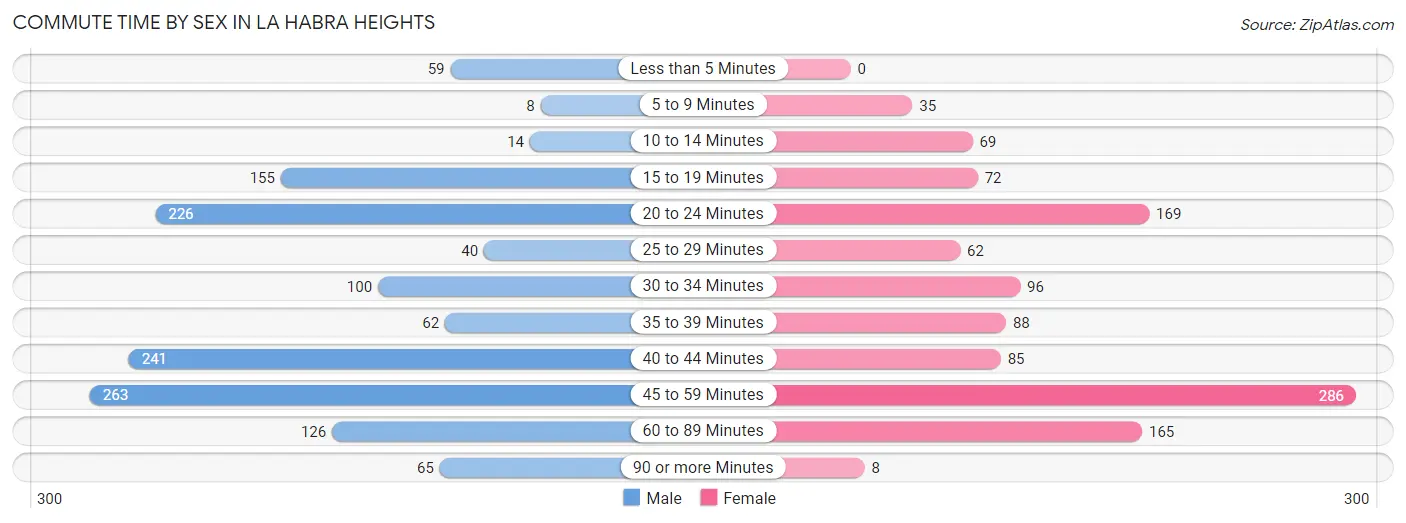
| Commute Time | Male | Female |
| Less than 5 Minutes | 59 (4.3%) | 0 (0.0%) |
| 5 to 9 Minutes | 8 (0.6%) | 35 (3.1%) |
| 10 to 14 Minutes | 14 (1.0%) | 69 (6.1%) |
| 15 to 19 Minutes | 155 (11.4%) | 72 (6.3%) |
| 20 to 24 Minutes | 226 (16.6%) | 169 (14.9%) |
| 25 to 29 Minutes | 40 (2.9%) | 62 (5.5%) |
| 30 to 34 Minutes | 100 (7.4%) | 96 (8.5%) |
| 35 to 39 Minutes | 62 (4.6%) | 88 (7.7%) |
| 40 to 44 Minutes | 241 (17.7%) | 85 (7.5%) |
| 45 to 59 Minutes | 263 (19.4%) | 286 (25.2%) |
| 60 to 89 Minutes | 126 (9.3%) | 165 (14.5%) |
| 90 or more Minutes | 65 (4.8%) | 8 (0.7%) |
Time of Departure to Work by Sex in La Habra Heights
The most frequent times of departure to work in La Habra Heights are 6:00 AM to 6:29 AM (241, 17.7%) for males and 8:00 AM to 8:29 AM (278, 24.5%) for females.
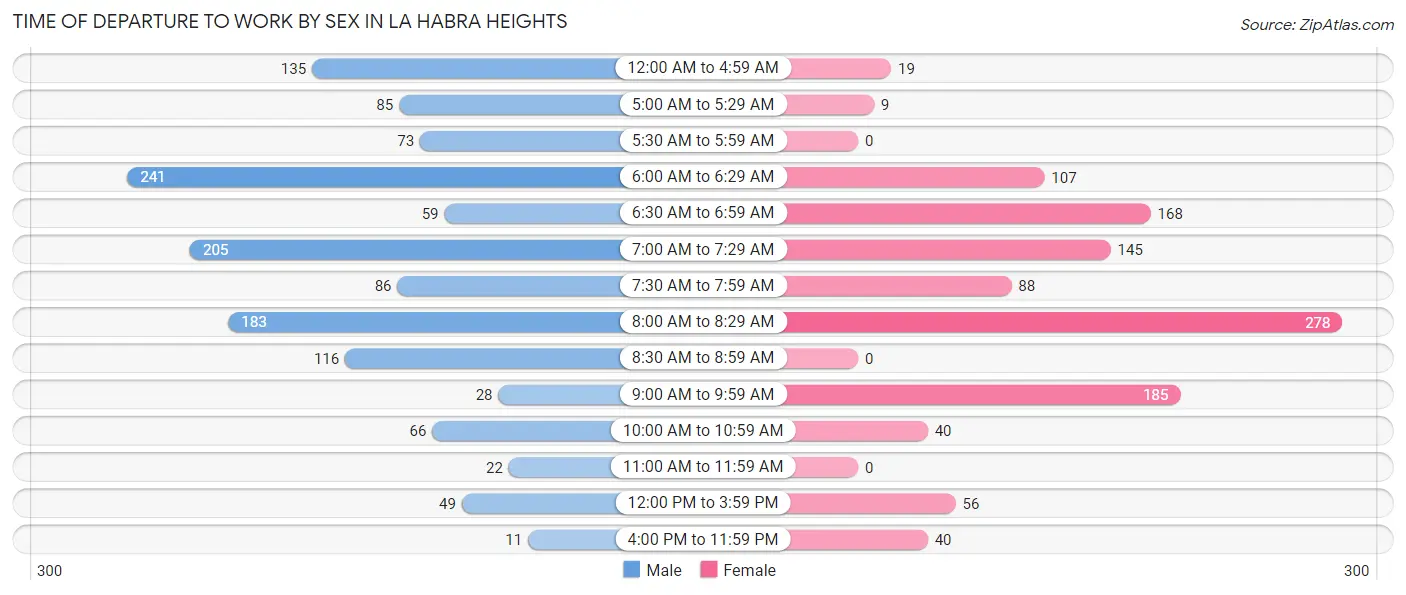
| Time of Departure | Male | Female |
| 12:00 AM to 4:59 AM | 135 (9.9%) | 19 (1.7%) |
| 5:00 AM to 5:29 AM | 85 (6.2%) | 9 (0.8%) |
| 5:30 AM to 5:59 AM | 73 (5.4%) | 0 (0.0%) |
| 6:00 AM to 6:29 AM | 241 (17.7%) | 107 (9.4%) |
| 6:30 AM to 6:59 AM | 59 (4.3%) | 168 (14.8%) |
| 7:00 AM to 7:29 AM | 205 (15.1%) | 145 (12.8%) |
| 7:30 AM to 7:59 AM | 86 (6.3%) | 88 (7.7%) |
| 8:00 AM to 8:29 AM | 183 (13.5%) | 278 (24.5%) |
| 8:30 AM to 8:59 AM | 116 (8.5%) | 0 (0.0%) |
| 9:00 AM to 9:59 AM | 28 (2.1%) | 185 (16.3%) |
| 10:00 AM to 10:59 AM | 66 (4.9%) | 40 (3.5%) |
| 11:00 AM to 11:59 AM | 22 (1.6%) | 0 (0.0%) |
| 12:00 PM to 3:59 PM | 49 (3.6%) | 56 (4.9%) |
| 4:00 PM to 11:59 PM | 11 (0.8%) | 40 (3.5%) |
| Total | 1,359 (100.0%) | 1,135 (100.0%) |
Housing Occupancy in La Habra Heights
Occupancy by Ownership in La Habra Heights
Of the total 1,927 dwellings in La Habra Heights, owner-occupied units account for 1,719 (89.2%), while renter-occupied units make up 208 (10.8%).
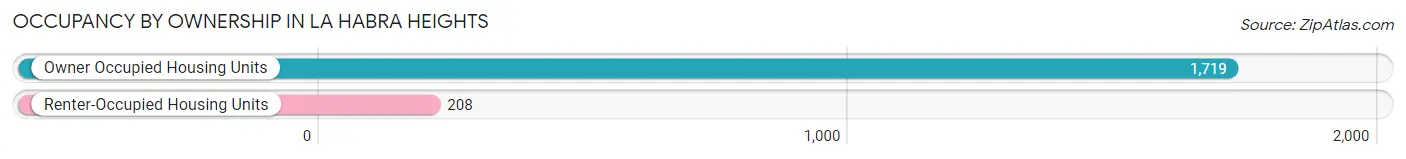
| Occupancy | # Housing Units | % Housing Units |
| Owner Occupied Housing Units | 1,719 | 89.2% |
| Renter-Occupied Housing Units | 208 | 10.8% |
| Total Occupied Housing Units | 1,927 | 100.0% |
Occupancy by Household Size in La Habra Heights
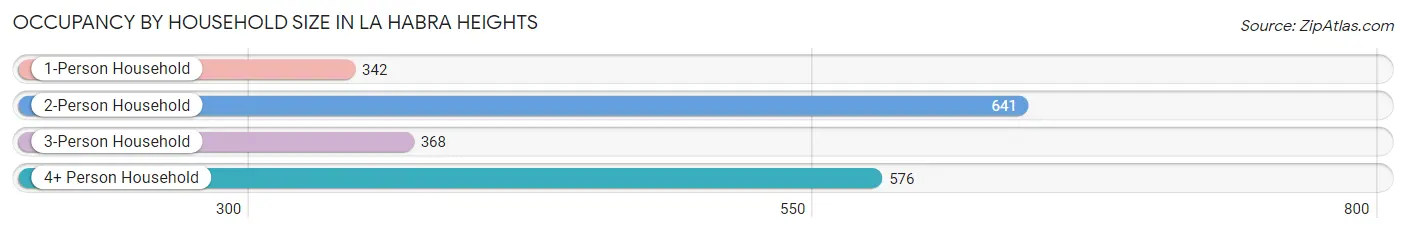
| Household Size | # Housing Units | % Housing Units |
| 1-Person Household | 342 | 17.7% |
| 2-Person Household | 641 | 33.3% |
| 3-Person Household | 368 | 19.1% |
| 4+ Person Household | 576 | 29.9% |
| Total Housing Units | 1,927 | 100.0% |
Occupancy by Ownership by Household Size in La Habra Heights
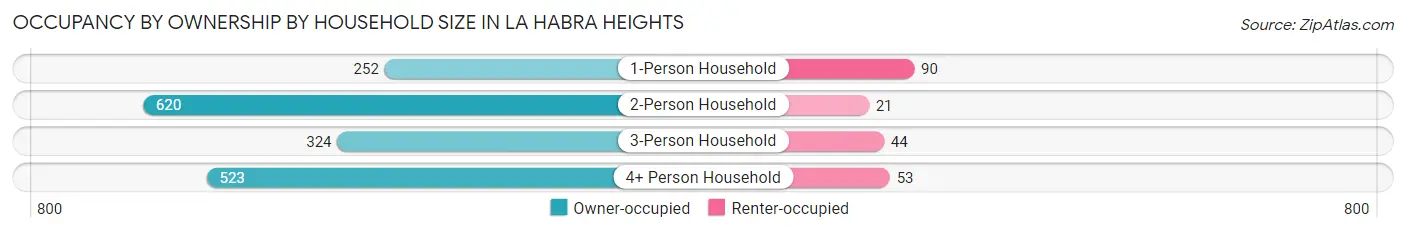
| Household Size | Owner-occupied | Renter-occupied |
| 1-Person Household | 252 (73.7%) | 90 (26.3%) |
| 2-Person Household | 620 (96.7%) | 21 (3.3%) |
| 3-Person Household | 324 (88.0%) | 44 (12.0%) |
| 4+ Person Household | 523 (90.8%) | 53 (9.2%) |
| Total Housing Units | 1,719 (89.2%) | 208 (10.8%) |
Occupancy by Educational Attainment in La Habra Heights
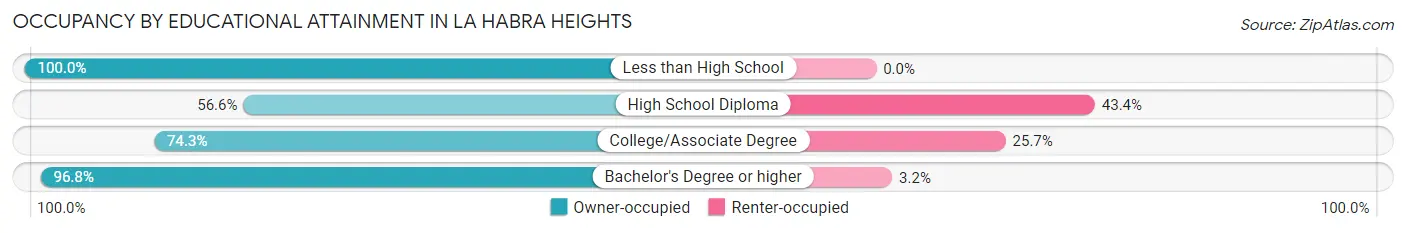
| Household Size | Owner-occupied | Renter-occupied |
| Less than High School | 35 (100.0%) | 0 (0.0%) |
| High School Diploma | 64 (56.6%) | 49 (43.4%) |
| College/Associate Degree | 339 (74.3%) | 117 (25.7%) |
| Bachelor's Degree or higher | 1,281 (96.8%) | 42 (3.2%) |
Occupancy by Age of Householder in La Habra Heights
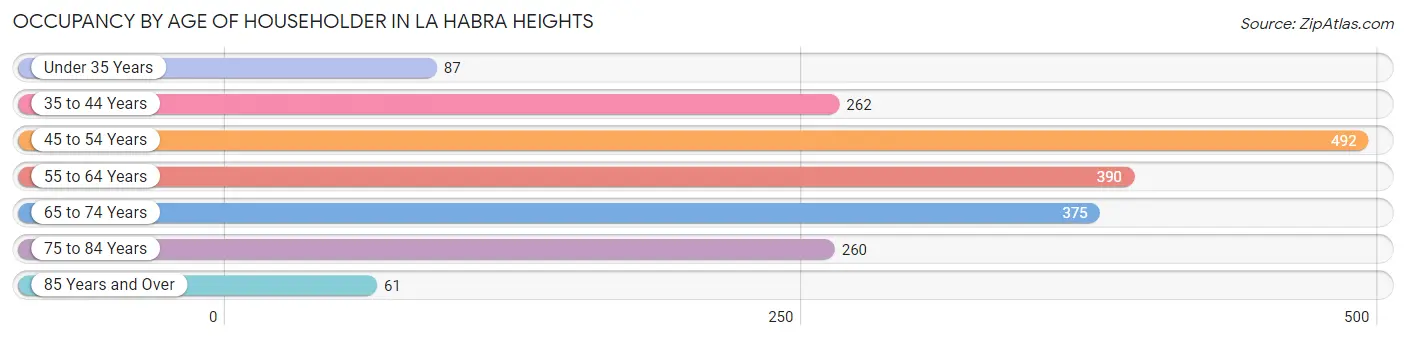
| Age Bracket | # Households | % Households |
| Under 35 Years | 87 | 4.5% |
| 35 to 44 Years | 262 | 13.6% |
| 45 to 54 Years | 492 | 25.5% |
| 55 to 64 Years | 390 | 20.2% |
| 65 to 74 Years | 375 | 19.5% |
| 75 to 84 Years | 260 | 13.5% |
| 85 Years and Over | 61 | 3.2% |
| Total | 1,927 | 100.0% |
Housing Finances in La Habra Heights
Median Income by Occupancy in La Habra Heights

| Occupancy Type | # Households | Median Income |
| Owner-Occupied | 1,719 (89.2%) | $203,958 |
| Renter-Occupied | 208 (10.8%) | $0 |
| Average | 1,927 (100.0%) | $179,990 |
Occupancy by Householder Income Bracket in La Habra Heights
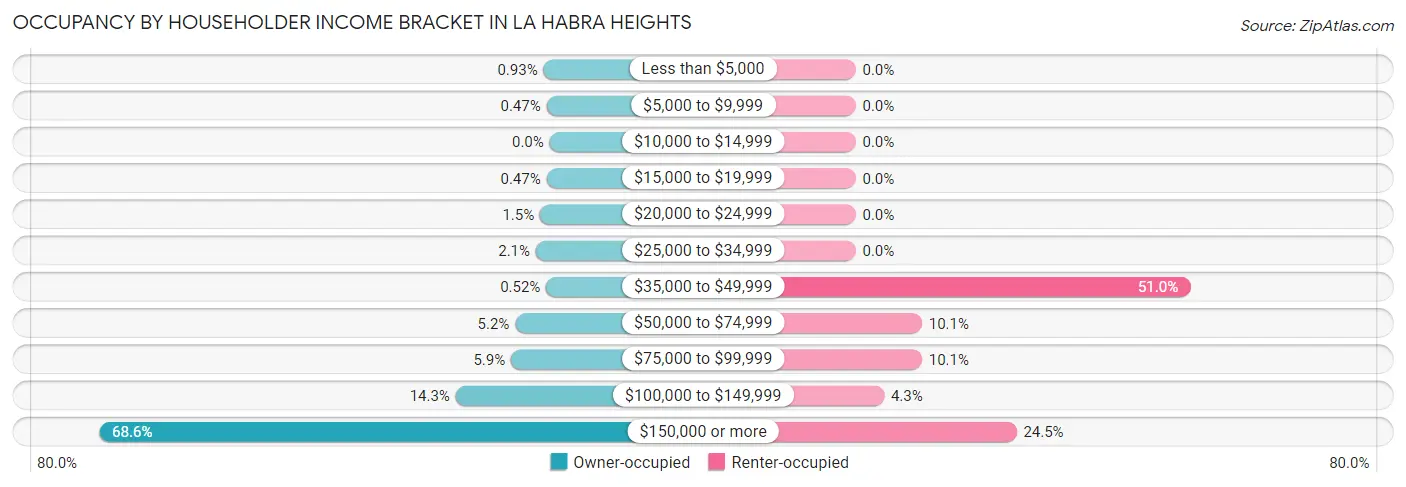
| Income Bracket | Owner-occupied | Renter-occupied |
| Less than $5,000 | 16 (0.9%) | 0 (0.0%) |
| $5,000 to $9,999 | 8 (0.5%) | 0 (0.0%) |
| $10,000 to $14,999 | 0 (0.0%) | 0 (0.0%) |
| $15,000 to $19,999 | 8 (0.5%) | 0 (0.0%) |
| $20,000 to $24,999 | 25 (1.5%) | 0 (0.0%) |
| $25,000 to $34,999 | 36 (2.1%) | 0 (0.0%) |
| $35,000 to $49,999 | 9 (0.5%) | 106 (51.0%) |
| $50,000 to $74,999 | 90 (5.2%) | 21 (10.1%) |
| $75,000 to $99,999 | 101 (5.9%) | 21 (10.1%) |
| $100,000 to $149,999 | 246 (14.3%) | 9 (4.3%) |
| $150,000 or more | 1,180 (68.6%) | 51 (24.5%) |
| Total | 1,719 (100.0%) | 208 (100.0%) |
Monthly Housing Cost Tiers in La Habra Heights
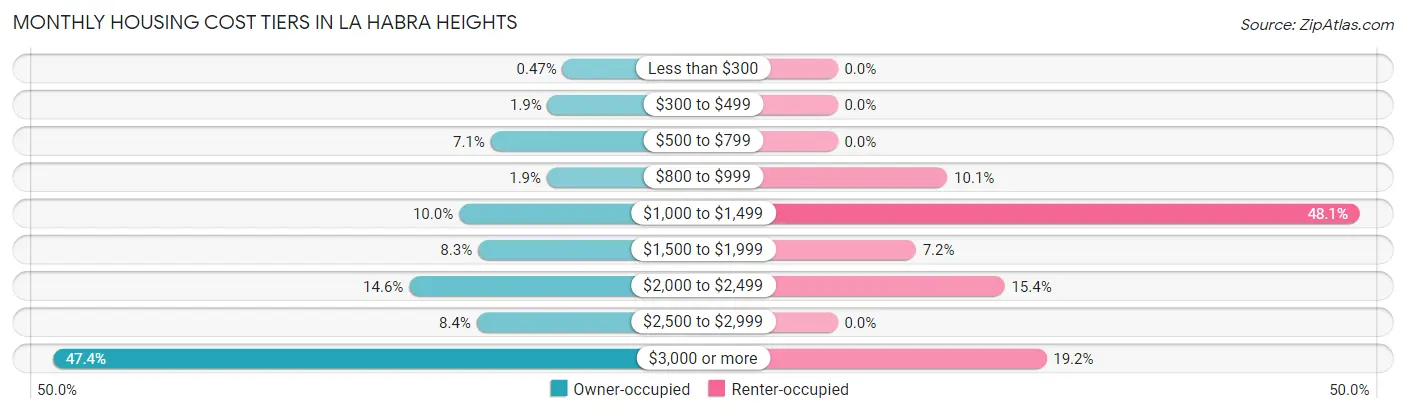
| Monthly Cost | Owner-occupied | Renter-occupied |
| Less than $300 | 8 (0.5%) | 0 (0.0%) |
| $300 to $499 | 32 (1.9%) | 0 (0.0%) |
| $500 to $799 | 122 (7.1%) | 0 (0.0%) |
| $800 to $999 | 33 (1.9%) | 21 (10.1%) |
| $1,000 to $1,499 | 172 (10.0%) | 100 (48.1%) |
| $1,500 to $1,999 | 142 (8.3%) | 15 (7.2%) |
| $2,000 to $2,499 | 251 (14.6%) | 32 (15.4%) |
| $2,500 to $2,999 | 144 (8.4%) | 0 (0.0%) |
| $3,000 or more | 815 (47.4%) | 40 (19.2%) |
| Total | 1,719 (100.0%) | 208 (100.0%) |
Physical Housing Characteristics in La Habra Heights
Housing Structures in La Habra Heights
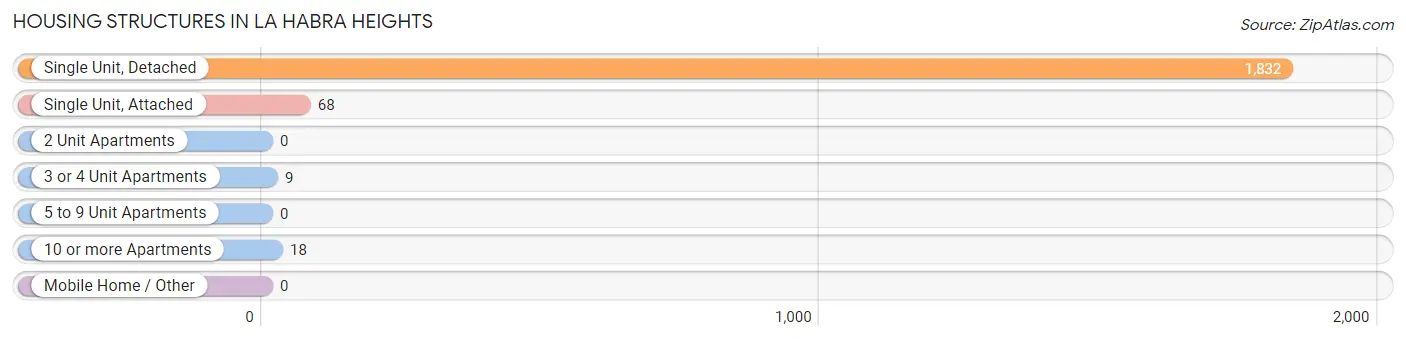
| Structure Type | # Housing Units | % Housing Units |
| Single Unit, Detached | 1,832 | 95.1% |
| Single Unit, Attached | 68 | 3.5% |
| 2 Unit Apartments | 0 | 0.0% |
| 3 or 4 Unit Apartments | 9 | 0.5% |
| 5 to 9 Unit Apartments | 0 | 0.0% |
| 10 or more Apartments | 18 | 0.9% |
| Mobile Home / Other | 0 | 0.0% |
| Total | 1,927 | 100.0% |
Housing Structures by Occupancy in La Habra Heights
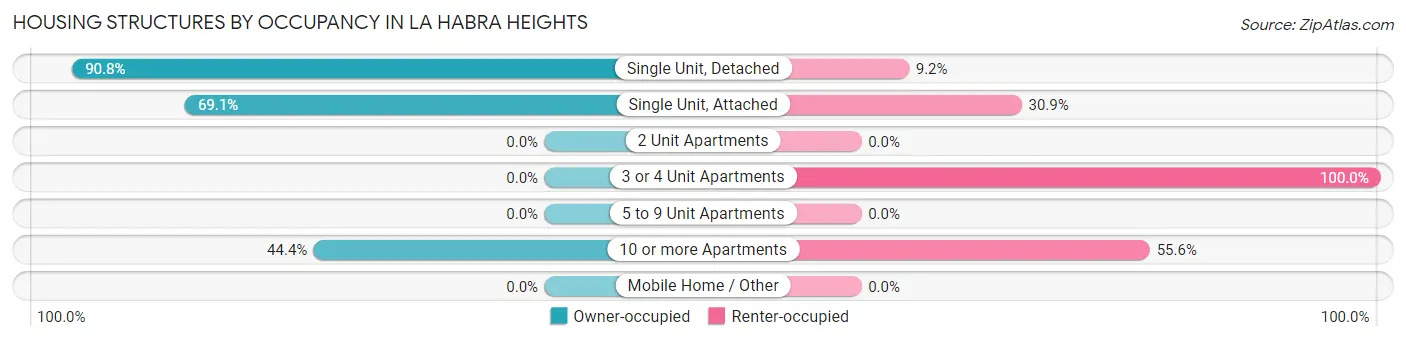
| Structure Type | Owner-occupied | Renter-occupied |
| Single Unit, Detached | 1,664 (90.8%) | 168 (9.2%) |
| Single Unit, Attached | 47 (69.1%) | 21 (30.9%) |
| 2 Unit Apartments | 0 (0.0%) | 0 (0.0%) |
| 3 or 4 Unit Apartments | 0 (0.0%) | 9 (100.0%) |
| 5 to 9 Unit Apartments | 0 (0.0%) | 0 (0.0%) |
| 10 or more Apartments | 8 (44.4%) | 10 (55.6%) |
| Mobile Home / Other | 0 (0.0%) | 0 (0.0%) |
| Total | 1,719 (89.2%) | 208 (10.8%) |
Housing Structures by Number of Rooms in La Habra Heights
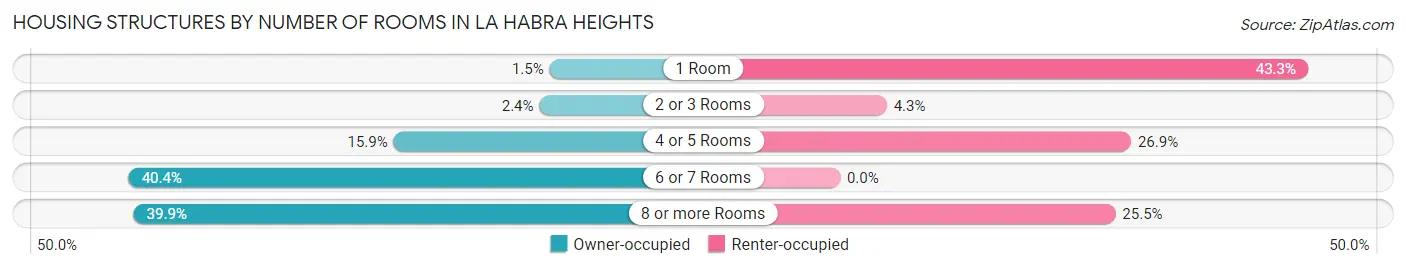
| Number of Rooms | Owner-occupied | Renter-occupied |
| 1 Room | 25 (1.5%) | 90 (43.3%) |
| 2 or 3 Rooms | 41 (2.4%) | 9 (4.3%) |
| 4 or 5 Rooms | 273 (15.9%) | 56 (26.9%) |
| 6 or 7 Rooms | 694 (40.4%) | 0 (0.0%) |
| 8 or more Rooms | 686 (39.9%) | 53 (25.5%) |
| Total | 1,719 (100.0%) | 208 (100.0%) |
Housing Structure by Heating Type in La Habra Heights
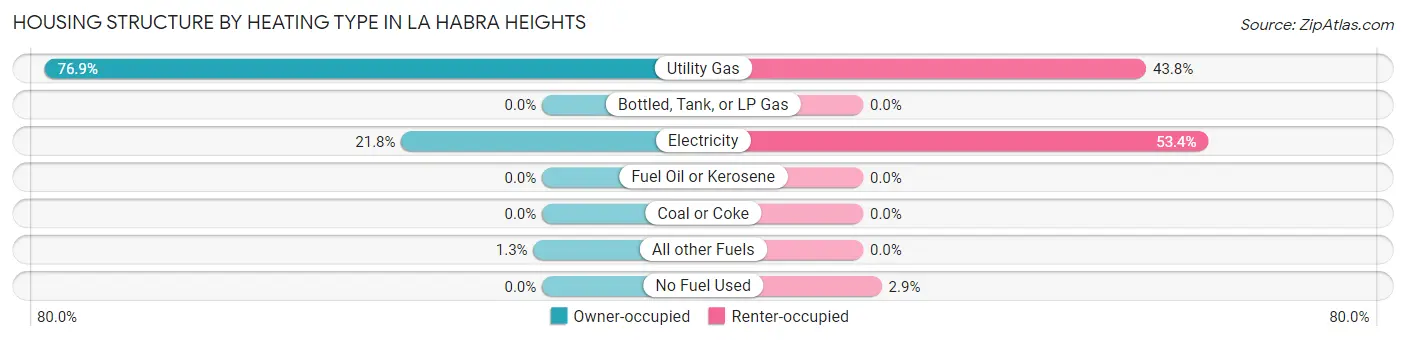
| Heating Type | Owner-occupied | Renter-occupied |
| Utility Gas | 1,322 (76.9%) | 91 (43.8%) |
| Bottled, Tank, or LP Gas | 0 (0.0%) | 0 (0.0%) |
| Electricity | 374 (21.8%) | 111 (53.4%) |
| Fuel Oil or Kerosene | 0 (0.0%) | 0 (0.0%) |
| Coal or Coke | 0 (0.0%) | 0 (0.0%) |
| All other Fuels | 23 (1.3%) | 0 (0.0%) |
| No Fuel Used | 0 (0.0%) | 6 (2.9%) |
| Total | 1,719 (100.0%) | 208 (100.0%) |
Household Vehicle Usage in La Habra Heights
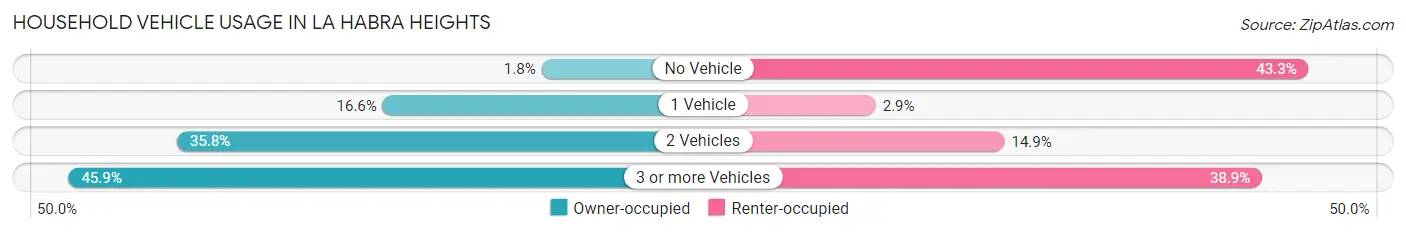
| Vehicles per Household | Owner-occupied | Renter-occupied |
| No Vehicle | 30 (1.8%) | 90 (43.3%) |
| 1 Vehicle | 285 (16.6%) | 6 (2.9%) |
| 2 Vehicles | 615 (35.8%) | 31 (14.9%) |
| 3 or more Vehicles | 789 (45.9%) | 81 (38.9%) |
| Total | 1,719 (100.0%) | 208 (100.0%) |
Real Estate & Mortgages in La Habra Heights
Real Estate and Mortgage Overview in La Habra Heights
| Characteristic | Without Mortgage | With Mortgage |
| Housing Units | 584 | 1,135 |
| Median Property Value | $1,108,000 | $1,047,700 |
| Median Household Income | $171,765 | $857 |
| Monthly Housing Costs | $1,303 | $775 |
| Real Estate Taxes | $7,885 | $0 |
Property Value by Mortgage Status in La Habra Heights
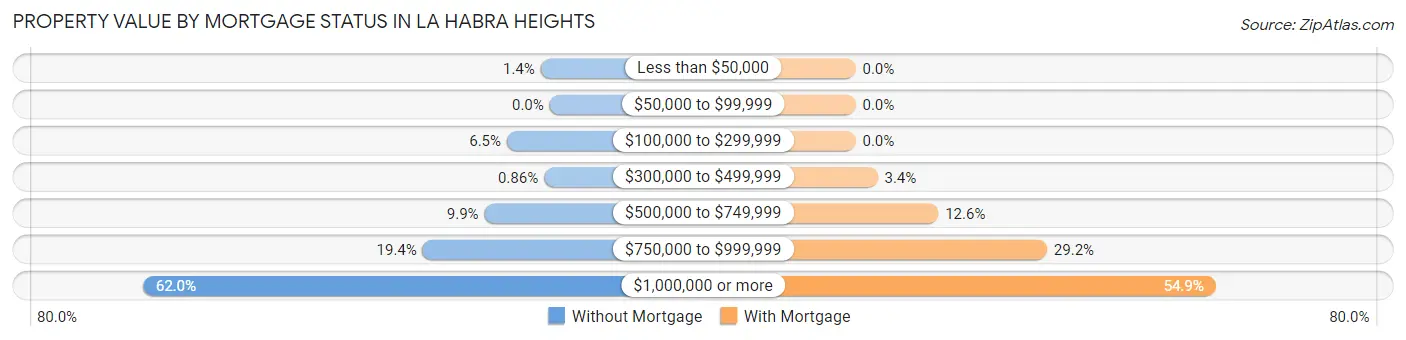
| Property Value | Without Mortgage | With Mortgage |
| Less than $50,000 | 8 (1.4%) | 0 (0.0%) |
| $50,000 to $99,999 | 0 (0.0%) | 0 (0.0%) |
| $100,000 to $299,999 | 38 (6.5%) | 0 (0.0%) |
| $300,000 to $499,999 | 5 (0.9%) | 38 (3.4%) |
| $500,000 to $749,999 | 58 (9.9%) | 143 (12.6%) |
| $750,000 to $999,999 | 113 (19.4%) | 331 (29.2%) |
| $1,000,000 or more | 362 (62.0%) | 623 (54.9%) |
| Total | 584 (100.0%) | 1,135 (100.0%) |
Household Income by Mortgage Status in La Habra Heights
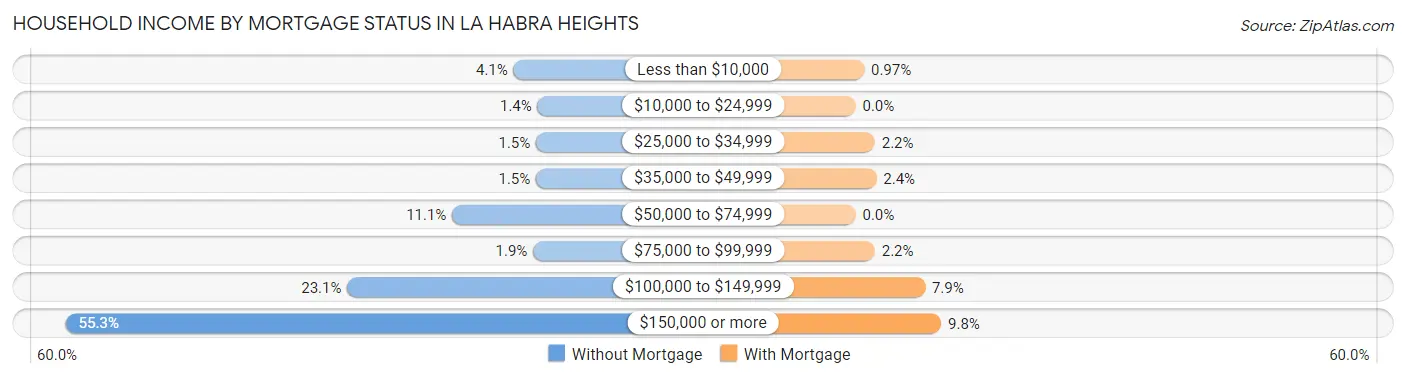
| Household Income | Without Mortgage | With Mortgage |
| Less than $10,000 | 24 (4.1%) | 11 (1.0%) |
| $10,000 to $24,999 | 8 (1.4%) | 0 (0.0%) |
| $25,000 to $34,999 | 9 (1.5%) | 25 (2.2%) |
| $35,000 to $49,999 | 9 (1.5%) | 27 (2.4%) |
| $50,000 to $74,999 | 65 (11.1%) | 0 (0.0%) |
| $75,000 to $99,999 | 11 (1.9%) | 25 (2.2%) |
| $100,000 to $149,999 | 135 (23.1%) | 90 (7.9%) |
| $150,000 or more | 323 (55.3%) | 111 (9.8%) |
| Total | 584 (100.0%) | 1,135 (100.0%) |
Property Value to Household Income Ratio in La Habra Heights
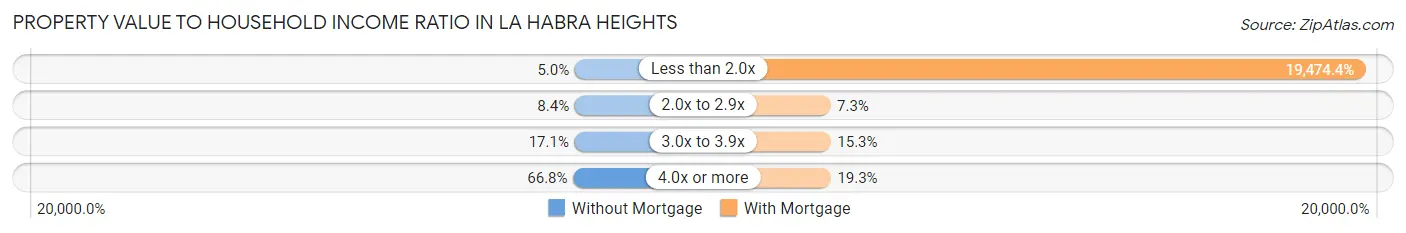
| Value-to-Income Ratio | Without Mortgage | With Mortgage |
| Less than 2.0x | 29 (5.0%) | 221,034 (19,474.4%) |
| 2.0x to 2.9x | 49 (8.4%) | 83 (7.3%) |
| 3.0x to 3.9x | 100 (17.1%) | 174 (15.3%) |
| 4.0x or more | 390 (66.8%) | 219 (19.3%) |
| Total | 584 (100.0%) | 1,135 (100.0%) |
Real Estate Taxes by Mortgage Status in La Habra Heights
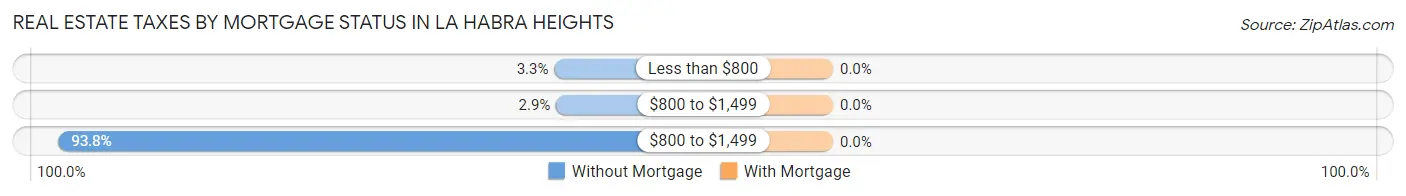
| Property Taxes | Without Mortgage | With Mortgage |
| Less than $800 | 19 (3.3%) | 0 (0.0%) |
| $800 to $1,499 | 17 (2.9%) | 0 (0.0%) |
| $800 to $1,499 | 548 (93.8%) | 0 (0.0%) |
| Total | 584 (100.0%) | 1,135 (100.0%) |
Health & Disability in La Habra Heights
Health Insurance Coverage by Age in La Habra Heights
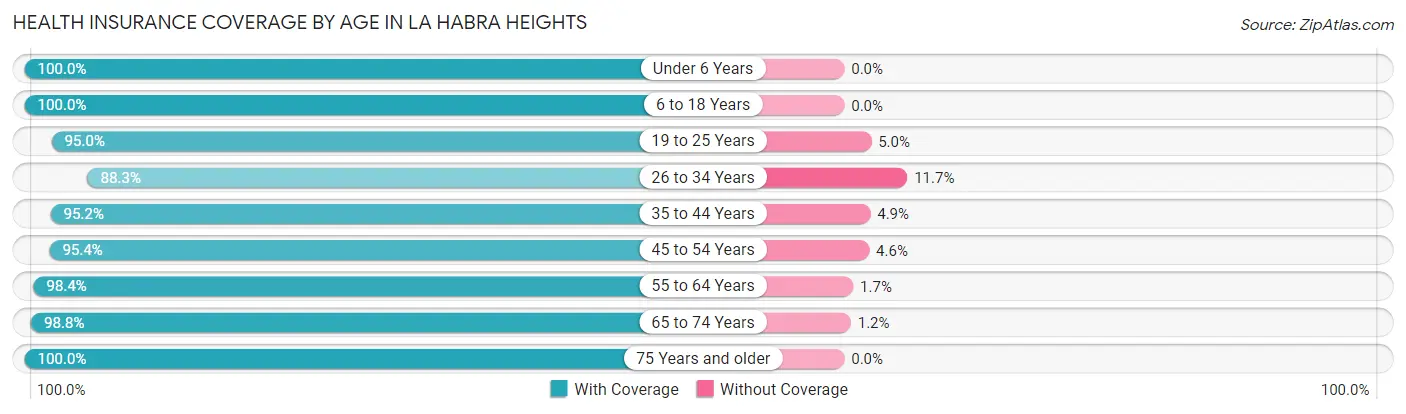
| Age Bracket | With Coverage | Without Coverage |
| Under 6 Years | 436 (100.0%) | 0 (0.0%) |
| 6 to 18 Years | 544 (100.0%) | 0 (0.0%) |
| 19 to 25 Years | 397 (95.0%) | 21 (5.0%) |
| 26 to 34 Years | 496 (88.3%) | 66 (11.7%) |
| 35 to 44 Years | 510 (95.2%) | 26 (4.9%) |
| 45 to 54 Years | 904 (95.4%) | 44 (4.6%) |
| 55 to 64 Years | 715 (98.4%) | 12 (1.7%) |
| 65 to 74 Years | 819 (98.8%) | 10 (1.2%) |
| 75 Years and older | 504 (100.0%) | 0 (0.0%) |
| Total | 5,325 (96.8%) | 179 (3.3%) |
Health Insurance Coverage by Citizenship Status in La Habra Heights
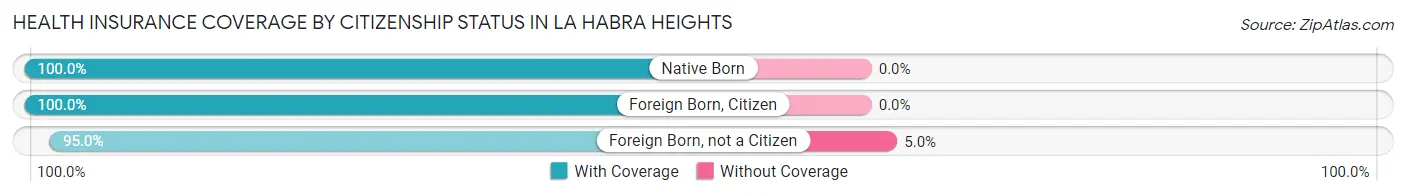
| Citizenship Status | With Coverage | Without Coverage |
| Native Born | 436 (100.0%) | 0 (0.0%) |
| Foreign Born, Citizen | 544 (100.0%) | 0 (0.0%) |
| Foreign Born, not a Citizen | 397 (95.0%) | 21 (5.0%) |
Health Insurance Coverage by Household Income in La Habra Heights
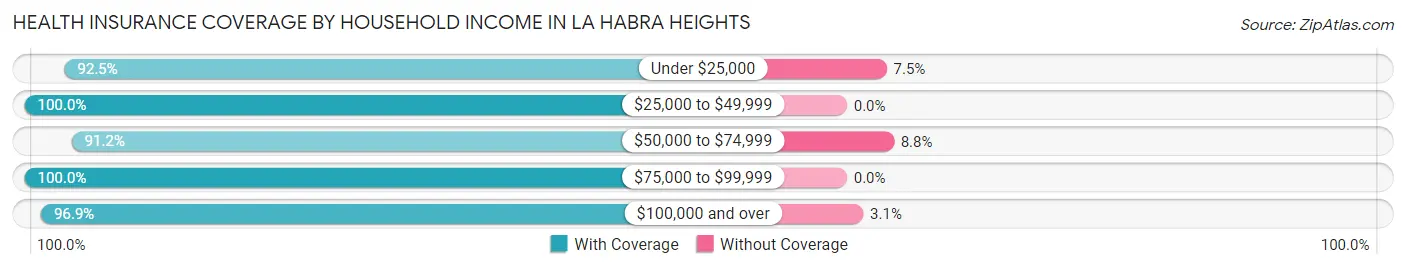
| Household Income | With Coverage | Without Coverage |
| Under $25,000 | 124 (92.5%) | 10 (7.5%) |
| $25,000 to $49,999 | 103 (100.0%) | 0 (0.0%) |
| $50,000 to $74,999 | 301 (91.2%) | 29 (8.8%) |
| $75,000 to $99,999 | 351 (100.0%) | 0 (0.0%) |
| $100,000 and over | 4,425 (96.9%) | 140 (3.1%) |
Public vs Private Health Insurance Coverage by Age in La Habra Heights
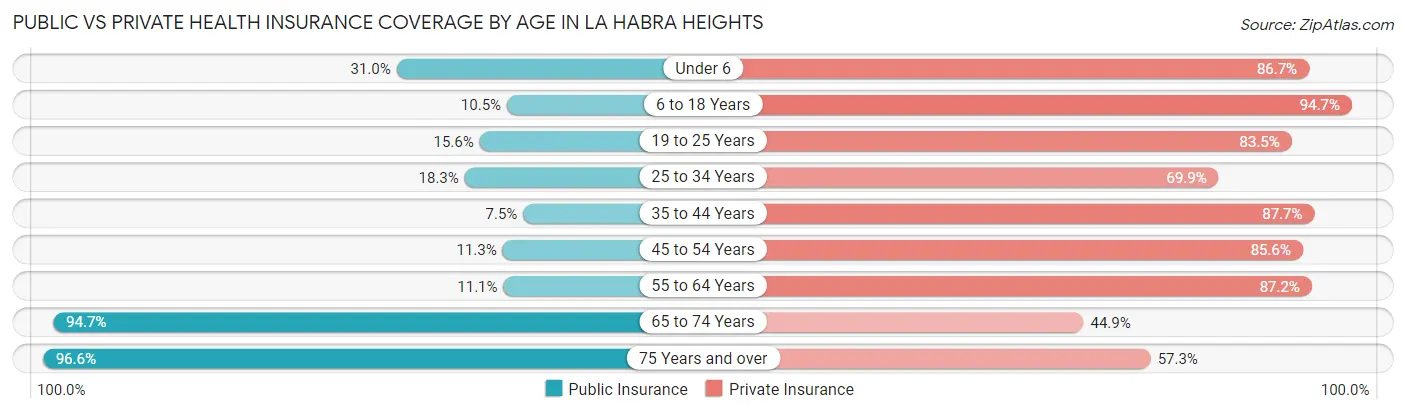
| Age Bracket | Public Insurance | Private Insurance |
| Under 6 | 135 (31.0%) | 378 (86.7%) |
| 6 to 18 Years | 57 (10.5%) | 515 (94.7%) |
| 19 to 25 Years | 65 (15.5%) | 349 (83.5%) |
| 25 to 34 Years | 103 (18.3%) | 393 (69.9%) |
| 35 to 44 Years | 40 (7.5%) | 470 (87.7%) |
| 45 to 54 Years | 107 (11.3%) | 811 (85.6%) |
| 55 to 64 Years | 81 (11.1%) | 634 (87.2%) |
| 65 to 74 Years | 785 (94.7%) | 372 (44.9%) |
| 75 Years and over | 487 (96.6%) | 289 (57.3%) |
| Total | 1,860 (33.8%) | 4,211 (76.5%) |
Disability Status by Sex by Age in La Habra Heights
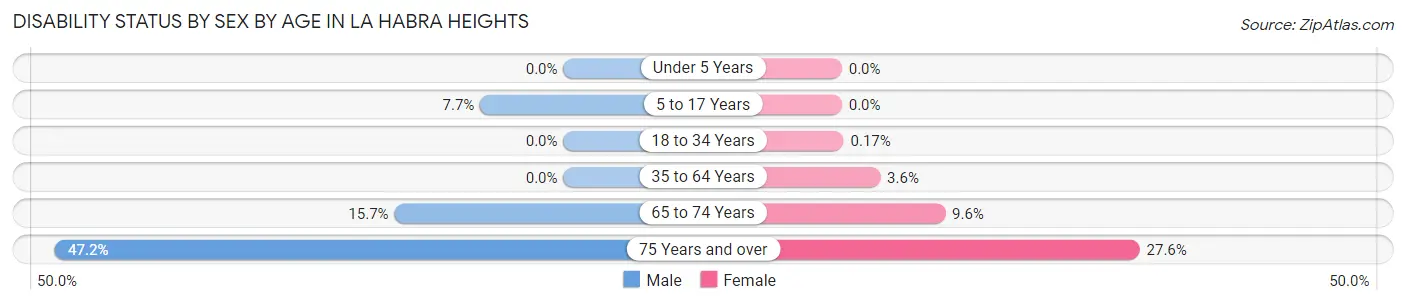
| Age Bracket | Male | Female |
| Under 5 Years | 0 (0.0%) | 0 (0.0%) |
| 5 to 17 Years | 20 (7.7%) | 0 (0.0%) |
| 18 to 34 Years | 0 (0.0%) | 1 (0.2%) |
| 35 to 64 Years | 0 (0.0%) | 39 (3.6%) |
| 65 to 74 Years | 58 (15.7%) | 44 (9.6%) |
| 75 Years and over | 108 (47.2%) | 76 (27.6%) |
Disability Class by Sex by Age in La Habra Heights
Disability Class: Hearing Difficulty
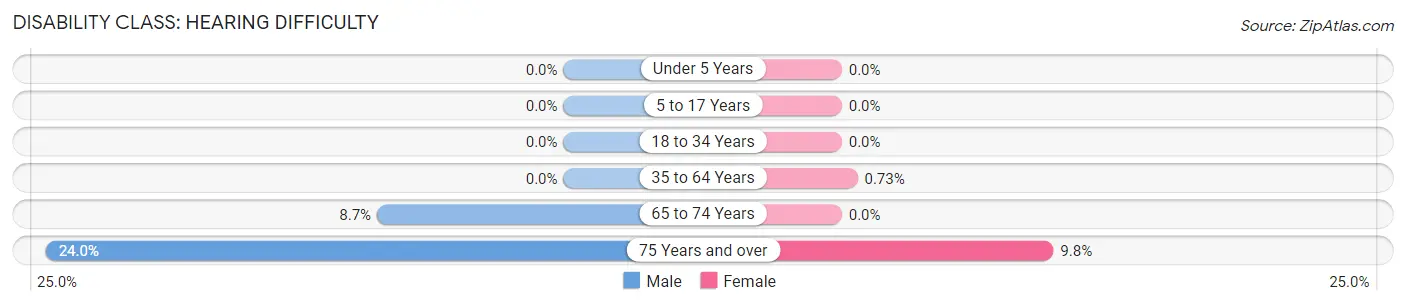
| Age Bracket | Male | Female |
| Under 5 Years | 0 (0.0%) | 0 (0.0%) |
| 5 to 17 Years | 0 (0.0%) | 0 (0.0%) |
| 18 to 34 Years | 0 (0.0%) | 0 (0.0%) |
| 35 to 64 Years | 0 (0.0%) | 8 (0.7%) |
| 65 to 74 Years | 32 (8.6%) | 0 (0.0%) |
| 75 Years and over | 55 (24.0%) | 27 (9.8%) |
Disability Class: Vision Difficulty
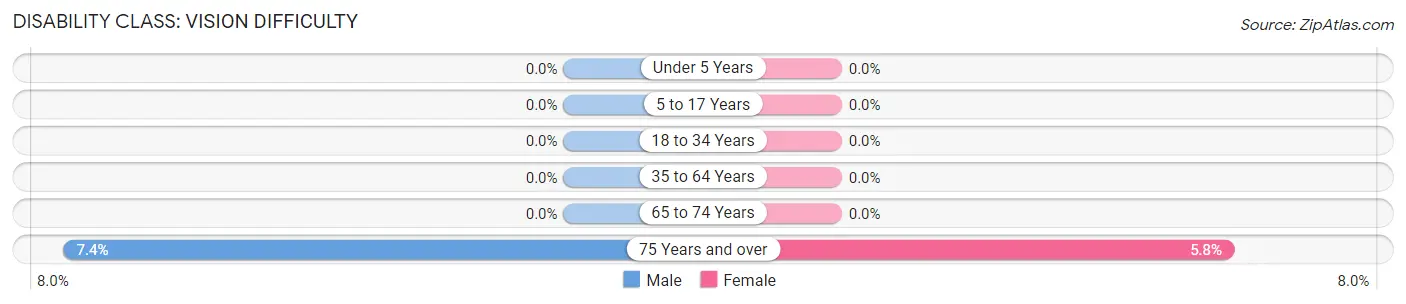
| Age Bracket | Male | Female |
| Under 5 Years | 0 (0.0%) | 0 (0.0%) |
| 5 to 17 Years | 0 (0.0%) | 0 (0.0%) |
| 18 to 34 Years | 0 (0.0%) | 0 (0.0%) |
| 35 to 64 Years | 0 (0.0%) | 0 (0.0%) |
| 65 to 74 Years | 0 (0.0%) | 0 (0.0%) |
| 75 Years and over | 17 (7.4%) | 16 (5.8%) |
Disability Class: Cognitive Difficulty
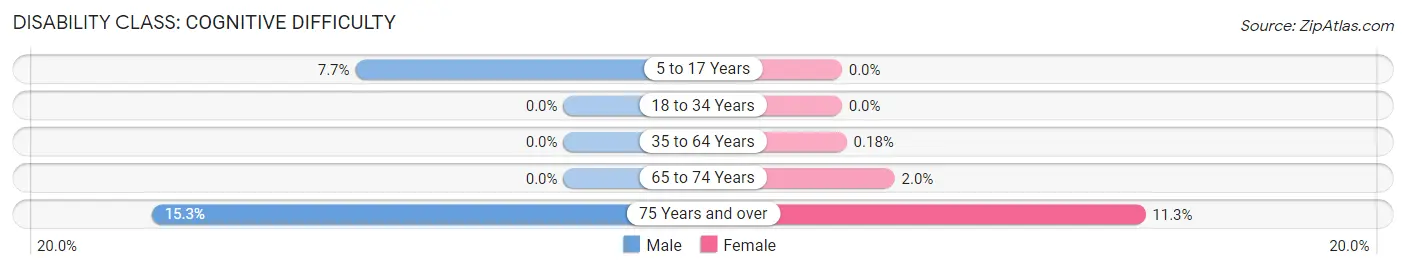
| Age Bracket | Male | Female |
| 5 to 17 Years | 20 (7.7%) | 0 (0.0%) |
| 18 to 34 Years | 0 (0.0%) | 0 (0.0%) |
| 35 to 64 Years | 0 (0.0%) | 2 (0.2%) |
| 65 to 74 Years | 0 (0.0%) | 9 (2.0%) |
| 75 Years and over | 35 (15.3%) | 31 (11.3%) |
Disability Class: Ambulatory Difficulty
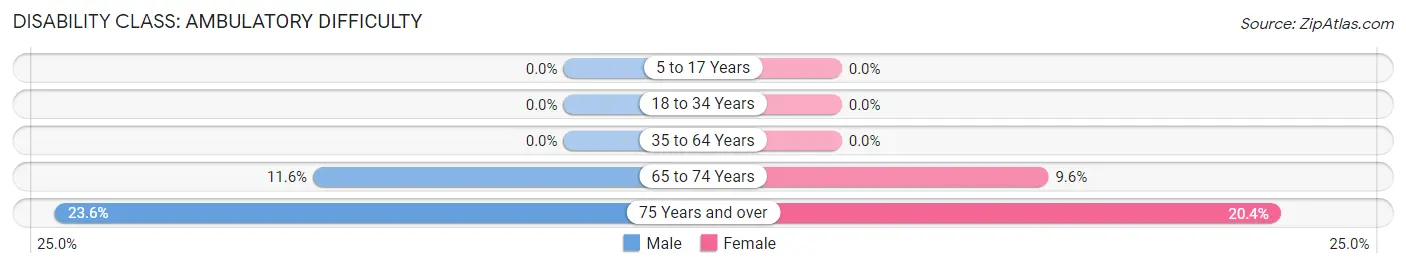
| Age Bracket | Male | Female |
| 5 to 17 Years | 0 (0.0%) | 0 (0.0%) |
| 18 to 34 Years | 0 (0.0%) | 0 (0.0%) |
| 35 to 64 Years | 0 (0.0%) | 0 (0.0%) |
| 65 to 74 Years | 43 (11.6%) | 44 (9.6%) |
| 75 Years and over | 54 (23.6%) | 56 (20.4%) |
Disability Class: Self-Care Difficulty
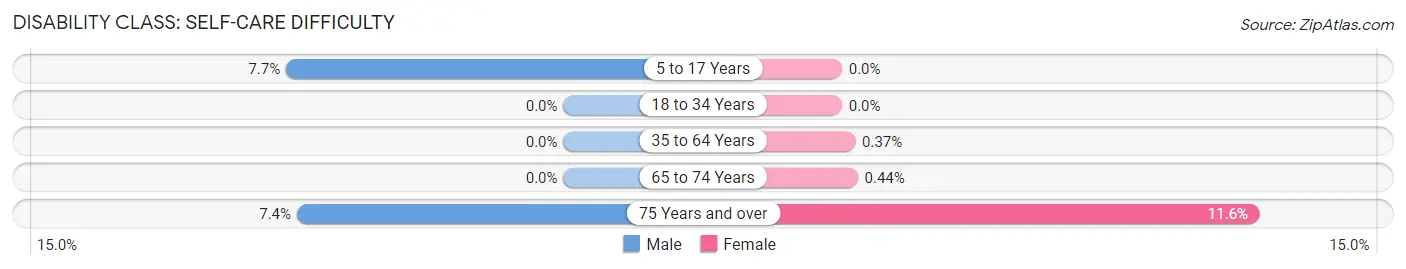
| Age Bracket | Male | Female |
| 5 to 17 Years | 20 (7.7%) | 0 (0.0%) |
| 18 to 34 Years | 0 (0.0%) | 0 (0.0%) |
| 35 to 64 Years | 0 (0.0%) | 4 (0.4%) |
| 65 to 74 Years | 0 (0.0%) | 2 (0.4%) |
| 75 Years and over | 17 (7.4%) | 32 (11.6%) |
Technology Access in La Habra Heights
Computing Device Access in La Habra Heights
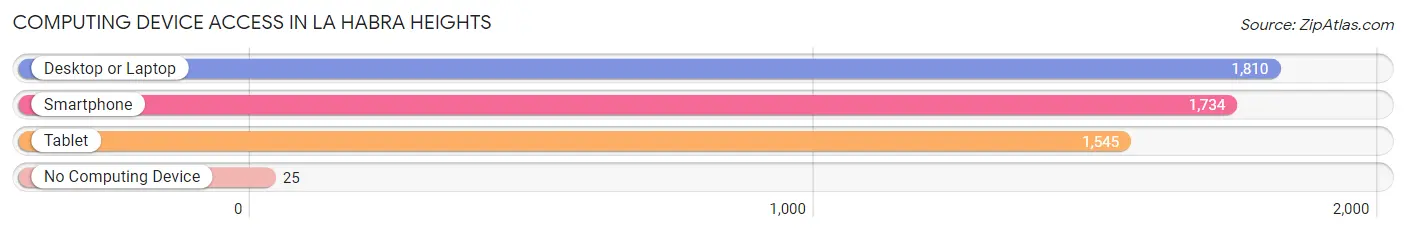
| Device Type | # Households | % Households |
| Desktop or Laptop | 1,810 | 93.9% |
| Smartphone | 1,734 | 90.0% |
| Tablet | 1,545 | 80.2% |
| No Computing Device | 25 | 1.3% |
| Total | 1,927 | 100.0% |
Internet Access in La Habra Heights
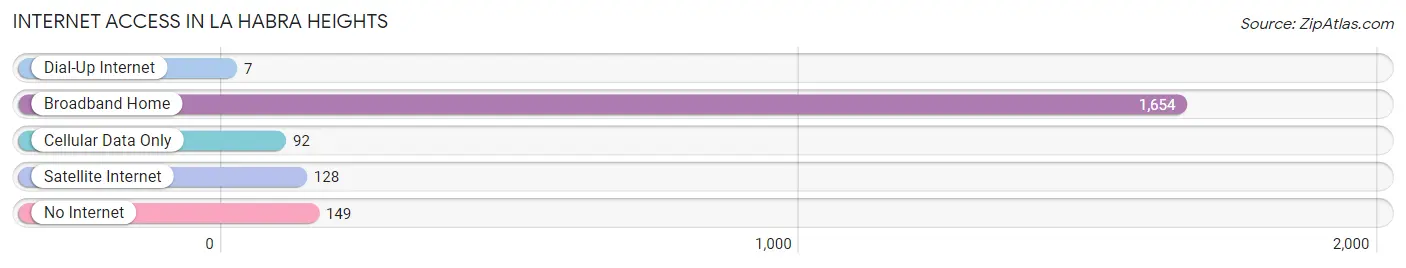
| Internet Type | # Households | % Households |
| Dial-Up Internet | 7 | 0.4% |
| Broadband Home | 1,654 | 85.8% |
| Cellular Data Only | 92 | 4.8% |
| Satellite Internet | 128 | 6.6% |
| No Internet | 149 | 7.7% |
| Total | 1,927 | 100.0% |
La Habra Heights Summary
HISTORY
La Habra Heights is a small city located in the northwestern corner of Orange County, California. It is bordered by the cities of La Habra, Brea, and Whittier. The city was incorporated in 1960 and has a population of 5,325 as of the 2010 census.
The area that is now La Habra Heights was originally inhabited by the Tongva Native Americans. The first Europeans to settle in the area were the Spanish, who established the Rancho La Habra in 1839. The rancho was later divided into smaller parcels and sold to settlers in the late 19th century.
In the early 20th century, the area was primarily used for agriculture, with citrus and avocado groves being the main crops. In the 1950s, the area began to be developed for residential use, and in 1960, the City of La Habra Heights was incorporated.
GEOGRAPHY
La Habra Heights is located in the northwestern corner of Orange County, California. It is bordered by the cities of La Habra, Brea, and Whittier. The city covers an area of 4.2 square miles and has an elevation of 830 feet.
The city is located in the Puente Hills, a range of hills that runs along the border between Los Angeles and Orange counties. The hills are part of the larger Transverse Ranges, which run east-west across Southern California.
The climate in La Habra Heights is Mediterranean, with hot, dry summers and mild, wet winters. The average annual temperature is 64°F, and the average annual precipitation is 17.5 inches.
ECONOMY
The economy of La Habra Heights is primarily based on residential development and services. The city is home to a number of small businesses, including restaurants, retail stores, and professional services.
The city is also home to a number of corporate headquarters, including the headquarters of the La Habra Heights Water District and the La Habra Heights Country Club.
DEMOGRAPHICS
As of the 2010 census, the population of La Habra Heights was 5,325. The racial makeup of the city was 73.3% White, 0.7% African American, 0.3% Native American, 11.2% Asian, 0.1% Pacific Islander, 11.2% from other races, and 3.2% from two or more races. Hispanic or Latino of any race were 24.3% of the population.
The median household income in La Habra Heights was $90,945, and the median family income was $103,945. The per capita income was $37,945. About 4.3% of families and 5.3% of the population were below the poverty line.
Common Questions
What is Per Capita Income in La Habra Heights?
Per Capita income in La Habra Heights is $89,507.
What is the Median Family Income in La Habra Heights?
Median Family Income in La Habra Heights is $195,250.
What is the Median Household income in La Habra Heights?
Median Household Income in La Habra Heights is $179,990.
What is Income or Wage Gap in La Habra Heights?
Income or Wage Gap in La Habra Heights is 49.7%.
Women in La Habra Heights earn 50.3 cents for every dollar earned by a man.
What is Family Income Deficit in La Habra Heights?
Family Income Deficit in La Habra Heights is $13,919.
Families that are below poverty line in La Habra Heights earn $13,919 less on average than the poverty threshold level.
What is Inequality or Gini Index in La Habra Heights?
Inequality or Gini Index in La Habra Heights is 0.46.
What is the Total Population of La Habra Heights?
Total Population of La Habra Heights is 5,599.
What is the Total Male Population of La Habra Heights?
Total Male Population of La Habra Heights is 2,748.
What is the Total Female Population of La Habra Heights?
Total Female Population of La Habra Heights is 2,851.
What is the Ratio of Males per 100 Females in La Habra Heights?
There are 96.39 Males per 100 Females in La Habra Heights.
What is the Ratio of Females per 100 Males in La Habra Heights?
There are 103.75 Females per 100 Males in La Habra Heights.
What is the Median Population Age in La Habra Heights?
Median Population Age in La Habra Heights is 47.6 Years.
What is the Average Family Size in La Habra Heights
Average Family Size in La Habra Heights is 3.2 People.
What is the Average Household Size in La Habra Heights
Average Household Size in La Habra Heights is 2.9 People.
How Large is the Labor Force in La Habra Heights?
There are 3,046 People in the Labor Forcein in La Habra Heights.
What is the Percentage of People in the Labor Force in La Habra Heights?
63.5% of People are in the Labor Force in La Habra Heights.
What is the Unemployment Rate in La Habra Heights?
Unemployment Rate in La Habra Heights is 1.8%.