Cities with the Highest Percentage of Population Employed in Architecture & Engineering in South Dakota
RELATED REPORTS & OPTIONS
Architecture & Engineering
South Dakota
Compare Cities
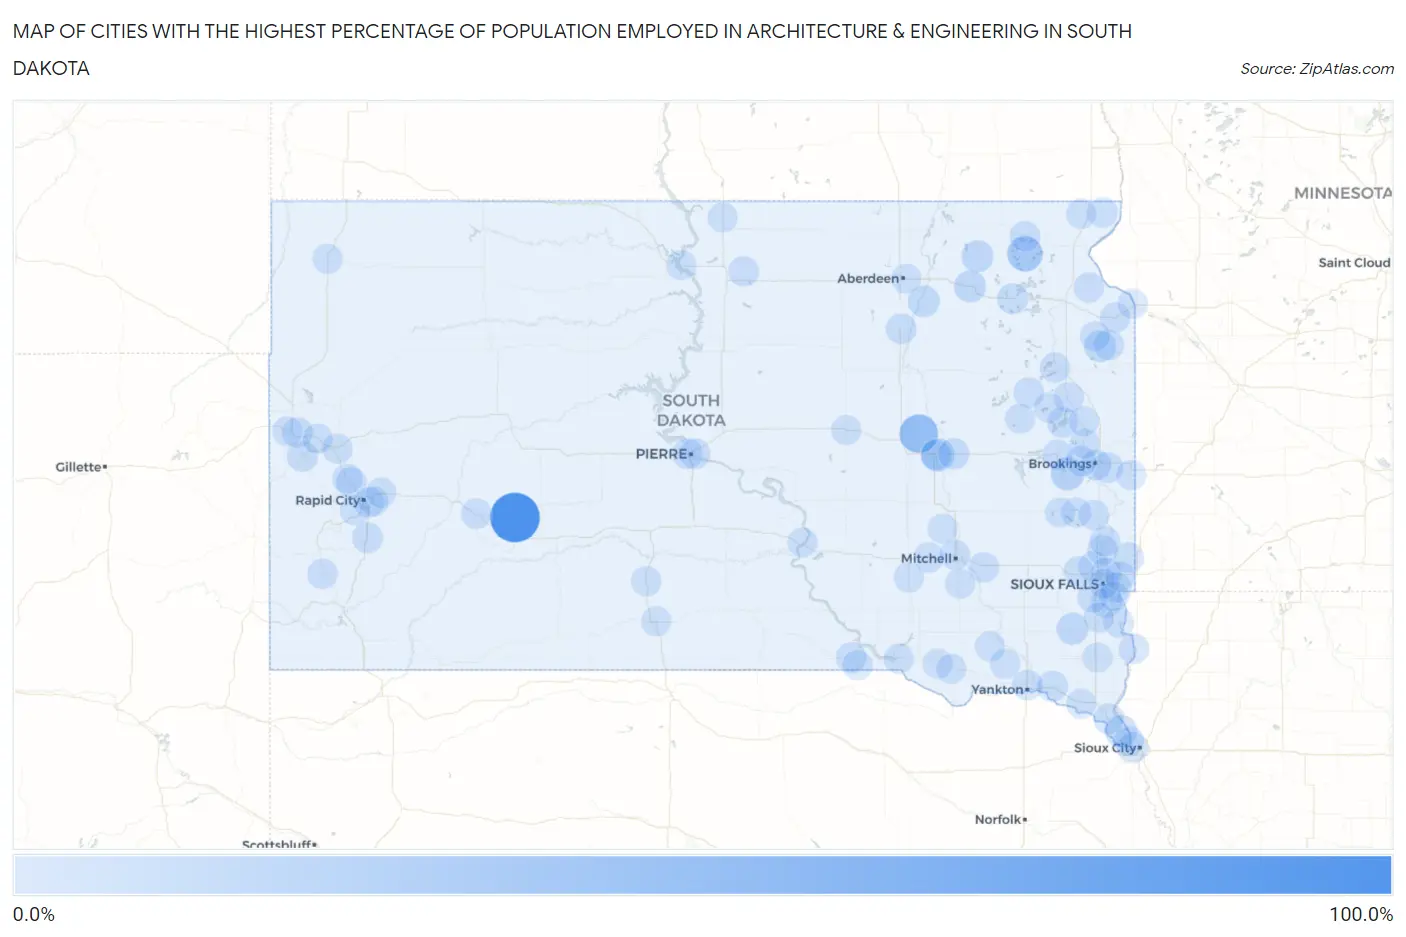
Map of Cities with the Highest Percentage of Population Employed in Architecture & Engineering in South Dakota
0.0%
100.0%
Cities with the Highest Percentage of Population Employed in Architecture & Engineering in South Dakota
| City | % Employed | vs State | vs National | |
| 1. | Cottonwood | 100.0% | 1.6%(+98.4)#1 | 2.1%(+97.9)#3 |
| 2. | Broadland | 42.9% | 1.6%(+41.3)#2 | 2.1%(+40.7)#35 |
| 3. | Eden | 26.8% | 1.6%(+25.2)#3 | 2.1%(+24.7)#74 |
| 4. | Morningside | 17.2% | 1.6%(+15.6)#4 | 2.1%(+15.0)#170 |
| 5. | Sinai | 15.7% | 1.6%(+14.1)#5 | 2.1%(+13.5)#211 |
| 6. | Enemy Swim | 14.3% | 1.6%(+12.7)#6 | 2.1%(+12.1)#250 |
| 7. | Jefferson | 9.8% | 1.6%(+8.21)#7 | 2.1%(+7.65)#513 |
| 8. | Langford | 9.6% | 1.6%(+8.02)#8 | 2.1%(+7.46)#526 |
| 9. | Andover | 9.5% | 1.6%(+7.93)#9 | 2.1%(+7.37)#538 |
| 10. | Davis | 9.3% | 1.6%(+7.71)#10 | 2.1%(+7.15)#552 |
| 11. | Strandburg | 8.6% | 1.6%(+6.98)#11 | 2.1%(+6.42)#631 |
| 12. | Stratford | 8.1% | 1.6%(+6.52)#12 | 2.1%(+5.96)#703 |
| 13. | Cavour | 5.6% | 1.6%(+3.97)#13 | 2.1%(+3.41)#1,475 |
| 14. | Lead | 4.9% | 1.6%(+3.33)#14 | 2.1%(+2.77)#1,886 |
| 15. | Harrisburg | 4.7% | 1.6%(+3.10)#15 | 2.1%(+2.54)#2,059 |
| 16. | Dakota Dunes | 4.7% | 1.6%(+3.10)#16 | 2.1%(+2.54)#2,066 |
| 17. | Gayville | 4.7% | 1.6%(+3.08)#17 | 2.1%(+2.52)#2,083 |
| 18. | Lake Poinsett | 4.5% | 1.6%(+2.96)#18 | 2.1%(+2.40)#2,190 |
| 19. | Aurora | 4.3% | 1.6%(+2.75)#19 | 2.1%(+2.19)#2,376 |
| 20. | Webster | 4.3% | 1.6%(+2.69)#20 | 2.1%(+2.13)#2,423 |
| 21. | Hermosa | 4.3% | 1.6%(+2.67)#21 | 2.1%(+2.11)#2,453 |
| 22. | Summerset | 4.0% | 1.6%(+2.45)#22 | 2.1%(+1.89)#2,722 |
| 23. | Mellette | 3.8% | 1.6%(+2.21)#23 | 2.1%(+1.65)#3,023 |
| 24. | Brookings | 3.7% | 1.6%(+2.12)#24 | 2.1%(+1.56)#3,148 |
| 25. | Volga | 3.7% | 1.6%(+2.12)#25 | 2.1%(+1.56)#3,150 |
| 26. | Crooks | 3.5% | 1.6%(+1.87)#26 | 2.1%(+1.31)#3,591 |
| 27. | Pierre | 3.4% | 1.6%(+1.82)#27 | 2.1%(+1.26)#3,706 |
| 28. | Bonesteel | 3.4% | 1.6%(+1.78)#28 | 2.1%(+1.22)#3,779 |
| 29. | Wilmot | 3.3% | 1.6%(+1.72)#29 | 2.1%(+1.17)#3,883 |
| 30. | Arlington | 3.3% | 1.6%(+1.70)#30 | 2.1%(+1.14)#3,923 |
| 31. | Alexandria | 3.2% | 1.6%(+1.65)#31 | 2.1%(+1.09)#4,018 |
| 32. | Hazel | 3.2% | 1.6%(+1.64)#32 | 2.1%(+1.08)#4,055 |
| 33. | Fort Pierre | 3.2% | 1.6%(+1.57)#33 | 2.1%(+1.01)#4,202 |
| 34. | Watertown | 3.1% | 1.6%(+1.52)#34 | 2.1%(+0.965)#4,308 |
| 35. | Baltic | 3.1% | 1.6%(+1.51)#35 | 2.1%(+0.956)#4,326 |
| 36. | Lake City | 3.0% | 1.6%(+1.44)#36 | 2.1%(+0.881)#4,519 |
| 37. | Castlewood | 3.0% | 1.6%(+1.42)#37 | 2.1%(+0.864)#4,552 |
| 38. | Colman | 2.9% | 1.6%(+1.36)#38 | 2.1%(+0.799)#4,709 |
| 39. | Yankton | 2.9% | 1.6%(+1.36)#39 | 2.1%(+0.799)#4,712 |
| 40. | Spearfish | 2.9% | 1.6%(+1.35)#40 | 2.1%(+0.796)#4,717 |
| 41. | Dell Rapids | 2.9% | 1.6%(+1.32)#41 | 2.1%(+0.760)#4,815 |
| 42. | Anderson | 2.7% | 1.6%(+1.10)#42 | 2.1%(+0.543)#5,456 |
| 43. | Wall | 2.7% | 1.6%(+1.09)#43 | 2.1%(+0.526)#5,507 |
| 44. | Hudson | 2.6% | 1.6%(+0.974)#44 | 2.1%(+0.415)#5,842 |
| 45. | Pringle | 2.4% | 1.6%(+0.829)#45 | 2.1%(+0.270)#6,305 |
| 46. | Java | 2.4% | 1.6%(+0.791)#46 | 2.1%(+0.232)#6,452 |
| 47. | La Bolt | 2.4% | 1.6%(+0.791)#47 | 2.1%(+0.232)#6,453 |
| 48. | Meadow View Addition | 2.2% | 1.6%(+0.657)#48 | 2.1%(+0.098)#6,942 |
| 49. | Milbank | 2.2% | 1.6%(+0.624)#49 | 2.1%(+0.065)#7,065 |
| 50. | Sturgis | 2.2% | 1.6%(+0.621)#50 | 2.1%(+0.062)#7,083 |
| 51. | Tea | 2.1% | 1.6%(+0.553)#51 | 2.1%(-0.006)#7,359 |
| 52. | North Sioux City | 2.1% | 1.6%(+0.522)#52 | 2.1%(-0.037)#7,462 |
| 53. | Whitewood | 2.1% | 1.6%(+0.505)#53 | 2.1%(-0.054)#7,543 |
| 54. | Garretson | 2.1% | 1.6%(+0.503)#54 | 2.1%(-0.056)#7,553 |
| 55. | Hartford | 2.1% | 1.6%(+0.473)#55 | 2.1%(-0.086)#7,684 |
| 56. | Elk Point | 2.1% | 1.6%(+0.472)#56 | 2.1%(-0.087)#7,686 |
| 57. | Mitchell | 2.1% | 1.6%(+0.463)#57 | 2.1%(-0.096)#7,736 |
| 58. | Stickney | 1.9% | 1.6%(+0.279)#58 | 2.1%(-0.280)#8,449 |
| 59. | Rosholt | 1.8% | 1.6%(+0.217)#59 | 2.1%(-0.342)#8,723 |
| 60. | Scotland | 1.8% | 1.6%(+0.212)#60 | 2.1%(-0.347)#8,745 |
| 61. | Elkton | 1.8% | 1.6%(+0.205)#61 | 2.1%(-0.354)#8,786 |
| 62. | Hayti | 1.7% | 1.6%(+0.141)#62 | 2.1%(-0.418)#9,084 |
| 63. | Big Stone City | 1.7% | 1.6%(+0.129)#63 | 2.1%(-0.430)#9,135 |
| 64. | Mount Vernon | 1.7% | 1.6%(+0.122)#64 | 2.1%(-0.437)#9,167 |
| 65. | Rapid City | 1.7% | 1.6%(+0.121)#65 | 2.1%(-0.437)#9,170 |
| 66. | Herreid | 1.7% | 1.6%(+0.083)#66 | 2.1%(-0.476)#9,350 |
| 67. | Canton | 1.6% | 1.6%(+0.046)#67 | 2.1%(-0.513)#9,538 |
| 68. | Wentworth | 1.6% | 1.6%(+0.023)#68 | 2.1%(-0.536)#9,667 |
| 69. | Bruce | 1.6% | 1.6%(-0.015)#69 | 2.1%(-0.574)#9,824 |
| 70. | Box Elder | 1.6% | 1.6%(-0.040)#70 | 2.1%(-0.599)#9,963 |
| 71. | Dante | 1.5% | 1.6%(-0.052)#71 | 2.1%(-0.611)#10,047 |
| 72. | Mobridge | 1.5% | 1.6%(-0.070)#72 | 2.1%(-0.629)#10,118 |
| 73. | Fairfax | 1.5% | 1.6%(-0.075)#73 | 2.1%(-0.634)#10,145 |
| 74. | Pickstown | 1.5% | 1.6%(-0.109)#74 | 2.1%(-0.668)#10,310 |
| 75. | Buffalo | 1.5% | 1.6%(-0.120)#75 | 2.1%(-0.679)#10,372 |
| 76. | White River | 1.5% | 1.6%(-0.125)#76 | 2.1%(-0.684)#10,392 |
| 77. | North Spearfish | 1.5% | 1.6%(-0.138)#77 | 2.1%(-0.697)#10,459 |
| 78. | Oacoma | 1.4% | 1.6%(-0.141)#78 | 2.1%(-0.700)#10,475 |
| 79. | Rapid Valley | 1.4% | 1.6%(-0.156)#79 | 2.1%(-0.715)#10,559 |
| 80. | Piedmont | 1.4% | 1.6%(-0.159)#80 | 2.1%(-0.718)#10,569 |
| 81. | Stockholm | 1.4% | 1.6%(-0.162)#81 | 2.1%(-0.721)#10,586 |
| 82. | Sioux Falls | 1.4% | 1.6%(-0.184)#82 | 2.1%(-0.743)#10,695 |
| 83. | Vermillion | 1.4% | 1.6%(-0.189)#83 | 2.1%(-0.748)#10,718 |
| 84. | Beresford | 1.4% | 1.6%(-0.229)#84 | 2.1%(-0.788)#10,915 |
| 85. | Lesterville | 1.3% | 1.6%(-0.292)#85 | 2.1%(-0.851)#11,277 |
| 86. | Ethan | 1.2% | 1.6%(-0.371)#86 | 2.1%(-0.930)#11,674 |
| 87. | Shindler | 1.2% | 1.6%(-0.374)#87 | 2.1%(-0.933)#11,691 |
| 88. | Worthing | 1.2% | 1.6%(-0.412)#88 | 2.1%(-0.970)#11,891 |
| 89. | New Effington | 1.2% | 1.6%(-0.414)#89 | 2.1%(-0.973)#11,906 |
| 90. | Huron | 1.2% | 1.6%(-0.419)#90 | 2.1%(-0.978)#11,927 |
| 91. | Aberdeen | 1.2% | 1.6%(-0.427)#91 | 2.1%(-0.986)#11,967 |
| 92. | Bryant | 1.2% | 1.6%(-0.427)#92 | 2.1%(-0.986)#11,974 |
| 93. | Letcher | 1.2% | 1.6%(-0.427)#93 | 2.1%(-0.986)#11,980 |
| 94. | Madison | 1.2% | 1.6%(-0.436)#94 | 2.1%(-0.995)#12,016 |
| 95. | Mission | 1.1% | 1.6%(-0.454)#95 | 2.1%(-1.01)#12,095 |
| 96. | Colonial Pine Hills | 1.1% | 1.6%(-0.490)#96 | 2.1%(-1.05)#12,274 |
| 97. | Avon | 1.1% | 1.6%(-0.491)#97 | 2.1%(-1.05)#12,286 |
| 98. | Miller | 1.1% | 1.6%(-0.508)#98 | 2.1%(-1.07)#12,389 |
| 99. | Brandon | 1.1% | 1.6%(-0.529)#99 | 2.1%(-1.09)#12,503 |
| 100. | Estelline | 1.0% | 1.6%(-0.542)#100 | 2.1%(-1.10)#12,576 |
Common Questions
What are the Top 10 Cities with the Highest Percentage of Population Employed in Architecture & Engineering in South Dakota?
Top 10 Cities with the Highest Percentage of Population Employed in Architecture & Engineering in South Dakota are:
#1
100.0%
#2
42.9%
#3
26.8%
#4
17.2%
#5
15.7%
#6
9.8%
#7
9.6%
#8
9.5%
#9
9.3%
#10
8.6%
What city has the Highest Percentage of Population Employed in Architecture & Engineering in South Dakota?
Cottonwood has the Highest Percentage of Population Employed in Architecture & Engineering in South Dakota with 100.0%.
What is the Percentage of Population Employed in Architecture & Engineering in the State of South Dakota?
Percentage of Population Employed in Architecture & Engineering in South Dakota is 1.6%.
What is the Percentage of Population Employed in Architecture & Engineering in the United States?
Percentage of Population Employed in Architecture & Engineering in the United States is 2.1%.