Zip Codes with the Highest Percentage of Population Employed in Architecture & Engineering in Oroville, CA
RELATED REPORTS & OPTIONS
Architecture & Engineering
Oroville
Compare Zip Codes
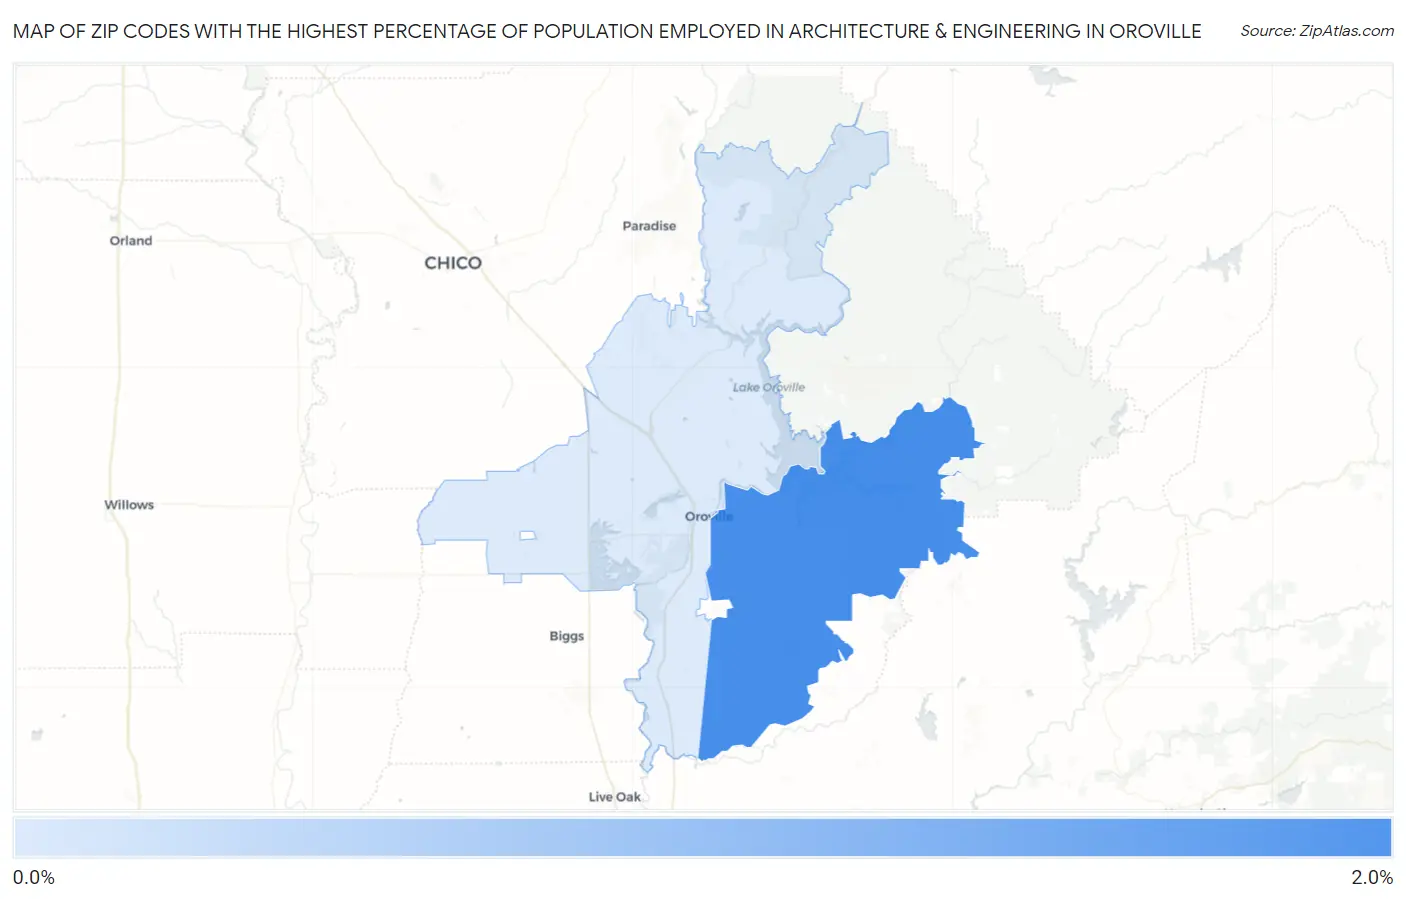
Map of Zip Codes with the Highest Percentage of Population Employed in Architecture & Engineering in Oroville
0.59%
1.8%
Zip Codes with the Highest Percentage of Population Employed in Architecture & Engineering in Oroville, CA
| Zip Code | % Employed | vs State | vs National | |
| 1. | 95966 | 1.8% | 2.6%(-0.803)#773 | 2.1%(-0.399)#11,155 |
| 2. | 95965 | 0.59% | 2.6%(-1.96)#1,193 | 2.1%(-1.56)#19,676 |
1
Common Questions
What are the Top Zip Codes with the Highest Percentage of Population Employed in Architecture & Engineering in Oroville, CA?
Top Zip Codes with the Highest Percentage of Population Employed in Architecture & Engineering in Oroville, CA are:
What zip code has the Highest Percentage of Population Employed in Architecture & Engineering in Oroville, CA?
95966 has the Highest Percentage of Population Employed in Architecture & Engineering in Oroville, CA with 1.8%.
What is the Percentage of Population Employed in Architecture & Engineering in Oroville, CA?
Percentage of Population Employed in Architecture & Engineering in Oroville is 1.6%.
What is the Percentage of Population Employed in Architecture & Engineering in California?
Percentage of Population Employed in Architecture & Engineering in California is 2.6%.
What is the Percentage of Population Employed in Architecture & Engineering in the United States?
Percentage of Population Employed in Architecture & Engineering in the United States is 2.1%.