Wrightwood, CA Map & Demographics
Wrightwood Map
Wrightwood Overview
$50,089
PER CAPITA INCOME
$71,642
AVG FAMILY INCOME
$70,882
AVG HOUSEHOLD INCOME
56.4%
WAGE / INCOME GAP [ % ]
43.6¢/ $1
WAGE / INCOME GAP [ $ ]
0.51
INEQUALITY / GINI INDEX
4,461
TOTAL POPULATION
2,394
MALE POPULATION
2,067
FEMALE POPULATION
115.82
MALES / 100 FEMALES
86.34
FEMALES / 100 MALES
47.6
MEDIAN AGE
2.7
AVG FAMILY SIZE
2.1
AVG HOUSEHOLD SIZE
1,987
LABOR FORCE [ PEOPLE ]
55.2%
PERCENT IN LABOR FORCE
2.4%
UNEMPLOYMENT RATE
Wrightwood Zip Codes
Wrightwood Area Codes
Income in Wrightwood
Income Overview in Wrightwood
Per Capita Income in Wrightwood is $50,089, while median incomes of families and households are $71,642 and $70,882 respectively.
| Characteristic | Number | Measure |
| Per Capita Income | 4,461 | $50,089 |
| Median Family Income | 1,279 | $71,642 |
| Mean Family Income | 1,279 | $120,289 |
| Median Household Income | 2,078 | $70,882 |
| Mean Household Income | 2,078 | $107,476 |
| Income Deficit | 1,279 | $0 |
| Wage / Income Gap (%) | 4,461 | 56.37% |
| Wage / Income Gap ($) | 4,461 | 43.63¢ per $1 |
| Gini / Inequality Index | 4,461 | 0.51 |
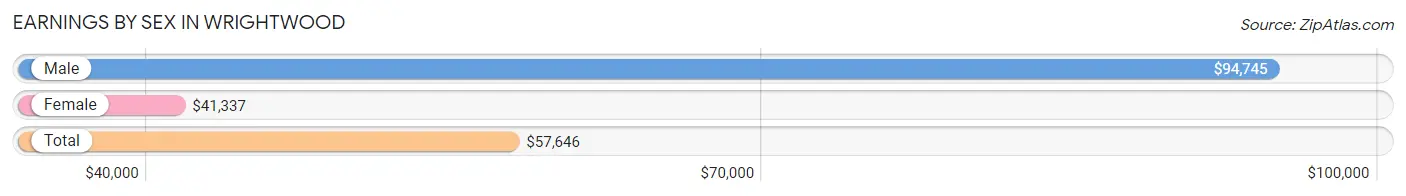
Earnings by Sex in Wrightwood
Average Earnings in Wrightwood are $57,646, $94,745 for men and $41,337 for women, a difference of 56.4%.
| Sex | Number | Average Earnings |
| Male | 1,249 (58.5%) | $94,745 |
| Female | 886 (41.5%) | $41,337 |
| Total | 2,135 (100.0%) | $57,646 |
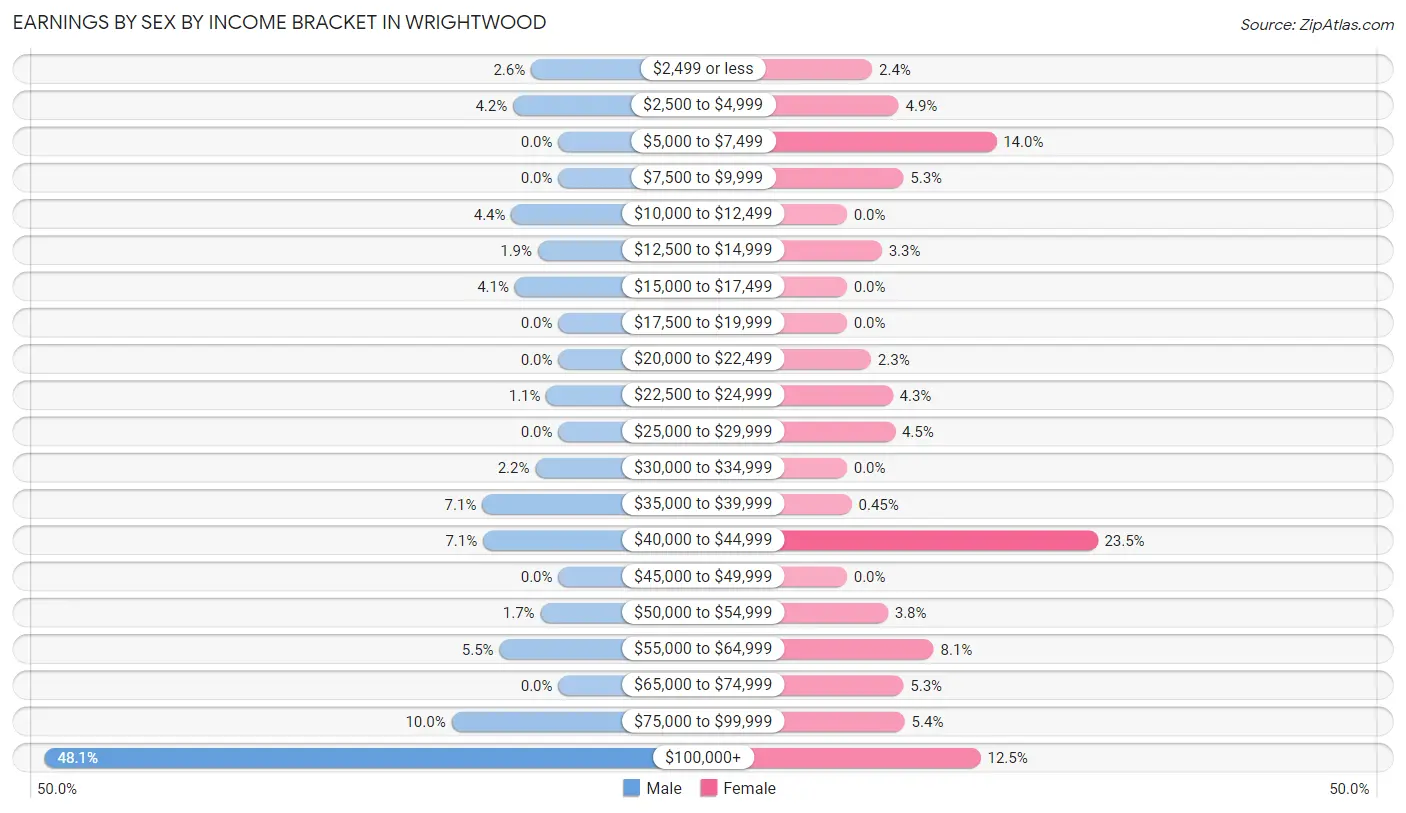
Earnings by Sex by Income Bracket in Wrightwood
The most common earnings brackets in Wrightwood are $100,000+ for men (601 | 48.1%) and $40,000 to $44,999 for women (208 | 23.5%).
| Income | Male | Female |
| $2,499 or less | 32 (2.6%) | 21 (2.4%) |
| $2,500 to $4,999 | 53 (4.2%) | 43 (4.9%) |
| $5,000 to $7,499 | 0 (0.0%) | 124 (14.0%) |
| $7,500 to $9,999 | 0 (0.0%) | 47 (5.3%) |
| $10,000 to $12,499 | 55 (4.4%) | 0 (0.0%) |
| $12,500 to $14,999 | 24 (1.9%) | 29 (3.3%) |
| $15,000 to $17,499 | 51 (4.1%) | 0 (0.0%) |
| $17,500 to $19,999 | 0 (0.0%) | 0 (0.0%) |
| $20,000 to $22,499 | 0 (0.0%) | 20 (2.3%) |
| $22,500 to $24,999 | 14 (1.1%) | 38 (4.3%) |
| $25,000 to $29,999 | 0 (0.0%) | 40 (4.5%) |
| $30,000 to $34,999 | 27 (2.2%) | 0 (0.0%) |
| $35,000 to $39,999 | 89 (7.1%) | 4 (0.4%) |
| $40,000 to $44,999 | 88 (7.0%) | 208 (23.5%) |
| $45,000 to $49,999 | 0 (0.0%) | 0 (0.0%) |
| $50,000 to $54,999 | 21 (1.7%) | 34 (3.8%) |
| $55,000 to $64,999 | 69 (5.5%) | 72 (8.1%) |
| $65,000 to $74,999 | 0 (0.0%) | 47 (5.3%) |
| $75,000 to $99,999 | 125 (10.0%) | 48 (5.4%) |
| $100,000+ | 601 (48.1%) | 111 (12.5%) |
| Total | 1,249 (100.0%) | 886 (100.0%) |
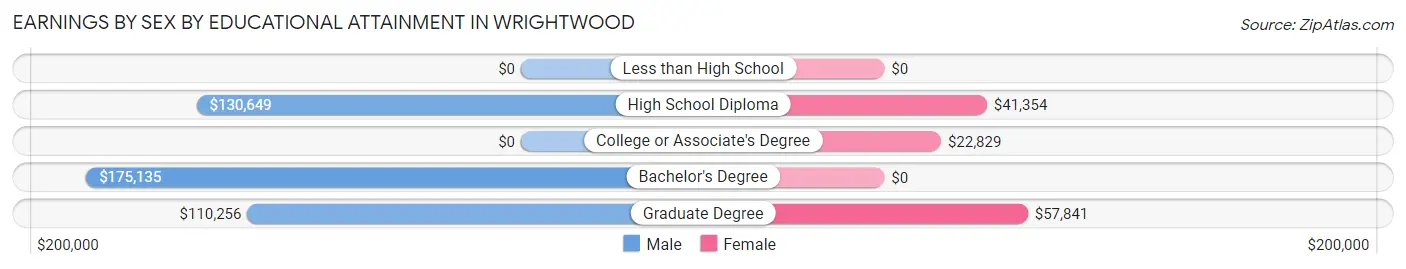
Earnings by Sex by Educational Attainment in Wrightwood
Average earnings in Wrightwood are $103,462 for men and $41,337 for women, a difference of 60.1%. Men with an educational attainment of bachelor's degree enjoy the highest average annual earnings of $175,135, while those with graduate degree education earn the least with $110,256. Women with an educational attainment of graduate degree earn the most with the average annual earnings of $57,841, while those with college or associate's degree education have the smallest earnings of $22,829.
| Educational Attainment | Male Income | Female Income |
| Less than High School | - | - |
| High School Diploma | $130,649 | $41,354 |
| College or Associate's Degree | - | - |
| Bachelor's Degree | $175,135 | $0 |
| Graduate Degree | $110,256 | $57,841 |
| Total | $103,462 | $41,337 |
Family Income in Wrightwood
Family Income Brackets in Wrightwood
According to the Wrightwood family income data, there are 350 families falling into the $35,000 to $49,999 income range, which is the most common income bracket and makes up 27.4% of all families.
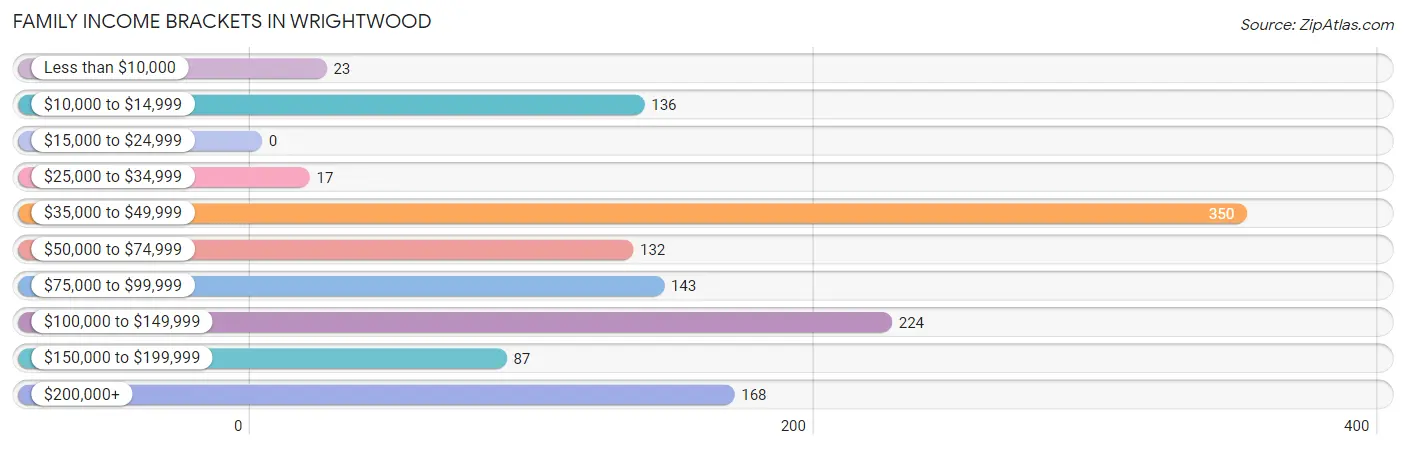
| Income Bracket | # Families | % Families |
| Less than $10,000 | 23 | 1.8% |
| $10,000 to $14,999 | 136 | 10.6% |
| $15,000 to $24,999 | 0 | 0.0% |
| $25,000 to $34,999 | 17 | 1.3% |
| $35,000 to $49,999 | 350 | 27.4% |
| $50,000 to $74,999 | 132 | 10.3% |
| $75,000 to $99,999 | 143 | 11.2% |
| $100,000 to $149,999 | 224 | 17.5% |
| $150,000 to $199,999 | 87 | 6.8% |
| $200,000+ | 168 | 13.1% |
Family Income by Famaliy Size in Wrightwood
5-person families (79 | 6.2%) account for the highest median family income in Wrightwood with $131,050 per family, while 4-person families (87 | 6.8%) have the highest median income of $28,935 per family member.
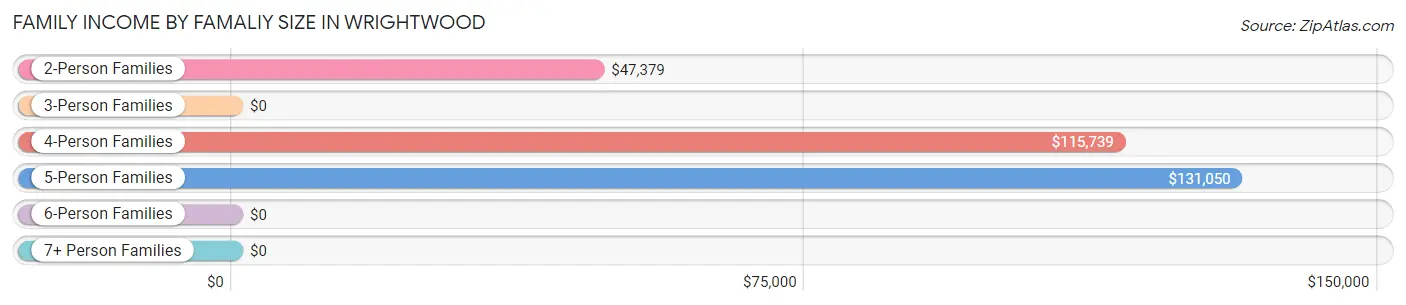
| Income Bracket | # Families | Median Income |
| 2-Person Families | 873 (68.3%) | $47,379 |
| 3-Person Families | 167 (13.1%) | $0 |
| 4-Person Families | 87 (6.8%) | $115,739 |
| 5-Person Families | 79 (6.2%) | $131,050 |
| 6-Person Families | 73 (5.7%) | $0 |
| 7+ Person Families | 0 (0.0%) | $0 |
| Total | 1,279 (100.0%) | $71,642 |
Family Income by Number of Earners in Wrightwood
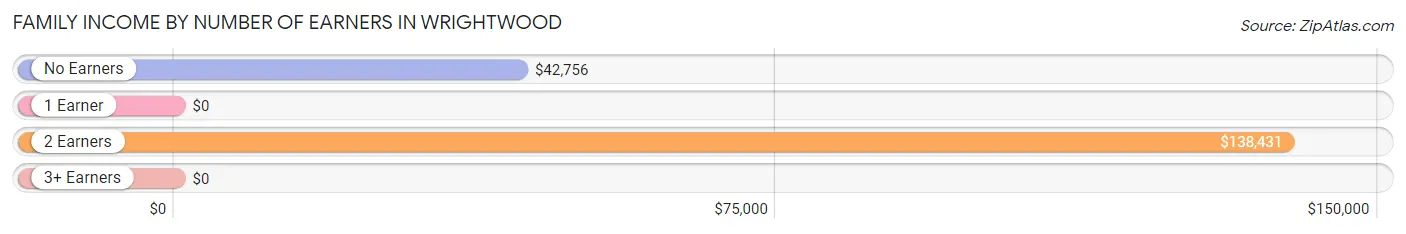
| Number of Earners | # Families | Median Income |
| No Earners | 390 (30.5%) | $42,756 |
| 1 Earner | 435 (34.0%) | $0 |
| 2 Earners | 375 (29.3%) | $138,431 |
| 3+ Earners | 79 (6.2%) | $0 |
| Total | 1,279 (100.0%) | $71,642 |
Household Income in Wrightwood
Household Income Brackets in Wrightwood
With 403 households falling in the category, the $35,000 to $49,999 income range is the most frequent in Wrightwood, accounting for 19.4% of all households. In contrast, only 69 households (3.3%) fall into the $15,000 to $24,999 income bracket, making it the least populous group.
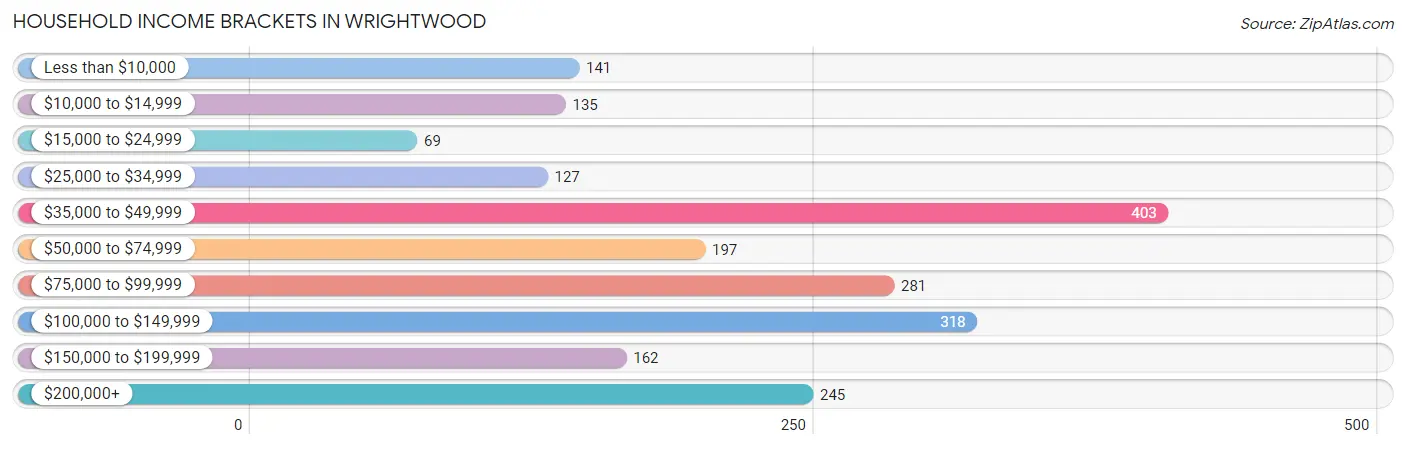
| Income Bracket | # Households | % Households |
| Less than $10,000 | 141 | 6.8% |
| $10,000 to $14,999 | 135 | 6.5% |
| $15,000 to $24,999 | 69 | 3.3% |
| $25,000 to $34,999 | 127 | 6.1% |
| $35,000 to $49,999 | 403 | 19.4% |
| $50,000 to $74,999 | 197 | 9.5% |
| $75,000 to $99,999 | 281 | 13.5% |
| $100,000 to $149,999 | 318 | 15.3% |
| $150,000 to $199,999 | 162 | 7.8% |
| $200,000+ | 245 | 11.8% |
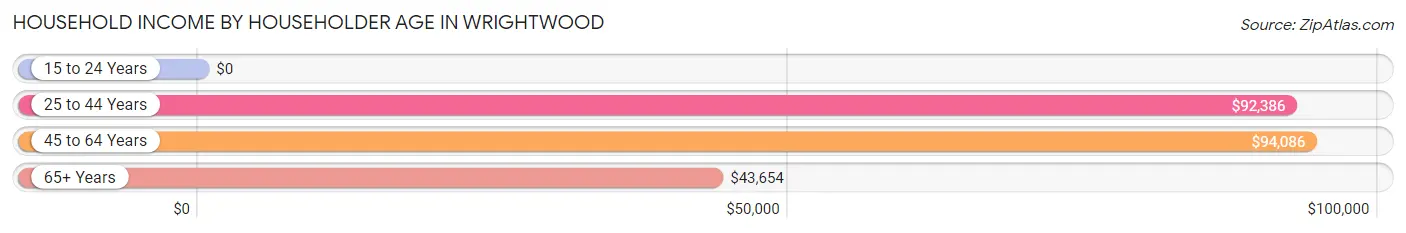
Household Income by Householder Age in Wrightwood
The median household income in Wrightwood is $70,882, with the highest median household income of $94,086 found in the 45 to 64 years age bracket for the primary householder. A total of 612 households (29.4%) fall into this category.
| Income Bracket | # Households | Median Income |
| 15 to 24 Years | 0 (0.0%) | $0 |
| 25 to 44 Years | 572 (27.5%) | $92,386 |
| 45 to 64 Years | 612 (29.4%) | $94,086 |
| 65+ Years | 894 (43.0%) | $43,654 |
| Total | 2,078 (100.0%) | $70,882 |
Poverty in Wrightwood
Income Below Poverty by Sex and Age in Wrightwood
With 11.0% poverty level for males and 18.7% for females among the residents of Wrightwood, 55 to 64 year old males and 18 to 24 year old females are the most vulnerable to poverty, with 114 males (23.8%) and 23 females (100.0%) in their respective age groups living below the poverty level.
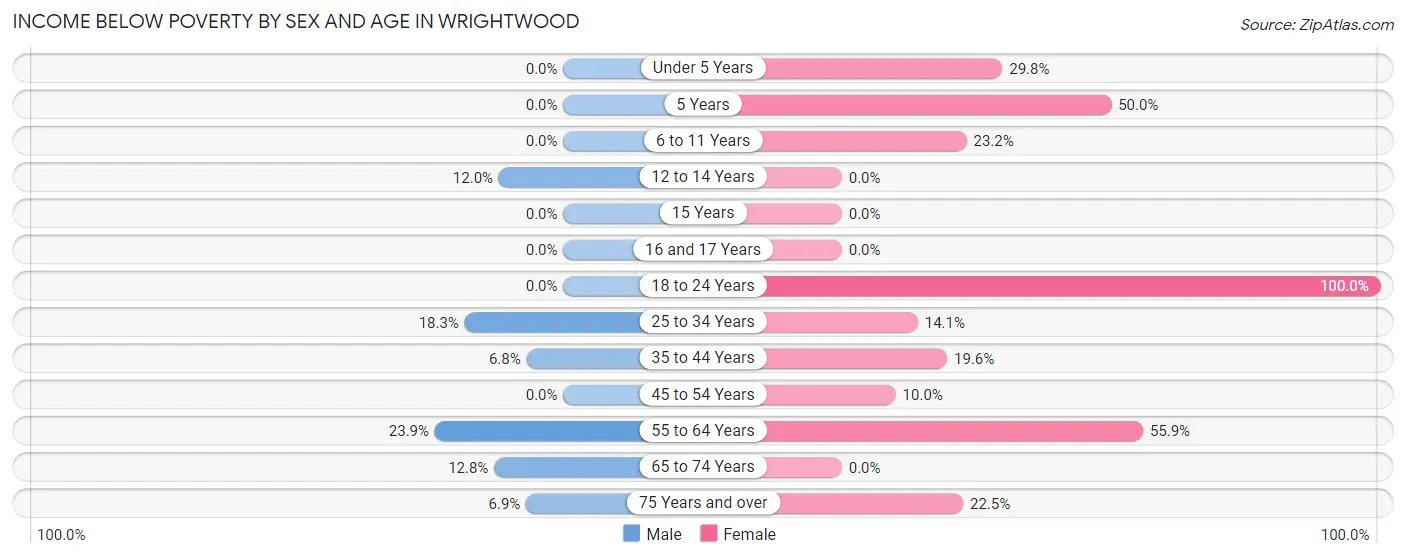
| Age Bracket | Male | Female |
| Under 5 Years | 0 (0.0%) | 28 (29.8%) |
| 5 Years | 0 (0.0%) | 25 (50.0%) |
| 6 to 11 Years | 0 (0.0%) | 25 (23.2%) |
| 12 to 14 Years | 25 (12.0%) | 0 (0.0%) |
| 15 Years | 0 (0.0%) | 0 (0.0%) |
| 16 and 17 Years | 0 (0.0%) | 0 (0.0%) |
| 18 to 24 Years | 0 (0.0%) | 23 (100.0%) |
| 25 to 34 Years | 26 (18.3%) | 47 (14.1%) |
| 35 to 44 Years | 28 (6.8%) | 43 (19.6%) |
| 45 to 54 Years | 0 (0.0%) | 24 (10.0%) |
| 55 to 64 Years | 114 (23.8%) | 128 (55.9%) |
| 65 to 74 Years | 47 (12.8%) | 0 (0.0%) |
| 75 Years and over | 20 (6.9%) | 43 (22.5%) |
| Total | 260 (11.0%) | 386 (18.7%) |
Income Above Poverty by Sex and Age in Wrightwood
According to the poverty statistics in Wrightwood, males aged under 5 years and females aged 12 to 14 years are the age groups that are most secure financially, with 100.0% of males and 100.0% of females in these age groups living above the poverty line.
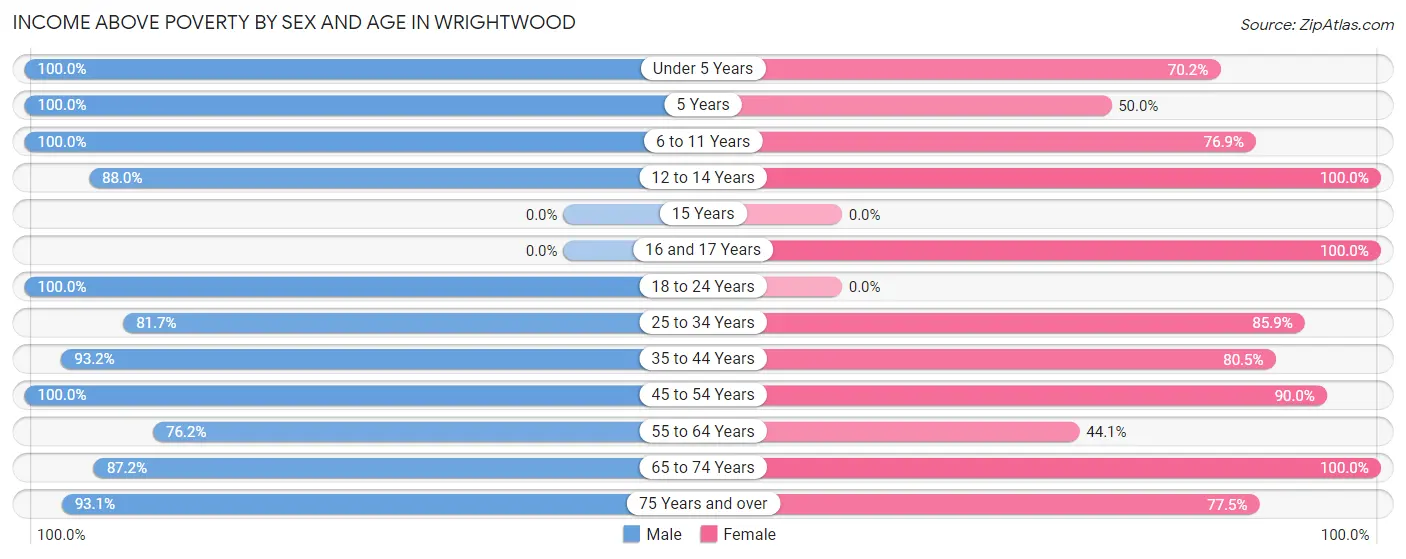
| Age Bracket | Male | Female |
| Under 5 Years | 156 (100.0%) | 66 (70.2%) |
| 5 Years | 30 (100.0%) | 25 (50.0%) |
| 6 to 11 Years | 94 (100.0%) | 83 (76.8%) |
| 12 to 14 Years | 184 (88.0%) | 97 (100.0%) |
| 15 Years | 0 (0.0%) | 0 (0.0%) |
| 16 and 17 Years | 0 (0.0%) | 19 (100.0%) |
| 18 to 24 Years | 74 (100.0%) | 0 (0.0%) |
| 25 to 34 Years | 116 (81.7%) | 286 (85.9%) |
| 35 to 44 Years | 382 (93.2%) | 177 (80.4%) |
| 45 to 54 Years | 121 (100.0%) | 216 (90.0%) |
| 55 to 64 Years | 364 (76.1%) | 101 (44.1%) |
| 65 to 74 Years | 319 (87.2%) | 463 (100.0%) |
| 75 Years and over | 270 (93.1%) | 148 (77.5%) |
| Total | 2,110 (89.0%) | 1,681 (81.3%) |
Income Below Poverty Among Married-Couple Families in Wrightwood
The poverty statistics for married-couple families in Wrightwood show that 13.8% or 161 of the total 1,168 families live below the poverty line. Families with 3 or 4 children have the highest poverty rate of 21.1%, comprising of 26 families. On the other hand, families with 1 or 2 children have the lowest poverty rate of 0.0%, which includes 0 families.
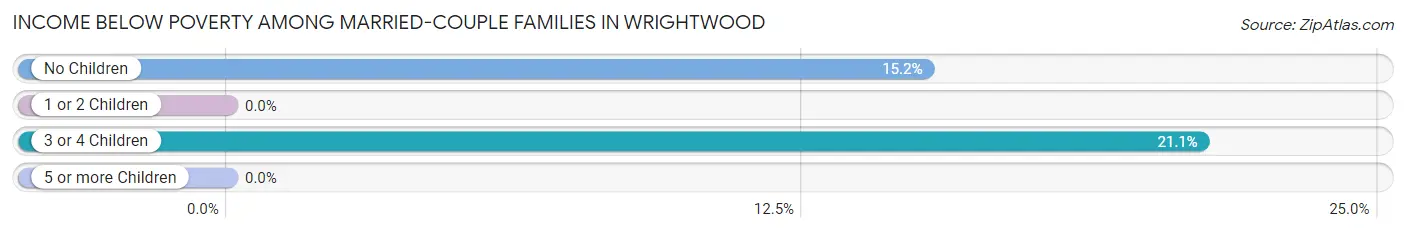
| Children | Above Poverty | Below Poverty |
| No Children | 756 (84.9%) | 135 (15.1%) |
| 1 or 2 Children | 154 (100.0%) | 0 (0.0%) |
| 3 or 4 Children | 97 (78.9%) | 26 (21.1%) |
| 5 or more Children | 0 (0.0%) | 0 (0.0%) |
| Total | 1,007 (86.2%) | 161 (13.8%) |
Income Below Poverty Among Single-Parent Households in Wrightwood
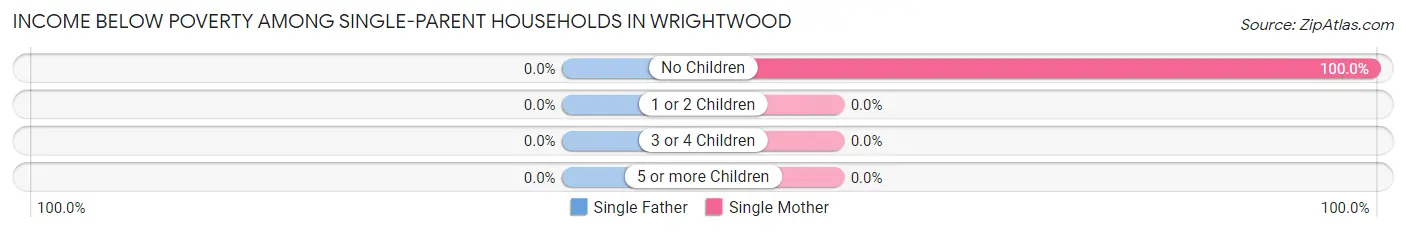
| Children | Single Father | Single Mother |
| No Children | 0 (0.0%) | 23 (100.0%) |
| 1 or 2 Children | 0 (0.0%) | 0 (0.0%) |
| 3 or 4 Children | 0 (0.0%) | 0 (0.0%) |
| 5 or more Children | 0 (0.0%) | 0 (0.0%) |
| Total | 0 (0.0%) | 23 (47.9%) |
Income Below Poverty Among Married-Couple vs Single-Parent Households in Wrightwood
The poverty data for Wrightwood shows that 161 of the married-couple family households (13.8%) and 23 of the single-parent households (20.7%) are living below the poverty level. Within the married-couple family households, those with 3 or 4 children have the highest poverty rate, with 26 households (21.1%) falling below the poverty line. Among the single-parent households, those with no children have the highest poverty rate, with 23 household (38.3%) living below poverty.
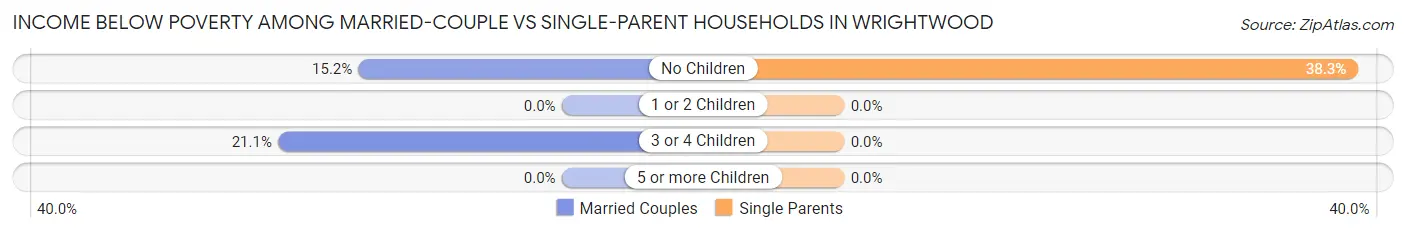
| Children | Married-Couple Families | Single-Parent Households |
| No Children | 135 (15.1%) | 23 (38.3%) |
| 1 or 2 Children | 0 (0.0%) | 0 (0.0%) |
| 3 or 4 Children | 26 (21.1%) | 0 (0.0%) |
| 5 or more Children | 0 (0.0%) | 0 (0.0%) |
| Total | 161 (13.8%) | 23 (20.7%) |
Race in Wrightwood
The most populous races in Wrightwood are White / Caucasian (3,778 | 84.7%), Hispanic or Latino (561 | 12.6%), and Two or more Races (332 | 7.4%).
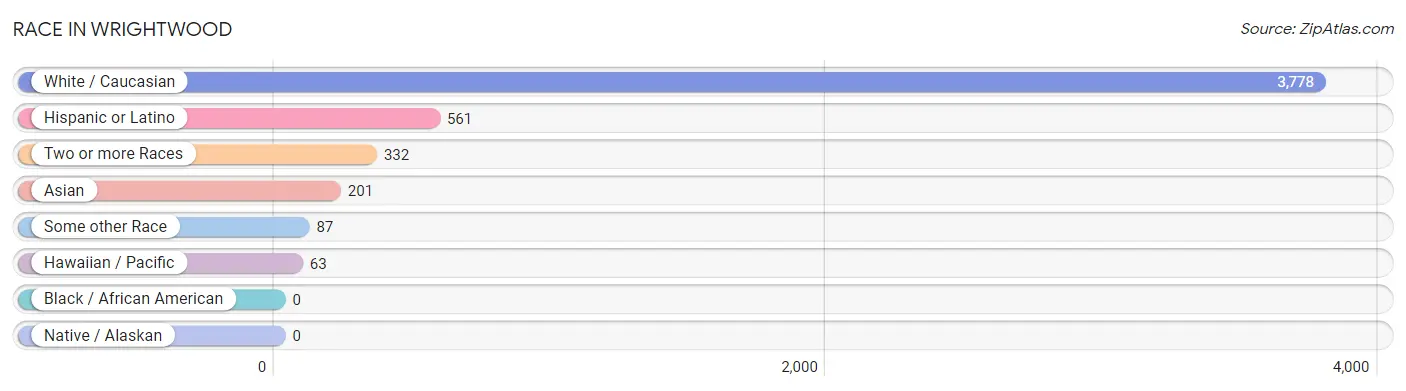
| Race | # Population | % Population |
| Asian | 201 | 4.5% |
| Black / African American | 0 | 0.0% |
| Hawaiian / Pacific | 63 | 1.4% |
| Hispanic or Latino | 561 | 12.6% |
| Native / Alaskan | 0 | 0.0% |
| White / Caucasian | 3,778 | 84.7% |
| Two or more Races | 332 | 7.4% |
| Some other Race | 87 | 1.9% |
| Total | 4,461 | 100.0% |
Ancestry in Wrightwood
The most populous ancestries reported in Wrightwood are Irish (971 | 21.8%), German (895 | 20.1%), English (636 | 14.3%), Mexican (450 | 10.1%), and Indian (Asian) (201 | 4.5%), together accounting for 70.7% of all Wrightwood residents.
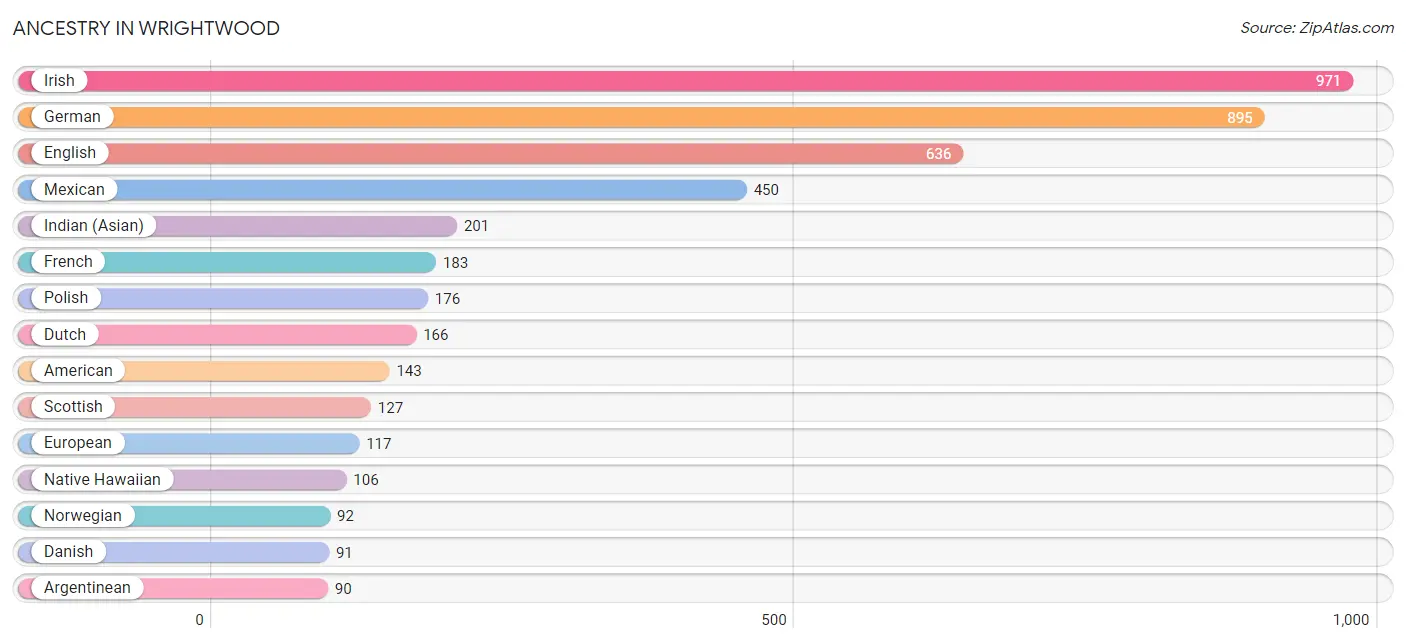
| Ancestry | # Population | % Population |
| American | 143 | 3.2% |
| Arab | 40 | 0.9% |
| Argentinean | 90 | 2.0% |
| Austrian | 44 | 1.0% |
| Bhutanese | 72 | 1.6% |
| British | 46 | 1.0% |
| Cherokee | 21 | 0.5% |
| Czech | 86 | 1.9% |
| Danish | 91 | 2.0% |
| Dutch | 166 | 3.7% |
| English | 636 | 14.3% |
| European | 117 | 2.6% |
| French | 183 | 4.1% |
| French Canadian | 37 | 0.8% |
| German | 895 | 20.1% |
| Indian (Asian) | 201 | 4.5% |
| Irish | 971 | 21.8% |
| Italian | 48 | 1.1% |
| Korean | 30 | 0.7% |
| Latvian | 30 | 0.7% |
| Mexican | 450 | 10.1% |
| Native Hawaiian | 106 | 2.4% |
| Norwegian | 92 | 2.1% |
| Polish | 176 | 4.0% |
| Puerto Rican | 4 | 0.1% |
| Romanian | 22 | 0.5% |
| Russian | 17 | 0.4% |
| Samoan | 52 | 1.2% |
| Scottish | 127 | 2.9% |
| Slovene | 21 | 0.5% |
| South American | 90 | 2.0% |
| Spanish | 17 | 0.4% |
| Sri Lankan | 13 | 0.3% |
| Swedish | 8 | 0.2% |
| Welsh | 74 | 1.7% | View All 35 Rows |
Immigrants in Wrightwood
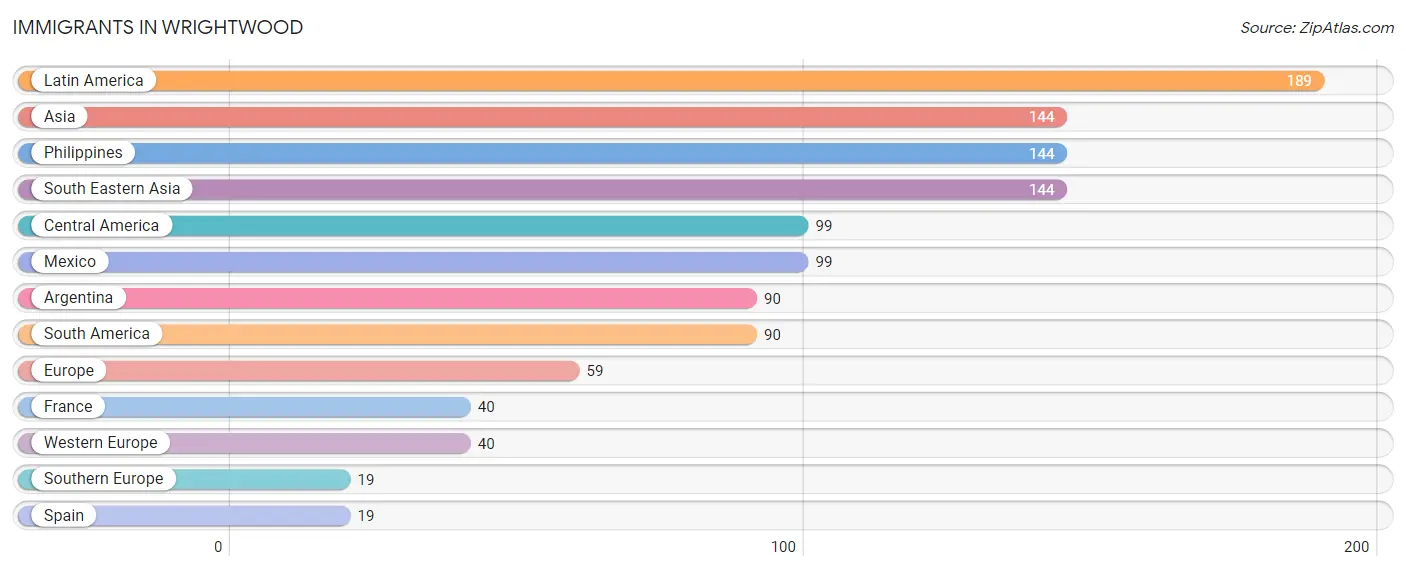
The most numerous immigrant groups reported in Wrightwood came from Latin America (189 | 4.2%), Asia (144 | 3.2%), Philippines (144 | 3.2%), South Eastern Asia (144 | 3.2%), and Central America (99 | 2.2%), together accounting for 16.2% of all Wrightwood residents.
| Immigration Origin | # Population | % Population |
| Argentina | 90 | 2.0% |
| Asia | 144 | 3.2% |
| Central America | 99 | 2.2% |
| Europe | 59 | 1.3% |
| France | 40 | 0.9% |
| Latin America | 189 | 4.2% |
| Mexico | 99 | 2.2% |
| Philippines | 144 | 3.2% |
| South America | 90 | 2.0% |
| South Eastern Asia | 144 | 3.2% |
| Southern Europe | 19 | 0.4% |
| Spain | 19 | 0.4% |
| Western Europe | 40 | 0.9% | View All 13 Rows |
Sex and Age in Wrightwood
Sex and Age in Wrightwood
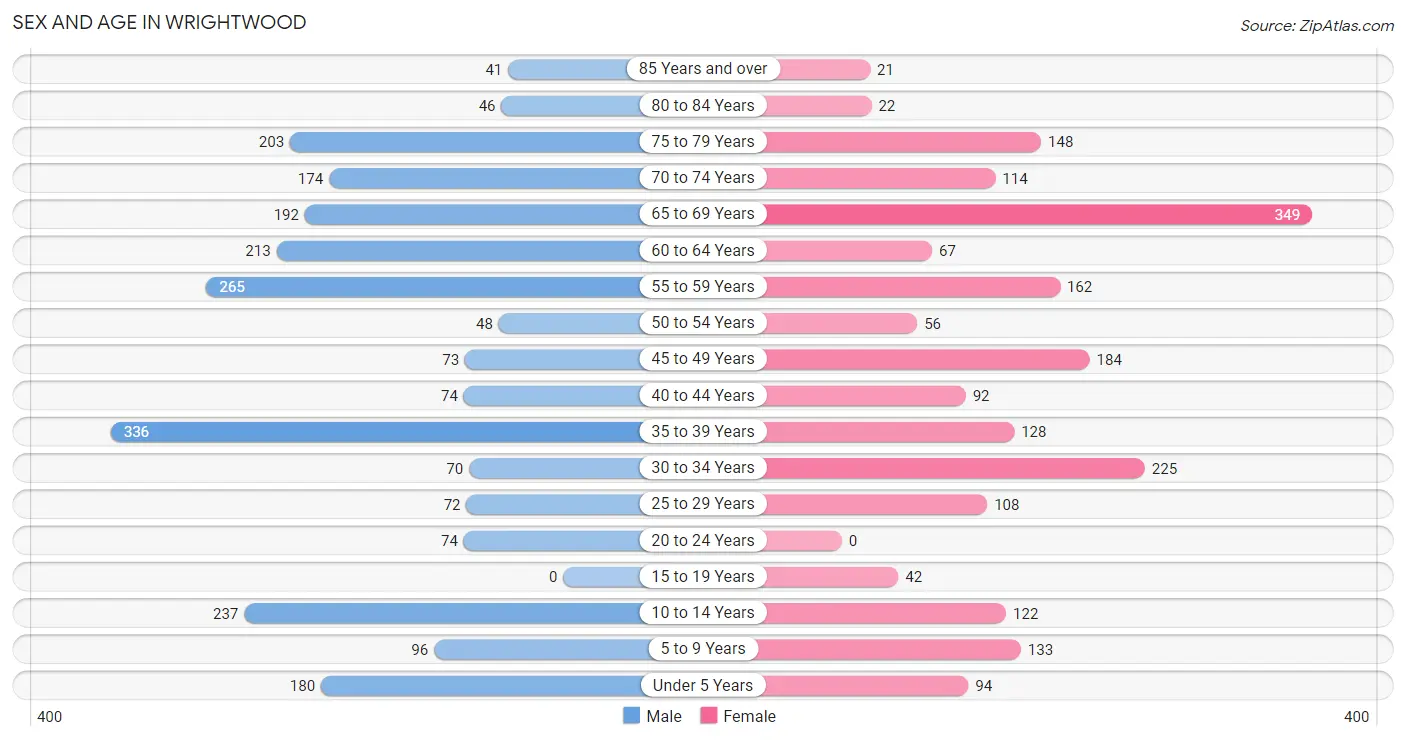
The most populous age groups in Wrightwood are 35 to 39 Years (336 | 14.0%) for men and 65 to 69 Years (349 | 16.9%) for women.
| Age Bracket | Male | Female |
| Under 5 Years | 180 (7.5%) | 94 (4.5%) |
| 5 to 9 Years | 96 (4.0%) | 133 (6.4%) |
| 10 to 14 Years | 237 (9.9%) | 122 (5.9%) |
| 15 to 19 Years | 0 (0.0%) | 42 (2.0%) |
| 20 to 24 Years | 74 (3.1%) | 0 (0.0%) |
| 25 to 29 Years | 72 (3.0%) | 108 (5.2%) |
| 30 to 34 Years | 70 (2.9%) | 225 (10.9%) |
| 35 to 39 Years | 336 (14.0%) | 128 (6.2%) |
| 40 to 44 Years | 74 (3.1%) | 92 (4.4%) |
| 45 to 49 Years | 73 (3.0%) | 184 (8.9%) |
| 50 to 54 Years | 48 (2.0%) | 56 (2.7%) |
| 55 to 59 Years | 265 (11.1%) | 162 (7.8%) |
| 60 to 64 Years | 213 (8.9%) | 67 (3.2%) |
| 65 to 69 Years | 192 (8.0%) | 349 (16.9%) |
| 70 to 74 Years | 174 (7.3%) | 114 (5.5%) |
| 75 to 79 Years | 203 (8.5%) | 148 (7.2%) |
| 80 to 84 Years | 46 (1.9%) | 22 (1.1%) |
| 85 Years and over | 41 (1.7%) | 21 (1.0%) |
| Total | 2,394 (100.0%) | 2,067 (100.0%) |
Families and Households in Wrightwood
Median Family Size in Wrightwood
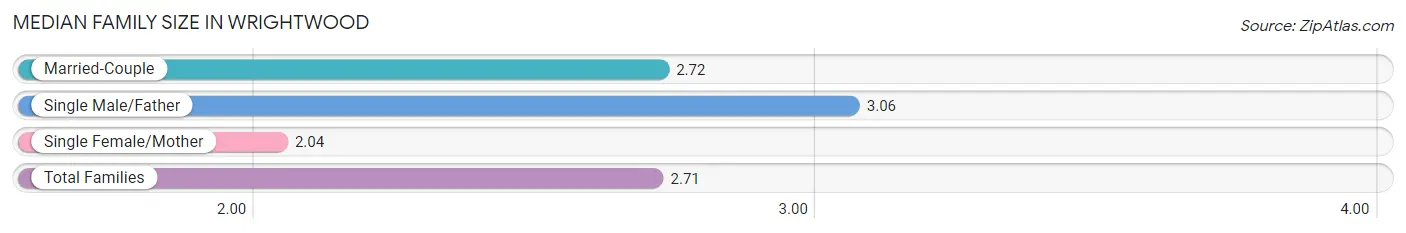
The median family size in Wrightwood is 2.71 persons per family, with single male/father families (63 | 4.9%) accounting for the largest median family size of 3.06 persons per family. On the other hand, single female/mother families (48 | 3.7%) represent the smallest median family size with 2.04 persons per family.
| Family Type | # Families | Family Size |
| Married-Couple | 1,168 (91.3%) | 2.72 |
| Single Male/Father | 63 (4.9%) | 3.06 |
| Single Female/Mother | 48 (3.7%) | 2.04 |
| Total Families | 1,279 (100.0%) | 2.71 |
Median Household Size in Wrightwood
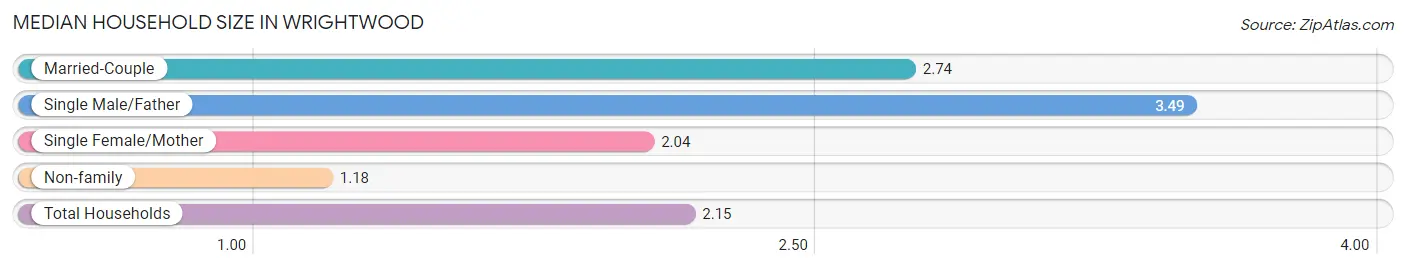
The median household size in Wrightwood is 2.15 persons per household, with single male/father households (63 | 3.0%) accounting for the largest median household size of 3.49 persons per household. non-family households (799 | 38.5%) represent the smallest median household size with 1.18 persons per household.
| Household Type | # Households | Household Size |
| Married-Couple | 1,168 (56.2%) | 2.74 |
| Single Male/Father | 63 (3.0%) | 3.49 |
| Single Female/Mother | 48 (2.3%) | 2.04 |
| Non-family | 799 (38.5%) | 1.18 |
| Total Households | 2,078 (100.0%) | 2.15 |
Household Size by Marriage Status in Wrightwood
Out of a total of 2,078 households in Wrightwood, 1,279 (61.6%) are family households, while 799 (38.5%) are nonfamily households. The most numerous type of family households are 2-person households, comprising 873, and the most common type of nonfamily households are 1-person households, comprising 647.
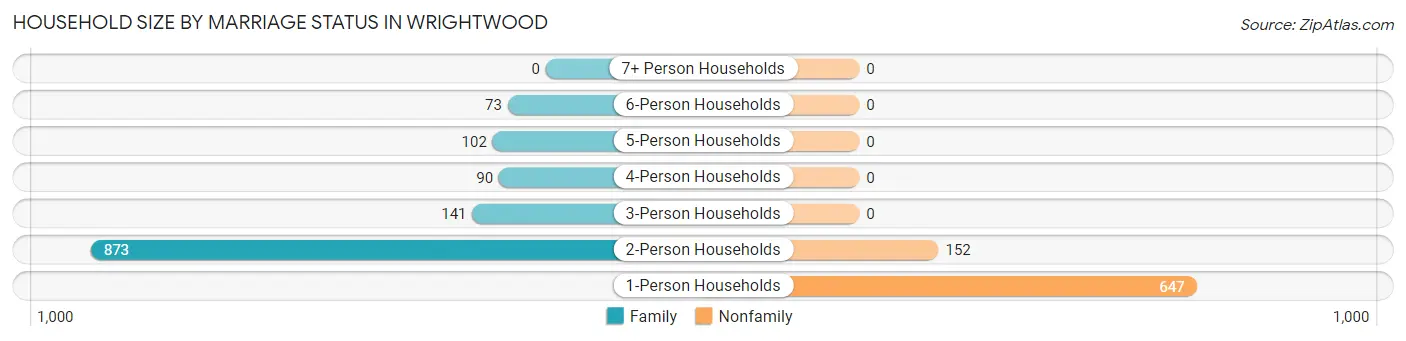
| Household Size | Family Households | Nonfamily Households |
| 1-Person Households | - | 647 (31.1%) |
| 2-Person Households | 873 (42.0%) | 152 (7.3%) |
| 3-Person Households | 141 (6.8%) | 0 (0.0%) |
| 4-Person Households | 90 (4.3%) | 0 (0.0%) |
| 5-Person Households | 102 (4.9%) | 0 (0.0%) |
| 6-Person Households | 73 (3.5%) | 0 (0.0%) |
| 7+ Person Households | 0 (0.0%) | 0 (0.0%) |
| Total | 1,279 (61.6%) | 799 (38.5%) |
Female Fertility in Wrightwood
Fertility by Age in Wrightwood
Average fertility rate in Wrightwood is 49.0 births per 1,000 women. Women in the age bracket of 35 to 50 years have the highest fertility rate with 94.0 births per 1,000 women. Women in the age bracket of 35 to 50 years acount for 100.0% of all women with births.
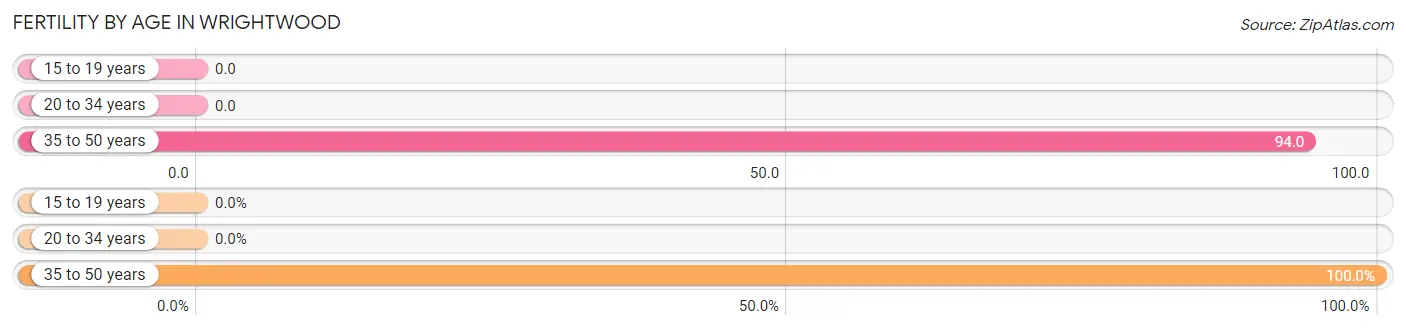
| Age Bracket | Women with Births | Births / 1,000 Women |
| 15 to 19 years | 0 (0.0%) | 0.0 |
| 20 to 34 years | 0 (0.0%) | 0.0 |
| 35 to 50 years | 38 (100.0%) | 94.0 |
| Total | 38 (100.0%) | 49.0 |
Fertility by Age by Marriage Status in Wrightwood
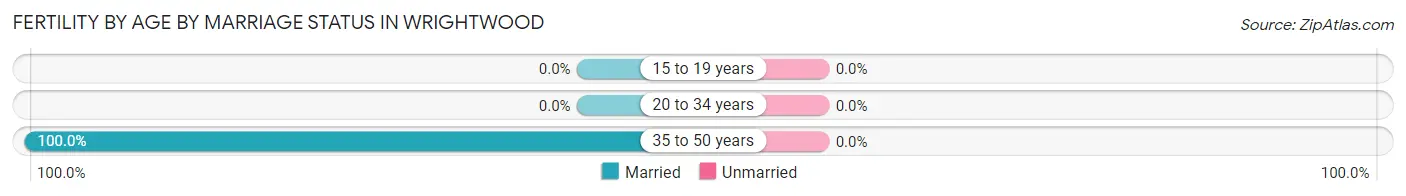
| Age Bracket | Married | Unmarried |
| 15 to 19 years | 0 (0.0%) | 0 (0.0%) |
| 20 to 34 years | 0 (0.0%) | 0 (0.0%) |
| 35 to 50 years | 38 (100.0%) | 0 (0.0%) |
| Total | 38 (100.0%) | 0 (0.0%) |
Fertility by Education in Wrightwood
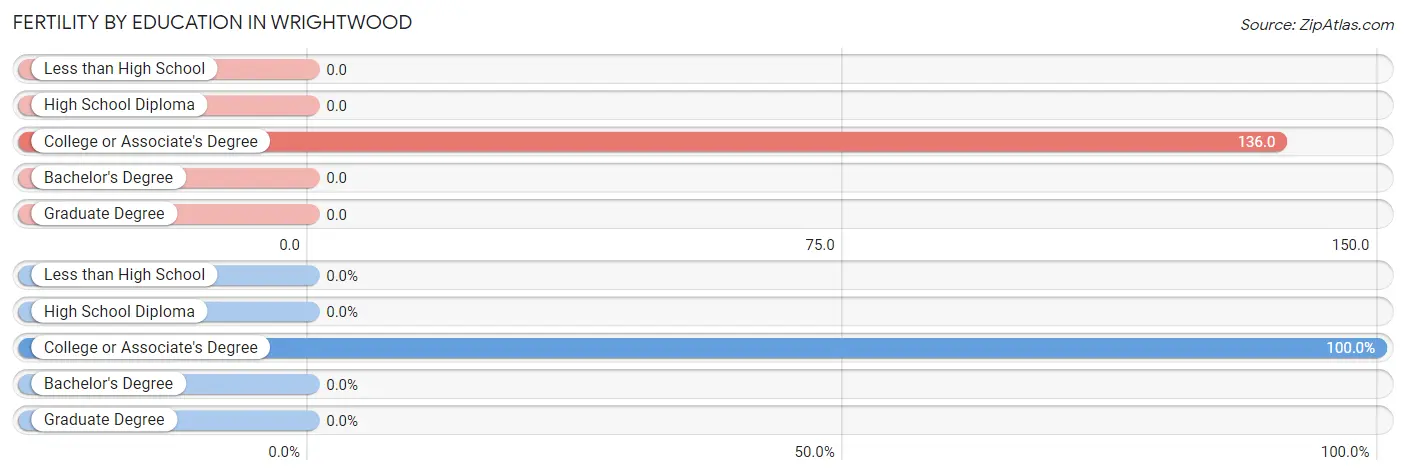
| Educational Attainment | Women with Births | Births / 1,000 Women |
| Less than High School | 0 (0.0%) | 0.0 |
| High School Diploma | 0 (0.0%) | 0.0 |
| College or Associate's Degree | 38 (100.0%) | 136.0 |
| Bachelor's Degree | 0 (0.0%) | 0.0 |
| Graduate Degree | 0 (0.0%) | 0.0 |
| Total | 38 (100.0%) | 49.0 |
Fertility by Education by Marriage Status in Wrightwood
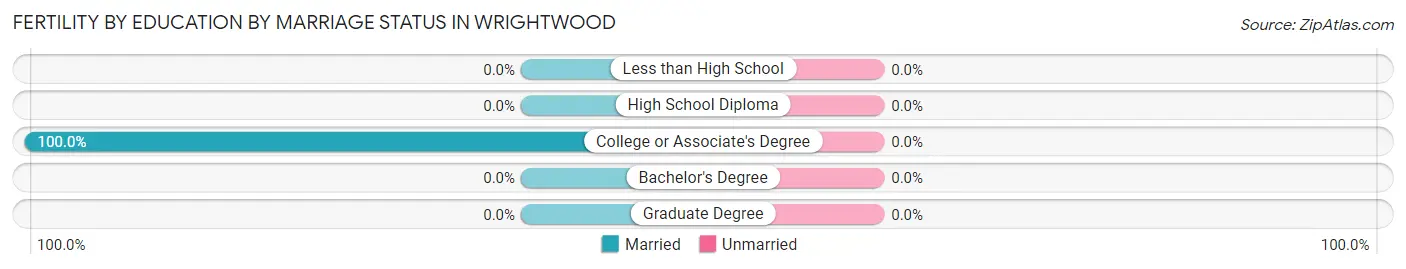
| Educational Attainment | Married | Unmarried |
| Less than High School | 0 (0.0%) | 0 (0.0%) |
| High School Diploma | 0 (0.0%) | 0 (0.0%) |
| College or Associate's Degree | 38 (100.0%) | 0 (0.0%) |
| Bachelor's Degree | 0 (0.0%) | 0 (0.0%) |
| Graduate Degree | 0 (0.0%) | 0 (0.0%) |
| Total | 38 (100.0%) | 0 (0.0%) |
Employment Characteristics in Wrightwood
Employment by Class of Employer in Wrightwood
Among the 1,913 employed individuals in Wrightwood, private company employees (1,051 | 54.9%), self-employed (not incorporated) (240 | 12.6%), and local government employees (226 | 11.8%) make up the most common classes of employment.
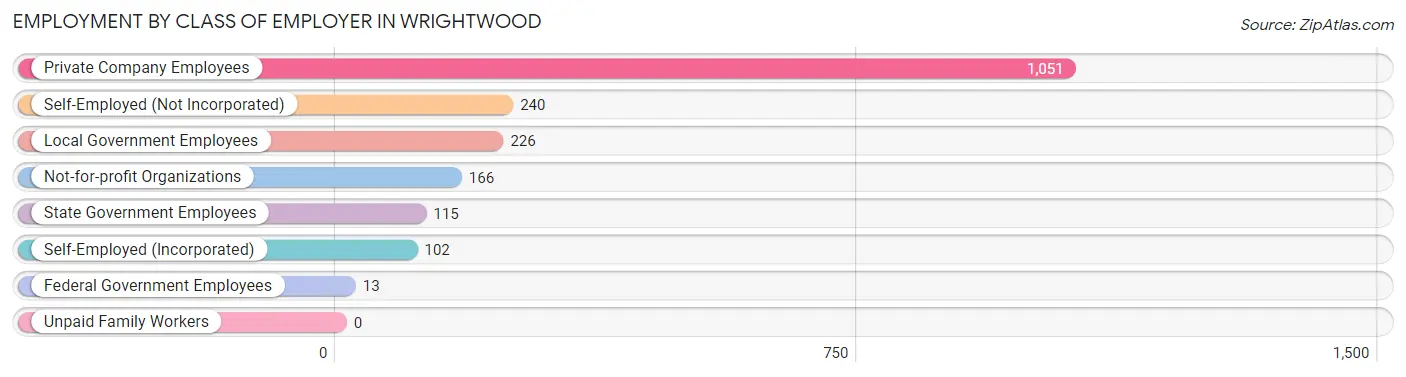
| Employer Class | # Employees | % Employees |
| Private Company Employees | 1,051 | 54.9% |
| Self-Employed (Incorporated) | 102 | 5.3% |
| Self-Employed (Not Incorporated) | 240 | 12.6% |
| Not-for-profit Organizations | 166 | 8.7% |
| Local Government Employees | 226 | 11.8% |
| State Government Employees | 115 | 6.0% |
| Federal Government Employees | 13 | 0.7% |
| Unpaid Family Workers | 0 | 0.0% |
| Total | 1,913 | 100.0% |
Employment Status by Age in Wrightwood
According to the labor force statistics for Wrightwood, out of the total population over 16 years of age (3,599), 55.2% or 1,987 individuals are in the labor force, with 2.4% or 48 of them unemployed. The age group with the highest labor force participation rate is 30 to 34 years, with 92.5% or 273 individuals in the labor force. Within the labor force, the 20 to 24 years age range has the highest percentage of unemployed individuals, with 7.0% or 4 of them being unemployed.
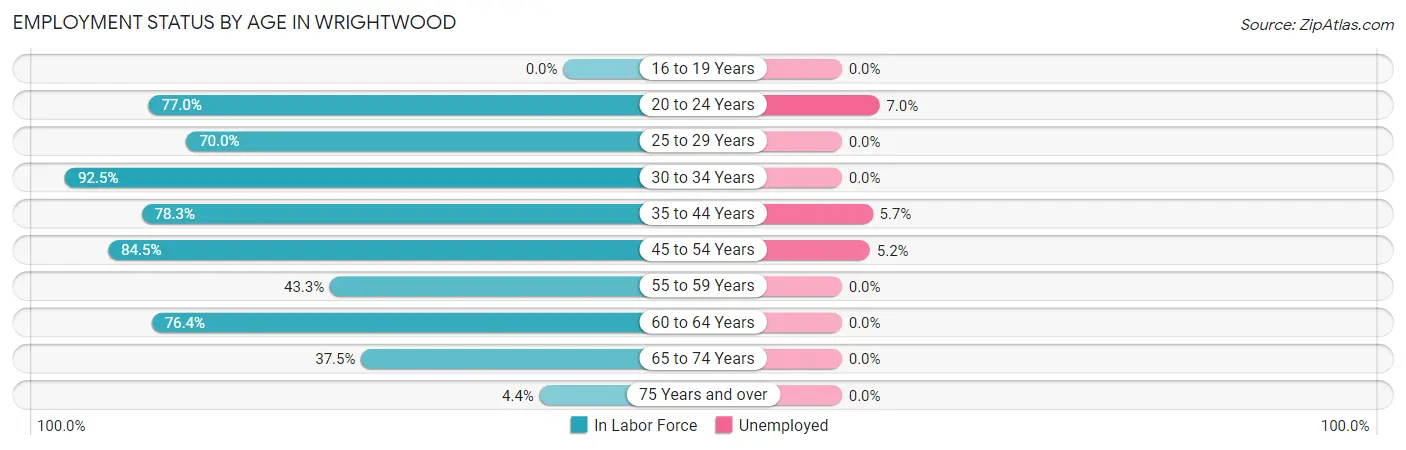
| Age Bracket | In Labor Force | Unemployed |
| 16 to 19 Years | 0 (0.0%) | 0 (0.0%) |
| 20 to 24 Years | 57 (77.0%) | 4 (7.0%) |
| 25 to 29 Years | 126 (70.0%) | 0 (0.0%) |
| 30 to 34 Years | 273 (92.5%) | 0 (0.0%) |
| 35 to 44 Years | 493 (78.3%) | 28 (5.7%) |
| 45 to 54 Years | 305 (84.5%) | 16 (5.2%) |
| 55 to 59 Years | 185 (43.3%) | 0 (0.0%) |
| 60 to 64 Years | 214 (76.4%) | 0 (0.0%) |
| 65 to 74 Years | 311 (37.5%) | 0 (0.0%) |
| 75 Years and over | 21 (4.4%) | 0 (0.0%) |
| Total | 1,987 (55.2%) | 48 (2.4%) |
Employment Status by Educational Attainment in Wrightwood
According to labor force statistics for Wrightwood, 73.4% of individuals (1,595) out of the total population between 25 and 64 years of age (2,173) are in the labor force, with 2.8% or 45 of them being unemployed. The group with the highest labor force participation rate are those with the educational attainment of bachelor's degree or higher, with 84.4% or 626 individuals in the labor force. Within the labor force, individuals with less than high school education have the highest percentage of unemployment, with 10.7% or 16 of them being unemployed.
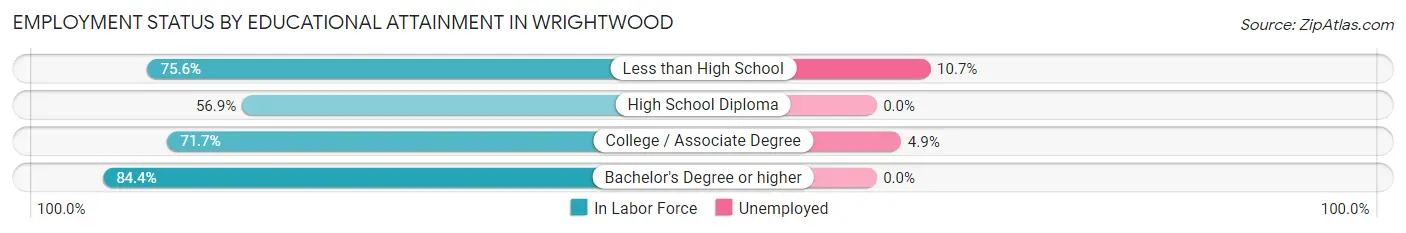
| Educational Attainment | In Labor Force | Unemployed |
| Less than High School | 149 (75.6%) | 21 (10.7%) |
| High School Diploma | 244 (56.9%) | 0 (0.0%) |
| College / Associate Degree | 577 (71.7%) | 39 (4.9%) |
| Bachelor's Degree or higher | 626 (84.4%) | 0 (0.0%) |
| Total | 1,595 (73.4%) | 61 (2.8%) |
Employment Occupations by Sex in Wrightwood
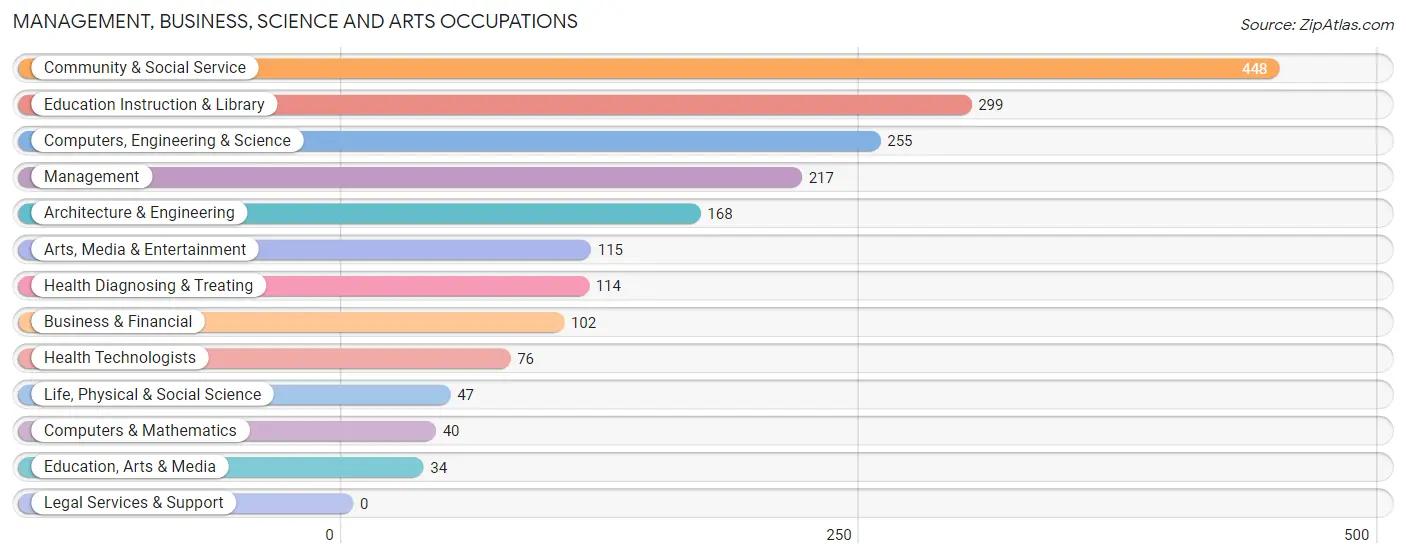
Management, Business, Science and Arts Occupations
The most common Management, Business, Science and Arts occupations in Wrightwood are Community & Social Service (448 | 23.1%), Education Instruction & Library (299 | 15.4%), Computers, Engineering & Science (255 | 13.2%), Management (217 | 11.2%), and Architecture & Engineering (168 | 8.7%).
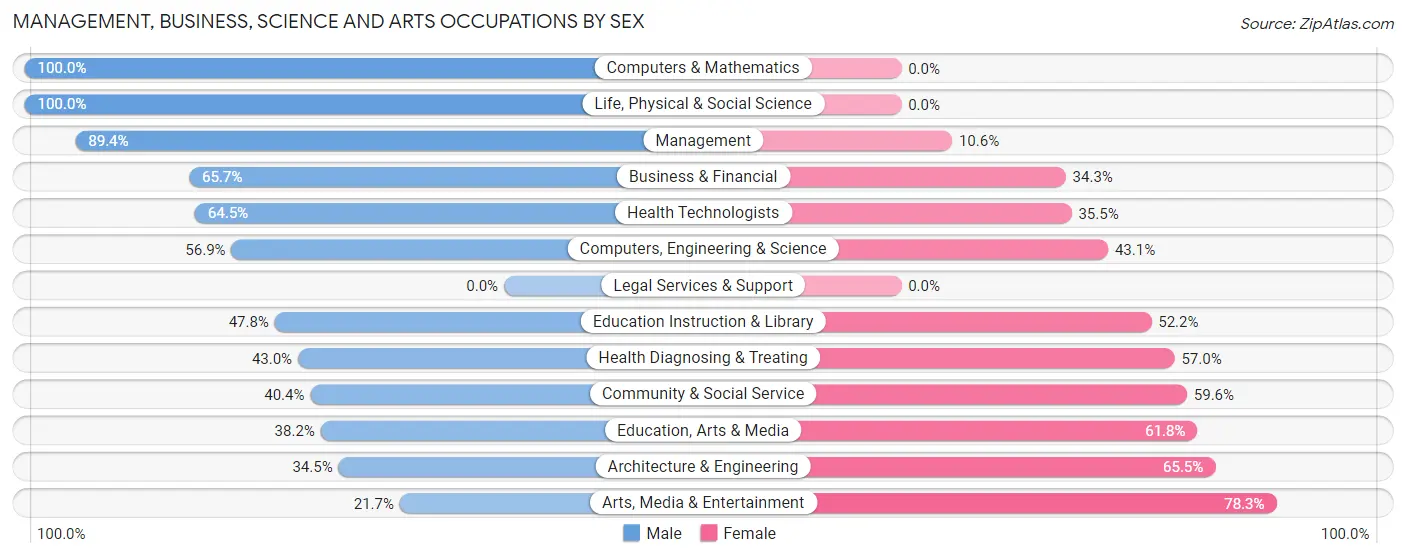
Management, Business, Science and Arts Occupations by Sex
Within the Management, Business, Science and Arts occupations in Wrightwood, the most male-oriented occupations are Computers & Mathematics (100.0%), Life, Physical & Social Science (100.0%), and Management (89.4%), while the most female-oriented occupations are Arts, Media & Entertainment (78.3%), Architecture & Engineering (65.5%), and Education, Arts & Media (61.8%).
| Occupation | Male | Female |
| Management | 194 (89.4%) | 23 (10.6%) |
| Business & Financial | 67 (65.7%) | 35 (34.3%) |
| Computers, Engineering & Science | 145 (56.9%) | 110 (43.1%) |
| Computers & Mathematics | 40 (100.0%) | 0 (0.0%) |
| Architecture & Engineering | 58 (34.5%) | 110 (65.5%) |
| Life, Physical & Social Science | 47 (100.0%) | 0 (0.0%) |
| Community & Social Service | 181 (40.4%) | 267 (59.6%) |
| Education, Arts & Media | 13 (38.2%) | 21 (61.8%) |
| Legal Services & Support | 0 (0.0%) | 0 (0.0%) |
| Education Instruction & Library | 143 (47.8%) | 156 (52.2%) |
| Arts, Media & Entertainment | 25 (21.7%) | 90 (78.3%) |
| Health Diagnosing & Treating | 49 (43.0%) | 65 (57.0%) |
| Health Technologists | 49 (64.5%) | 27 (35.5%) |
| Total (Category) | 636 (56.0%) | 500 (44.0%) |
| Total (Overall) | 1,138 (58.8%) | 799 (41.2%) |
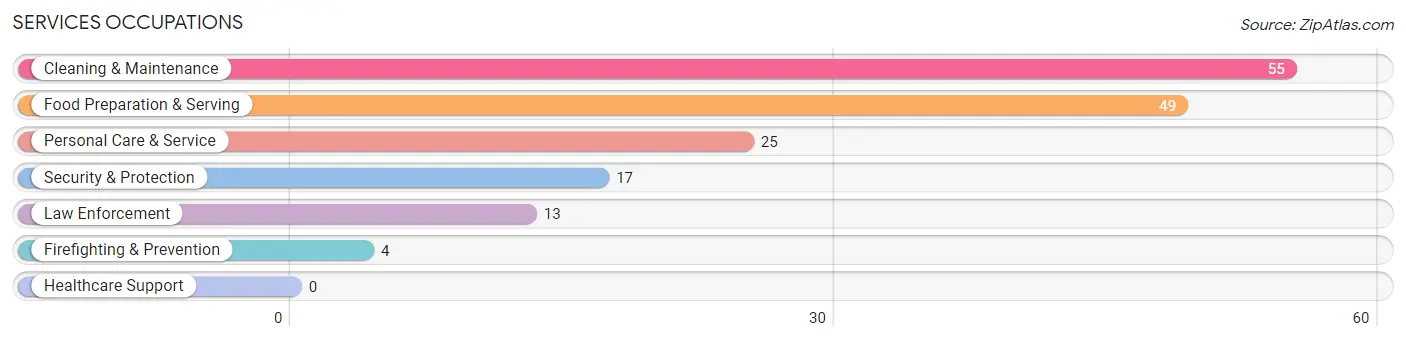
Services Occupations
The most common Services occupations in Wrightwood are Cleaning & Maintenance (55 | 2.8%), Food Preparation & Serving (49 | 2.5%), Personal Care & Service (25 | 1.3%), Security & Protection (17 | 0.9%), and Law Enforcement (13 | 0.7%).
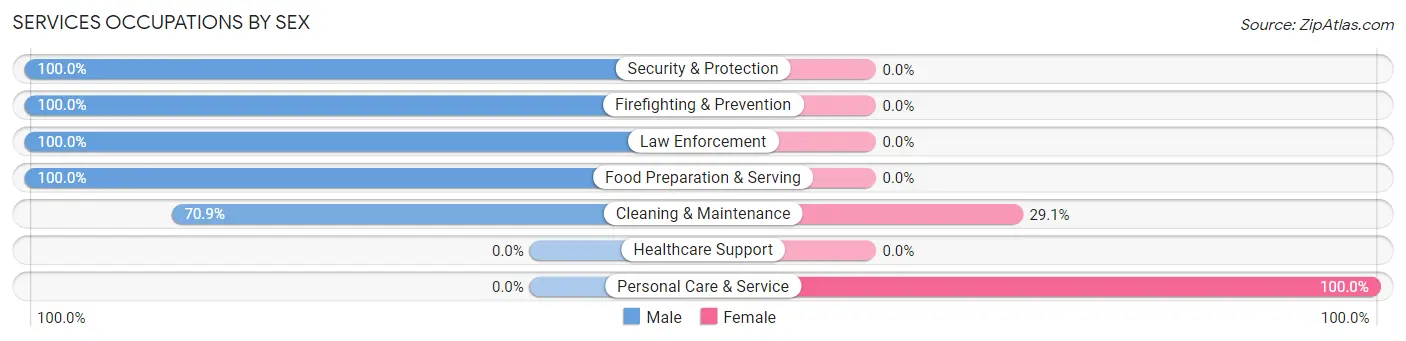
Services Occupations by Sex
Within the Services occupations in Wrightwood, the most male-oriented occupations are Security & Protection (100.0%), Firefighting & Prevention (100.0%), and Law Enforcement (100.0%), while the most female-oriented occupations are Personal Care & Service (100.0%), and Cleaning & Maintenance (29.1%).
| Occupation | Male | Female |
| Healthcare Support | 0 (0.0%) | 0 (0.0%) |
| Security & Protection | 17 (100.0%) | 0 (0.0%) |
| Firefighting & Prevention | 4 (100.0%) | 0 (0.0%) |
| Law Enforcement | 13 (100.0%) | 0 (0.0%) |
| Food Preparation & Serving | 49 (100.0%) | 0 (0.0%) |
| Cleaning & Maintenance | 39 (70.9%) | 16 (29.1%) |
| Personal Care & Service | 0 (0.0%) | 25 (100.0%) |
| Total (Category) | 105 (71.9%) | 41 (28.1%) |
| Total (Overall) | 1,138 (58.8%) | 799 (41.2%) |
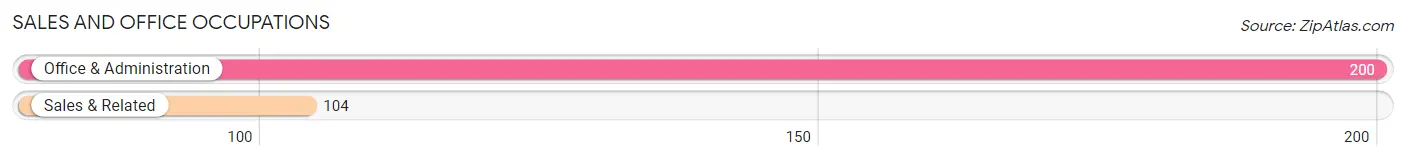
Sales and Office Occupations
The most common Sales and Office occupations in Wrightwood are Office & Administration (200 | 10.3%), and Sales & Related (104 | 5.4%).
Sales and Office Occupations by Sex
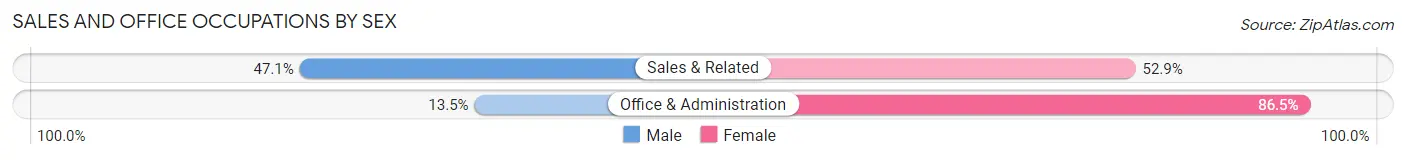
| Occupation | Male | Female |
| Sales & Related | 49 (47.1%) | 55 (52.9%) |
| Office & Administration | 27 (13.5%) | 173 (86.5%) |
| Total (Category) | 76 (25.0%) | 228 (75.0%) |
| Total (Overall) | 1,138 (58.8%) | 799 (41.2%) |
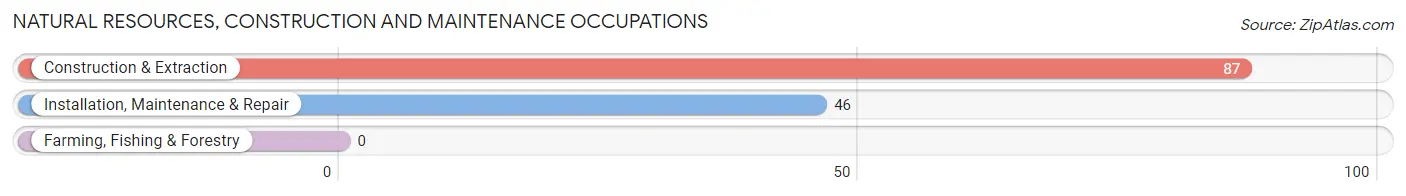
Natural Resources, Construction and Maintenance Occupations
The most common Natural Resources, Construction and Maintenance occupations in Wrightwood are Construction & Extraction (87 | 4.5%), and Installation, Maintenance & Repair (46 | 2.4%).
Natural Resources, Construction and Maintenance Occupations by Sex
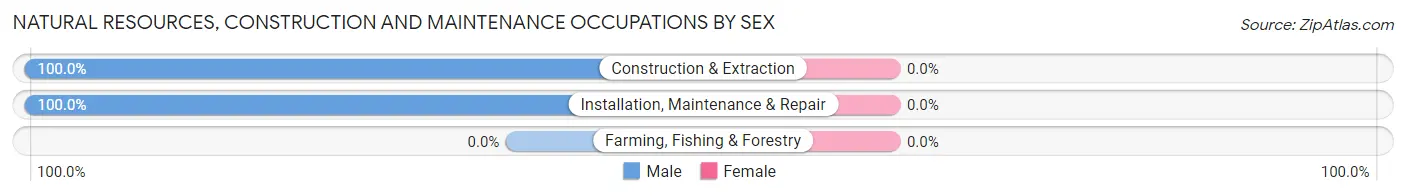
| Occupation | Male | Female |
| Farming, Fishing & Forestry | 0 (0.0%) | 0 (0.0%) |
| Construction & Extraction | 87 (100.0%) | 0 (0.0%) |
| Installation, Maintenance & Repair | 46 (100.0%) | 0 (0.0%) |
| Total (Category) | 133 (100.0%) | 0 (0.0%) |
| Total (Overall) | 1,138 (58.8%) | 799 (41.2%) |
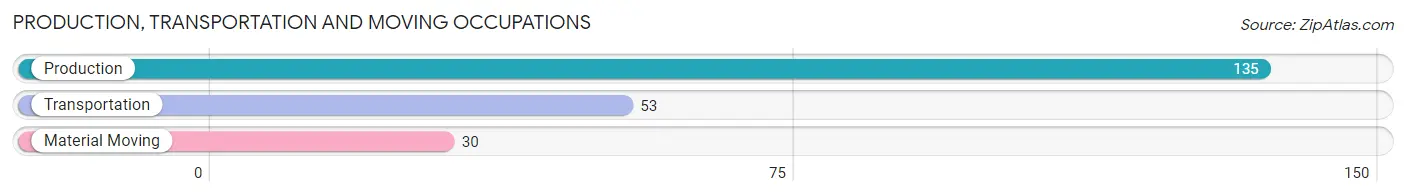
Production, Transportation and Moving Occupations
The most common Production, Transportation and Moving occupations in Wrightwood are Production (135 | 7.0%), Transportation (53 | 2.7%), and Material Moving (30 | 1.5%).
Production, Transportation and Moving Occupations by Sex
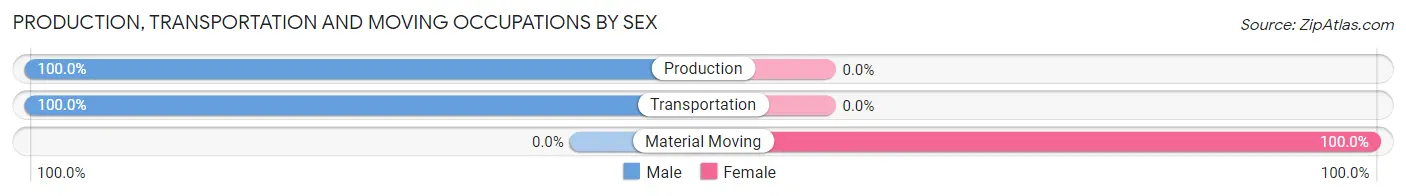
| Occupation | Male | Female |
| Production | 135 (100.0%) | 0 (0.0%) |
| Transportation | 53 (100.0%) | 0 (0.0%) |
| Material Moving | 0 (0.0%) | 30 (100.0%) |
| Total (Category) | 188 (86.2%) | 30 (13.8%) |
| Total (Overall) | 1,138 (58.8%) | 799 (41.2%) |
Employment Industries by Sex in Wrightwood
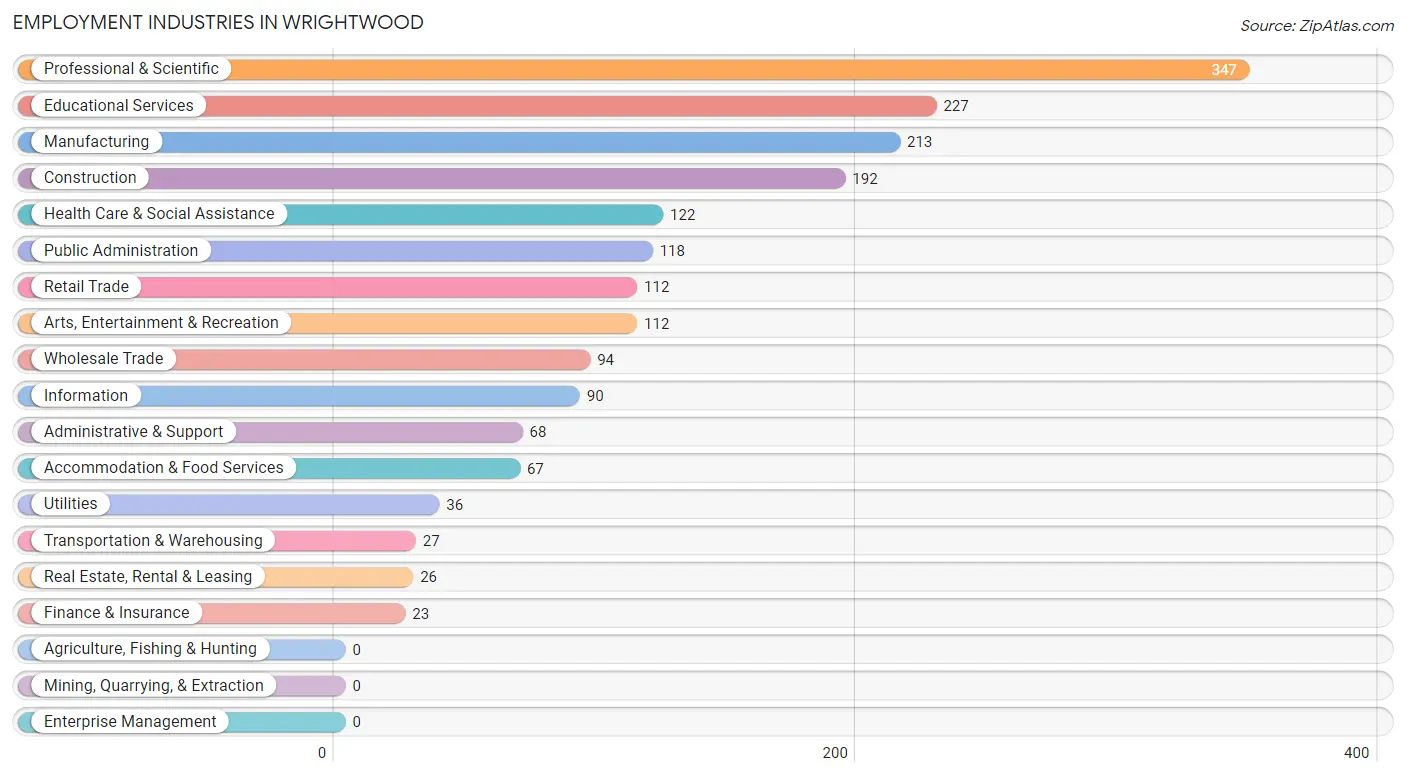
Employment Industries in Wrightwood
The major employment industries in Wrightwood include Professional & Scientific (347 | 17.9%), Educational Services (227 | 11.7%), Manufacturing (213 | 11.0%), Construction (192 | 9.9%), and Health Care & Social Assistance (122 | 6.3%).
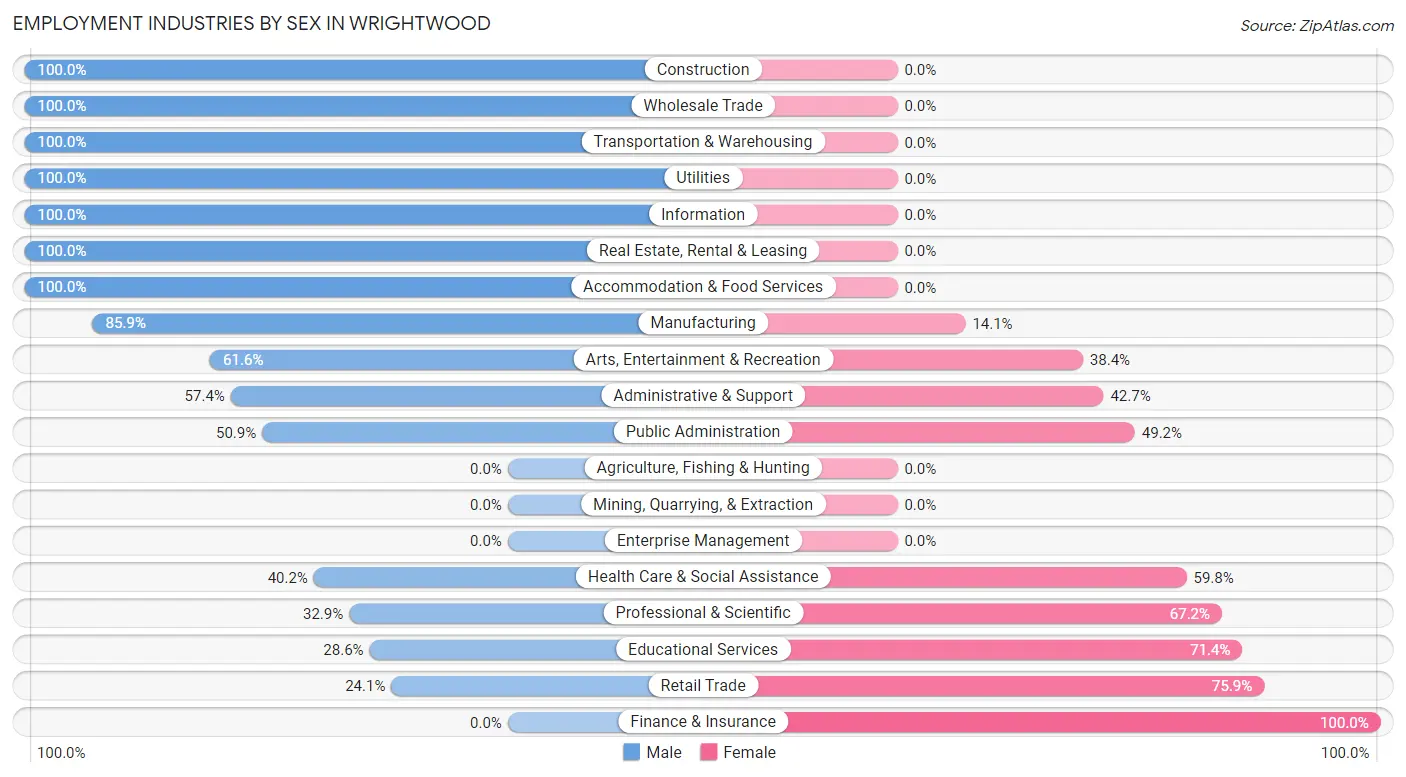
Employment Industries by Sex in Wrightwood
The Wrightwood industries that see more men than women are Construction (100.0%), Wholesale Trade (100.0%), and Transportation & Warehousing (100.0%), whereas the industries that tend to have a higher number of women are Finance & Insurance (100.0%), Retail Trade (75.9%), and Educational Services (71.4%).
| Industry | Male | Female |
| Agriculture, Fishing & Hunting | 0 (0.0%) | 0 (0.0%) |
| Mining, Quarrying, & Extraction | 0 (0.0%) | 0 (0.0%) |
| Construction | 192 (100.0%) | 0 (0.0%) |
| Manufacturing | 183 (85.9%) | 30 (14.1%) |
| Wholesale Trade | 94 (100.0%) | 0 (0.0%) |
| Retail Trade | 27 (24.1%) | 85 (75.9%) |
| Transportation & Warehousing | 27 (100.0%) | 0 (0.0%) |
| Utilities | 36 (100.0%) | 0 (0.0%) |
| Information | 90 (100.0%) | 0 (0.0%) |
| Finance & Insurance | 0 (0.0%) | 23 (100.0%) |
| Real Estate, Rental & Leasing | 26 (100.0%) | 0 (0.0%) |
| Professional & Scientific | 114 (32.9%) | 233 (67.1%) |
| Enterprise Management | 0 (0.0%) | 0 (0.0%) |
| Administrative & Support | 39 (57.4%) | 29 (42.6%) |
| Educational Services | 65 (28.6%) | 162 (71.4%) |
| Health Care & Social Assistance | 49 (40.2%) | 73 (59.8%) |
| Arts, Entertainment & Recreation | 69 (61.6%) | 43 (38.4%) |
| Accommodation & Food Services | 67 (100.0%) | 0 (0.0%) |
| Public Administration | 60 (50.8%) | 58 (49.1%) |
| Total | 1,138 (58.8%) | 799 (41.2%) |
Education in Wrightwood
School Enrollment in Wrightwood
The most common levels of schooling among the 809 students in Wrightwood are middle school (267 | 33.0%), elementary school (149 | 18.4%), and graduate / professional (118 | 14.6%).
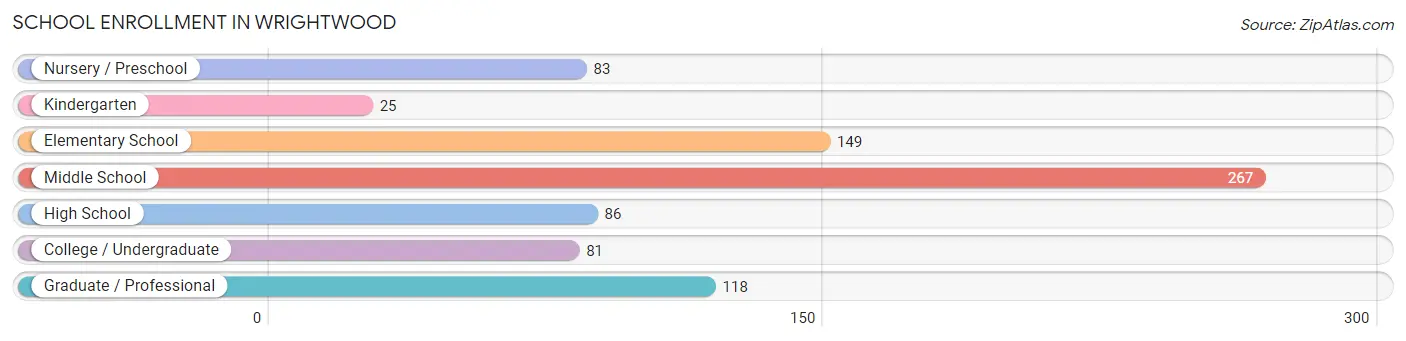
| School Level | # Students | % Students |
| Nursery / Preschool | 83 | 10.3% |
| Kindergarten | 25 | 3.1% |
| Elementary School | 149 | 18.4% |
| Middle School | 267 | 33.0% |
| High School | 86 | 10.6% |
| College / Undergraduate | 81 | 10.0% |
| Graduate / Professional | 118 | 14.6% |
| Total | 809 | 100.0% |
School Enrollment by Age by Funding Source in Wrightwood
Out of a total of 809 students who are enrolled in schools in Wrightwood, 235 (29.0%) attend a private institution, while the remaining 574 (71.0%) are enrolled in public schools. The age group of 35 years and over has the highest likelihood of being enrolled in private schools, with 99 (66.9% in the age bracket) enrolled. Conversely, the age group of 3 to 4 year olds has the lowest likelihood of being enrolled in a private school, with 28 (100.0% in the age bracket) attending a public institution.
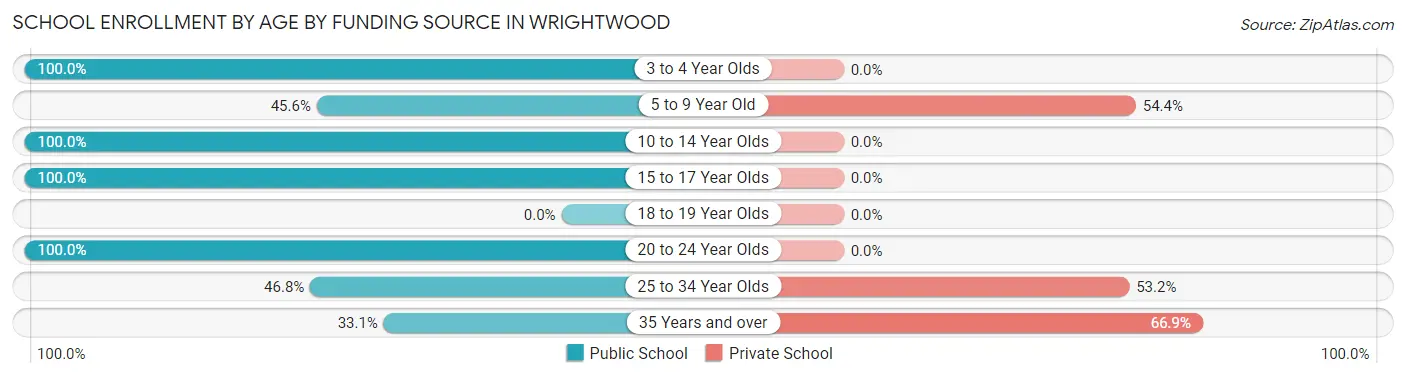
| Age Bracket | Public School | Private School |
| 3 to 4 Year Olds | 28 (100.0%) | 0 (0.0%) |
| 5 to 9 Year Old | 93 (45.6%) | 111 (54.4%) |
| 10 to 14 Year Olds | 359 (100.0%) | 0 (0.0%) |
| 15 to 17 Year Olds | 19 (100.0%) | 0 (0.0%) |
| 18 to 19 Year Olds | 0 (0.0%) | 0 (0.0%) |
| 20 to 24 Year Olds | 4 (100.0%) | 0 (0.0%) |
| 25 to 34 Year Olds | 22 (46.8%) | 25 (53.2%) |
| 35 Years and over | 49 (33.1%) | 99 (66.9%) |
| Total | 574 (71.0%) | 235 (29.0%) |
Educational Attainment by Field of Study in Wrightwood
Business (264 | 18.0%), engineering (236 | 16.1%), social sciences (172 | 11.7%), education (163 | 11.1%), and liberal arts & history (149 | 10.1%) are the most common fields of study among 1,470 individuals in Wrightwood who have obtained a bachelor's degree or higher.
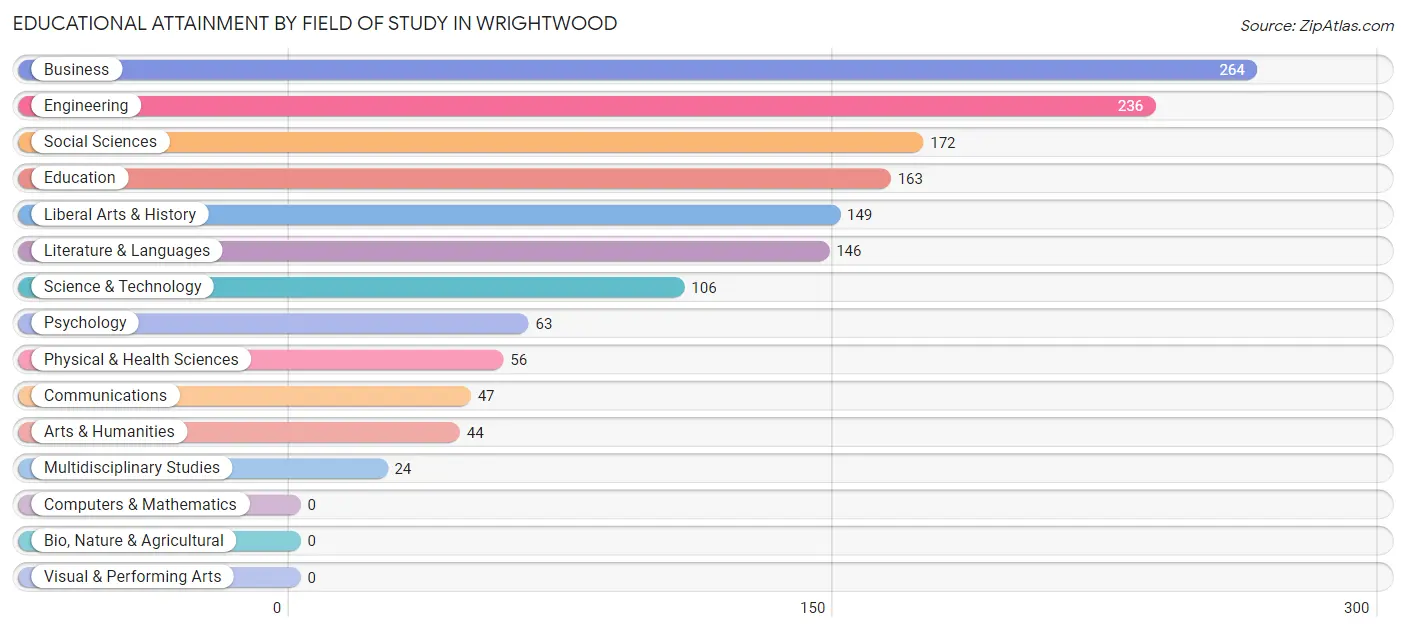
| Field of Study | # Graduates | % Graduates |
| Computers & Mathematics | 0 | 0.0% |
| Bio, Nature & Agricultural | 0 | 0.0% |
| Physical & Health Sciences | 56 | 3.8% |
| Psychology | 63 | 4.3% |
| Social Sciences | 172 | 11.7% |
| Engineering | 236 | 16.1% |
| Multidisciplinary Studies | 24 | 1.6% |
| Science & Technology | 106 | 7.2% |
| Business | 264 | 18.0% |
| Education | 163 | 11.1% |
| Literature & Languages | 146 | 9.9% |
| Liberal Arts & History | 149 | 10.1% |
| Visual & Performing Arts | 0 | 0.0% |
| Communications | 47 | 3.2% |
| Arts & Humanities | 44 | 3.0% |
| Total | 1,470 | 100.0% |
Transportation & Commute in Wrightwood
Vehicle Availability by Sex in Wrightwood
The most prevalent vehicle ownership categories in Wrightwood are males with 2 vehicles (469, accounting for 42.1%) and females with 2 vehicles (248, making up 58.7%).
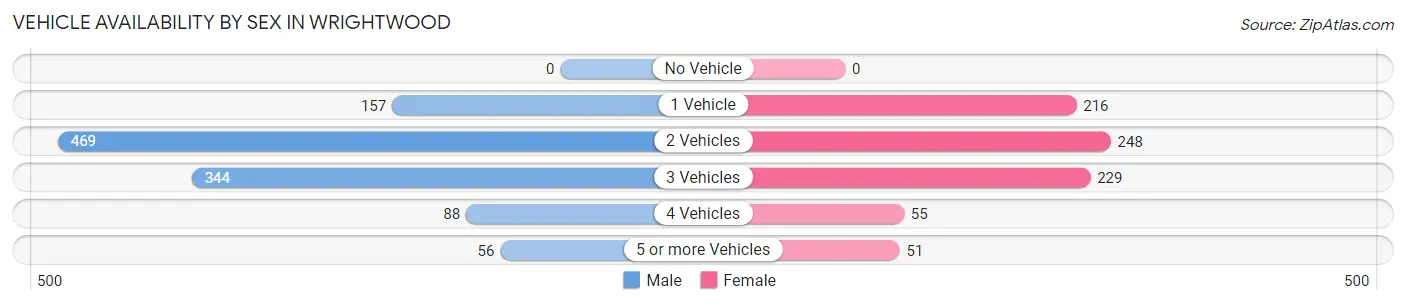
| Vehicles Available | Male | Female |
| No Vehicle | 0 (0.0%) | 0 (0.0%) |
| 1 Vehicle | 157 (14.1%) | 216 (27.0%) |
| 2 Vehicles | 469 (42.1%) | 248 (31.0%) |
| 3 Vehicles | 344 (30.9%) | 229 (28.7%) |
| 4 Vehicles | 88 (7.9%) | 55 (6.9%) |
| 5 or more Vehicles | 56 (5.0%) | 51 (6.4%) |
| Total | 1,114 (100.0%) | 799 (100.0%) |
Commute Time in Wrightwood
The most frequently occuring commute durations in Wrightwood are 45 to 59 minutes (374 commuters, 25.4%), 5 to 9 minutes (259 commuters, 17.6%), and 40 to 44 minutes (132 commuters, 9.0%).
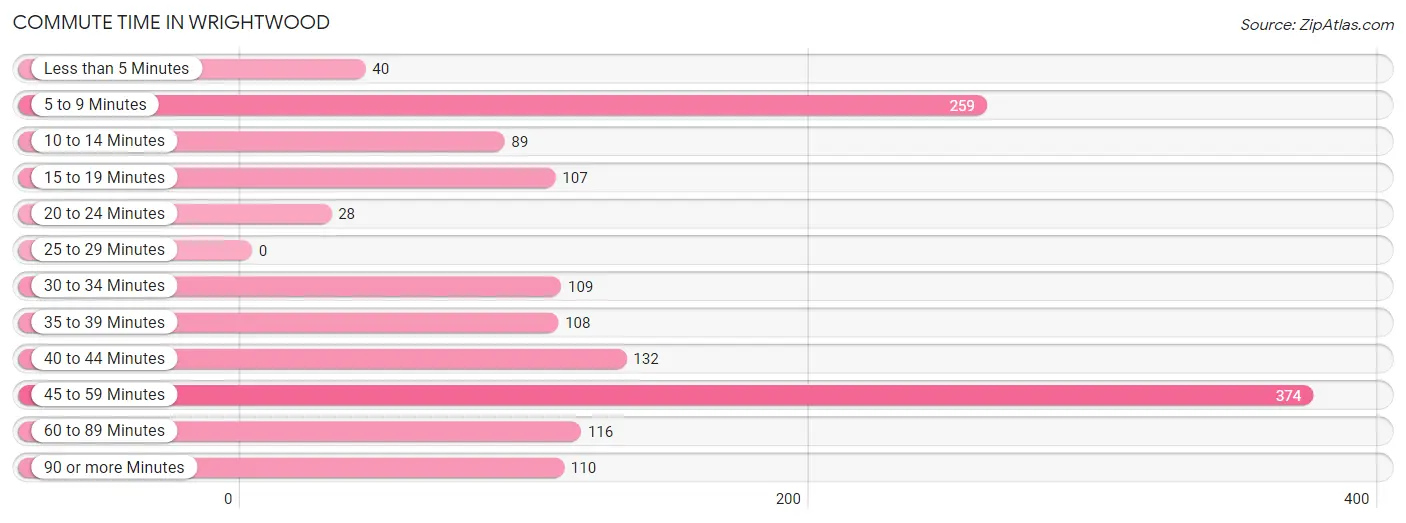
| Commute Time | # Commuters | % Commuters |
| Less than 5 Minutes | 40 | 2.7% |
| 5 to 9 Minutes | 259 | 17.6% |
| 10 to 14 Minutes | 89 | 6.0% |
| 15 to 19 Minutes | 107 | 7.3% |
| 20 to 24 Minutes | 28 | 1.9% |
| 25 to 29 Minutes | 0 | 0.0% |
| 30 to 34 Minutes | 109 | 7.4% |
| 35 to 39 Minutes | 108 | 7.3% |
| 40 to 44 Minutes | 132 | 9.0% |
| 45 to 59 Minutes | 374 | 25.4% |
| 60 to 89 Minutes | 116 | 7.9% |
| 90 or more Minutes | 110 | 7.5% |
Commute Time by Sex in Wrightwood
The most common commute times in Wrightwood are 45 to 59 minutes (220 commuters, 23.4%) for males and 45 to 59 minutes (154 commuters, 29.0%) for females.
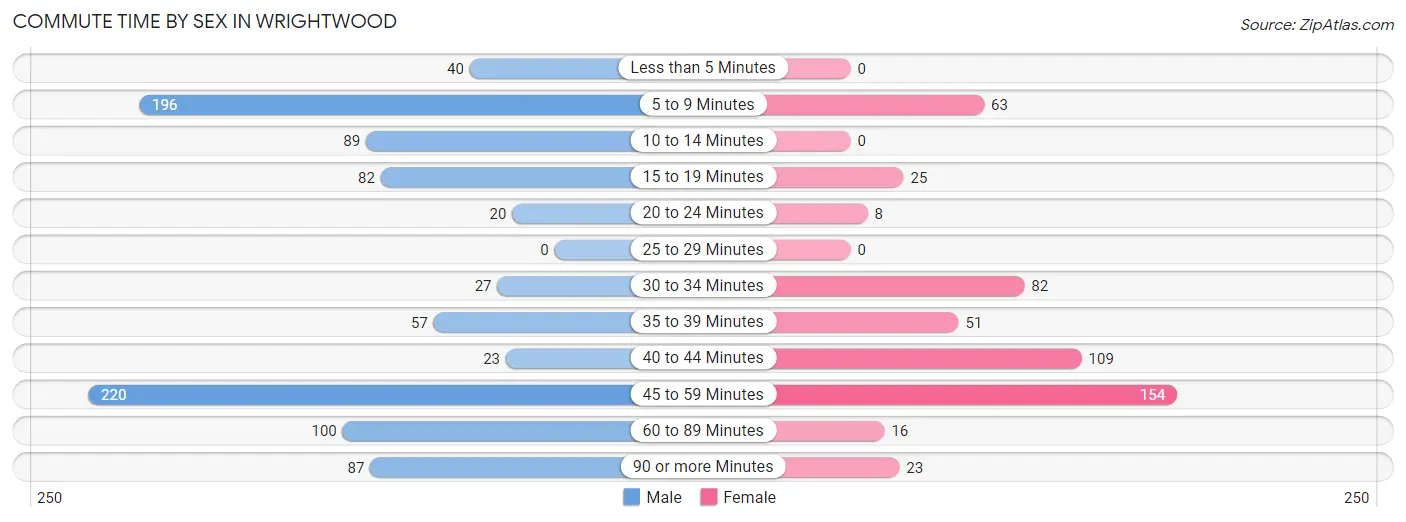
| Commute Time | Male | Female |
| Less than 5 Minutes | 40 (4.3%) | 0 (0.0%) |
| 5 to 9 Minutes | 196 (20.8%) | 63 (11.9%) |
| 10 to 14 Minutes | 89 (9.5%) | 0 (0.0%) |
| 15 to 19 Minutes | 82 (8.7%) | 25 (4.7%) |
| 20 to 24 Minutes | 20 (2.1%) | 8 (1.5%) |
| 25 to 29 Minutes | 0 (0.0%) | 0 (0.0%) |
| 30 to 34 Minutes | 27 (2.9%) | 82 (15.4%) |
| 35 to 39 Minutes | 57 (6.1%) | 51 (9.6%) |
| 40 to 44 Minutes | 23 (2.4%) | 109 (20.5%) |
| 45 to 59 Minutes | 220 (23.4%) | 154 (29.0%) |
| 60 to 89 Minutes | 100 (10.6%) | 16 (3.0%) |
| 90 or more Minutes | 87 (9.2%) | 23 (4.3%) |
Time of Departure to Work by Sex in Wrightwood
The most frequent times of departure to work in Wrightwood are 12:00 AM to 4:59 AM (206, 21.9%) for males and 7:00 AM to 7:29 AM (136, 25.6%) for females.
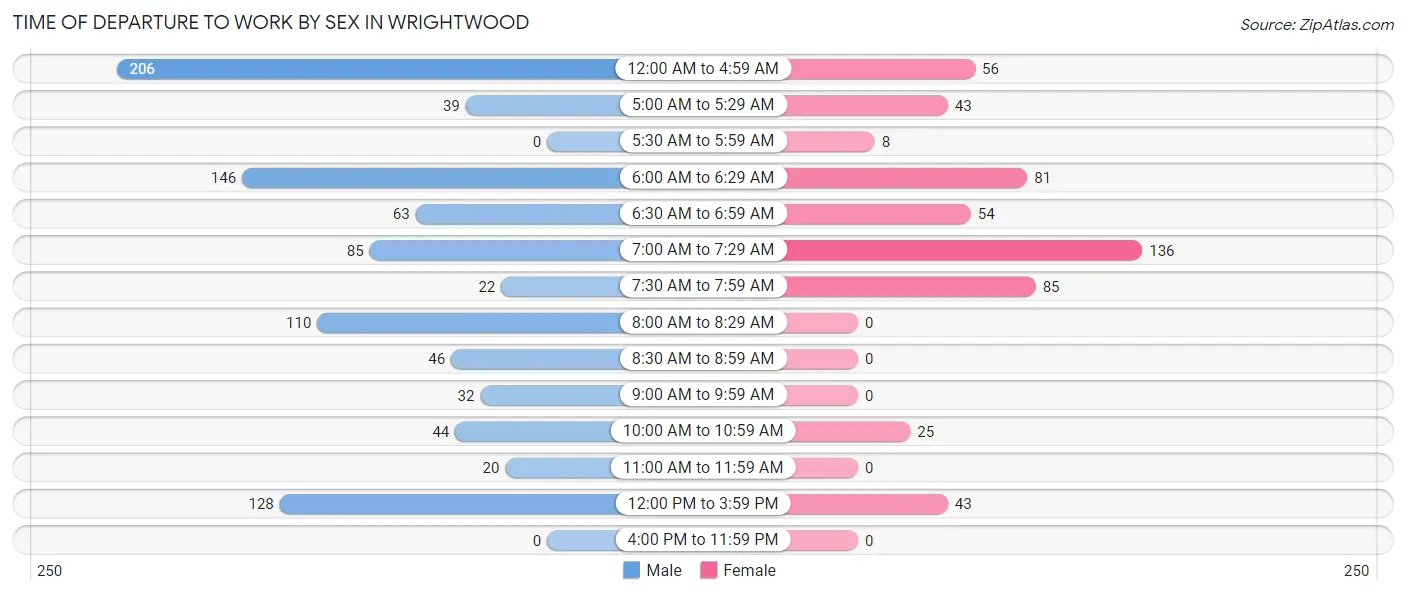
| Time of Departure | Male | Female |
| 12:00 AM to 4:59 AM | 206 (21.9%) | 56 (10.5%) |
| 5:00 AM to 5:29 AM | 39 (4.1%) | 43 (8.1%) |
| 5:30 AM to 5:59 AM | 0 (0.0%) | 8 (1.5%) |
| 6:00 AM to 6:29 AM | 146 (15.5%) | 81 (15.2%) |
| 6:30 AM to 6:59 AM | 63 (6.7%) | 54 (10.2%) |
| 7:00 AM to 7:29 AM | 85 (9.0%) | 136 (25.6%) |
| 7:30 AM to 7:59 AM | 22 (2.3%) | 85 (16.0%) |
| 8:00 AM to 8:29 AM | 110 (11.7%) | 0 (0.0%) |
| 8:30 AM to 8:59 AM | 46 (4.9%) | 0 (0.0%) |
| 9:00 AM to 9:59 AM | 32 (3.4%) | 0 (0.0%) |
| 10:00 AM to 10:59 AM | 44 (4.7%) | 25 (4.7%) |
| 11:00 AM to 11:59 AM | 20 (2.1%) | 0 (0.0%) |
| 12:00 PM to 3:59 PM | 128 (13.6%) | 43 (8.1%) |
| 4:00 PM to 11:59 PM | 0 (0.0%) | 0 (0.0%) |
| Total | 941 (100.0%) | 531 (100.0%) |
Housing Occupancy in Wrightwood
Occupancy by Ownership in Wrightwood
Of the total 2,078 dwellings in Wrightwood, owner-occupied units account for 1,649 (79.4%), while renter-occupied units make up 429 (20.6%).
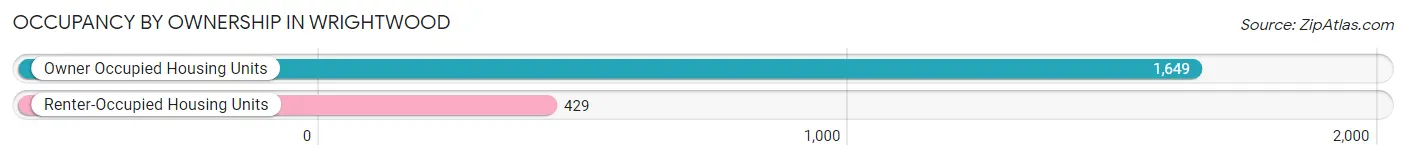
| Occupancy | # Housing Units | % Housing Units |
| Owner Occupied Housing Units | 1,649 | 79.4% |
| Renter-Occupied Housing Units | 429 | 20.6% |
| Total Occupied Housing Units | 2,078 | 100.0% |
Occupancy by Household Size in Wrightwood
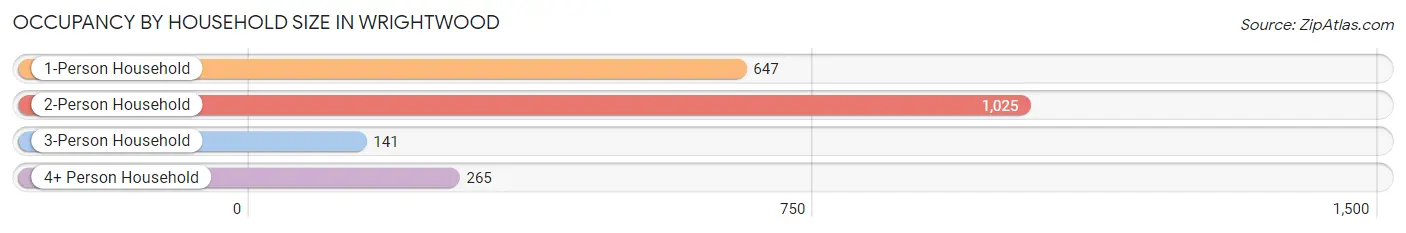
| Household Size | # Housing Units | % Housing Units |
| 1-Person Household | 647 | 31.1% |
| 2-Person Household | 1,025 | 49.3% |
| 3-Person Household | 141 | 6.8% |
| 4+ Person Household | 265 | 12.8% |
| Total Housing Units | 2,078 | 100.0% |
Occupancy by Ownership by Household Size in Wrightwood
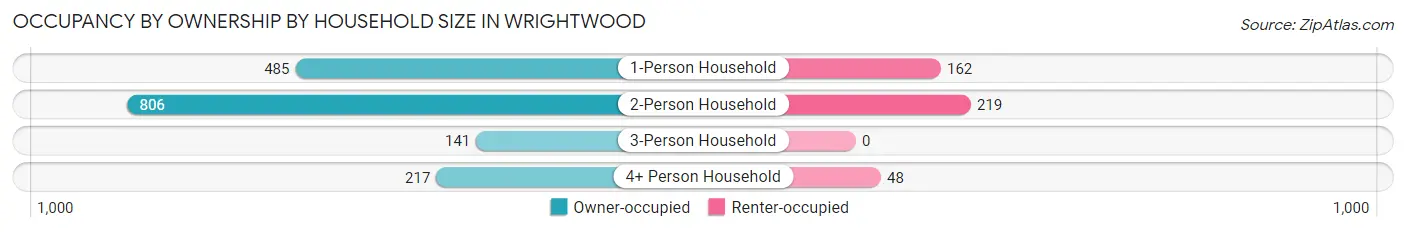
| Household Size | Owner-occupied | Renter-occupied |
| 1-Person Household | 485 (75.0%) | 162 (25.0%) |
| 2-Person Household | 806 (78.6%) | 219 (21.4%) |
| 3-Person Household | 141 (100.0%) | 0 (0.0%) |
| 4+ Person Household | 217 (81.9%) | 48 (18.1%) |
| Total Housing Units | 1,649 (79.4%) | 429 (20.6%) |
Occupancy by Educational Attainment in Wrightwood
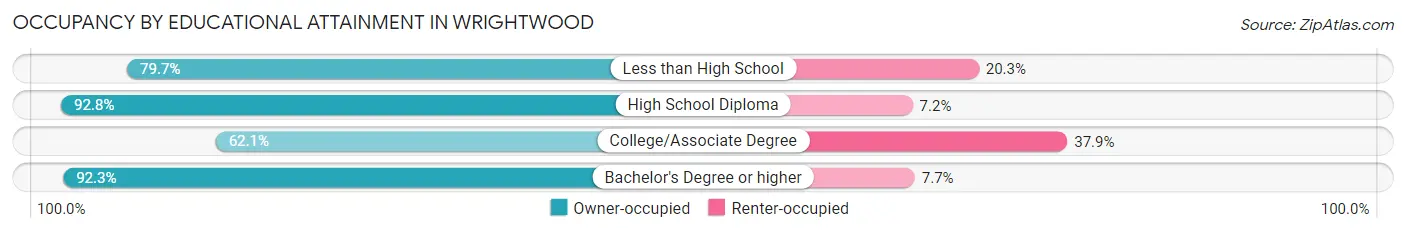
| Household Size | Owner-occupied | Renter-occupied |
| Less than High School | 94 (79.7%) | 24 (20.3%) |
| High School Diploma | 295 (92.8%) | 23 (7.2%) |
| College/Associate Degree | 526 (62.1%) | 321 (37.9%) |
| Bachelor's Degree or higher | 734 (92.3%) | 61 (7.7%) |
Occupancy by Age of Householder in Wrightwood
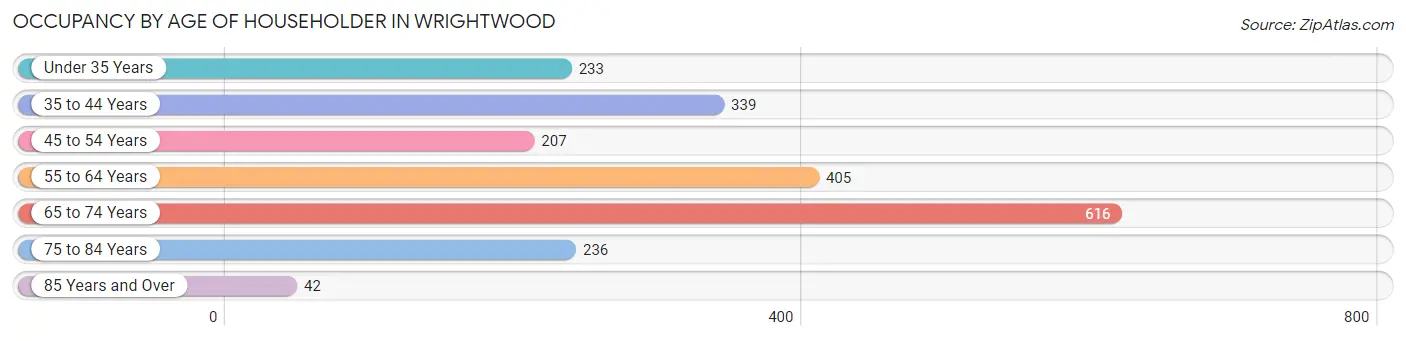
| Age Bracket | # Households | % Households |
| Under 35 Years | 233 | 11.2% |
| 35 to 44 Years | 339 | 16.3% |
| 45 to 54 Years | 207 | 10.0% |
| 55 to 64 Years | 405 | 19.5% |
| 65 to 74 Years | 616 | 29.6% |
| 75 to 84 Years | 236 | 11.4% |
| 85 Years and Over | 42 | 2.0% |
| Total | 2,078 | 100.0% |
Housing Finances in Wrightwood
Median Income by Occupancy in Wrightwood
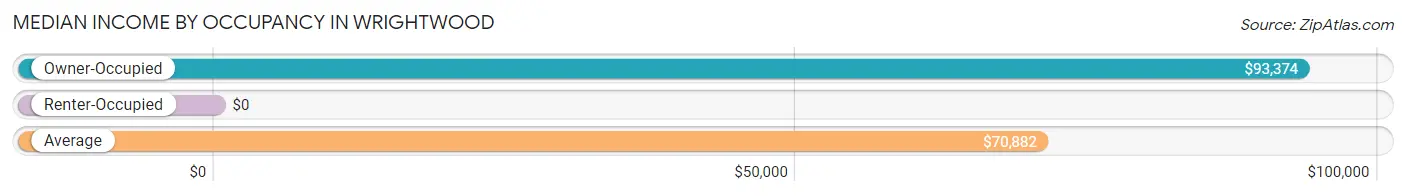
| Occupancy Type | # Households | Median Income |
| Owner-Occupied | 1,649 (79.4%) | $93,374 |
| Renter-Occupied | 429 (20.6%) | $0 |
| Average | 2,078 (100.0%) | $70,882 |
Occupancy by Householder Income Bracket in Wrightwood
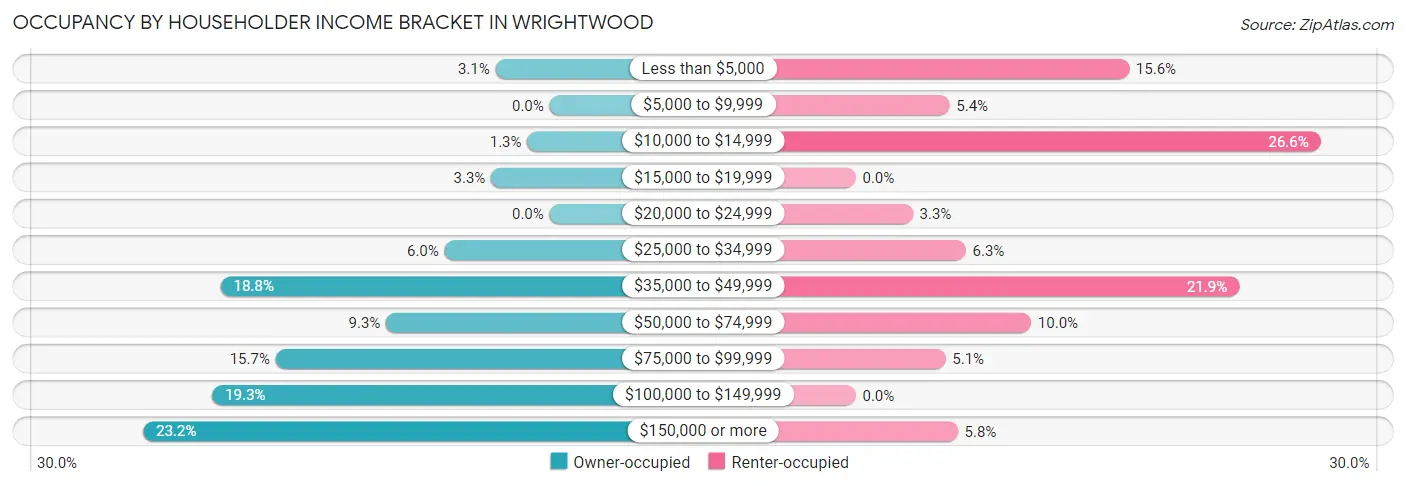
| Income Bracket | Owner-occupied | Renter-occupied |
| Less than $5,000 | 51 (3.1%) | 67 (15.6%) |
| $5,000 to $9,999 | 0 (0.0%) | 23 (5.4%) |
| $10,000 to $14,999 | 21 (1.3%) | 114 (26.6%) |
| $15,000 to $19,999 | 55 (3.3%) | 0 (0.0%) |
| $20,000 to $24,999 | 0 (0.0%) | 14 (3.3%) |
| $25,000 to $34,999 | 99 (6.0%) | 27 (6.3%) |
| $35,000 to $49,999 | 310 (18.8%) | 94 (21.9%) |
| $50,000 to $74,999 | 154 (9.3%) | 43 (10.0%) |
| $75,000 to $99,999 | 258 (15.7%) | 22 (5.1%) |
| $100,000 to $149,999 | 318 (19.3%) | 0 (0.0%) |
| $150,000 or more | 383 (23.2%) | 25 (5.8%) |
| Total | 1,649 (100.0%) | 429 (100.0%) |
Monthly Housing Cost Tiers in Wrightwood
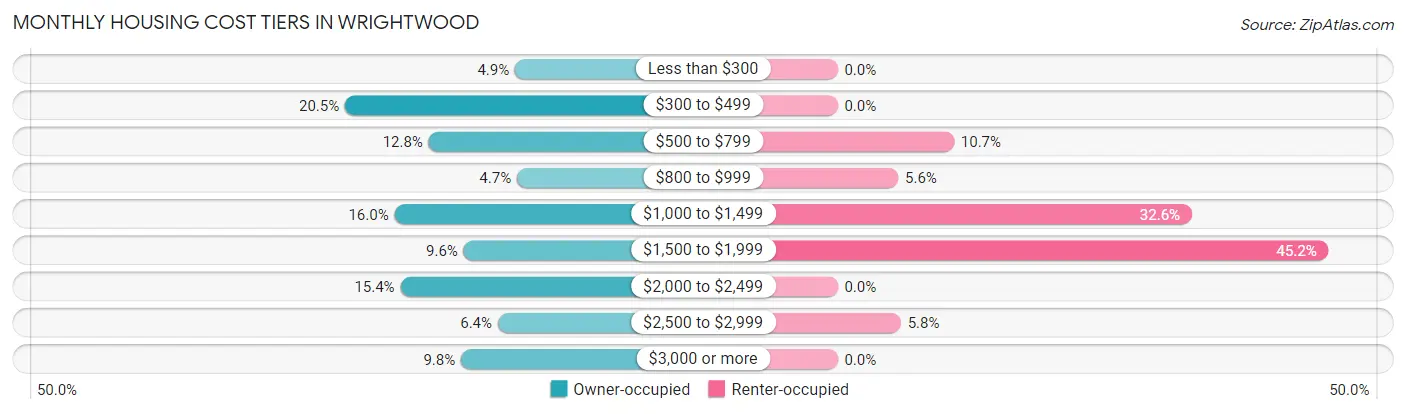
| Monthly Cost | Owner-occupied | Renter-occupied |
| Less than $300 | 80 (4.9%) | 0 (0.0%) |
| $300 to $499 | 338 (20.5%) | 0 (0.0%) |
| $500 to $799 | 211 (12.8%) | 46 (10.7%) |
| $800 to $999 | 77 (4.7%) | 24 (5.6%) |
| $1,000 to $1,499 | 263 (16.0%) | 140 (32.6%) |
| $1,500 to $1,999 | 158 (9.6%) | 194 (45.2%) |
| $2,000 to $2,499 | 254 (15.4%) | 0 (0.0%) |
| $2,500 to $2,999 | 106 (6.4%) | 25 (5.8%) |
| $3,000 or more | 162 (9.8%) | 0 (0.0%) |
| Total | 1,649 (100.0%) | 429 (100.0%) |
Physical Housing Characteristics in Wrightwood
Housing Structures in Wrightwood
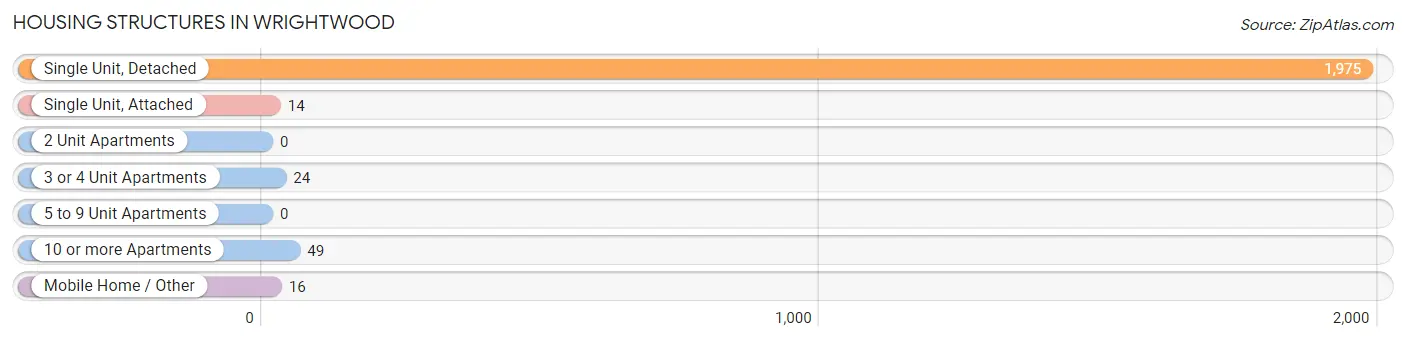
| Structure Type | # Housing Units | % Housing Units |
| Single Unit, Detached | 1,975 | 95.0% |
| Single Unit, Attached | 14 | 0.7% |
| 2 Unit Apartments | 0 | 0.0% |
| 3 or 4 Unit Apartments | 24 | 1.1% |
| 5 to 9 Unit Apartments | 0 | 0.0% |
| 10 or more Apartments | 49 | 2.4% |
| Mobile Home / Other | 16 | 0.8% |
| Total | 2,078 | 100.0% |
Housing Structures by Occupancy in Wrightwood
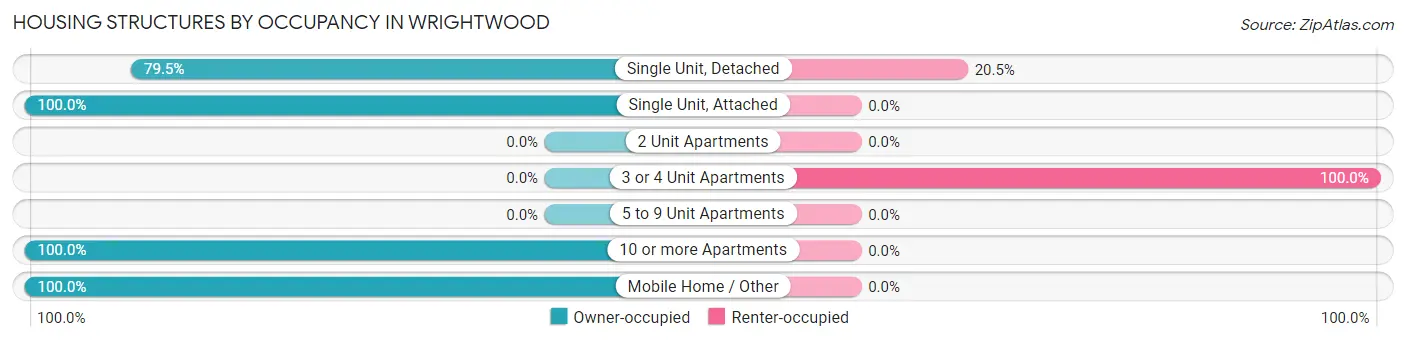
| Structure Type | Owner-occupied | Renter-occupied |
| Single Unit, Detached | 1,570 (79.5%) | 405 (20.5%) |
| Single Unit, Attached | 14 (100.0%) | 0 (0.0%) |
| 2 Unit Apartments | 0 (0.0%) | 0 (0.0%) |
| 3 or 4 Unit Apartments | 0 (0.0%) | 24 (100.0%) |
| 5 to 9 Unit Apartments | 0 (0.0%) | 0 (0.0%) |
| 10 or more Apartments | 49 (100.0%) | 0 (0.0%) |
| Mobile Home / Other | 16 (100.0%) | 0 (0.0%) |
| Total | 1,649 (79.4%) | 429 (20.6%) |
Housing Structures by Number of Rooms in Wrightwood
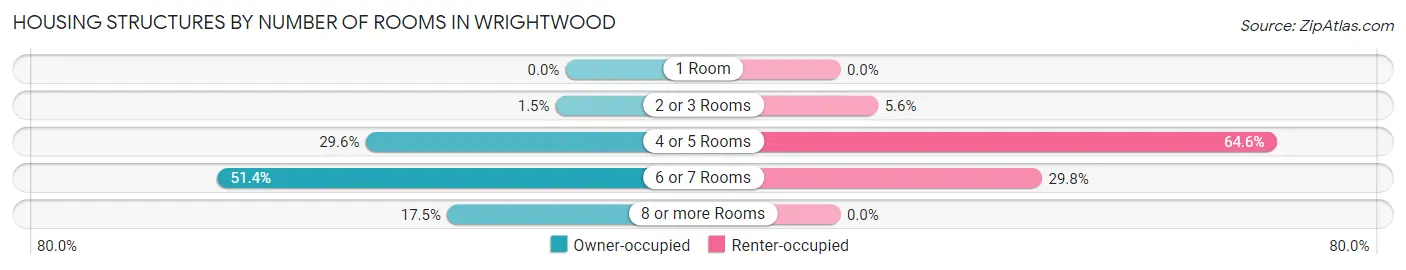
| Number of Rooms | Owner-occupied | Renter-occupied |
| 1 Room | 0 (0.0%) | 0 (0.0%) |
| 2 or 3 Rooms | 24 (1.5%) | 24 (5.6%) |
| 4 or 5 Rooms | 488 (29.6%) | 277 (64.6%) |
| 6 or 7 Rooms | 848 (51.4%) | 128 (29.8%) |
| 8 or more Rooms | 289 (17.5%) | 0 (0.0%) |
| Total | 1,649 (100.0%) | 429 (100.0%) |
Housing Structure by Heating Type in Wrightwood
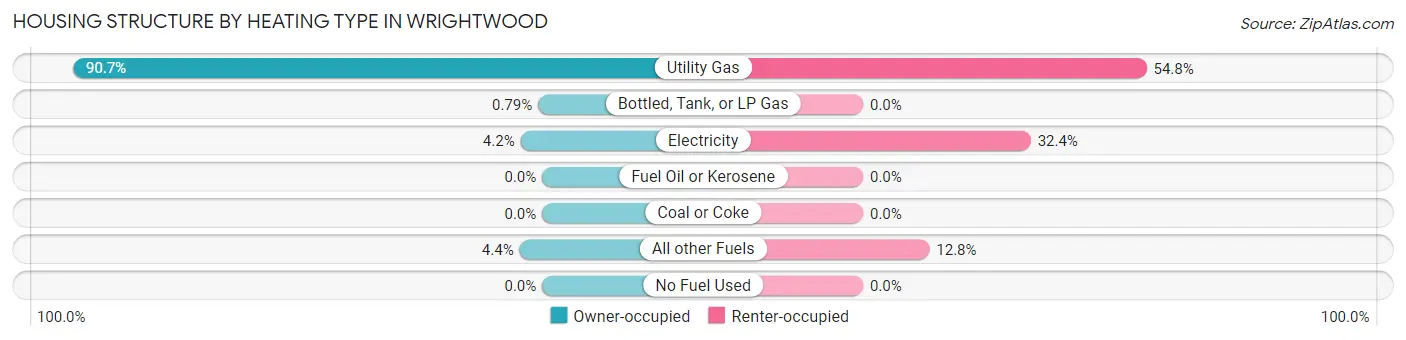
| Heating Type | Owner-occupied | Renter-occupied |
| Utility Gas | 1,495 (90.7%) | 235 (54.8%) |
| Bottled, Tank, or LP Gas | 13 (0.8%) | 0 (0.0%) |
| Electricity | 69 (4.2%) | 139 (32.4%) |
| Fuel Oil or Kerosene | 0 (0.0%) | 0 (0.0%) |
| Coal or Coke | 0 (0.0%) | 0 (0.0%) |
| All other Fuels | 72 (4.4%) | 55 (12.8%) |
| No Fuel Used | 0 (0.0%) | 0 (0.0%) |
| Total | 1,649 (100.0%) | 429 (100.0%) |
Household Vehicle Usage in Wrightwood
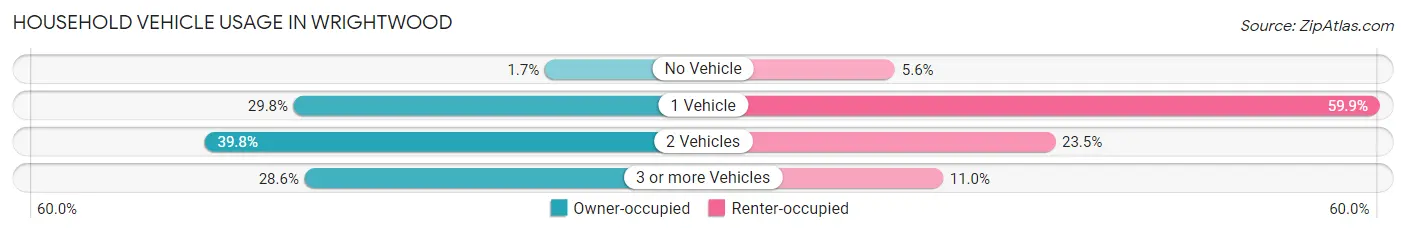
| Vehicles per Household | Owner-occupied | Renter-occupied |
| No Vehicle | 28 (1.7%) | 24 (5.6%) |
| 1 Vehicle | 492 (29.8%) | 257 (59.9%) |
| 2 Vehicles | 657 (39.8%) | 101 (23.5%) |
| 3 or more Vehicles | 472 (28.6%) | 47 (11.0%) |
| Total | 1,649 (100.0%) | 429 (100.0%) |
Real Estate & Mortgages in Wrightwood
Real Estate and Mortgage Overview in Wrightwood
| Characteristic | Without Mortgage | With Mortgage |
| Housing Units | 680 | 969 |
| Median Property Value | $380,000 | $447,600 |
| Median Household Income | $72,151 | $302 |
| Monthly Housing Costs | $477 | $162 |
| Real Estate Taxes | $2,010 | $0 |
Property Value by Mortgage Status in Wrightwood
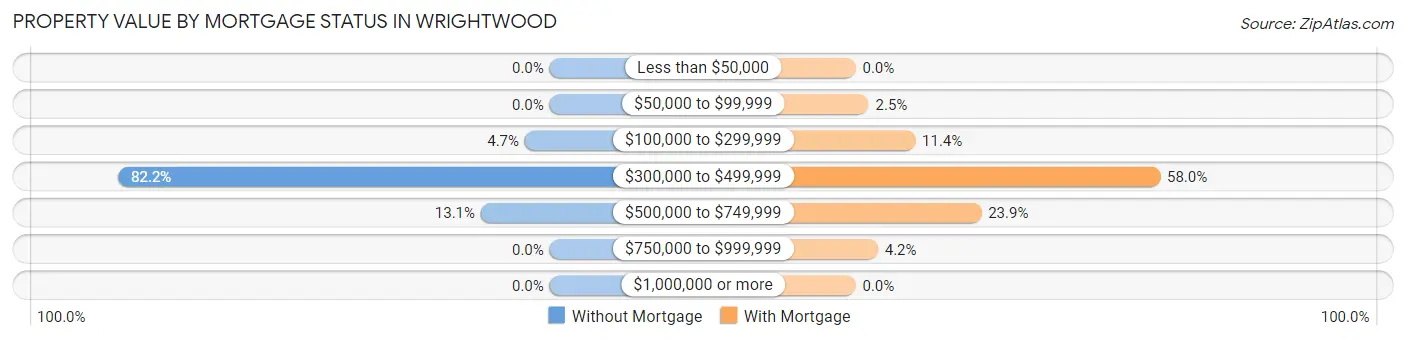
| Property Value | Without Mortgage | With Mortgage |
| Less than $50,000 | 0 (0.0%) | 0 (0.0%) |
| $50,000 to $99,999 | 0 (0.0%) | 24 (2.5%) |
| $100,000 to $299,999 | 32 (4.7%) | 110 (11.4%) |
| $300,000 to $499,999 | 559 (82.2%) | 562 (58.0%) |
| $500,000 to $749,999 | 89 (13.1%) | 232 (23.9%) |
| $750,000 to $999,999 | 0 (0.0%) | 41 (4.2%) |
| $1,000,000 or more | 0 (0.0%) | 0 (0.0%) |
| Total | 680 (100.0%) | 969 (100.0%) |
Household Income by Mortgage Status in Wrightwood
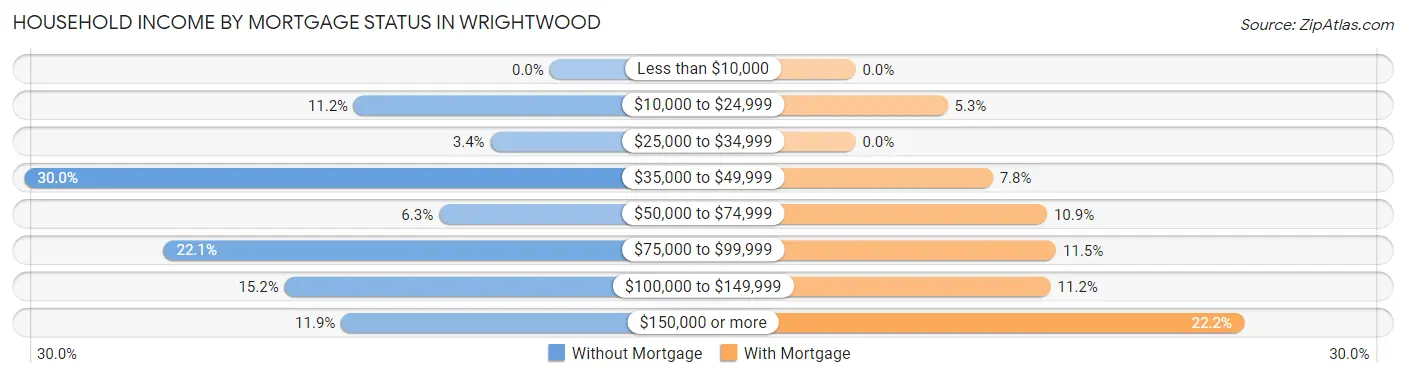
| Household Income | Without Mortgage | With Mortgage |
| Less than $10,000 | 0 (0.0%) | 0 (0.0%) |
| $10,000 to $24,999 | 76 (11.2%) | 51 (5.3%) |
| $25,000 to $34,999 | 23 (3.4%) | 0 (0.0%) |
| $35,000 to $49,999 | 204 (30.0%) | 76 (7.8%) |
| $50,000 to $74,999 | 43 (6.3%) | 106 (10.9%) |
| $75,000 to $99,999 | 150 (22.1%) | 111 (11.5%) |
| $100,000 to $149,999 | 103 (15.1%) | 108 (11.2%) |
| $150,000 or more | 81 (11.9%) | 215 (22.2%) |
| Total | 680 (100.0%) | 969 (100.0%) |
Property Value to Household Income Ratio in Wrightwood
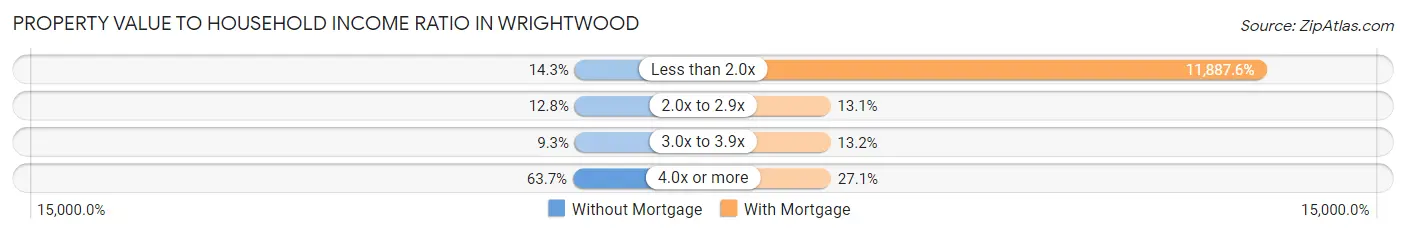
| Value-to-Income Ratio | Without Mortgage | With Mortgage |
| Less than 2.0x | 97 (14.3%) | 115,191 (11,887.6%) |
| 2.0x to 2.9x | 87 (12.8%) | 127 (13.1%) |
| 3.0x to 3.9x | 63 (9.3%) | 128 (13.2%) |
| 4.0x or more | 433 (63.7%) | 263 (27.1%) |
| Total | 680 (100.0%) | 969 (100.0%) |
Real Estate Taxes by Mortgage Status in Wrightwood
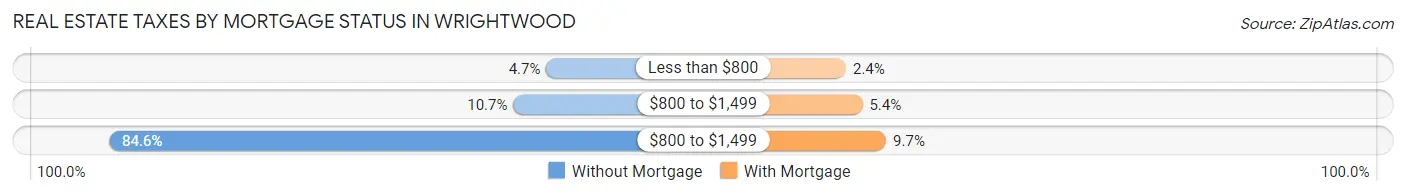
| Property Taxes | Without Mortgage | With Mortgage |
| Less than $800 | 32 (4.7%) | 23 (2.4%) |
| $800 to $1,499 | 73 (10.7%) | 52 (5.4%) |
| $800 to $1,499 | 575 (84.6%) | 94 (9.7%) |
| Total | 680 (100.0%) | 969 (100.0%) |
Health & Disability in Wrightwood
Health Insurance Coverage by Age in Wrightwood
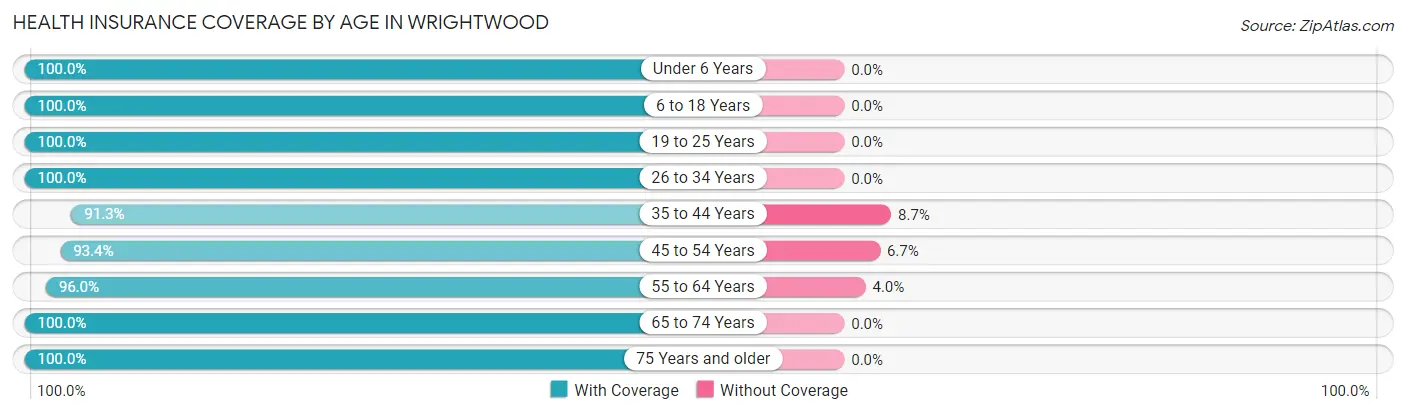
| Age Bracket | With Coverage | Without Coverage |
| Under 6 Years | 354 (100.0%) | 0 (0.0%) |
| 6 to 18 Years | 527 (100.0%) | 0 (0.0%) |
| 19 to 25 Years | 97 (100.0%) | 0 (0.0%) |
| 26 to 34 Years | 475 (100.0%) | 0 (0.0%) |
| 35 to 44 Years | 575 (91.3%) | 55 (8.7%) |
| 45 to 54 Years | 337 (93.3%) | 24 (6.7%) |
| 55 to 64 Years | 679 (96.0%) | 28 (4.0%) |
| 65 to 74 Years | 829 (100.0%) | 0 (0.0%) |
| 75 Years and older | 481 (100.0%) | 0 (0.0%) |
| Total | 4,354 (97.6%) | 107 (2.4%) |
Health Insurance Coverage by Citizenship Status in Wrightwood
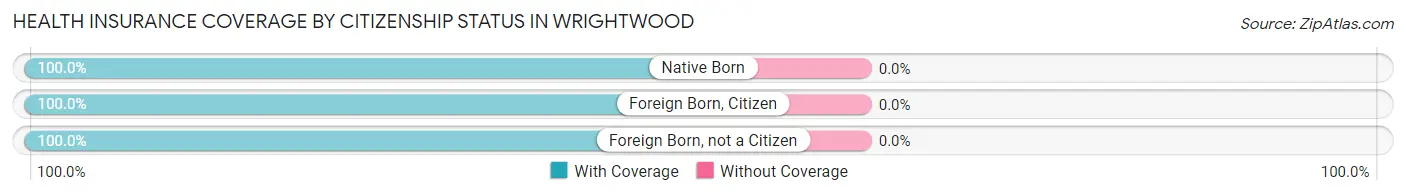
| Citizenship Status | With Coverage | Without Coverage |
| Native Born | 354 (100.0%) | 0 (0.0%) |
| Foreign Born, Citizen | 527 (100.0%) | 0 (0.0%) |
| Foreign Born, not a Citizen | 97 (100.0%) | 0 (0.0%) |
Health Insurance Coverage by Household Income in Wrightwood
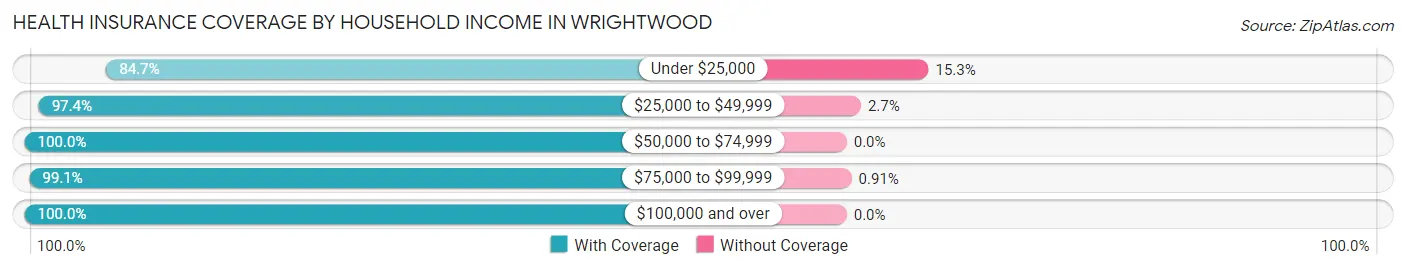
| Household Income | With Coverage | Without Coverage |
| Under $25,000 | 420 (84.7%) | 76 (15.3%) |
| $25,000 to $49,999 | 990 (97.4%) | 27 (2.6%) |
| $50,000 to $74,999 | 374 (100.0%) | 0 (0.0%) |
| $75,000 to $99,999 | 436 (99.1%) | 4 (0.9%) |
| $100,000 and over | 2,134 (100.0%) | 0 (0.0%) |
Public vs Private Health Insurance Coverage by Age in Wrightwood
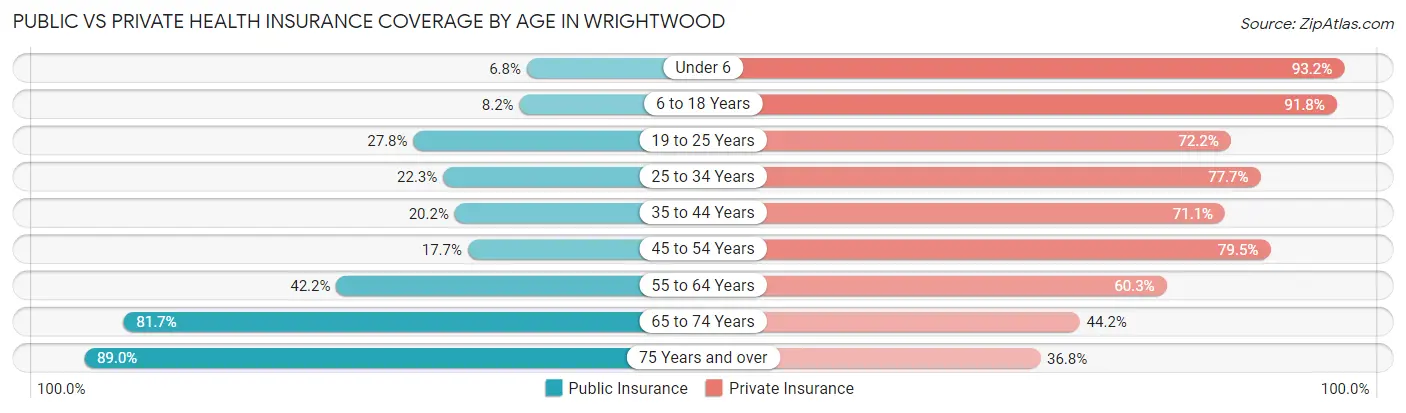
| Age Bracket | Public Insurance | Private Insurance |
| Under 6 | 24 (6.8%) | 330 (93.2%) |
| 6 to 18 Years | 43 (8.2%) | 484 (91.8%) |
| 19 to 25 Years | 27 (27.8%) | 70 (72.2%) |
| 25 to 34 Years | 106 (22.3%) | 369 (77.7%) |
| 35 to 44 Years | 127 (20.2%) | 448 (71.1%) |
| 45 to 54 Years | 64 (17.7%) | 287 (79.5%) |
| 55 to 64 Years | 298 (42.1%) | 426 (60.3%) |
| 65 to 74 Years | 677 (81.7%) | 366 (44.2%) |
| 75 Years and over | 428 (89.0%) | 177 (36.8%) |
| Total | 1,794 (40.2%) | 2,957 (66.3%) |
Disability Status by Sex by Age in Wrightwood
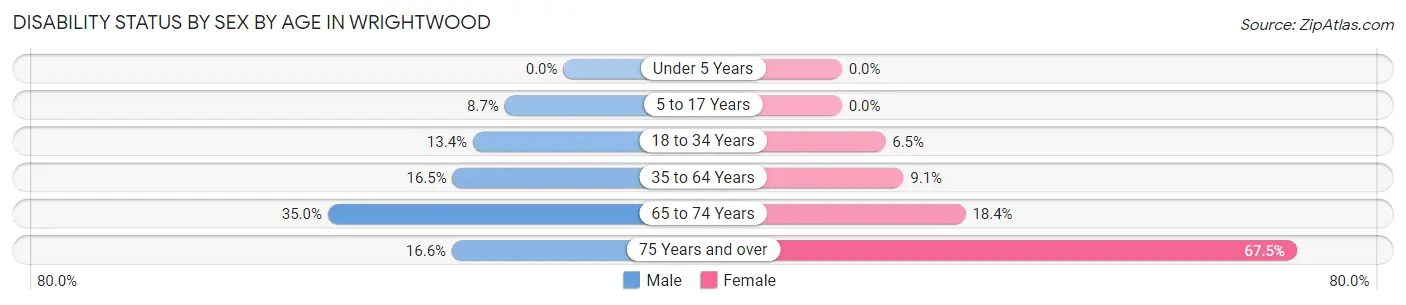
| Age Bracket | Male | Female |
| Under 5 Years | 0 (0.0%) | 0 (0.0%) |
| 5 to 17 Years | 29 (8.7%) | 0 (0.0%) |
| 18 to 34 Years | 29 (13.4%) | 23 (6.5%) |
| 35 to 64 Years | 166 (16.5%) | 63 (9.1%) |
| 65 to 74 Years | 128 (35.0%) | 85 (18.4%) |
| 75 Years and over | 48 (16.6%) | 129 (67.5%) |
Disability Class by Sex by Age in Wrightwood
Disability Class: Hearing Difficulty
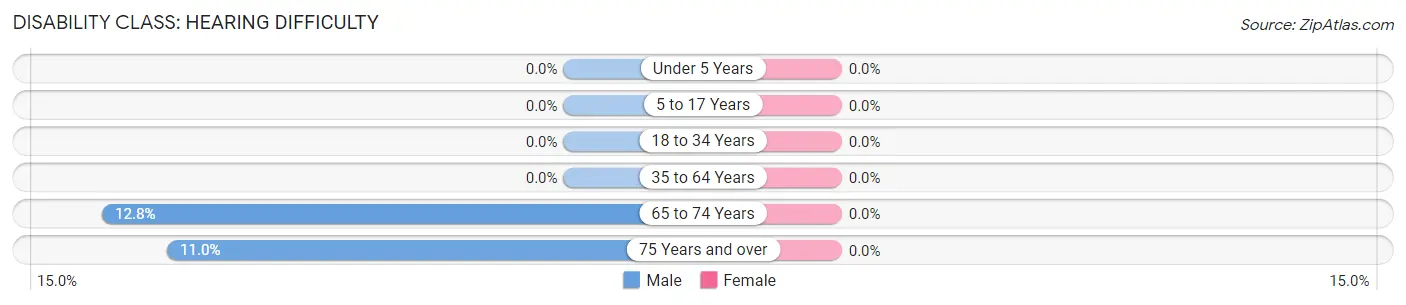
| Age Bracket | Male | Female |
| Under 5 Years | 0 (0.0%) | 0 (0.0%) |
| 5 to 17 Years | 0 (0.0%) | 0 (0.0%) |
| 18 to 34 Years | 0 (0.0%) | 0 (0.0%) |
| 35 to 64 Years | 0 (0.0%) | 0 (0.0%) |
| 65 to 74 Years | 47 (12.8%) | 0 (0.0%) |
| 75 Years and over | 32 (11.0%) | 0 (0.0%) |
Disability Class: Vision Difficulty
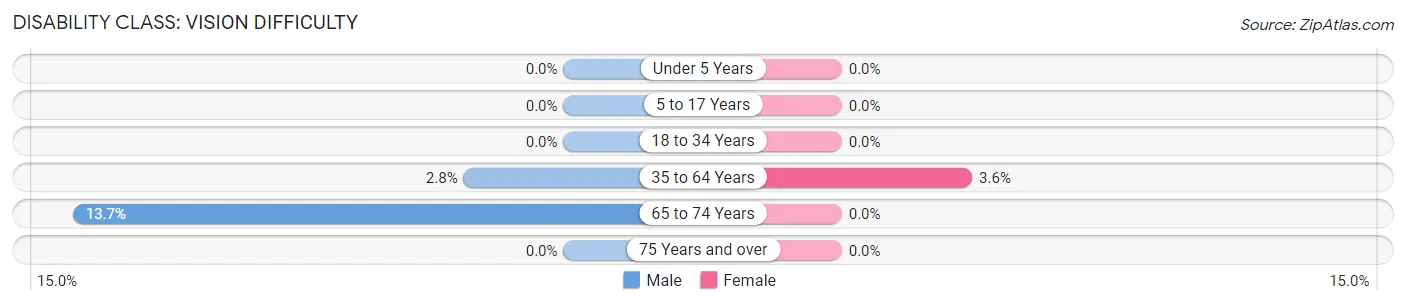
| Age Bracket | Male | Female |
| Under 5 Years | 0 (0.0%) | 0 (0.0%) |
| 5 to 17 Years | 0 (0.0%) | 0 (0.0%) |
| 18 to 34 Years | 0 (0.0%) | 0 (0.0%) |
| 35 to 64 Years | 28 (2.8%) | 25 (3.6%) |
| 65 to 74 Years | 50 (13.7%) | 0 (0.0%) |
| 75 Years and over | 0 (0.0%) | 0 (0.0%) |
Disability Class: Cognitive Difficulty
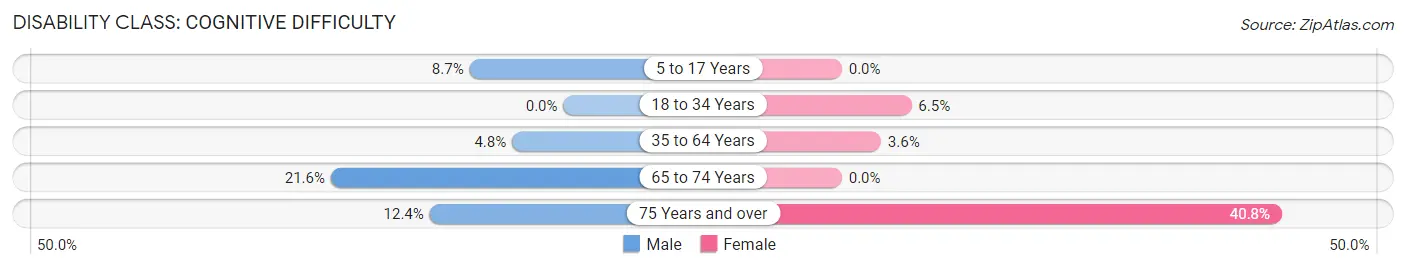
| Age Bracket | Male | Female |
| 5 to 17 Years | 29 (8.7%) | 0 (0.0%) |
| 18 to 34 Years | 0 (0.0%) | 23 (6.5%) |
| 35 to 64 Years | 48 (4.8%) | 25 (3.6%) |
| 65 to 74 Years | 79 (21.6%) | 0 (0.0%) |
| 75 Years and over | 36 (12.4%) | 78 (40.8%) |
Disability Class: Ambulatory Difficulty
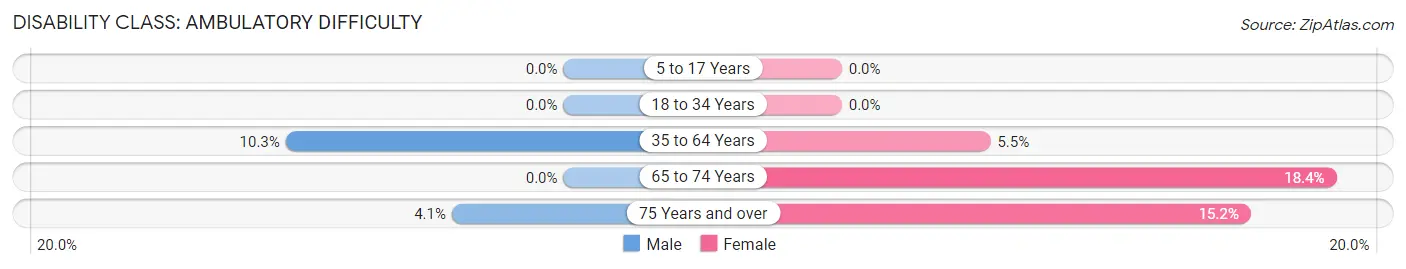
| Age Bracket | Male | Female |
| 5 to 17 Years | 0 (0.0%) | 0 (0.0%) |
| 18 to 34 Years | 0 (0.0%) | 0 (0.0%) |
| 35 to 64 Years | 104 (10.3%) | 38 (5.5%) |
| 65 to 74 Years | 0 (0.0%) | 85 (18.4%) |
| 75 Years and over | 12 (4.1%) | 29 (15.2%) |
Disability Class: Self-Care Difficulty
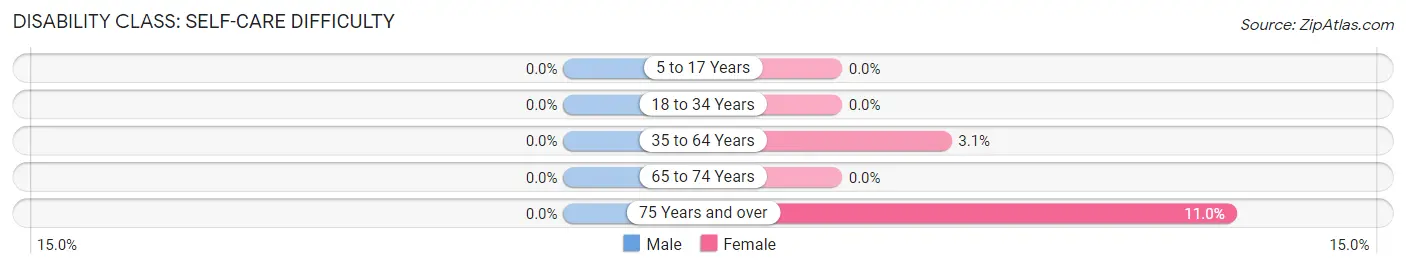
| Age Bracket | Male | Female |
| 5 to 17 Years | 0 (0.0%) | 0 (0.0%) |
| 18 to 34 Years | 0 (0.0%) | 0 (0.0%) |
| 35 to 64 Years | 0 (0.0%) | 21 (3.0%) |
| 65 to 74 Years | 0 (0.0%) | 0 (0.0%) |
| 75 Years and over | 0 (0.0%) | 21 (11.0%) |
Technology Access in Wrightwood
Computing Device Access in Wrightwood
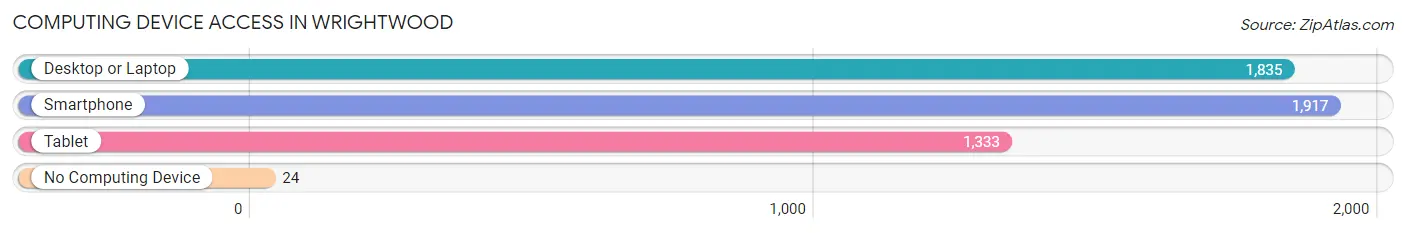
| Device Type | # Households | % Households |
| Desktop or Laptop | 1,835 | 88.3% |
| Smartphone | 1,917 | 92.2% |
| Tablet | 1,333 | 64.1% |
| No Computing Device | 24 | 1.1% |
| Total | 2,078 | 100.0% |
Internet Access in Wrightwood
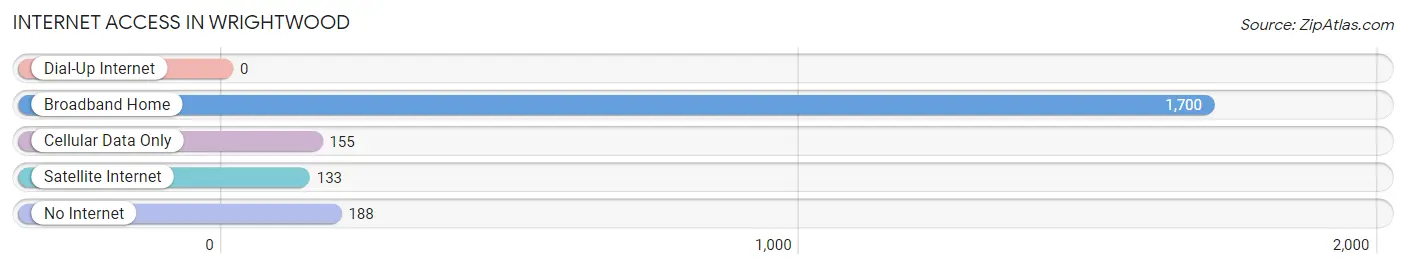
| Internet Type | # Households | % Households |
| Dial-Up Internet | 0 | 0.0% |
| Broadband Home | 1,700 | 81.8% |
| Cellular Data Only | 155 | 7.5% |
| Satellite Internet | 133 | 6.4% |
| No Internet | 188 | 9.0% |
| Total | 2,078 | 100.0% |
Wrightwood Summary
Wrightwood, California is a small mountain community located in the San Gabriel Mountains of Southern California. It is situated in the Angeles National Forest, approximately 85 miles northeast of Los Angeles. The town is located at an elevation of 5,935 feet and is home to a population of approximately 4,500 people.
History
The area that is now Wrightwood was first inhabited by the Serrano Indians, who lived in the area for thousands of years. The first Europeans to settle in the area were the Spanish, who established a mission in the nearby San Gabriel Valley in 1771. The area was later settled by American settlers in the late 1800s, who established a small logging and ranching community.
In the early 1900s, the area began to attract tourists, who were drawn to the area’s scenic beauty and mild climate. The first ski resort in the area, Mountain High, was established in 1924. The resort was a popular destination for skiers and snowboarders, and it helped to put Wrightwood on the map.
In the 1950s, the area began to attract more permanent residents, and the town of Wrightwood was officially incorporated in 1957. The town has since grown to become a popular destination for outdoor enthusiasts, with a variety of activities such as skiing, snowboarding, hiking, camping, and fishing.
Geography
Wrightwood is located in the San Gabriel Mountains of Southern California. The town is situated at an elevation of 5,935 feet, and is surrounded by the Angeles National Forest. The town is located approximately 85 miles northeast of Los Angeles.
The town is situated in a valley surrounded by mountains, and is home to a variety of wildlife, including deer, coyotes, and mountain lions. The area is also home to a variety of plant life, including pine, fir, and cedar trees.
Economy
The economy of Wrightwood is largely based on tourism. The town is home to a variety of outdoor activities, such as skiing, snowboarding, hiking, camping, and fishing. The town is also home to a variety of restaurants, shops, and lodging.
The town is also home to a variety of businesses, including a lumber mill, a sawmill, and a furniture factory. The town is also home to a variety of service businesses, such as auto repair shops, real estate agencies, and insurance agencies.
Demographics
As of the 2010 census, the population of Wrightwood was 4,525. The population is predominantly white (90.2%), with a small percentage of Hispanic (4.3%) and Asian (2.2%) residents. The median household income in the town is $60,000, and the median age is 44.
The town is home to a variety of religious denominations, including Catholic (25.3%), Protestant (19.2%), and Mormon (2.2%). The town is also home to a variety of educational institutions, including a public elementary school, a public middle school, and a public high school.
Common Questions
What is Per Capita Income in Wrightwood?
Per Capita income in Wrightwood is $50,089.
What is the Median Family Income in Wrightwood?
Median Family Income in Wrightwood is $71,642.
What is the Median Household income in Wrightwood?
Median Household Income in Wrightwood is $70,882.
What is Income or Wage Gap in Wrightwood?
Income or Wage Gap in Wrightwood is 56.4%.
Women in Wrightwood earn 43.6 cents for every dollar earned by a man.
What is Inequality or Gini Index in Wrightwood?
Inequality or Gini Index in Wrightwood is 0.51.
What is the Total Population of Wrightwood?
Total Population of Wrightwood is 4,461.
What is the Total Male Population of Wrightwood?
Total Male Population of Wrightwood is 2,394.
What is the Total Female Population of Wrightwood?
Total Female Population of Wrightwood is 2,067.
What is the Ratio of Males per 100 Females in Wrightwood?
There are 115.82 Males per 100 Females in Wrightwood.
What is the Ratio of Females per 100 Males in Wrightwood?
There are 86.34 Females per 100 Males in Wrightwood.
What is the Median Population Age in Wrightwood?
Median Population Age in Wrightwood is 47.6 Years.
What is the Average Family Size in Wrightwood
Average Family Size in Wrightwood is 2.7 People.
What is the Average Household Size in Wrightwood
Average Household Size in Wrightwood is 2.1 People.
How Large is the Labor Force in Wrightwood?
There are 1,987 People in the Labor Forcein in Wrightwood.
What is the Percentage of People in the Labor Force in Wrightwood?
55.2% of People are in the Labor Force in Wrightwood.
What is the Unemployment Rate in Wrightwood?
Unemployment Rate in Wrightwood is 2.4%.