Hartley, CA Map & Demographics
Hartley Map
Hartley Overview
$54,604
PER CAPITA INCOME
$172,900
AVG FAMILY INCOME
$139,904
AVG HOUSEHOLD INCOME
5.5%
WAGE / INCOME GAP [ % ]
94.5¢/ $1
WAGE / INCOME GAP [ $ ]
0.38
INEQUALITY / GINI INDEX
2,807
TOTAL POPULATION
1,621
MALE POPULATION
1,186
FEMALE POPULATION
136.68
MALES / 100 FEMALES
73.16
FEMALES / 100 MALES
48.5
MEDIAN AGE
3.2
AVG FAMILY SIZE
2.8
AVG HOUSEHOLD SIZE
1,266
LABOR FORCE [ PEOPLE ]
55.3%
PERCENT IN LABOR FORCE
1.7%
UNEMPLOYMENT RATE
Income in Hartley
Income Overview in Hartley
Per Capita Income in Hartley is $54,604, while median incomes of families and households are $172,900 and $139,904 respectively.
| Characteristic | Number | Measure |
| Per Capita Income | 2,807 | $54,604 |
| Median Family Income | 724 | $172,900 |
| Mean Family Income | 724 | $180,930 |
| Median Household Income | 1,013 | $139,904 |
| Mean Household Income | 1,013 | $148,793 |
| Income Deficit | 724 | $0 |
| Wage / Income Gap (%) | 2,807 | 5.47% |
| Wage / Income Gap ($) | 2,807 | 94.53¢ per $1 |
| Gini / Inequality Index | 2,807 | 0.38 |
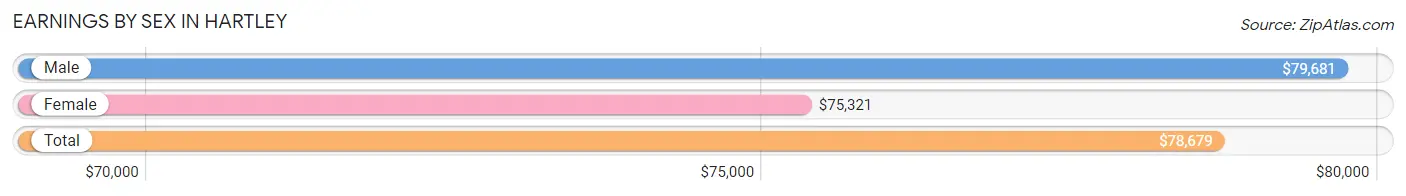
Earnings by Sex in Hartley
Average Earnings in Hartley are $78,679, $79,681 for men and $75,321 for women, a difference of 5.5%.
| Sex | Number | Average Earnings |
| Male | 760 (55.9%) | $79,681 |
| Female | 599 (44.1%) | $75,321 |
| Total | 1,359 (100.0%) | $78,679 |
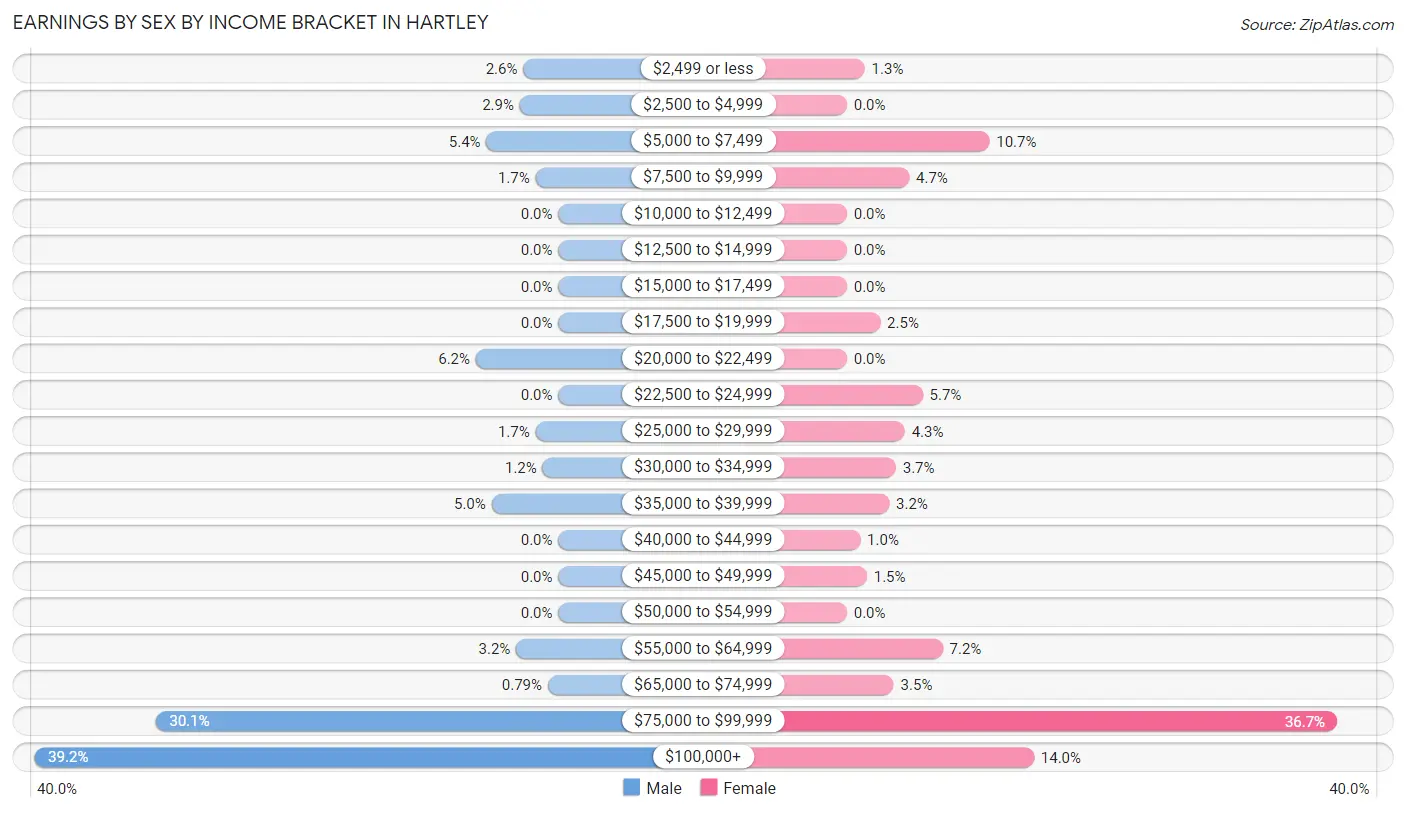
Earnings by Sex by Income Bracket in Hartley
The most common earnings brackets in Hartley are $100,000+ for men (298 | 39.2%) and $75,000 to $99,999 for women (220 | 36.7%).
| Income | Male | Female |
| $2,499 or less | 20 (2.6%) | 8 (1.3%) |
| $2,500 to $4,999 | 22 (2.9%) | 0 (0.0%) |
| $5,000 to $7,499 | 41 (5.4%) | 64 (10.7%) |
| $7,500 to $9,999 | 13 (1.7%) | 28 (4.7%) |
| $10,000 to $12,499 | 0 (0.0%) | 0 (0.0%) |
| $12,500 to $14,999 | 0 (0.0%) | 0 (0.0%) |
| $15,000 to $17,499 | 0 (0.0%) | 0 (0.0%) |
| $17,500 to $19,999 | 0 (0.0%) | 15 (2.5%) |
| $20,000 to $22,499 | 47 (6.2%) | 0 (0.0%) |
| $22,500 to $24,999 | 0 (0.0%) | 34 (5.7%) |
| $25,000 to $29,999 | 13 (1.7%) | 26 (4.3%) |
| $30,000 to $34,999 | 9 (1.2%) | 22 (3.7%) |
| $35,000 to $39,999 | 38 (5.0%) | 19 (3.2%) |
| $40,000 to $44,999 | 0 (0.0%) | 6 (1.0%) |
| $45,000 to $49,999 | 0 (0.0%) | 9 (1.5%) |
| $50,000 to $54,999 | 0 (0.0%) | 0 (0.0%) |
| $55,000 to $64,999 | 24 (3.2%) | 43 (7.2%) |
| $65,000 to $74,999 | 6 (0.8%) | 21 (3.5%) |
| $75,000 to $99,999 | 229 (30.1%) | 220 (36.7%) |
| $100,000+ | 298 (39.2%) | 84 (14.0%) |
| Total | 760 (100.0%) | 599 (100.0%) |
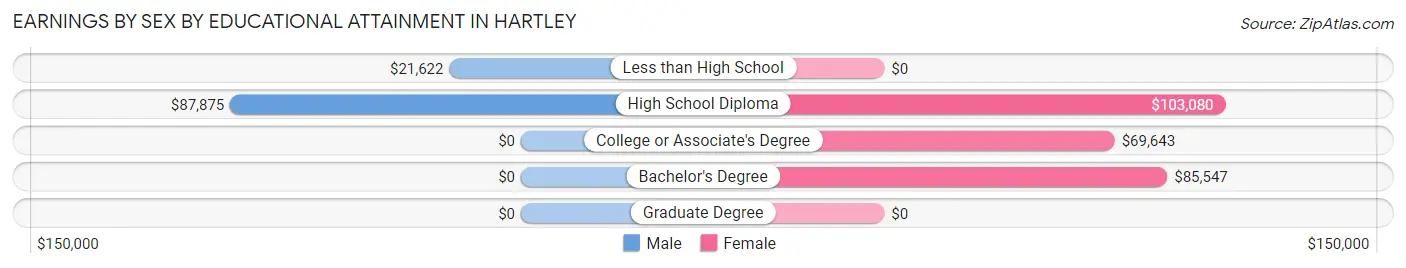
Earnings by Sex by Educational Attainment in Hartley
Average earnings in Hartley are $87,850 for men and $79,830 for women, a difference of 9.1%. Men with an educational attainment of high school diploma enjoy the highest average annual earnings of $87,875, while those with less than high school education earn the least with $21,622. Women with an educational attainment of high school diploma earn the most with the average annual earnings of $103,080, while those with college or associate's degree education have the smallest earnings of $69,643.
| Educational Attainment | Male Income | Female Income |
| Less than High School | $21,622 | $0 |
| High School Diploma | $87,875 | $103,080 |
| College or Associate's Degree | - | - |
| Bachelor's Degree | - | - |
| Graduate Degree | - | - |
| Total | $87,850 | $79,830 |
Family Income in Hartley
Family Income Brackets in Hartley
According to the Hartley family income data, there are 301 families falling into the $200,000+ income range, which is the most common income bracket and makes up 41.6% of all families.
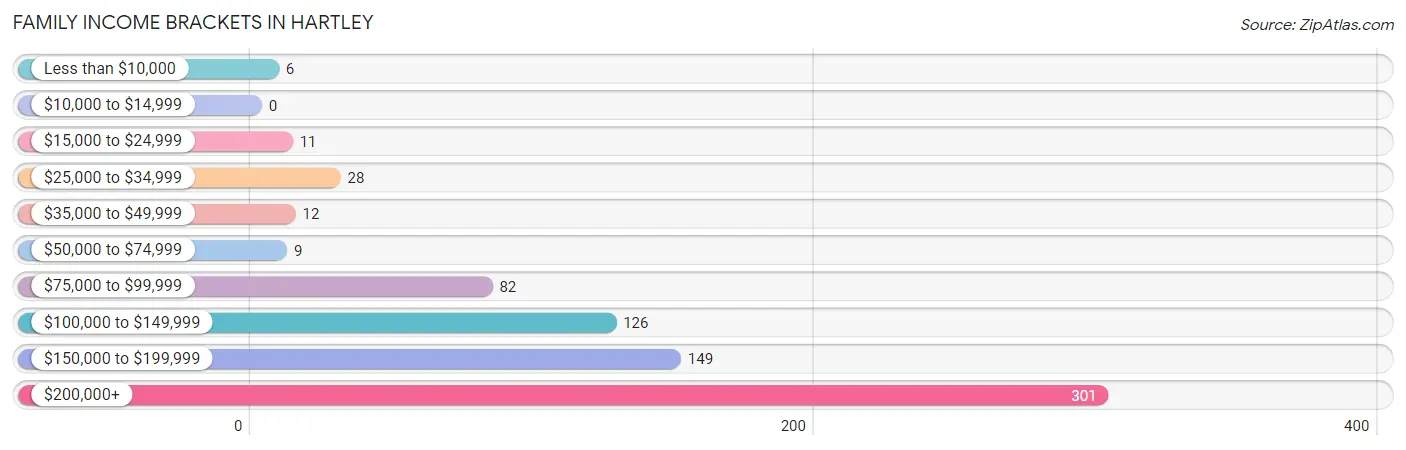
| Income Bracket | # Families | % Families |
| Less than $10,000 | 6 | 0.8% |
| $10,000 to $14,999 | 0 | 0.0% |
| $15,000 to $24,999 | 11 | 1.5% |
| $25,000 to $34,999 | 28 | 3.9% |
| $35,000 to $49,999 | 12 | 1.7% |
| $50,000 to $74,999 | 9 | 1.2% |
| $75,000 to $99,999 | 82 | 11.3% |
| $100,000 to $149,999 | 126 | 17.4% |
| $150,000 to $199,999 | 149 | 20.6% |
| $200,000+ | 301 | 41.6% |
Family Income by Famaliy Size in Hartley
5-person families (122 | 16.9%) account for the highest median family income in Hartley with $220,000 per family, while 3-person families (146 | 20.2%) have the highest median income of $66,970 per family member.
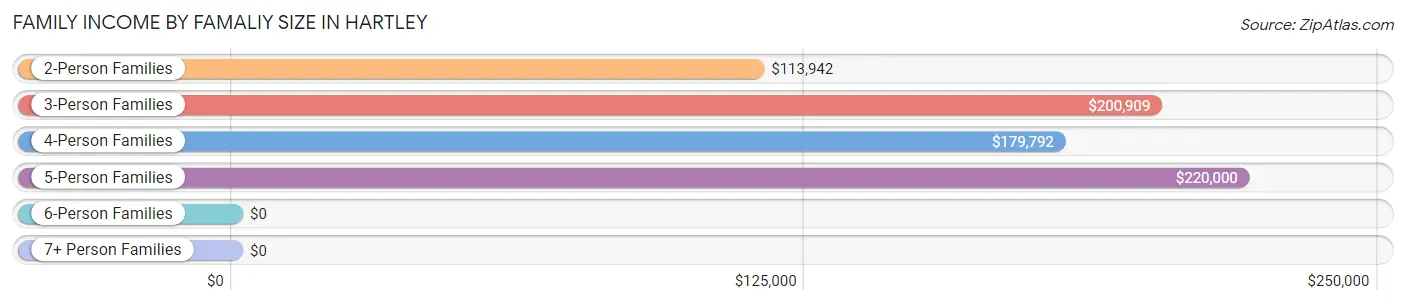
| Income Bracket | # Families | Median Income |
| 2-Person Families | 353 (48.8%) | $113,942 |
| 3-Person Families | 146 (20.2%) | $200,909 |
| 4-Person Families | 75 (10.4%) | $179,792 |
| 5-Person Families | 122 (16.9%) | $220,000 |
| 6-Person Families | 28 (3.9%) | $0 |
| 7+ Person Families | 0 (0.0%) | $0 |
| Total | 724 (100.0%) | $172,900 |
Family Income by Number of Earners in Hartley
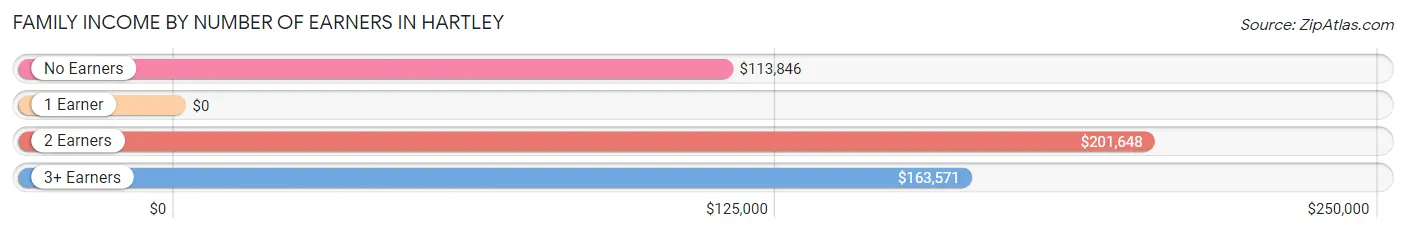
| Number of Earners | # Families | Median Income |
| No Earners | 132 (18.2%) | $113,846 |
| 1 Earner | 201 (27.8%) | $0 |
| 2 Earners | 325 (44.9%) | $201,648 |
| 3+ Earners | 66 (9.1%) | $163,571 |
| Total | 724 (100.0%) | $172,900 |
Household Income in Hartley
Household Income Brackets in Hartley
With 301 households falling in the category, the $200,000+ income range is the most frequent in Hartley, accounting for 29.7% of all households. In contrast, only 9 households (0.9%) fall into the $50,000 to $74,999 income bracket, making it the least populous group.
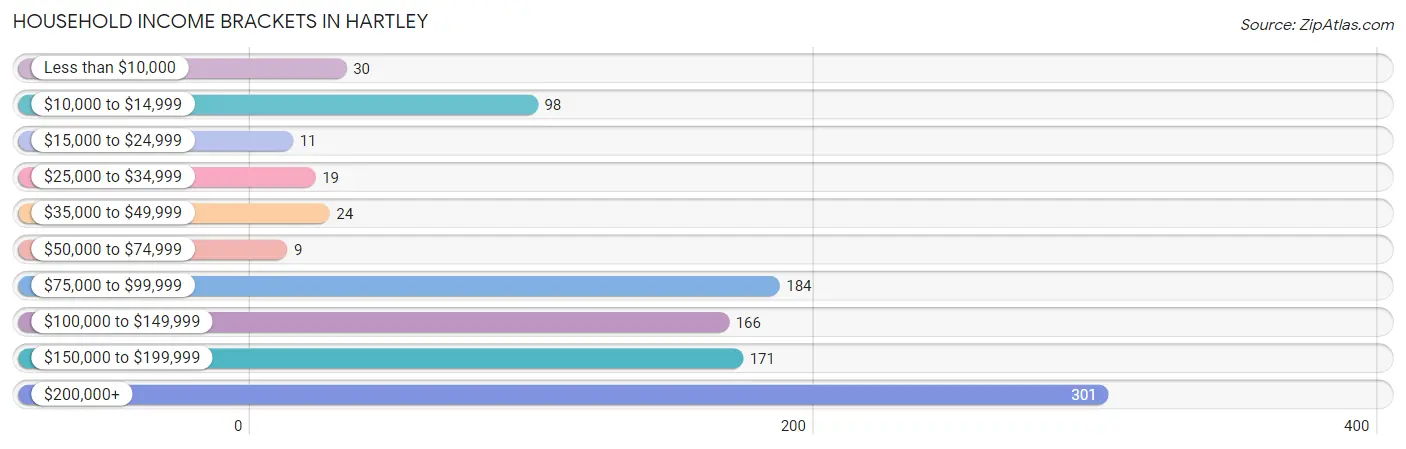
| Income Bracket | # Households | % Households |
| Less than $10,000 | 30 | 3.0% |
| $10,000 to $14,999 | 98 | 9.7% |
| $15,000 to $24,999 | 11 | 1.1% |
| $25,000 to $34,999 | 19 | 1.9% |
| $35,000 to $49,999 | 24 | 2.4% |
| $50,000 to $74,999 | 9 | 0.9% |
| $75,000 to $99,999 | 184 | 18.2% |
| $100,000 to $149,999 | 166 | 16.4% |
| $150,000 to $199,999 | 171 | 16.9% |
| $200,000+ | 301 | 29.7% |
Household Income by Householder Age in Hartley
The median household income in Hartley is $139,904, with the highest median household income of $174,200 found in the 25 to 44 years age bracket for the primary householder. A total of 198 households (19.6%) fall into this category.
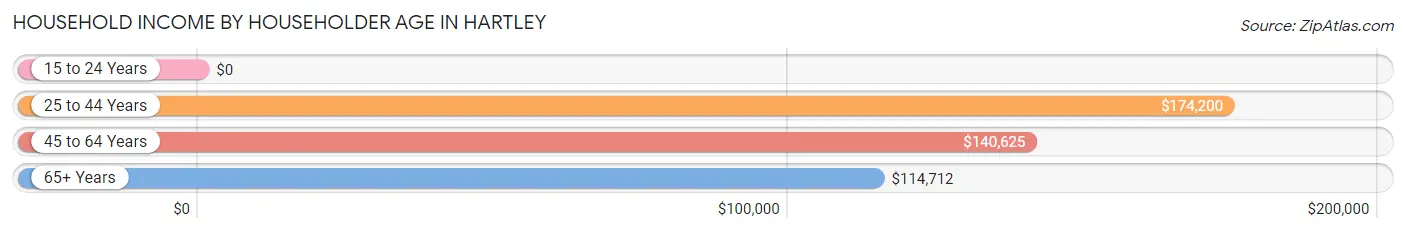
| Income Bracket | # Households | Median Income |
| 15 to 24 Years | 0 (0.0%) | $0 |
| 25 to 44 Years | 198 (19.6%) | $174,200 |
| 45 to 64 Years | 566 (55.9%) | $140,625 |
| 65+ Years | 249 (24.6%) | $114,712 |
| Total | 1,013 (100.0%) | $139,904 |
Poverty in Hartley
Income Below Poverty by Sex and Age in Hartley
With 10.5% poverty level for males and 0.9% for females among the residents of Hartley, 18 to 24 year old males and 75 year old and over females are the most vulnerable to poverty, with 28 males (41.2%) and 10 females (7.5%) in their respective age groups living below the poverty level.
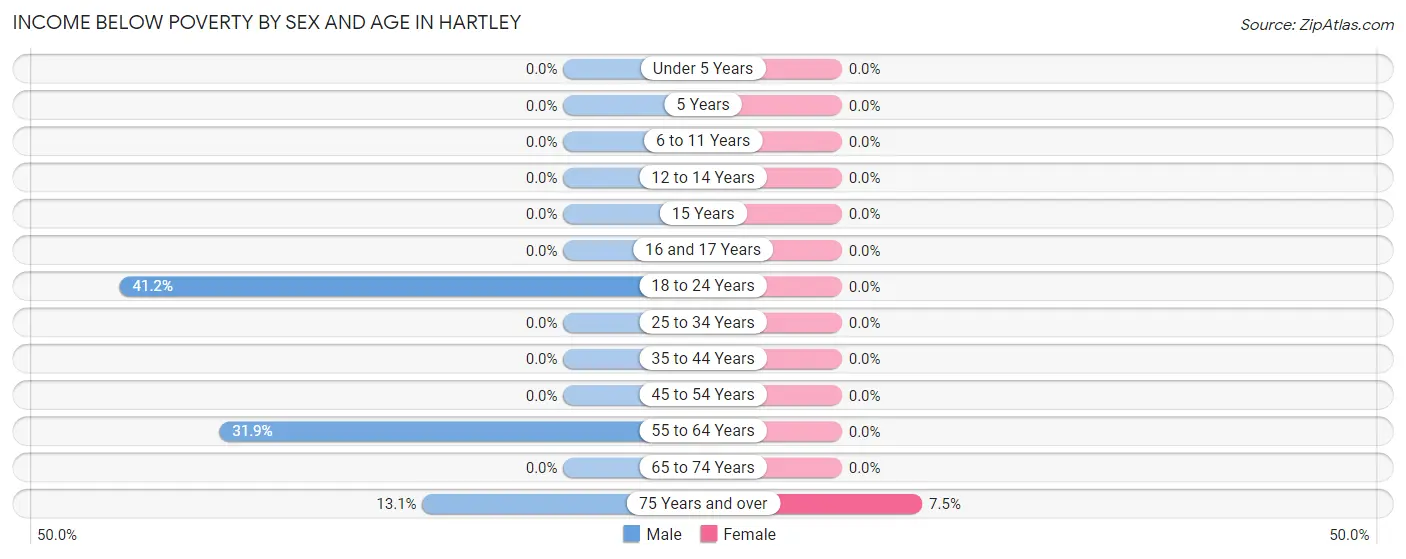
| Age Bracket | Male | Female |
| Under 5 Years | 0 (0.0%) | 0 (0.0%) |
| 5 Years | 0 (0.0%) | 0 (0.0%) |
| 6 to 11 Years | 0 (0.0%) | 0 (0.0%) |
| 12 to 14 Years | 0 (0.0%) | 0 (0.0%) |
| 15 Years | 0 (0.0%) | 0 (0.0%) |
| 16 and 17 Years | 0 (0.0%) | 0 (0.0%) |
| 18 to 24 Years | 28 (41.2%) | 0 (0.0%) |
| 25 to 34 Years | 0 (0.0%) | 0 (0.0%) |
| 35 to 44 Years | 0 (0.0%) | 0 (0.0%) |
| 45 to 54 Years | 0 (0.0%) | 0 (0.0%) |
| 55 to 64 Years | 128 (31.9%) | 0 (0.0%) |
| 65 to 74 Years | 0 (0.0%) | 0 (0.0%) |
| 75 Years and over | 14 (13.1%) | 10 (7.5%) |
| Total | 170 (10.5%) | 10 (0.9%) |
Income Above Poverty by Sex and Age in Hartley
According to the poverty statistics in Hartley, males aged under 5 years and females aged under 5 years are the age groups that are most secure financially, with 100.0% of males and 100.0% of females in these age groups living above the poverty line.
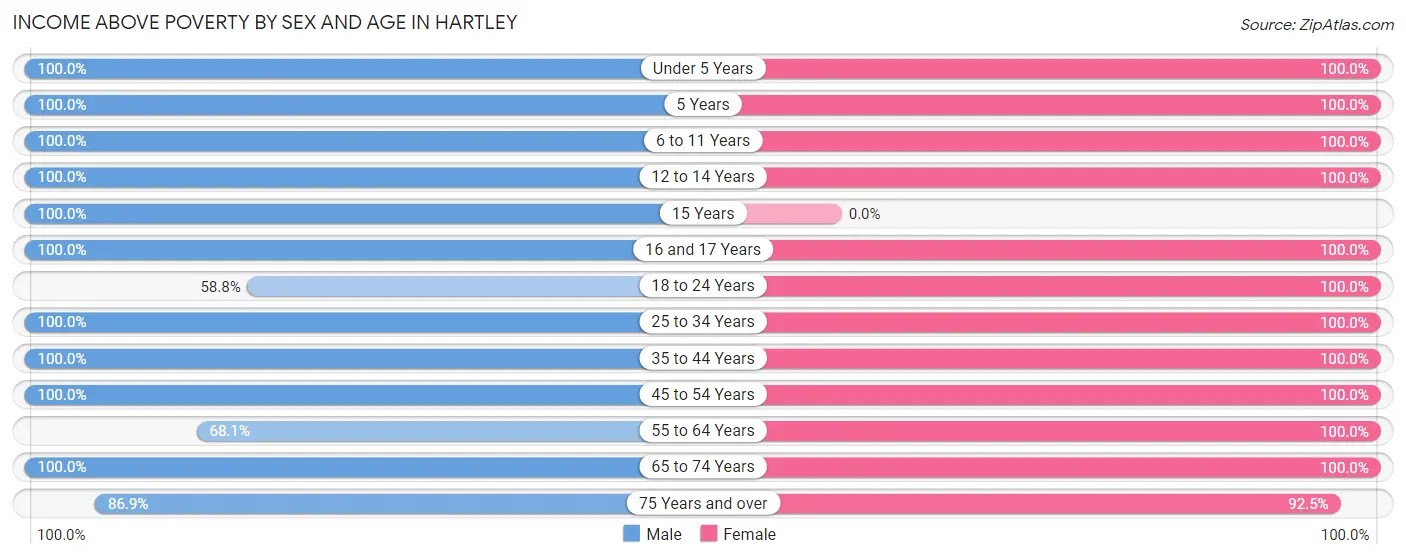
| Age Bracket | Male | Female |
| Under 5 Years | 109 (100.0%) | 43 (100.0%) |
| 5 Years | 28 (100.0%) | 6 (100.0%) |
| 6 to 11 Years | 139 (100.0%) | 56 (100.0%) |
| 12 to 14 Years | 41 (100.0%) | 36 (100.0%) |
| 15 Years | 20 (100.0%) | 0 (0.0%) |
| 16 and 17 Years | 15 (100.0%) | 27 (100.0%) |
| 18 to 24 Years | 40 (58.8%) | 119 (100.0%) |
| 25 to 34 Years | 202 (100.0%) | 143 (100.0%) |
| 35 to 44 Years | 84 (100.0%) | 116 (100.0%) |
| 45 to 54 Years | 230 (100.0%) | 173 (100.0%) |
| 55 to 64 Years | 273 (68.1%) | 134 (100.0%) |
| 65 to 74 Years | 175 (100.0%) | 159 (100.0%) |
| 75 Years and over | 93 (86.9%) | 124 (92.5%) |
| Total | 1,449 (89.5%) | 1,136 (99.1%) |
Income Below Poverty Among Married-Couple Families in Hartley
The poverty statistics for married-couple families in Hartley show that 0.9% or 6 of the total 650 families live below the poverty line. Families with no children have the highest poverty rate of 1.6%, comprising of 6 families. On the other hand, families with 1 or 2 children have the lowest poverty rate of 0.0%, which includes 0 families.
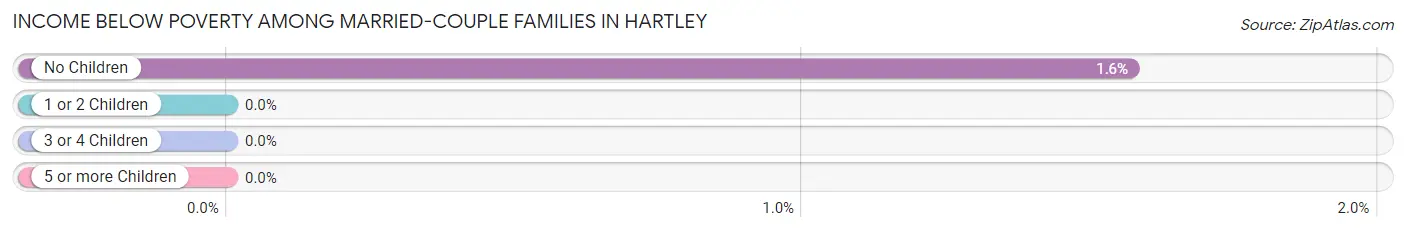
| Children | Above Poverty | Below Poverty |
| No Children | 377 (98.4%) | 6 (1.6%) |
| 1 or 2 Children | 202 (100.0%) | 0 (0.0%) |
| 3 or 4 Children | 65 (100.0%) | 0 (0.0%) |
| 5 or more Children | 0 (0.0%) | 0 (0.0%) |
| Total | 644 (99.1%) | 6 (0.9%) |
Income Below Poverty Among Single-Parent Households in Hartley
| Children | Single Father | Single Mother |
| No Children | 0 (0.0%) | 0 (0.0%) |
| 1 or 2 Children | 0 (0.0%) | 0 (0.0%) |
| 3 or 4 Children | 0 (0.0%) | 0 (0.0%) |
| 5 or more Children | 0 (0.0%) | 0 (0.0%) |
| Total | 0 (0.0%) | 0 (0.0%) |
Income Below Poverty Among Married-Couple vs Single-Parent Households in Hartley
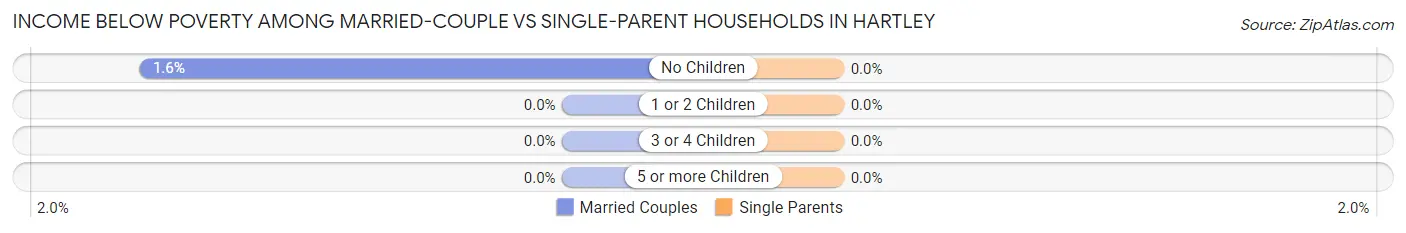
| Children | Married-Couple Families | Single-Parent Households |
| No Children | 6 (1.6%) | 0 (0.0%) |
| 1 or 2 Children | 0 (0.0%) | 0 (0.0%) |
| 3 or 4 Children | 0 (0.0%) | 0 (0.0%) |
| 5 or more Children | 0 (0.0%) | 0 (0.0%) |
| Total | 6 (0.9%) | 0 (0.0%) |
Race in Hartley
The most populous races in Hartley are White / Caucasian (2,201 | 78.4%), Hispanic or Latino (528 | 18.8%), and Two or more Races (299 | 10.6%).
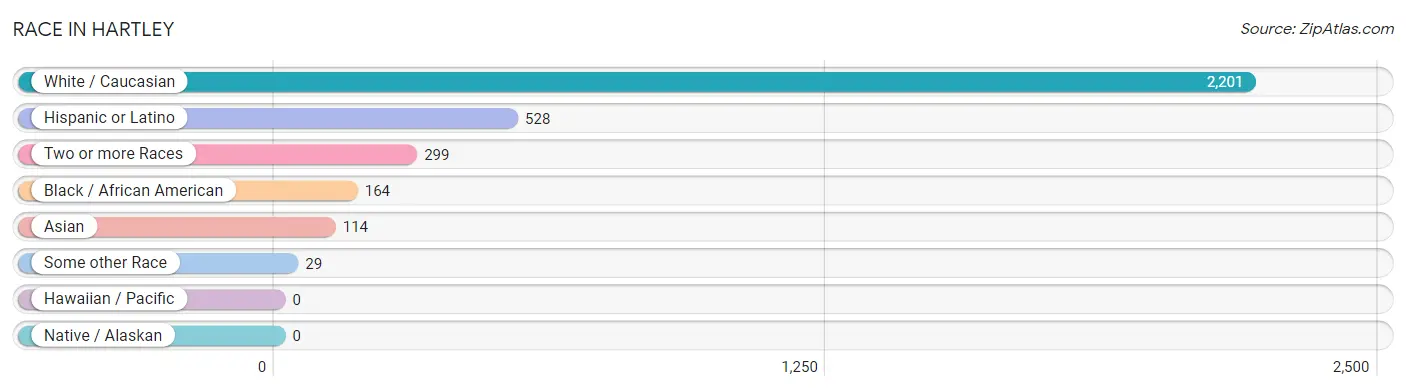
| Race | # Population | % Population |
| Asian | 114 | 4.1% |
| Black / African American | 164 | 5.8% |
| Hawaiian / Pacific | 0 | 0.0% |
| Hispanic or Latino | 528 | 18.8% |
| Native / Alaskan | 0 | 0.0% |
| White / Caucasian | 2,201 | 78.4% |
| Two or more Races | 299 | 10.6% |
| Some other Race | 29 | 1.0% |
| Total | 2,807 | 100.0% |
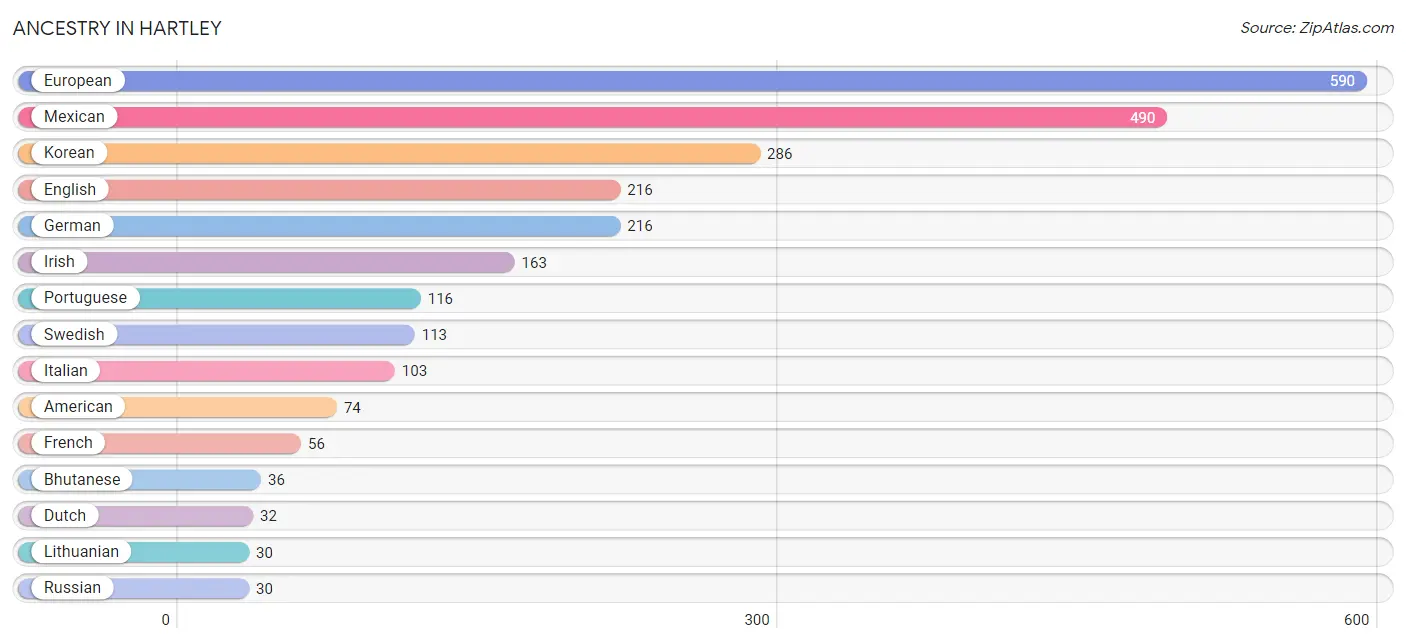
Ancestry in Hartley
The most populous ancestries reported in Hartley are European (590 | 21.0%), Mexican (490 | 17.5%), Korean (286 | 10.2%), English (216 | 7.7%), and German (216 | 7.7%), together accounting for 64.1% of all Hartley residents.
| Ancestry | # Population | % Population |
| American | 74 | 2.6% |
| Austrian | 8 | 0.3% |
| Bhutanese | 36 | 1.3% |
| Cherokee | 24 | 0.9% |
| Dutch | 32 | 1.1% |
| English | 216 | 7.7% |
| European | 590 | 21.0% |
| French | 56 | 2.0% |
| French Canadian | 9 | 0.3% |
| German | 216 | 7.7% |
| Irish | 163 | 5.8% |
| Italian | 103 | 3.7% |
| Korean | 286 | 10.2% |
| Lithuanian | 30 | 1.1% |
| Mexican | 490 | 17.5% |
| Northern European | 14 | 0.5% |
| Norwegian | 17 | 0.6% |
| Polish | 3 | 0.1% |
| Portuguese | 116 | 4.1% |
| Russian | 30 | 1.1% |
| Scandinavian | 14 | 0.5% |
| Serbian | 11 | 0.4% |
| Spaniard | 26 | 0.9% |
| Spanish | 12 | 0.4% |
| Swedish | 113 | 4.0% |
| Swiss | 14 | 0.5% |
| Yugoslavian | 18 | 0.6% | View All 27 Rows |
Immigrants in Hartley
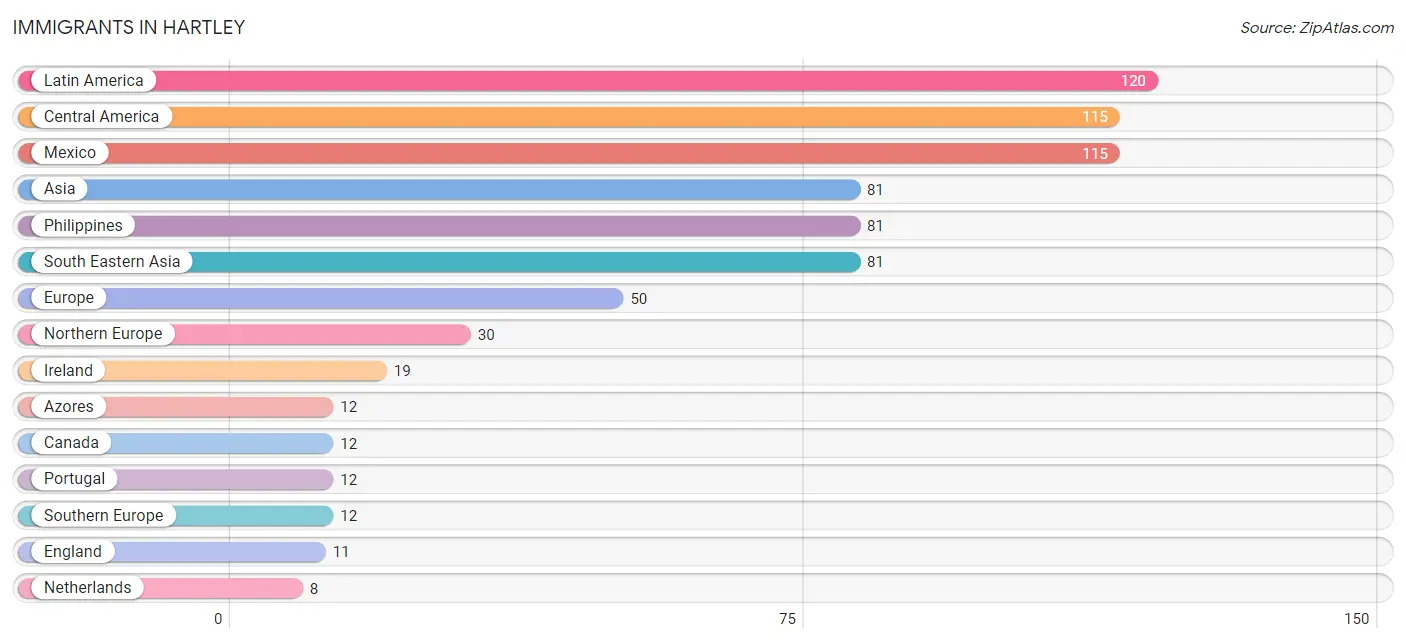
The most numerous immigrant groups reported in Hartley came from Latin America (120 | 4.3%), Central America (115 | 4.1%), Mexico (115 | 4.1%), Asia (81 | 2.9%), and Philippines (81 | 2.9%), together accounting for 18.3% of all Hartley residents.
| Immigration Origin | # Population | % Population |
| Argentina | 5 | 0.2% |
| Asia | 81 | 2.9% |
| Azores | 12 | 0.4% |
| Canada | 12 | 0.4% |
| Central America | 115 | 4.1% |
| England | 11 | 0.4% |
| Europe | 50 | 1.8% |
| Ireland | 19 | 0.7% |
| Latin America | 120 | 4.3% |
| Mexico | 115 | 4.1% |
| Netherlands | 8 | 0.3% |
| Northern Europe | 30 | 1.1% |
| Philippines | 81 | 2.9% |
| Portugal | 12 | 0.4% |
| South America | 5 | 0.2% |
| South Eastern Asia | 81 | 2.9% |
| Southern Europe | 12 | 0.4% |
| Western Europe | 8 | 0.3% | View All 18 Rows |
Sex and Age in Hartley
Sex and Age in Hartley
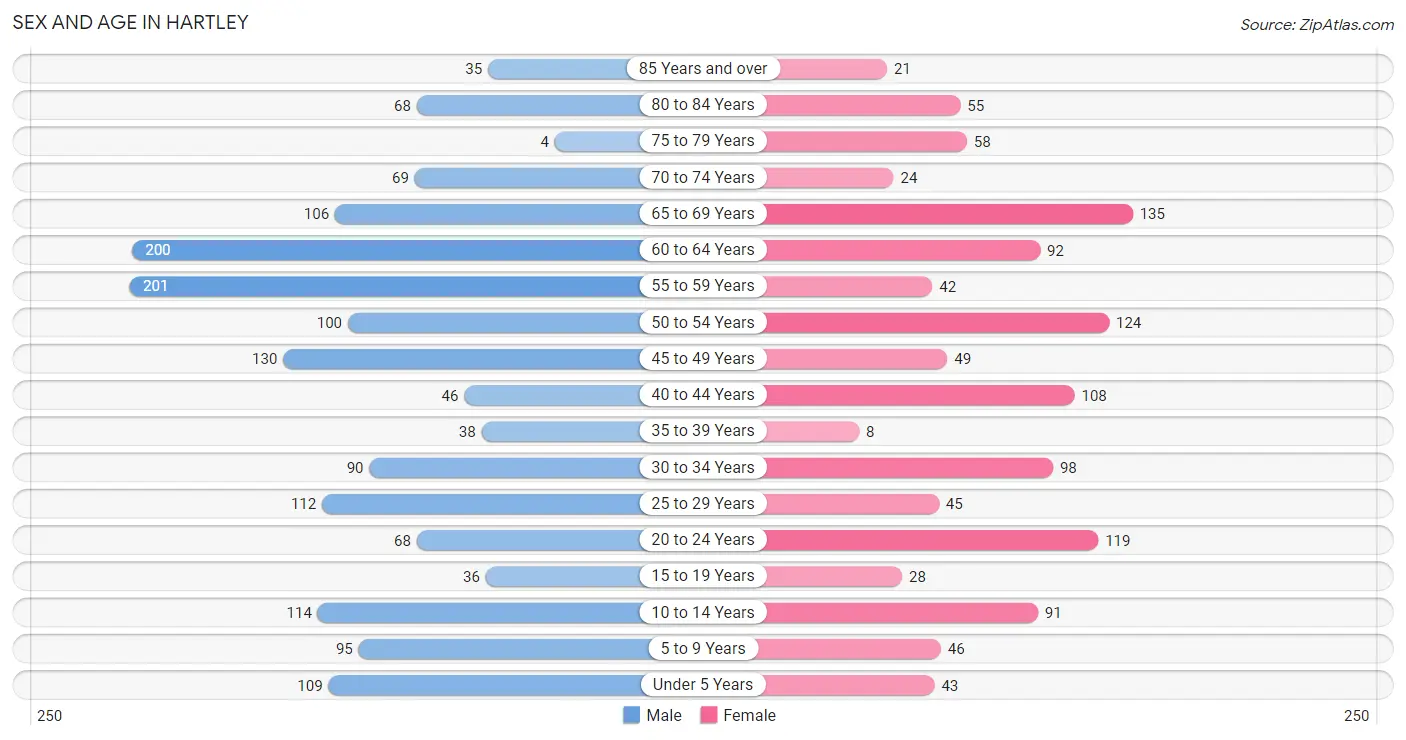
The most populous age groups in Hartley are 55 to 59 Years (201 | 12.4%) for men and 65 to 69 Years (135 | 11.4%) for women.
| Age Bracket | Male | Female |
| Under 5 Years | 109 (6.7%) | 43 (3.6%) |
| 5 to 9 Years | 95 (5.9%) | 46 (3.9%) |
| 10 to 14 Years | 114 (7.0%) | 91 (7.7%) |
| 15 to 19 Years | 36 (2.2%) | 28 (2.4%) |
| 20 to 24 Years | 68 (4.2%) | 119 (10.0%) |
| 25 to 29 Years | 112 (6.9%) | 45 (3.8%) |
| 30 to 34 Years | 90 (5.6%) | 98 (8.3%) |
| 35 to 39 Years | 38 (2.3%) | 8 (0.7%) |
| 40 to 44 Years | 46 (2.8%) | 108 (9.1%) |
| 45 to 49 Years | 130 (8.0%) | 49 (4.1%) |
| 50 to 54 Years | 100 (6.2%) | 124 (10.5%) |
| 55 to 59 Years | 201 (12.4%) | 42 (3.5%) |
| 60 to 64 Years | 200 (12.3%) | 92 (7.8%) |
| 65 to 69 Years | 106 (6.5%) | 135 (11.4%) |
| 70 to 74 Years | 69 (4.3%) | 24 (2.0%) |
| 75 to 79 Years | 4 (0.3%) | 58 (4.9%) |
| 80 to 84 Years | 68 (4.2%) | 55 (4.6%) |
| 85 Years and over | 35 (2.2%) | 21 (1.8%) |
| Total | 1,621 (100.0%) | 1,186 (100.0%) |
Families and Households in Hartley
Median Family Size in Hartley
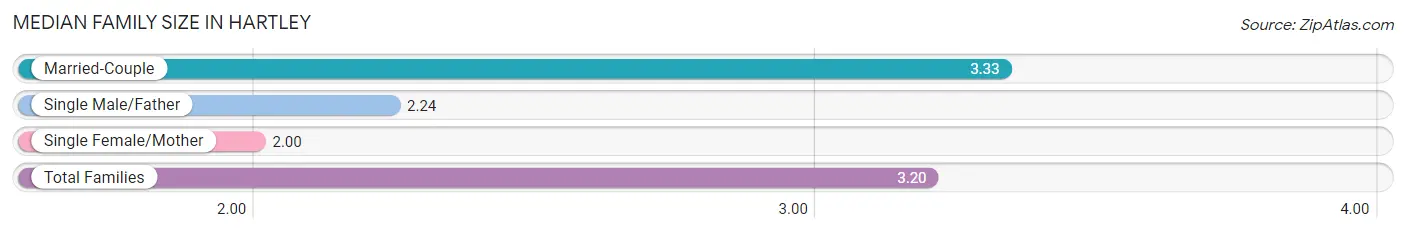
The median family size in Hartley is 3.20 persons per family, with married-couple families (650 | 89.8%) accounting for the largest median family size of 3.33 persons per family. On the other hand, single female/mother families (32 | 4.4%) represent the smallest median family size with 2.00 persons per family.
| Family Type | # Families | Family Size |
| Married-Couple | 650 (89.8%) | 3.33 |
| Single Male/Father | 42 (5.8%) | 2.24 |
| Single Female/Mother | 32 (4.4%) | 2.00 |
| Total Families | 724 (100.0%) | 3.20 |
Median Household Size in Hartley
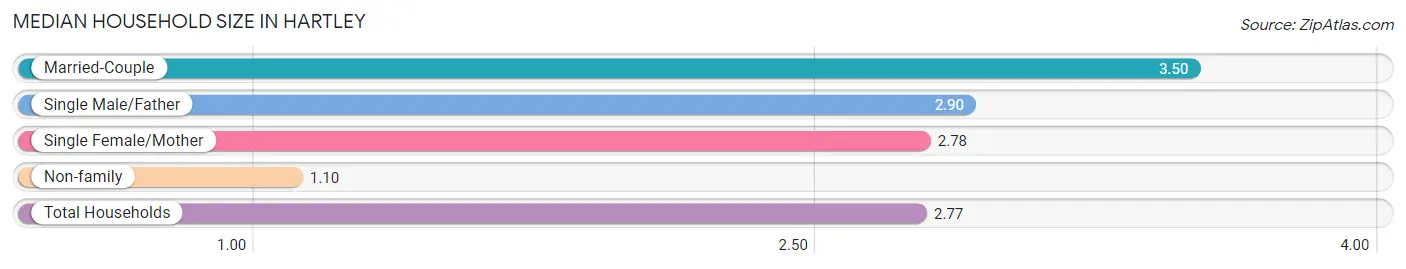
The median household size in Hartley is 2.77 persons per household, with married-couple households (650 | 64.2%) accounting for the largest median household size of 3.5 persons per household. non-family households (289 | 28.5%) represent the smallest median household size with 1.10 persons per household.
| Household Type | # Households | Household Size |
| Married-Couple | 650 (64.2%) | 3.50 |
| Single Male/Father | 42 (4.2%) | 2.90 |
| Single Female/Mother | 32 (3.2%) | 2.78 |
| Non-family | 289 (28.5%) | 1.10 |
| Total Households | 1,013 (100.0%) | 2.77 |
Household Size by Marriage Status in Hartley
Out of a total of 1,013 households in Hartley, 724 (71.5%) are family households, while 289 (28.5%) are nonfamily households. The most numerous type of family households are 2-person households, comprising 296, and the most common type of nonfamily households are 1-person households, comprising 262.
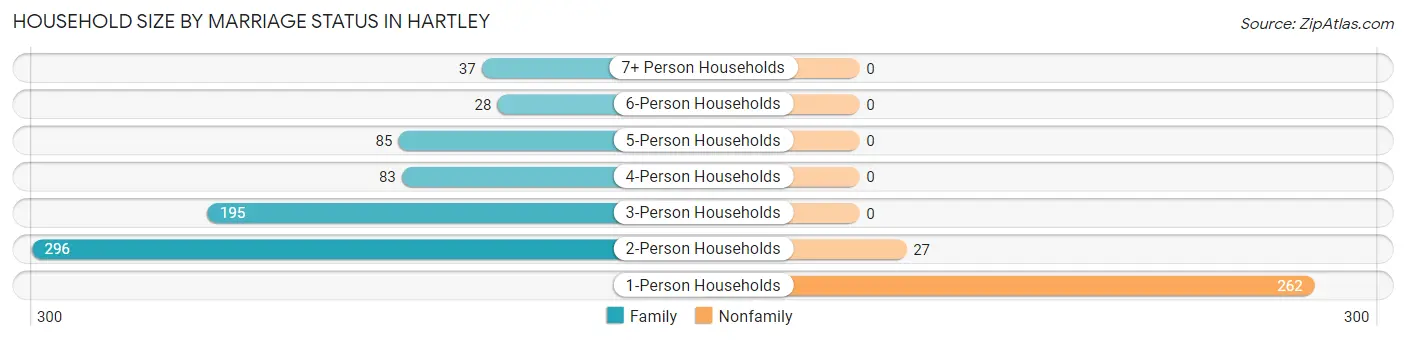
| Household Size | Family Households | Nonfamily Households |
| 1-Person Households | - | 262 (25.9%) |
| 2-Person Households | 296 (29.2%) | 27 (2.7%) |
| 3-Person Households | 195 (19.3%) | 0 (0.0%) |
| 4-Person Households | 83 (8.2%) | 0 (0.0%) |
| 5-Person Households | 85 (8.4%) | 0 (0.0%) |
| 6-Person Households | 28 (2.8%) | 0 (0.0%) |
| 7+ Person Households | 37 (3.6%) | 0 (0.0%) |
| Total | 724 (71.5%) | 289 (28.5%) |
Female Fertility in Hartley
Fertility by Age in Hartley
Average fertility rate in Hartley is 48.0 births per 1,000 women. Women in the age bracket of 20 to 34 years have the highest fertility rate with 84.0 births per 1,000 women. Women in the age bracket of 20 to 34 years acount for 100.0% of all women with births.
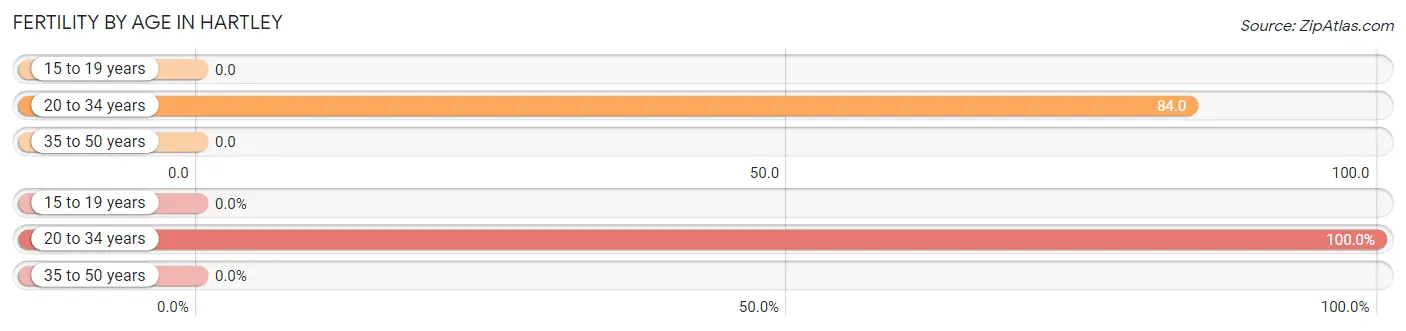
| Age Bracket | Women with Births | Births / 1,000 Women |
| 15 to 19 years | 0 (0.0%) | 0.0 |
| 20 to 34 years | 22 (100.0%) | 84.0 |
| 35 to 50 years | 0 (0.0%) | 0.0 |
| Total | 22 (100.0%) | 48.0 |
Fertility by Age by Marriage Status in Hartley
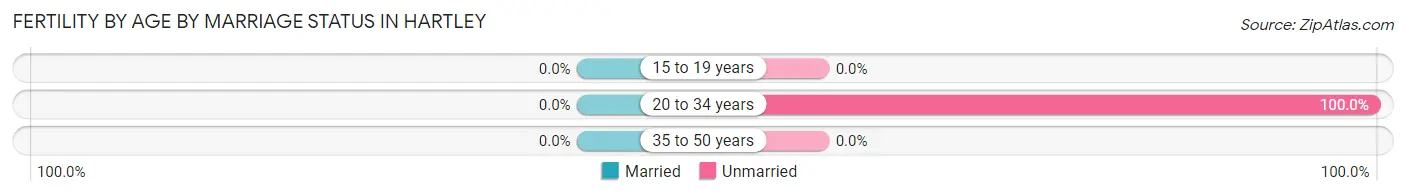
| Age Bracket | Married | Unmarried |
| 15 to 19 years | 0 (0.0%) | 0 (0.0%) |
| 20 to 34 years | 0 (0.0%) | 22 (100.0%) |
| 35 to 50 years | 0 (0.0%) | 0 (0.0%) |
| Total | 0 (0.0%) | 22 (100.0%) |
Fertility by Education in Hartley
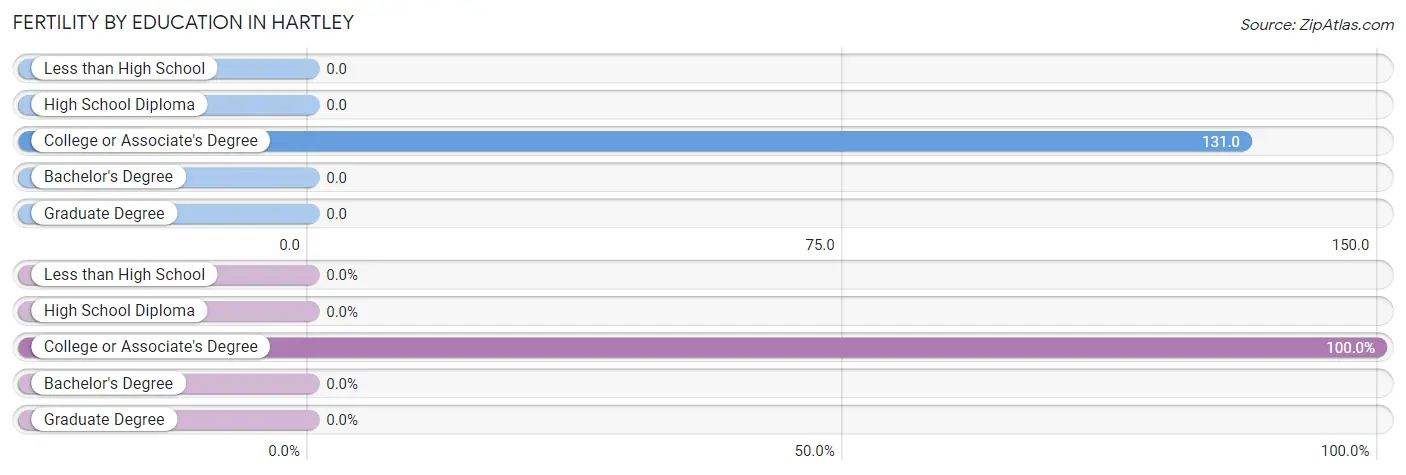
| Educational Attainment | Women with Births | Births / 1,000 Women |
| Less than High School | 0 (0.0%) | 0.0 |
| High School Diploma | 0 (0.0%) | 0.0 |
| College or Associate's Degree | 22 (100.0%) | 131.0 |
| Bachelor's Degree | 0 (0.0%) | 0.0 |
| Graduate Degree | 0 (0.0%) | 0.0 |
| Total | 22 (100.0%) | 48.0 |
Fertility by Education by Marriage Status in Hartley
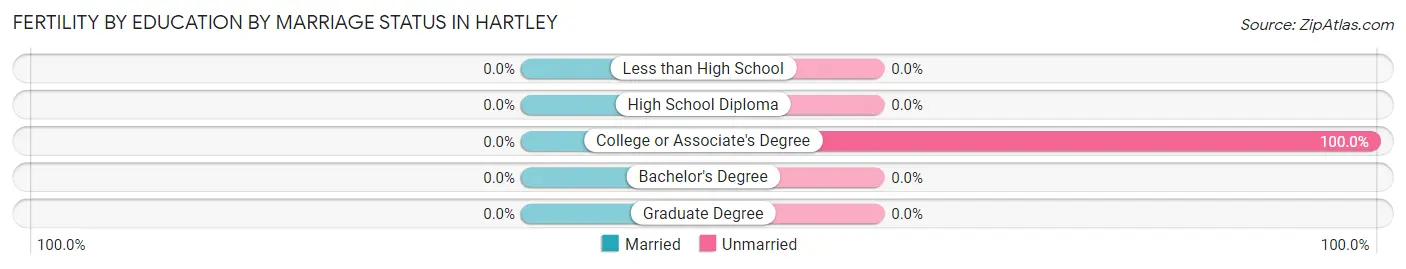
| Educational Attainment | Married | Unmarried |
| Less than High School | 0 (0.0%) | 0 (0.0%) |
| High School Diploma | 0 (0.0%) | 0 (0.0%) |
| College or Associate's Degree | 0 (0.0%) | 22 (100.0%) |
| Bachelor's Degree | 0 (0.0%) | 0 (0.0%) |
| Graduate Degree | 0 (0.0%) | 0 (0.0%) |
| Total | 0 (0.0%) | 22 (100.0%) |
Employment Characteristics in Hartley
Employment by Class of Employer in Hartley
Among the 1,202 employed individuals in Hartley, private company employees (819 | 68.1%), local government employees (160 | 13.3%), and not-for-profit organizations (86 | 7.1%) make up the most common classes of employment.
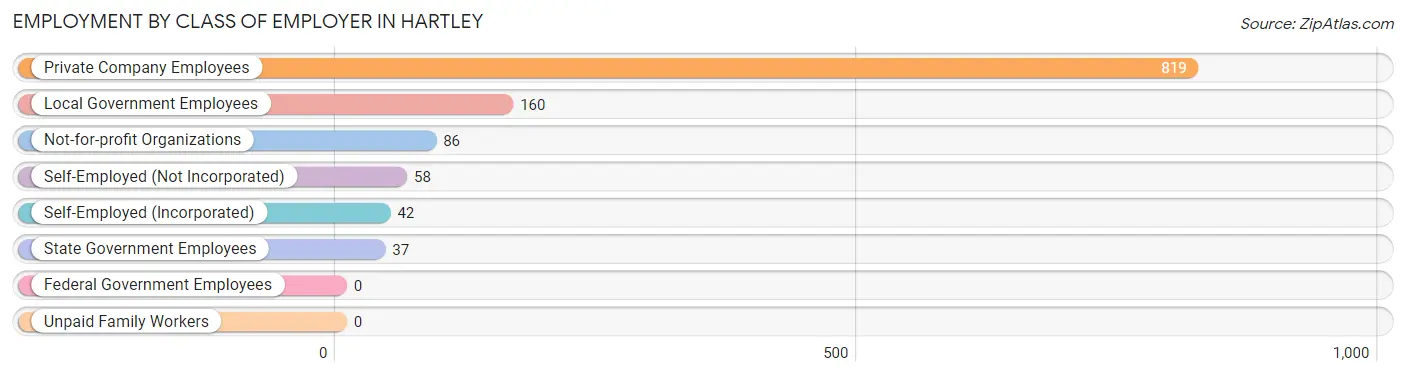
| Employer Class | # Employees | % Employees |
| Private Company Employees | 819 | 68.1% |
| Self-Employed (Incorporated) | 42 | 3.5% |
| Self-Employed (Not Incorporated) | 58 | 4.8% |
| Not-for-profit Organizations | 86 | 7.1% |
| Local Government Employees | 160 | 13.3% |
| State Government Employees | 37 | 3.1% |
| Federal Government Employees | 0 | 0.0% |
| Unpaid Family Workers | 0 | 0.0% |
| Total | 1,202 | 100.0% |
Employment Status by Age in Hartley
According to the labor force statistics for Hartley, out of the total population over 16 years of age (2,289), 55.3% or 1,266 individuals are in the labor force, with 1.7% or 22 of them unemployed. The age group with the highest labor force participation rate is 30 to 34 years, with 100.0% or 188 individuals in the labor force. Within the labor force, the 25 to 29 years age range has the highest percentage of unemployed individuals, with 20.8% or 22 of them being unemployed.
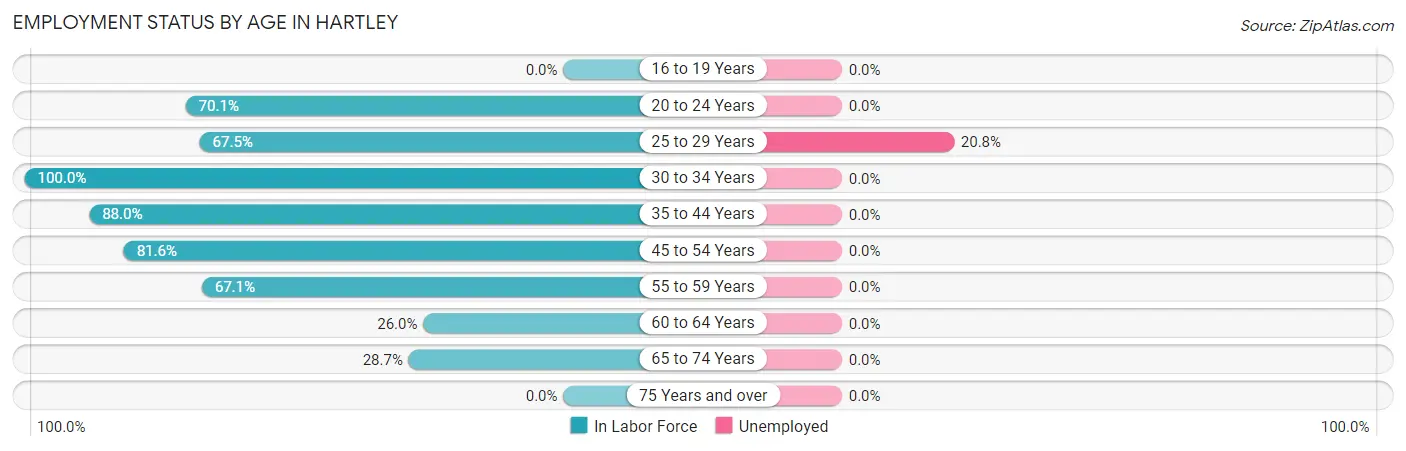
| Age Bracket | In Labor Force | Unemployed |
| 16 to 19 Years | 0 (0.0%) | 0 (0.0%) |
| 20 to 24 Years | 131 (70.1%) | 0 (0.0%) |
| 25 to 29 Years | 106 (67.5%) | 22 (20.8%) |
| 30 to 34 Years | 188 (100.0%) | 0 (0.0%) |
| 35 to 44 Years | 176 (88.0%) | 0 (0.0%) |
| 45 to 54 Years | 329 (81.6%) | 0 (0.0%) |
| 55 to 59 Years | 163 (67.1%) | 0 (0.0%) |
| 60 to 64 Years | 76 (26.0%) | 0 (0.0%) |
| 65 to 74 Years | 96 (28.7%) | 0 (0.0%) |
| 75 Years and over | 0 (0.0%) | 0 (0.0%) |
| Total | 1,266 (55.3%) | 22 (1.7%) |
Employment Status by Educational Attainment in Hartley
According to labor force statistics for Hartley, 70.0% of individuals (1,038) out of the total population between 25 and 64 years of age (1,483) are in the labor force, with 2.1% or 22 of them being unemployed. The group with the highest labor force participation rate are those with the educational attainment of bachelor's degree or higher, with 85.5% or 366 individuals in the labor force. Within the labor force, individuals with high school diploma education have the highest percentage of unemployment, with 7.9% or 22 of them being unemployed.
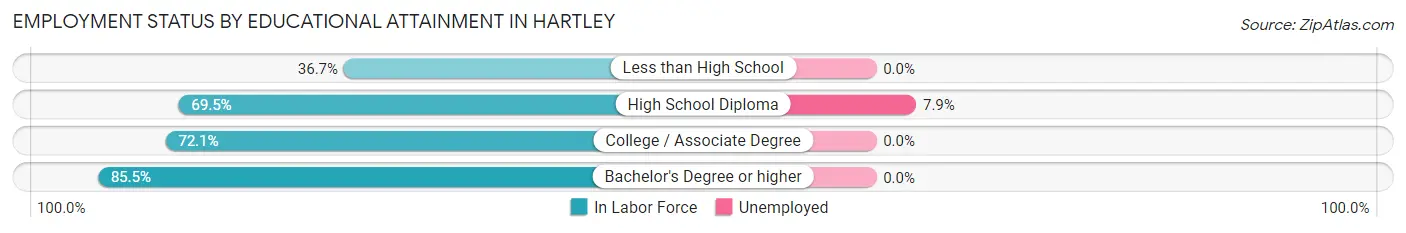
| Educational Attainment | In Labor Force | Unemployed |
| Less than High School | 81 (36.7%) | 0 (0.0%) |
| High School Diploma | 278 (69.5%) | 32 (7.9%) |
| College / Associate Degree | 313 (72.1%) | 0 (0.0%) |
| Bachelor's Degree or higher | 366 (85.5%) | 0 (0.0%) |
| Total | 1,038 (70.0%) | 31 (2.1%) |
Employment Occupations by Sex in Hartley
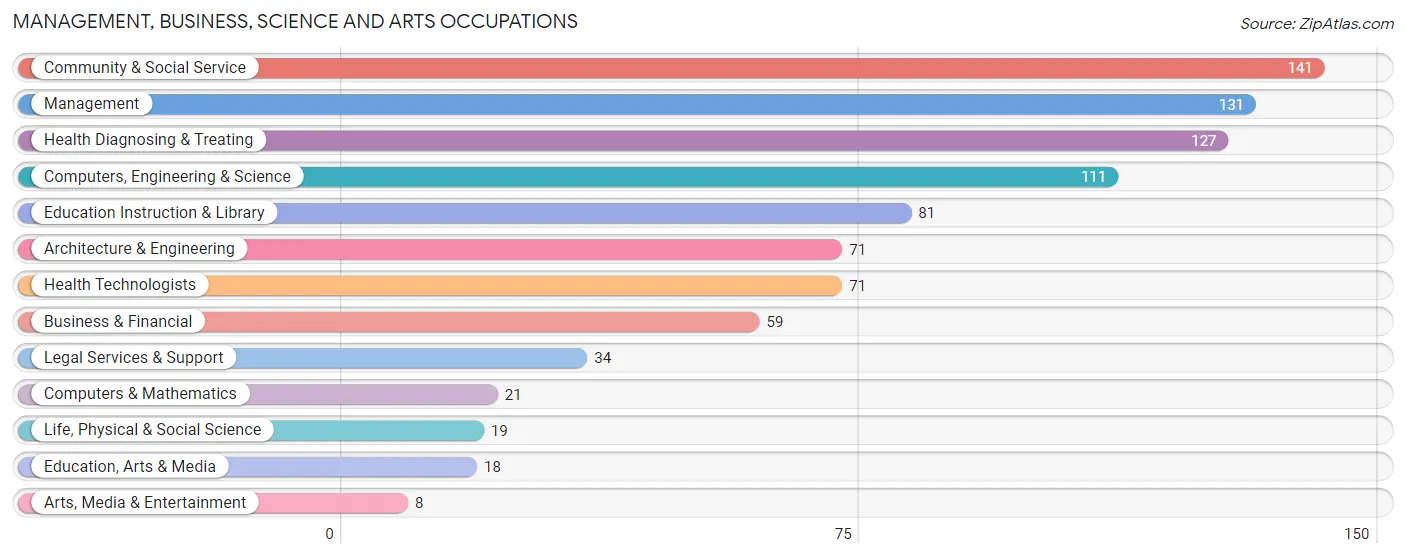
Management, Business, Science and Arts Occupations
The most common Management, Business, Science and Arts occupations in Hartley are Community & Social Service (141 | 11.3%), Management (131 | 10.5%), Health Diagnosing & Treating (127 | 10.2%), Computers, Engineering & Science (111 | 8.9%), and Education Instruction & Library (81 | 6.5%).
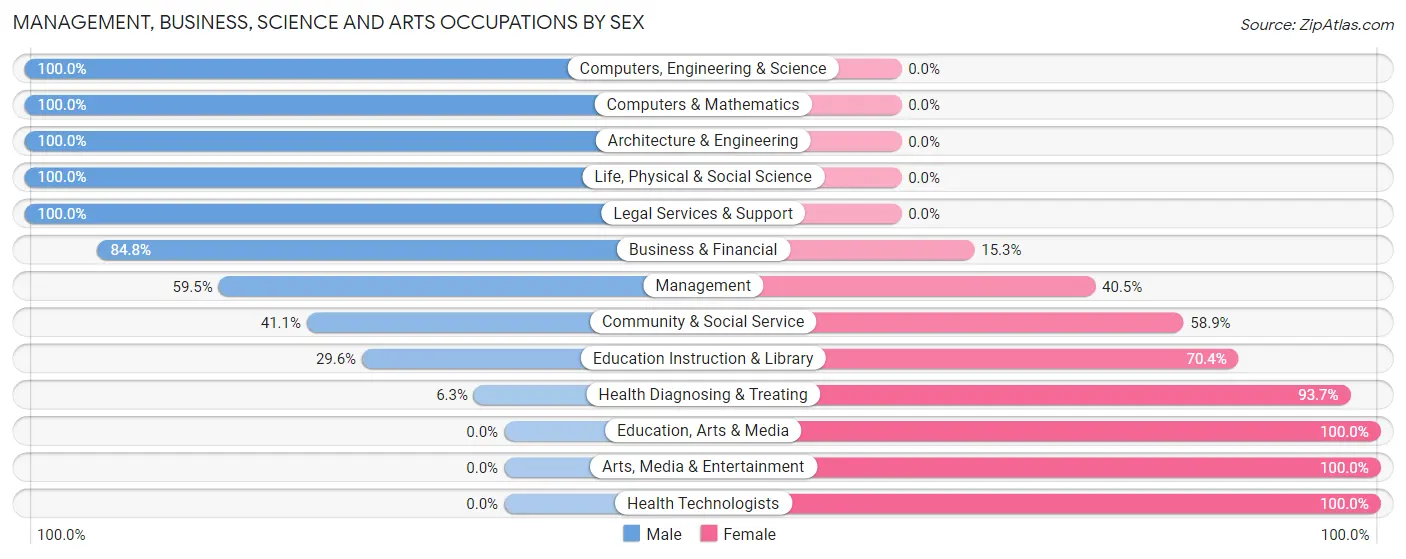
Management, Business, Science and Arts Occupations by Sex
Within the Management, Business, Science and Arts occupations in Hartley, the most male-oriented occupations are Computers, Engineering & Science (100.0%), Computers & Mathematics (100.0%), and Architecture & Engineering (100.0%), while the most female-oriented occupations are Education, Arts & Media (100.0%), Arts, Media & Entertainment (100.0%), and Health Technologists (100.0%).
| Occupation | Male | Female |
| Management | 78 (59.5%) | 53 (40.5%) |
| Business & Financial | 50 (84.8%) | 9 (15.2%) |
| Computers, Engineering & Science | 111 (100.0%) | 0 (0.0%) |
| Computers & Mathematics | 21 (100.0%) | 0 (0.0%) |
| Architecture & Engineering | 71 (100.0%) | 0 (0.0%) |
| Life, Physical & Social Science | 19 (100.0%) | 0 (0.0%) |
| Community & Social Service | 58 (41.1%) | 83 (58.9%) |
| Education, Arts & Media | 0 (0.0%) | 18 (100.0%) |
| Legal Services & Support | 34 (100.0%) | 0 (0.0%) |
| Education Instruction & Library | 24 (29.6%) | 57 (70.4%) |
| Arts, Media & Entertainment | 0 (0.0%) | 8 (100.0%) |
| Health Diagnosing & Treating | 8 (6.3%) | 119 (93.7%) |
| Health Technologists | 0 (0.0%) | 71 (100.0%) |
| Total (Category) | 305 (53.6%) | 264 (46.4%) |
| Total (Overall) | 727 (58.5%) | 516 (41.5%) |
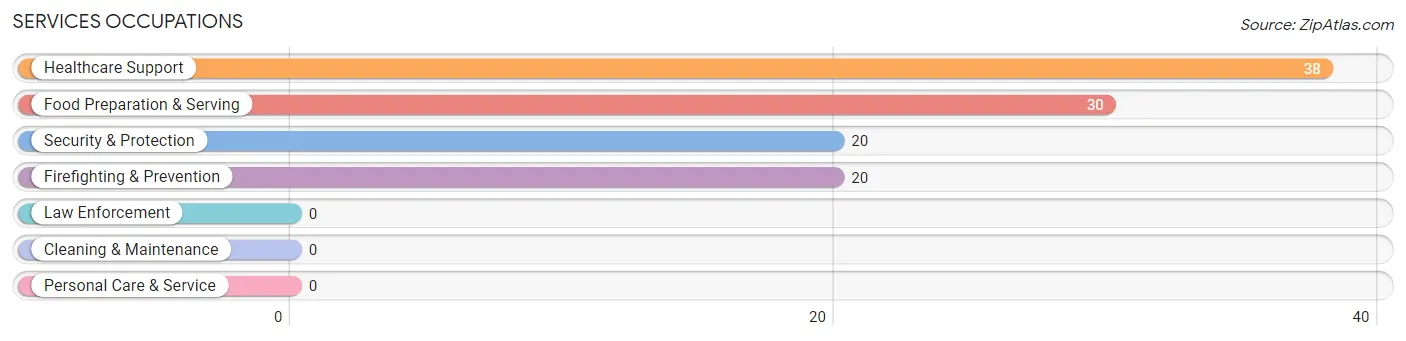
Services Occupations
The most common Services occupations in Hartley are Healthcare Support (38 | 3.1%), Food Preparation & Serving (30 | 2.4%), Security & Protection (20 | 1.6%), and Firefighting & Prevention (20 | 1.6%).
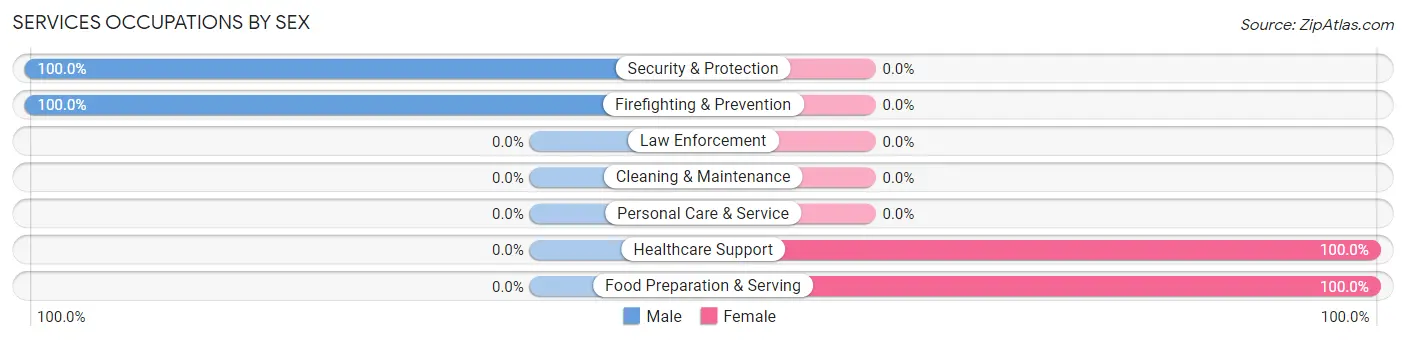
Services Occupations by Sex
Within the Services occupations in Hartley, the most male-oriented occupations are Security & Protection (100.0%), and Firefighting & Prevention (100.0%), while the most female-oriented occupations are Healthcare Support (100.0%), and Food Preparation & Serving (100.0%).
| Occupation | Male | Female |
| Healthcare Support | 0 (0.0%) | 38 (100.0%) |
| Security & Protection | 20 (100.0%) | 0 (0.0%) |
| Firefighting & Prevention | 20 (100.0%) | 0 (0.0%) |
| Law Enforcement | 0 (0.0%) | 0 (0.0%) |
| Food Preparation & Serving | 0 (0.0%) | 30 (100.0%) |
| Cleaning & Maintenance | 0 (0.0%) | 0 (0.0%) |
| Personal Care & Service | 0 (0.0%) | 0 (0.0%) |
| Total (Category) | 20 (22.7%) | 68 (77.3%) |
| Total (Overall) | 727 (58.5%) | 516 (41.5%) |
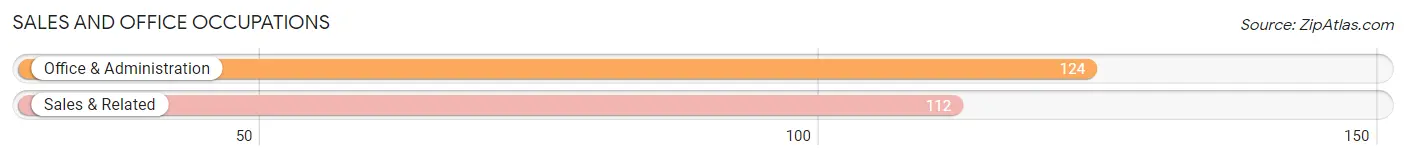
Sales and Office Occupations
The most common Sales and Office occupations in Hartley are Office & Administration (124 | 10.0%), and Sales & Related (112 | 9.0%).
Sales and Office Occupations by Sex
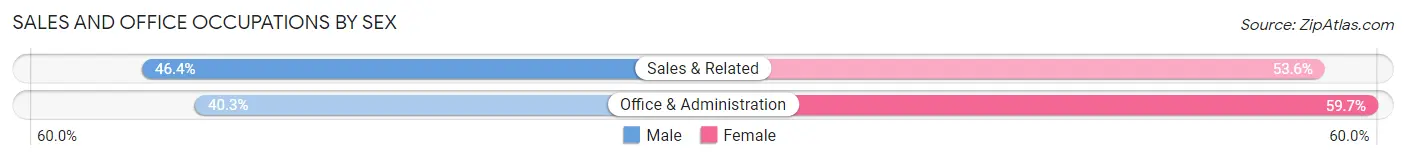
| Occupation | Male | Female |
| Sales & Related | 52 (46.4%) | 60 (53.6%) |
| Office & Administration | 50 (40.3%) | 74 (59.7%) |
| Total (Category) | 102 (43.2%) | 134 (56.8%) |
| Total (Overall) | 727 (58.5%) | 516 (41.5%) |
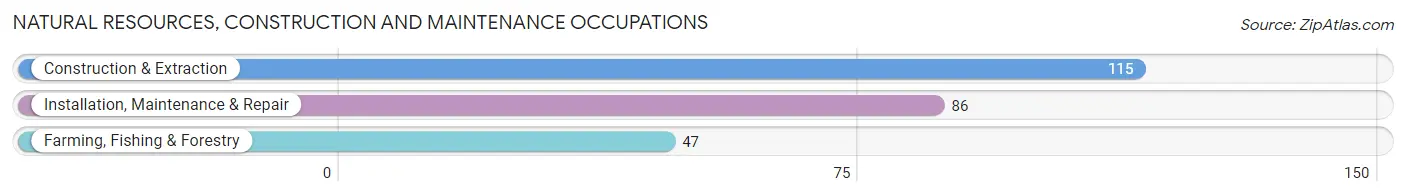
Natural Resources, Construction and Maintenance Occupations
The most common Natural Resources, Construction and Maintenance occupations in Hartley are Construction & Extraction (115 | 9.2%), Installation, Maintenance & Repair (86 | 6.9%), and Farming, Fishing & Forestry (47 | 3.8%).
Natural Resources, Construction and Maintenance Occupations by Sex
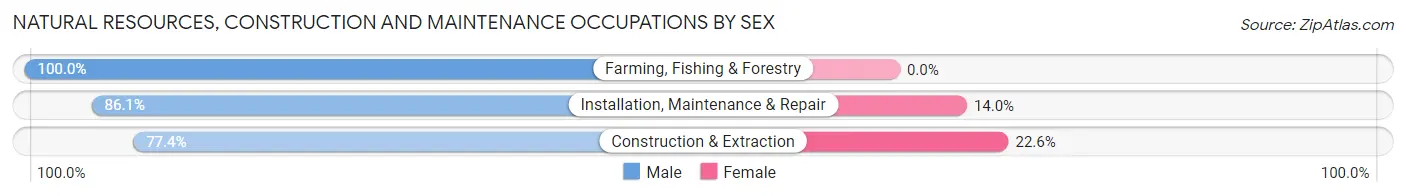
| Occupation | Male | Female |
| Farming, Fishing & Forestry | 47 (100.0%) | 0 (0.0%) |
| Construction & Extraction | 89 (77.4%) | 26 (22.6%) |
| Installation, Maintenance & Repair | 74 (86.1%) | 12 (14.0%) |
| Total (Category) | 210 (84.7%) | 38 (15.3%) |
| Total (Overall) | 727 (58.5%) | 516 (41.5%) |
Production, Transportation and Moving Occupations
The most common Production, Transportation and Moving occupations in Hartley are Production (60 | 4.8%), and Material Moving (42 | 3.4%).
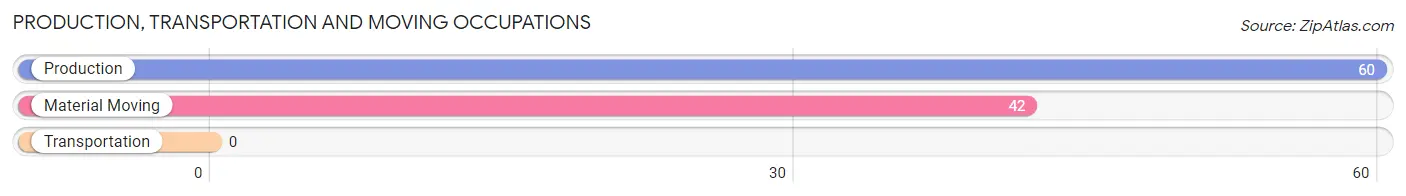
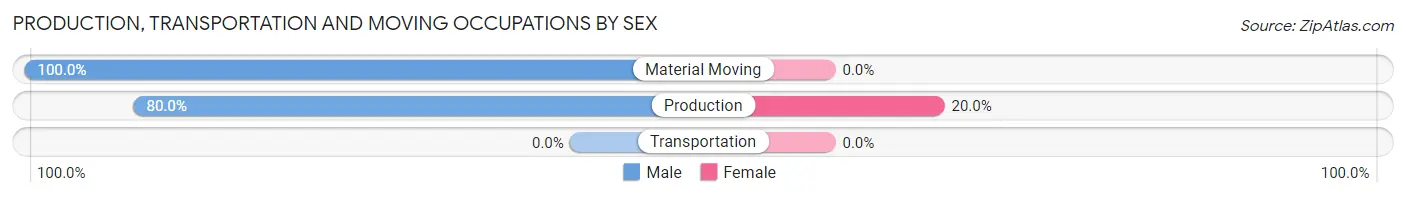
Production, Transportation and Moving Occupations by Sex
| Occupation | Male | Female |
| Production | 48 (80.0%) | 12 (20.0%) |
| Transportation | 0 (0.0%) | 0 (0.0%) |
| Material Moving | 42 (100.0%) | 0 (0.0%) |
| Total (Category) | 90 (88.2%) | 12 (11.8%) |
| Total (Overall) | 727 (58.5%) | 516 (41.5%) |
Employment Industries by Sex in Hartley
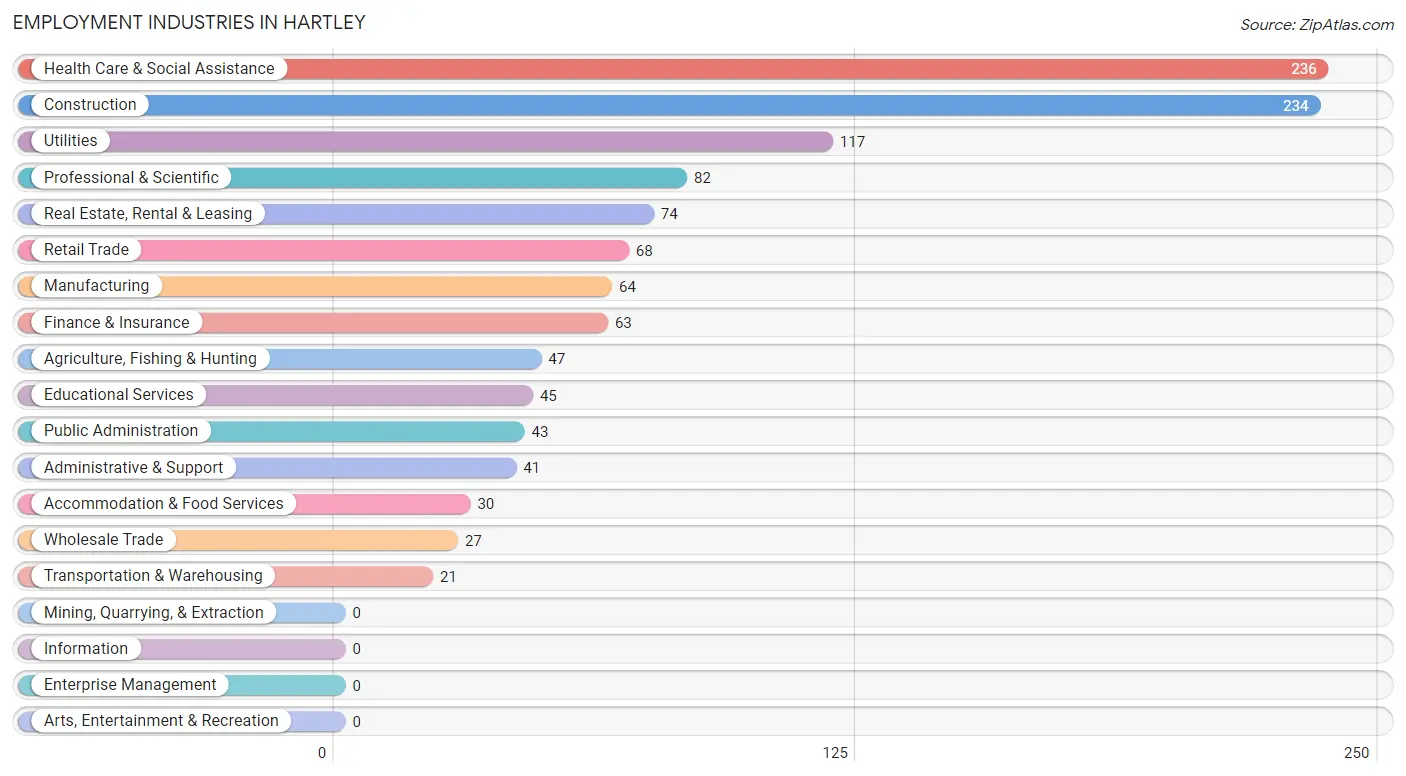
Employment Industries in Hartley
The major employment industries in Hartley include Health Care & Social Assistance (236 | 19.0%), Construction (234 | 18.8%), Utilities (117 | 9.4%), Professional & Scientific (82 | 6.6%), and Real Estate, Rental & Leasing (74 | 5.9%).
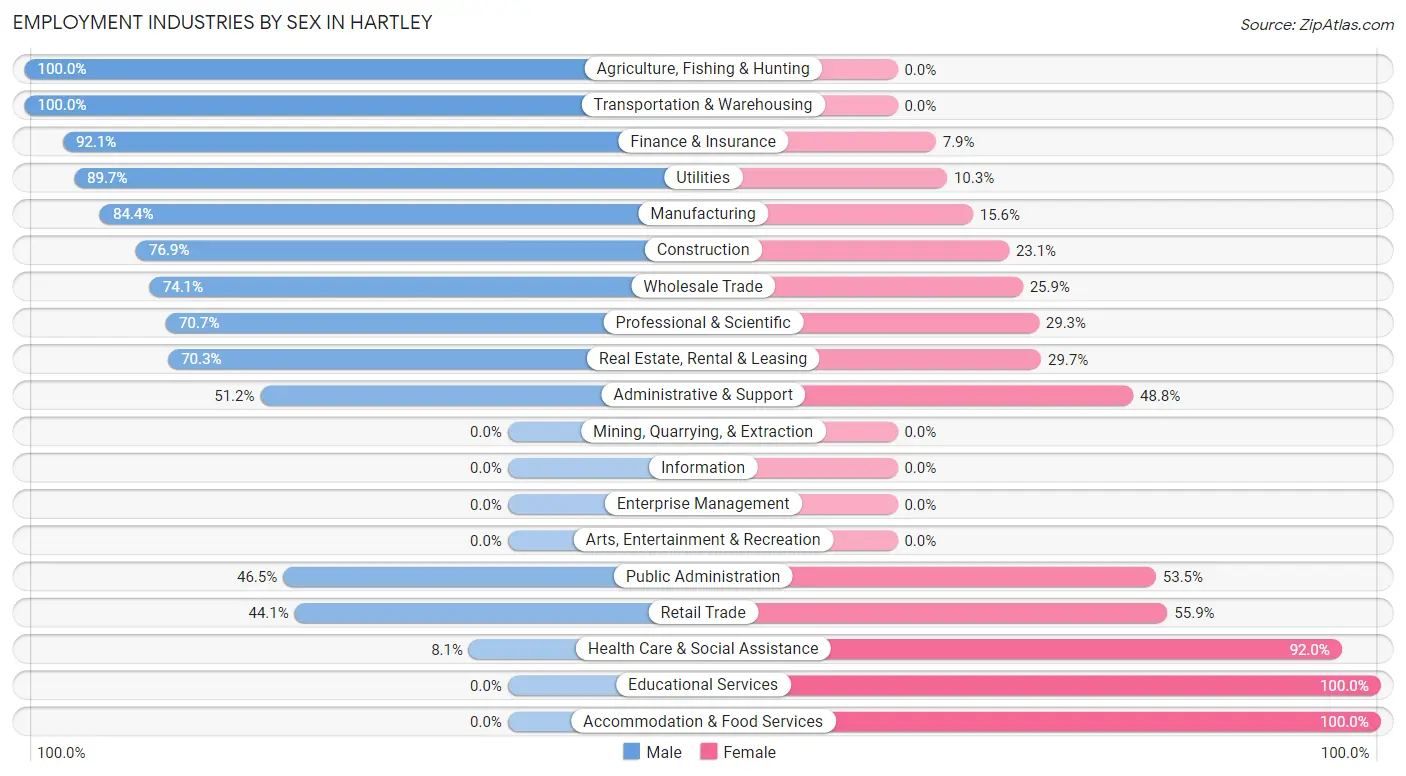
Employment Industries by Sex in Hartley
The Hartley industries that see more men than women are Agriculture, Fishing & Hunting (100.0%), Transportation & Warehousing (100.0%), and Finance & Insurance (92.1%), whereas the industries that tend to have a higher number of women are Educational Services (100.0%), Accommodation & Food Services (100.0%), and Health Care & Social Assistance (91.9%).
| Industry | Male | Female |
| Agriculture, Fishing & Hunting | 47 (100.0%) | 0 (0.0%) |
| Mining, Quarrying, & Extraction | 0 (0.0%) | 0 (0.0%) |
| Construction | 180 (76.9%) | 54 (23.1%) |
| Manufacturing | 54 (84.4%) | 10 (15.6%) |
| Wholesale Trade | 20 (74.1%) | 7 (25.9%) |
| Retail Trade | 30 (44.1%) | 38 (55.9%) |
| Transportation & Warehousing | 21 (100.0%) | 0 (0.0%) |
| Utilities | 105 (89.7%) | 12 (10.3%) |
| Information | 0 (0.0%) | 0 (0.0%) |
| Finance & Insurance | 58 (92.1%) | 5 (7.9%) |
| Real Estate, Rental & Leasing | 52 (70.3%) | 22 (29.7%) |
| Professional & Scientific | 58 (70.7%) | 24 (29.3%) |
| Enterprise Management | 0 (0.0%) | 0 (0.0%) |
| Administrative & Support | 21 (51.2%) | 20 (48.8%) |
| Educational Services | 0 (0.0%) | 45 (100.0%) |
| Health Care & Social Assistance | 19 (8.1%) | 217 (91.9%) |
| Arts, Entertainment & Recreation | 0 (0.0%) | 0 (0.0%) |
| Accommodation & Food Services | 0 (0.0%) | 30 (100.0%) |
| Public Administration | 20 (46.5%) | 23 (53.5%) |
| Total | 727 (58.5%) | 516 (41.5%) |
Education in Hartley
School Enrollment in Hartley
The most common levels of schooling among the 595 students in Hartley are middle school (134 | 22.5%), college / undergraduate (131 | 22.0%), and high school (126 | 21.2%).
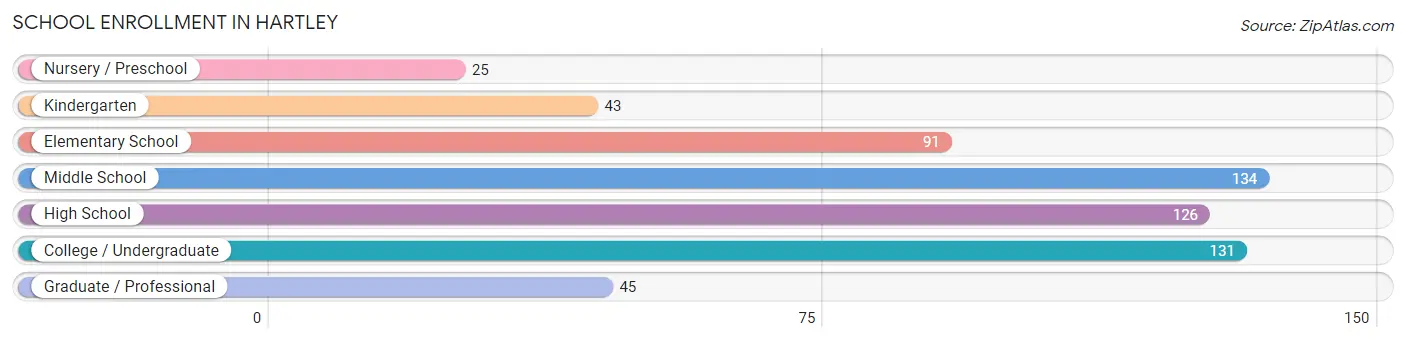
| School Level | # Students | % Students |
| Nursery / Preschool | 25 | 4.2% |
| Kindergarten | 43 | 7.2% |
| Elementary School | 91 | 15.3% |
| Middle School | 134 | 22.5% |
| High School | 126 | 21.2% |
| College / Undergraduate | 131 | 22.0% |
| Graduate / Professional | 45 | 7.6% |
| Total | 595 | 100.0% |
School Enrollment by Age by Funding Source in Hartley
Out of a total of 595 students who are enrolled in schools in Hartley, 28 (4.7%) attend a private institution, while the remaining 567 (95.3%) are enrolled in public schools. The age group of 3 to 4 year olds has the highest likelihood of being enrolled in private schools, with 9 (100.0% in the age bracket) enrolled. Conversely, the age group of 5 to 9 year old has the lowest likelihood of being enrolled in a private school, with 141 (100.0% in the age bracket) attending a public institution.
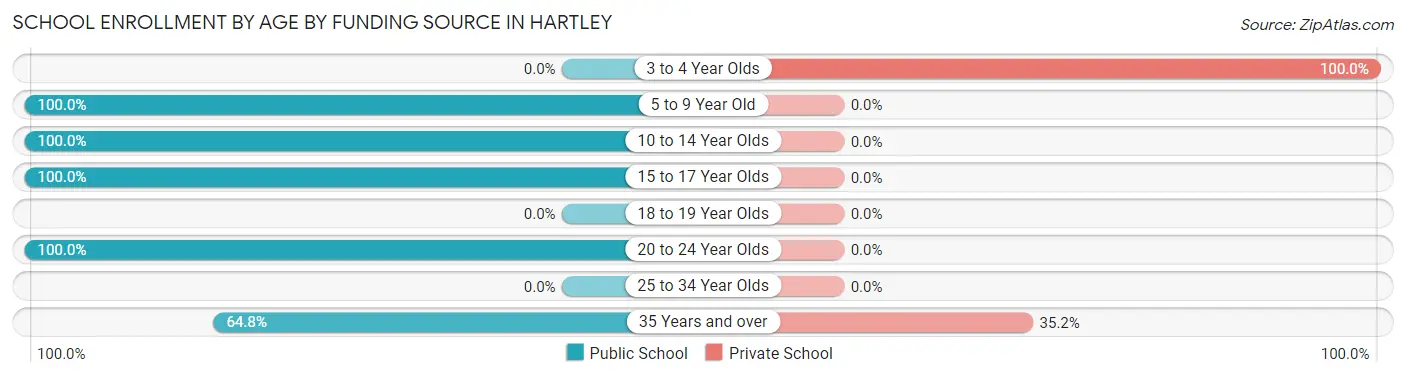
| Age Bracket | Public School | Private School |
| 3 to 4 Year Olds | 0 (0.0%) | 9 (100.0%) |
| 5 to 9 Year Old | 141 (100.0%) | 0 (0.0%) |
| 10 to 14 Year Olds | 205 (100.0%) | 0 (0.0%) |
| 15 to 17 Year Olds | 64 (100.0%) | 0 (0.0%) |
| 18 to 19 Year Olds | 0 (0.0%) | 0 (0.0%) |
| 20 to 24 Year Olds | 122 (100.0%) | 0 (0.0%) |
| 25 to 34 Year Olds | 0 (0.0%) | 0 (0.0%) |
| 35 Years and over | 35 (64.8%) | 19 (35.2%) |
| Total | 567 (95.3%) | 28 (4.7%) |
Educational Attainment by Field of Study in Hartley
Science & technology (177 | 34.0%), engineering (95 | 18.3%), social sciences (56 | 10.8%), liberal arts & history (43 | 8.3%), and arts & humanities (43 | 8.3%) are the most common fields of study among 520 individuals in Hartley who have obtained a bachelor's degree or higher.
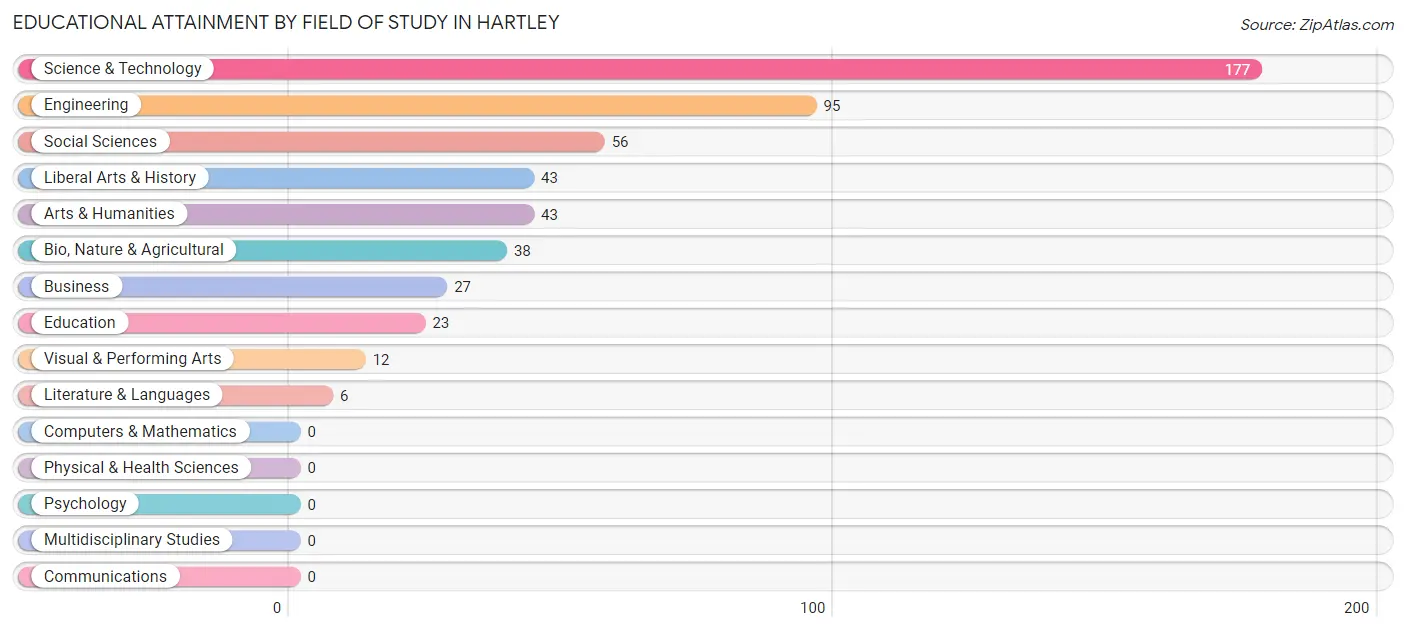
| Field of Study | # Graduates | % Graduates |
| Computers & Mathematics | 0 | 0.0% |
| Bio, Nature & Agricultural | 38 | 7.3% |
| Physical & Health Sciences | 0 | 0.0% |
| Psychology | 0 | 0.0% |
| Social Sciences | 56 | 10.8% |
| Engineering | 95 | 18.3% |
| Multidisciplinary Studies | 0 | 0.0% |
| Science & Technology | 177 | 34.0% |
| Business | 27 | 5.2% |
| Education | 23 | 4.4% |
| Literature & Languages | 6 | 1.1% |
| Liberal Arts & History | 43 | 8.3% |
| Visual & Performing Arts | 12 | 2.3% |
| Communications | 0 | 0.0% |
| Arts & Humanities | 43 | 8.3% |
| Total | 520 | 100.0% |
Transportation & Commute in Hartley
Vehicle Availability by Sex in Hartley
The most prevalent vehicle ownership categories in Hartley are males with 2 vehicles (228, accounting for 32.7%) and females with 2 vehicles (174, making up 45.2%).
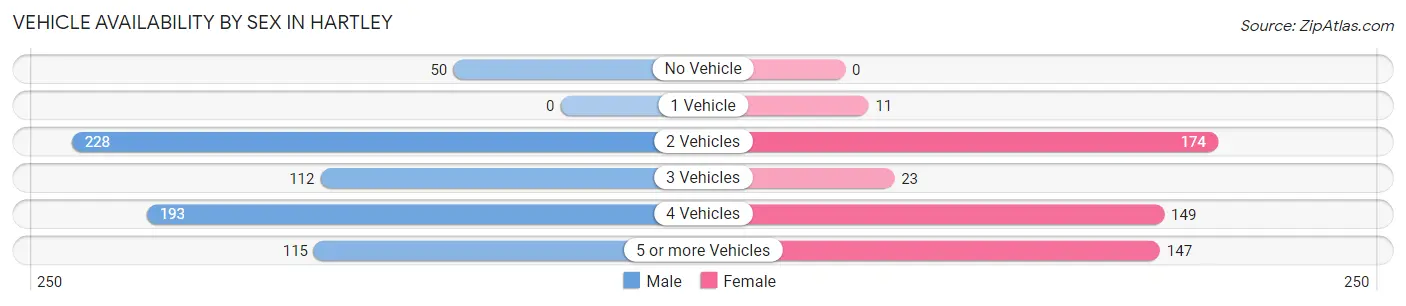
| Vehicles Available | Male | Female |
| No Vehicle | 50 (7.2%) | 0 (0.0%) |
| 1 Vehicle | 0 (0.0%) | 11 (2.2%) |
| 2 Vehicles | 228 (32.7%) | 174 (34.5%) |
| 3 Vehicles | 112 (16.1%) | 23 (4.6%) |
| 4 Vehicles | 193 (27.7%) | 149 (29.6%) |
| 5 or more Vehicles | 115 (16.5%) | 147 (29.2%) |
| Total | 698 (100.0%) | 504 (100.0%) |
Commute Time in Hartley
The most frequently occuring commute durations in Hartley are 30 to 34 minutes (214 commuters, 21.2%), 10 to 14 minutes (197 commuters, 19.5%), and 20 to 24 minutes (138 commuters, 13.7%).
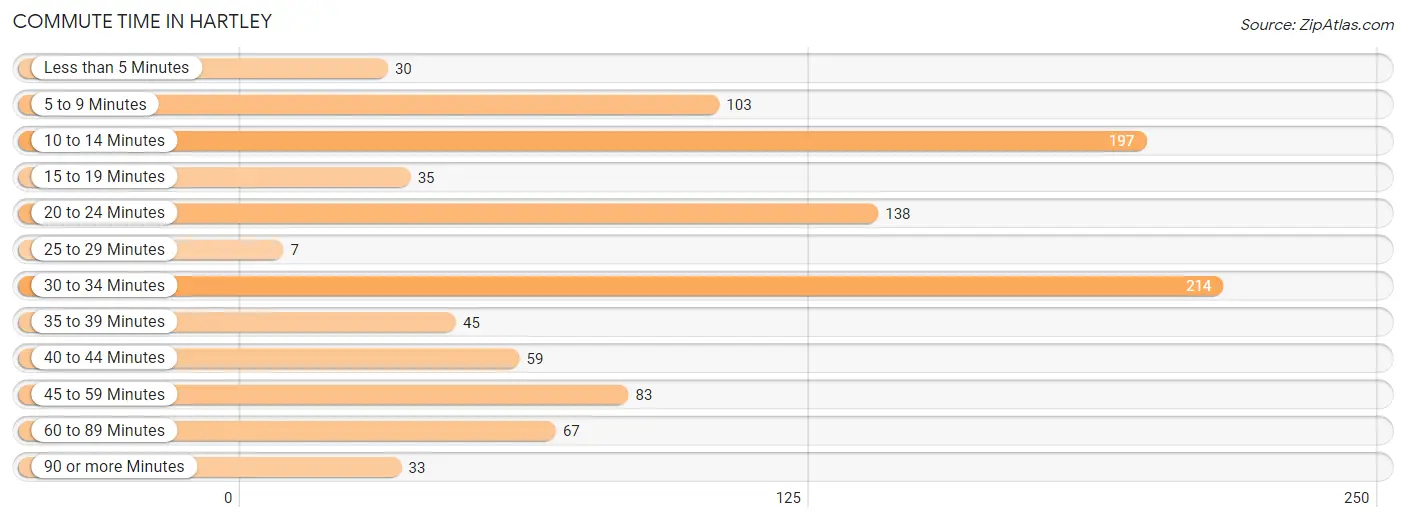
| Commute Time | # Commuters | % Commuters |
| Less than 5 Minutes | 30 | 3.0% |
| 5 to 9 Minutes | 103 | 10.2% |
| 10 to 14 Minutes | 197 | 19.5% |
| 15 to 19 Minutes | 35 | 3.5% |
| 20 to 24 Minutes | 138 | 13.7% |
| 25 to 29 Minutes | 7 | 0.7% |
| 30 to 34 Minutes | 214 | 21.2% |
| 35 to 39 Minutes | 45 | 4.4% |
| 40 to 44 Minutes | 59 | 5.8% |
| 45 to 59 Minutes | 83 | 8.2% |
| 60 to 89 Minutes | 67 | 6.6% |
| 90 or more Minutes | 33 | 3.3% |
Commute Time by Sex in Hartley
The most common commute times in Hartley are 30 to 34 minutes (134 commuters, 22.1%) for males and 10 to 14 minutes (105 commuters, 25.9%) for females.
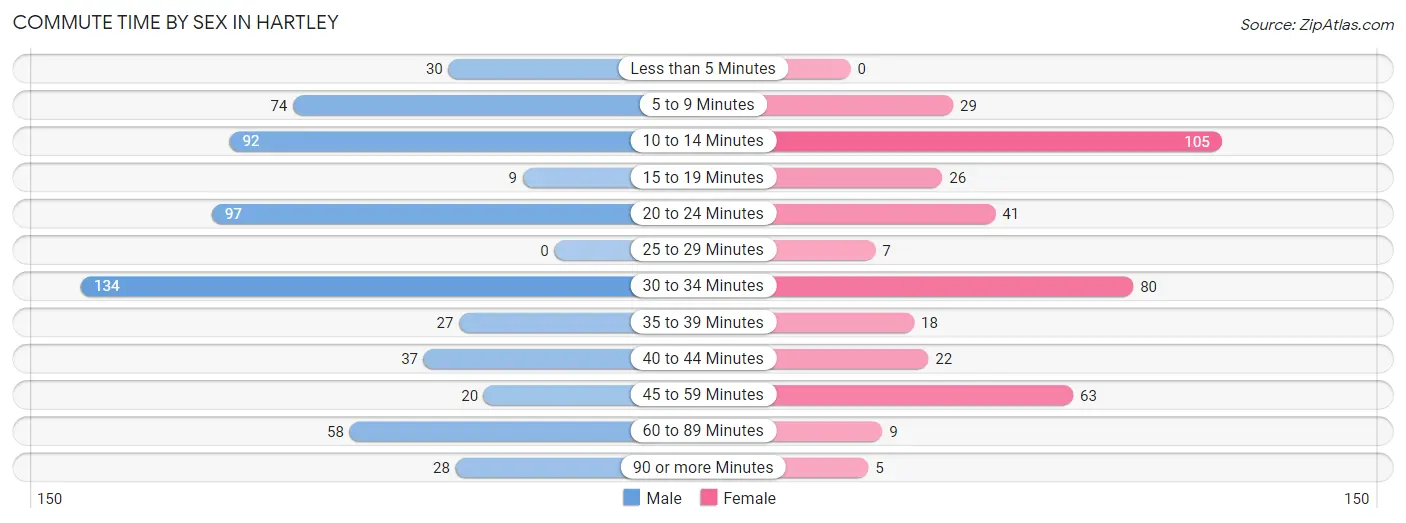
| Commute Time | Male | Female |
| Less than 5 Minutes | 30 (5.0%) | 0 (0.0%) |
| 5 to 9 Minutes | 74 (12.2%) | 29 (7.2%) |
| 10 to 14 Minutes | 92 (15.2%) | 105 (25.9%) |
| 15 to 19 Minutes | 9 (1.5%) | 26 (6.4%) |
| 20 to 24 Minutes | 97 (16.0%) | 41 (10.1%) |
| 25 to 29 Minutes | 0 (0.0%) | 7 (1.7%) |
| 30 to 34 Minutes | 134 (22.1%) | 80 (19.8%) |
| 35 to 39 Minutes | 27 (4.5%) | 18 (4.4%) |
| 40 to 44 Minutes | 37 (6.1%) | 22 (5.4%) |
| 45 to 59 Minutes | 20 (3.3%) | 63 (15.6%) |
| 60 to 89 Minutes | 58 (9.6%) | 9 (2.2%) |
| 90 or more Minutes | 28 (4.6%) | 5 (1.2%) |
Time of Departure to Work by Sex in Hartley
The most frequent times of departure to work in Hartley are 7:00 AM to 7:29 AM (125, 20.6%) for males and 8:00 AM to 8:29 AM (122, 30.1%) for females.
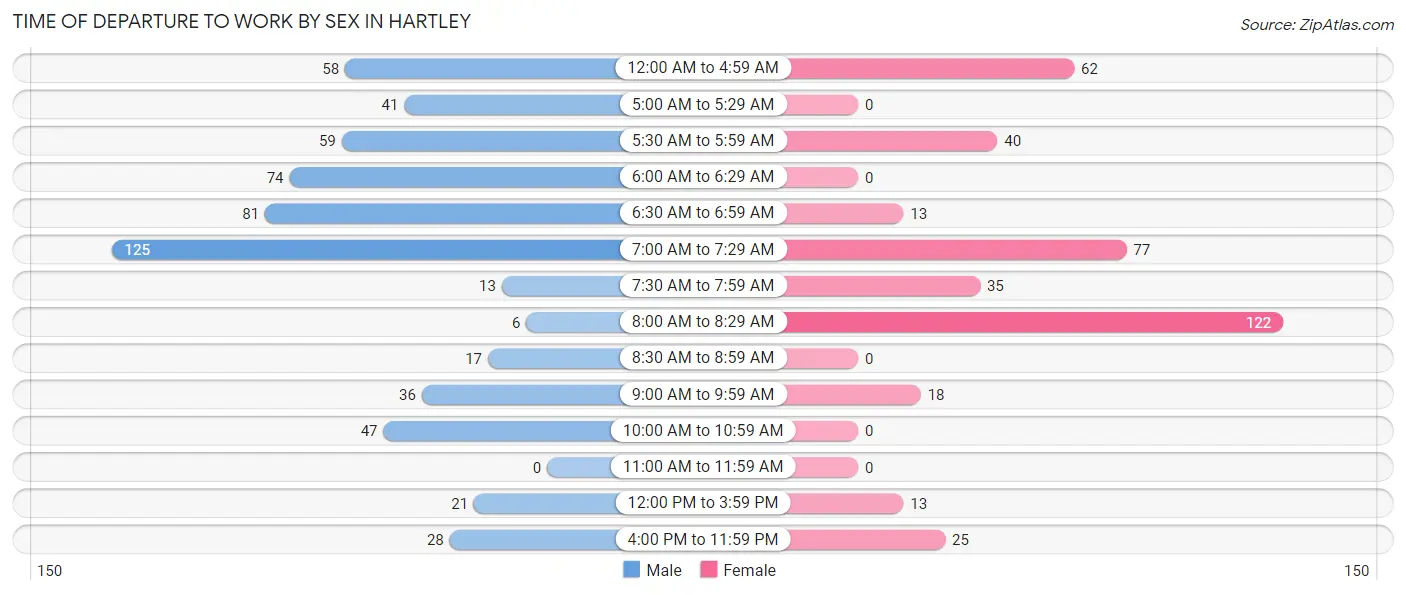
| Time of Departure | Male | Female |
| 12:00 AM to 4:59 AM | 58 (9.6%) | 62 (15.3%) |
| 5:00 AM to 5:29 AM | 41 (6.8%) | 0 (0.0%) |
| 5:30 AM to 5:59 AM | 59 (9.7%) | 40 (9.9%) |
| 6:00 AM to 6:29 AM | 74 (12.2%) | 0 (0.0%) |
| 6:30 AM to 6:59 AM | 81 (13.4%) | 13 (3.2%) |
| 7:00 AM to 7:29 AM | 125 (20.6%) | 77 (19.0%) |
| 7:30 AM to 7:59 AM | 13 (2.1%) | 35 (8.6%) |
| 8:00 AM to 8:29 AM | 6 (1.0%) | 122 (30.1%) |
| 8:30 AM to 8:59 AM | 17 (2.8%) | 0 (0.0%) |
| 9:00 AM to 9:59 AM | 36 (5.9%) | 18 (4.4%) |
| 10:00 AM to 10:59 AM | 47 (7.8%) | 0 (0.0%) |
| 11:00 AM to 11:59 AM | 0 (0.0%) | 0 (0.0%) |
| 12:00 PM to 3:59 PM | 21 (3.5%) | 13 (3.2%) |
| 4:00 PM to 11:59 PM | 28 (4.6%) | 25 (6.2%) |
| Total | 606 (100.0%) | 405 (100.0%) |
Housing Occupancy in Hartley
Occupancy by Ownership in Hartley
Of the total 1,013 dwellings in Hartley, owner-occupied units account for 762 (75.2%), while renter-occupied units make up 251 (24.8%).
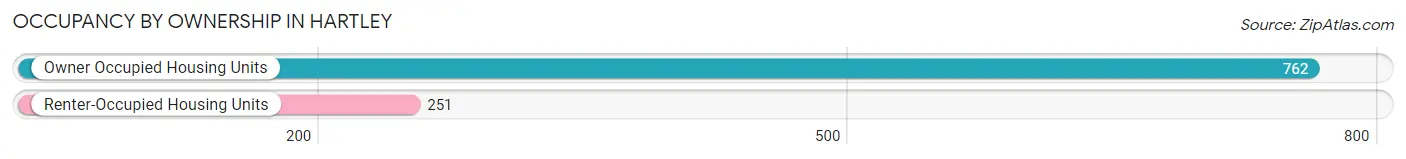
| Occupancy | # Housing Units | % Housing Units |
| Owner Occupied Housing Units | 762 | 75.2% |
| Renter-Occupied Housing Units | 251 | 24.8% |
| Total Occupied Housing Units | 1,013 | 100.0% |
Occupancy by Household Size in Hartley
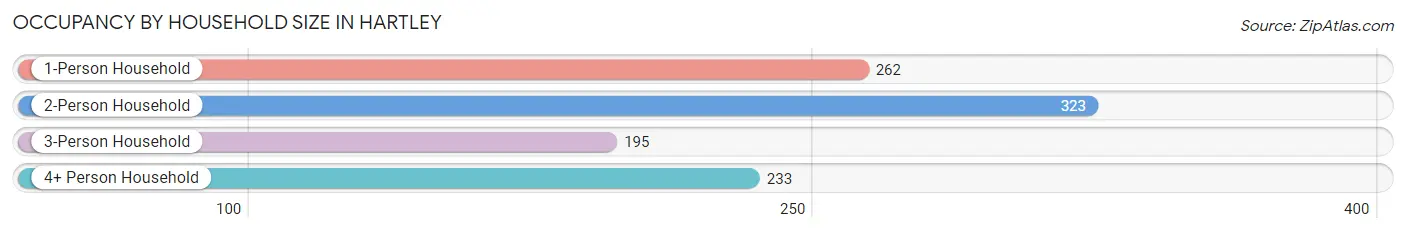
| Household Size | # Housing Units | % Housing Units |
| 1-Person Household | 262 | 25.9% |
| 2-Person Household | 323 | 31.9% |
| 3-Person Household | 195 | 19.3% |
| 4+ Person Household | 233 | 23.0% |
| Total Housing Units | 1,013 | 100.0% |
Occupancy by Ownership by Household Size in Hartley
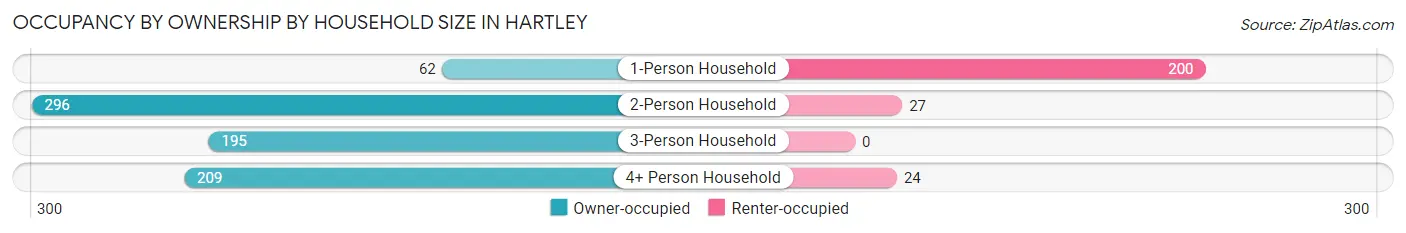
| Household Size | Owner-occupied | Renter-occupied |
| 1-Person Household | 62 (23.7%) | 200 (76.3%) |
| 2-Person Household | 296 (91.6%) | 27 (8.4%) |
| 3-Person Household | 195 (100.0%) | 0 (0.0%) |
| 4+ Person Household | 209 (89.7%) | 24 (10.3%) |
| Total Housing Units | 762 (75.2%) | 251 (24.8%) |
Occupancy by Educational Attainment in Hartley
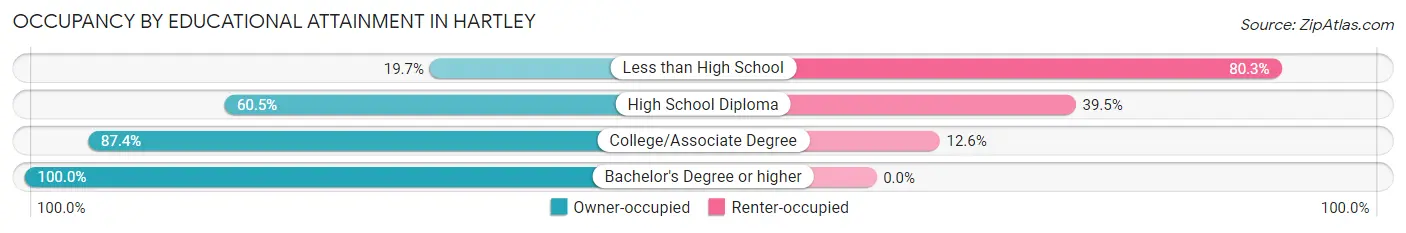
| Household Size | Owner-occupied | Renter-occupied |
| Less than High School | 24 (19.7%) | 98 (80.3%) |
| High School Diploma | 156 (60.5%) | 102 (39.5%) |
| College/Associate Degree | 355 (87.4%) | 51 (12.6%) |
| Bachelor's Degree or higher | 227 (100.0%) | 0 (0.0%) |
Occupancy by Age of Householder in Hartley
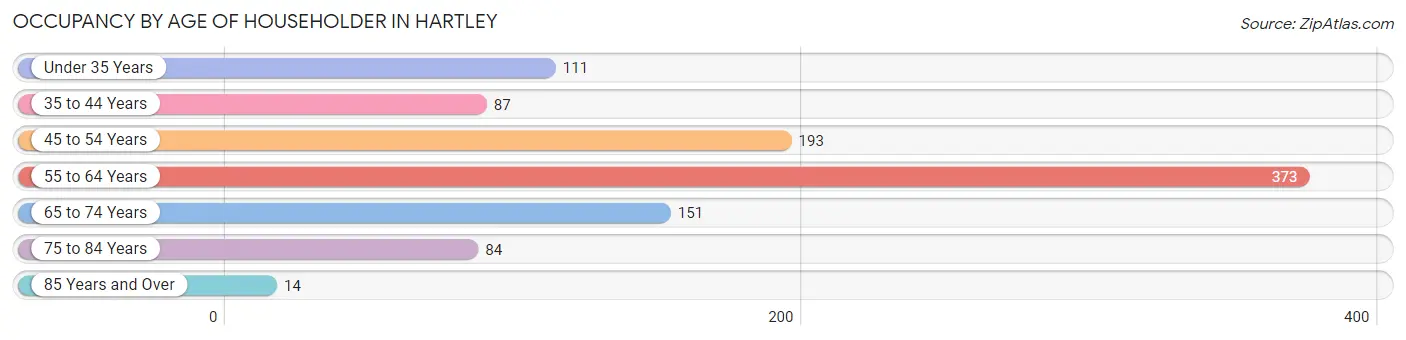
| Age Bracket | # Households | % Households |
| Under 35 Years | 111 | 11.0% |
| 35 to 44 Years | 87 | 8.6% |
| 45 to 54 Years | 193 | 19.1% |
| 55 to 64 Years | 373 | 36.8% |
| 65 to 74 Years | 151 | 14.9% |
| 75 to 84 Years | 84 | 8.3% |
| 85 Years and Over | 14 | 1.4% |
| Total | 1,013 | 100.0% |
Housing Finances in Hartley
Median Income by Occupancy in Hartley
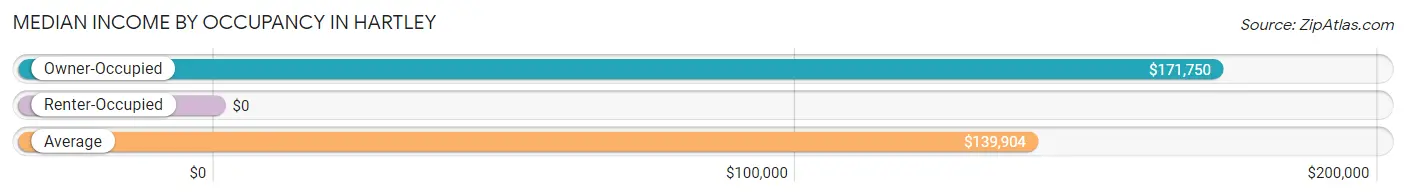
| Occupancy Type | # Households | Median Income |
| Owner-Occupied | 762 (75.2%) | $171,750 |
| Renter-Occupied | 251 (24.8%) | $0 |
| Average | 1,013 (100.0%) | $139,904 |
Occupancy by Householder Income Bracket in Hartley
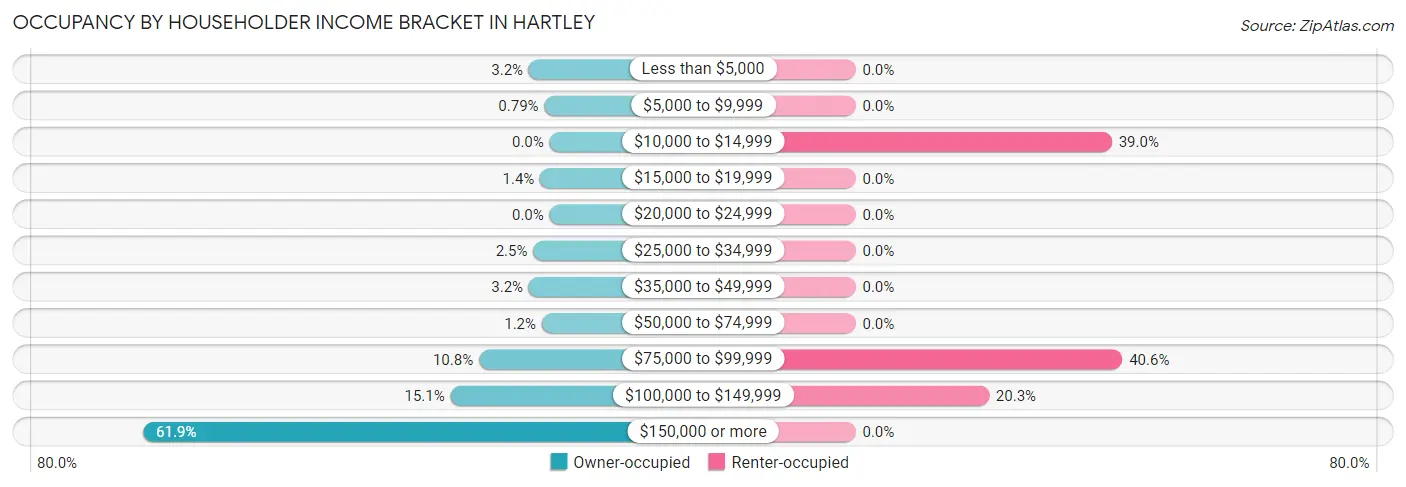
| Income Bracket | Owner-occupied | Renter-occupied |
| Less than $5,000 | 24 (3.2%) | 0 (0.0%) |
| $5,000 to $9,999 | 6 (0.8%) | 0 (0.0%) |
| $10,000 to $14,999 | 0 (0.0%) | 98 (39.0%) |
| $15,000 to $19,999 | 11 (1.4%) | 0 (0.0%) |
| $20,000 to $24,999 | 0 (0.0%) | 0 (0.0%) |
| $25,000 to $34,999 | 19 (2.5%) | 0 (0.0%) |
| $35,000 to $49,999 | 24 (3.2%) | 0 (0.0%) |
| $50,000 to $74,999 | 9 (1.2%) | 0 (0.0%) |
| $75,000 to $99,999 | 82 (10.8%) | 102 (40.6%) |
| $100,000 to $149,999 | 115 (15.1%) | 51 (20.3%) |
| $150,000 or more | 472 (61.9%) | 0 (0.0%) |
| Total | 762 (100.0%) | 251 (100.0%) |
Monthly Housing Cost Tiers in Hartley
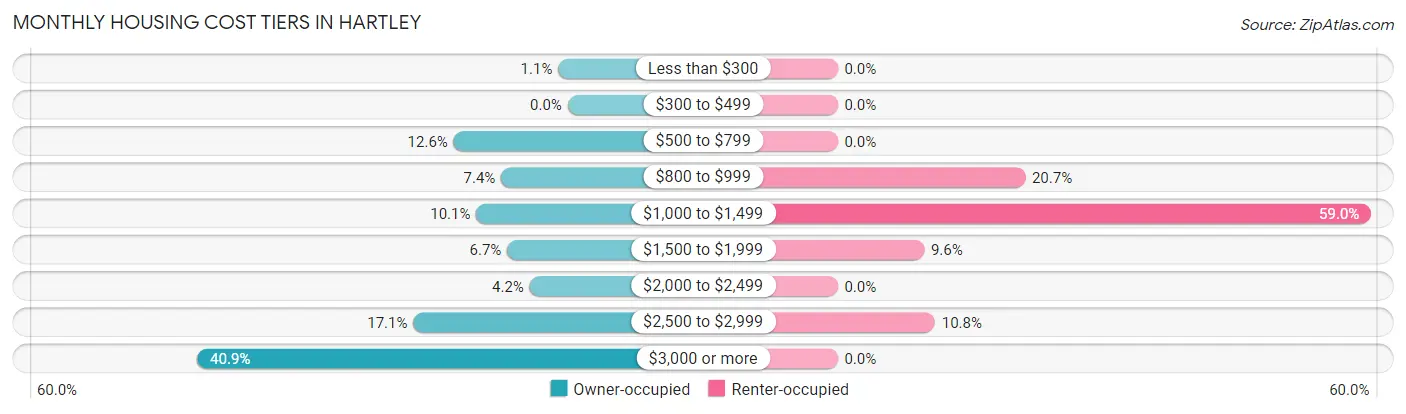
| Monthly Cost | Owner-occupied | Renter-occupied |
| Less than $300 | 8 (1.1%) | 0 (0.0%) |
| $300 to $499 | 0 (0.0%) | 0 (0.0%) |
| $500 to $799 | 96 (12.6%) | 0 (0.0%) |
| $800 to $999 | 56 (7.3%) | 52 (20.7%) |
| $1,000 to $1,499 | 77 (10.1%) | 148 (59.0%) |
| $1,500 to $1,999 | 51 (6.7%) | 24 (9.6%) |
| $2,000 to $2,499 | 32 (4.2%) | 0 (0.0%) |
| $2,500 to $2,999 | 130 (17.1%) | 27 (10.8%) |
| $3,000 or more | 312 (40.9%) | 0 (0.0%) |
| Total | 762 (100.0%) | 251 (100.0%) |
Physical Housing Characteristics in Hartley
Housing Structures in Hartley
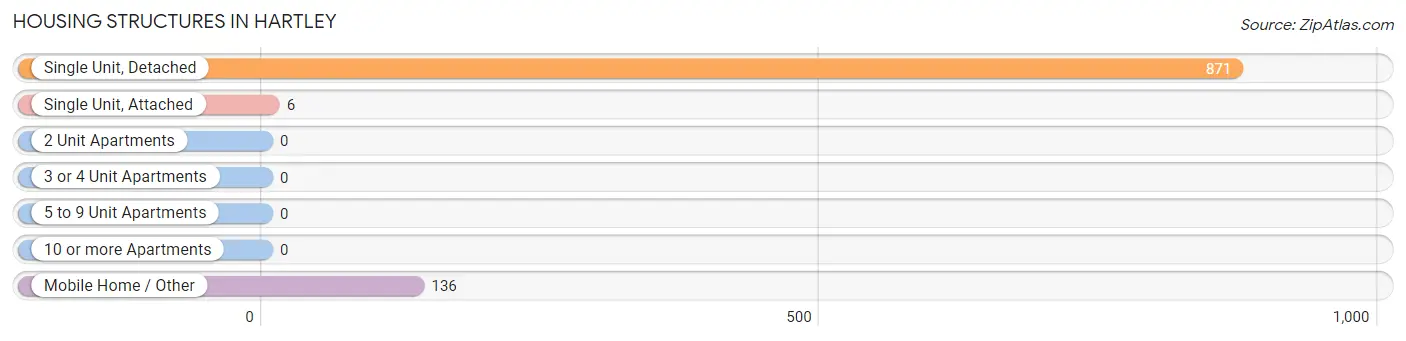
| Structure Type | # Housing Units | % Housing Units |
| Single Unit, Detached | 871 | 86.0% |
| Single Unit, Attached | 6 | 0.6% |
| 2 Unit Apartments | 0 | 0.0% |
| 3 or 4 Unit Apartments | 0 | 0.0% |
| 5 to 9 Unit Apartments | 0 | 0.0% |
| 10 or more Apartments | 0 | 0.0% |
| Mobile Home / Other | 136 | 13.4% |
| Total | 1,013 | 100.0% |
Housing Structures by Occupancy in Hartley
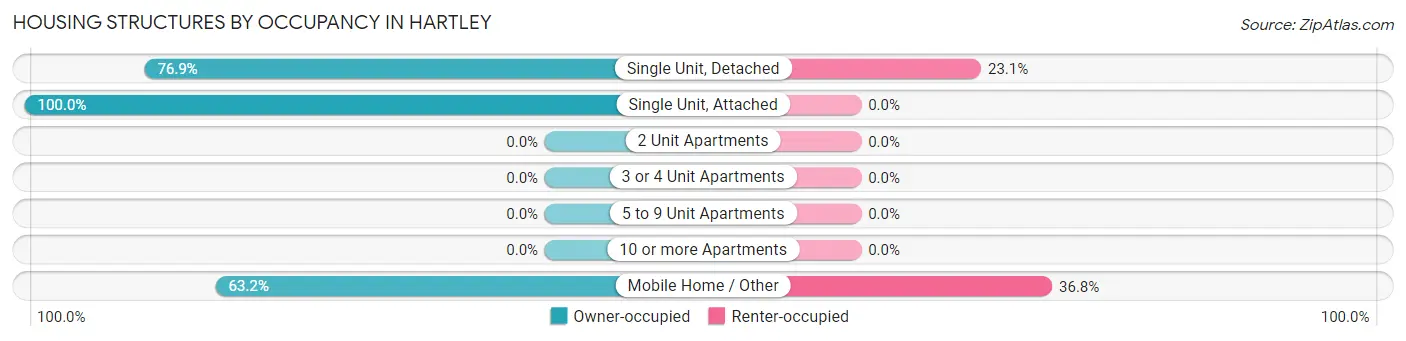
| Structure Type | Owner-occupied | Renter-occupied |
| Single Unit, Detached | 670 (76.9%) | 201 (23.1%) |
| Single Unit, Attached | 6 (100.0%) | 0 (0.0%) |
| 2 Unit Apartments | 0 (0.0%) | 0 (0.0%) |
| 3 or 4 Unit Apartments | 0 (0.0%) | 0 (0.0%) |
| 5 to 9 Unit Apartments | 0 (0.0%) | 0 (0.0%) |
| 10 or more Apartments | 0 (0.0%) | 0 (0.0%) |
| Mobile Home / Other | 86 (63.2%) | 50 (36.8%) |
| Total | 762 (75.2%) | 251 (24.8%) |
Housing Structures by Number of Rooms in Hartley
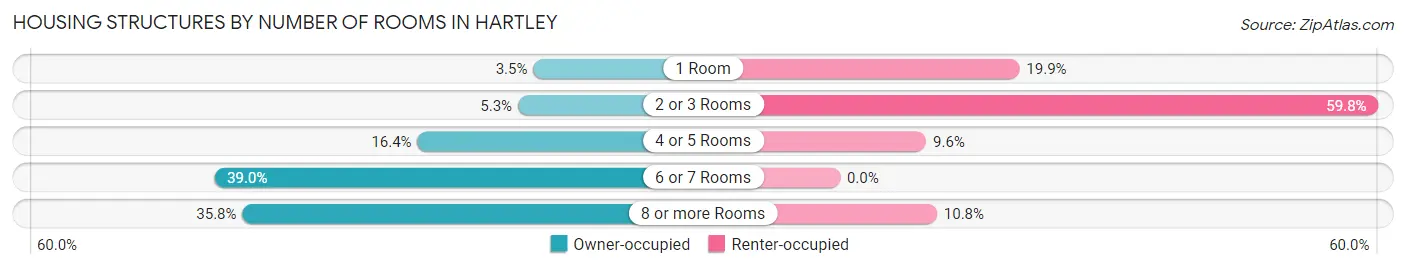
| Number of Rooms | Owner-occupied | Renter-occupied |
| 1 Room | 27 (3.5%) | 50 (19.9%) |
| 2 or 3 Rooms | 40 (5.2%) | 150 (59.8%) |
| 4 or 5 Rooms | 125 (16.4%) | 24 (9.6%) |
| 6 or 7 Rooms | 297 (39.0%) | 0 (0.0%) |
| 8 or more Rooms | 273 (35.8%) | 27 (10.8%) |
| Total | 762 (100.0%) | 251 (100.0%) |
Housing Structure by Heating Type in Hartley
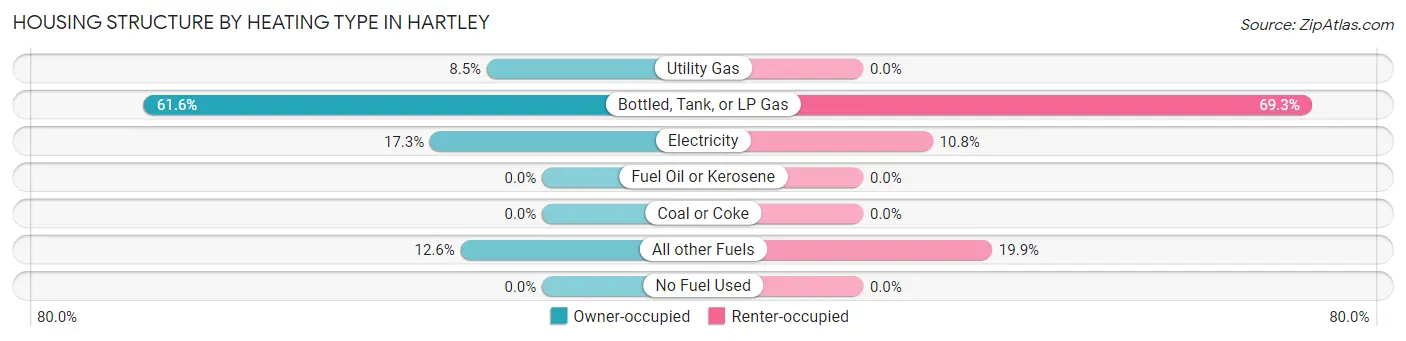
| Heating Type | Owner-occupied | Renter-occupied |
| Utility Gas | 65 (8.5%) | 0 (0.0%) |
| Bottled, Tank, or LP Gas | 469 (61.6%) | 174 (69.3%) |
| Electricity | 132 (17.3%) | 27 (10.8%) |
| Fuel Oil or Kerosene | 0 (0.0%) | 0 (0.0%) |
| Coal or Coke | 0 (0.0%) | 0 (0.0%) |
| All other Fuels | 96 (12.6%) | 50 (19.9%) |
| No Fuel Used | 0 (0.0%) | 0 (0.0%) |
| Total | 762 (100.0%) | 251 (100.0%) |
Household Vehicle Usage in Hartley
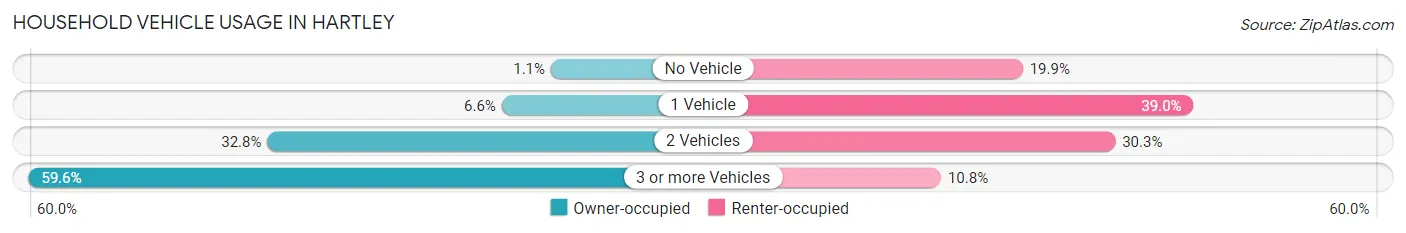
| Vehicles per Household | Owner-occupied | Renter-occupied |
| No Vehicle | 8 (1.1%) | 50 (19.9%) |
| 1 Vehicle | 50 (6.6%) | 98 (39.0%) |
| 2 Vehicles | 250 (32.8%) | 76 (30.3%) |
| 3 or more Vehicles | 454 (59.6%) | 27 (10.8%) |
| Total | 762 (100.0%) | 251 (100.0%) |
Real Estate & Mortgages in Hartley
Real Estate and Mortgage Overview in Hartley
| Characteristic | Without Mortgage | With Mortgage |
| Housing Units | 171 | 591 |
| Median Property Value | $1,103,900 | $814,800 |
| Median Household Income | $244,432 | $370 |
| Monthly Housing Costs | $1,206 | $296 |
| Real Estate Taxes | $6,410 | $33 |
Property Value by Mortgage Status in Hartley
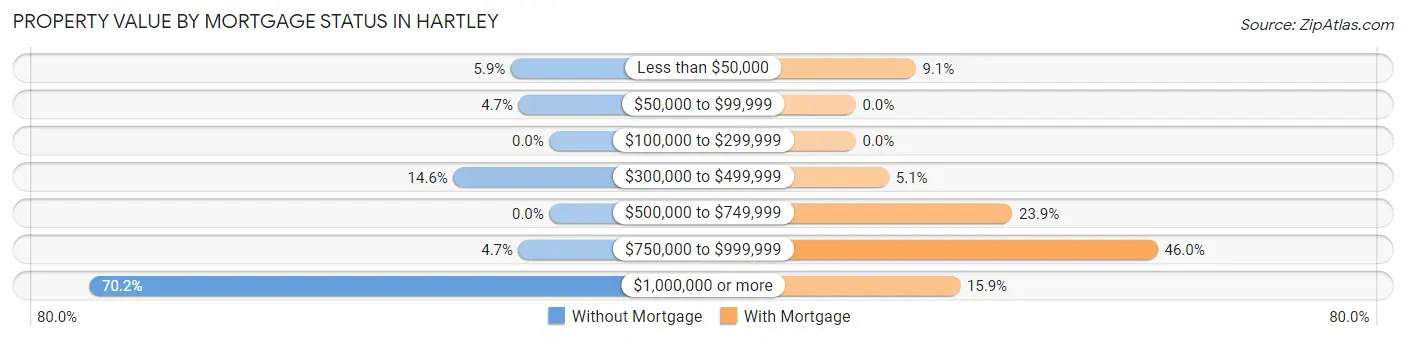
| Property Value | Without Mortgage | With Mortgage |
| Less than $50,000 | 10 (5.9%) | 54 (9.1%) |
| $50,000 to $99,999 | 8 (4.7%) | 0 (0.0%) |
| $100,000 to $299,999 | 0 (0.0%) | 0 (0.0%) |
| $300,000 to $499,999 | 25 (14.6%) | 30 (5.1%) |
| $500,000 to $749,999 | 0 (0.0%) | 141 (23.9%) |
| $750,000 to $999,999 | 8 (4.7%) | 272 (46.0%) |
| $1,000,000 or more | 120 (70.2%) | 94 (15.9%) |
| Total | 171 (100.0%) | 591 (100.0%) |
Household Income by Mortgage Status in Hartley
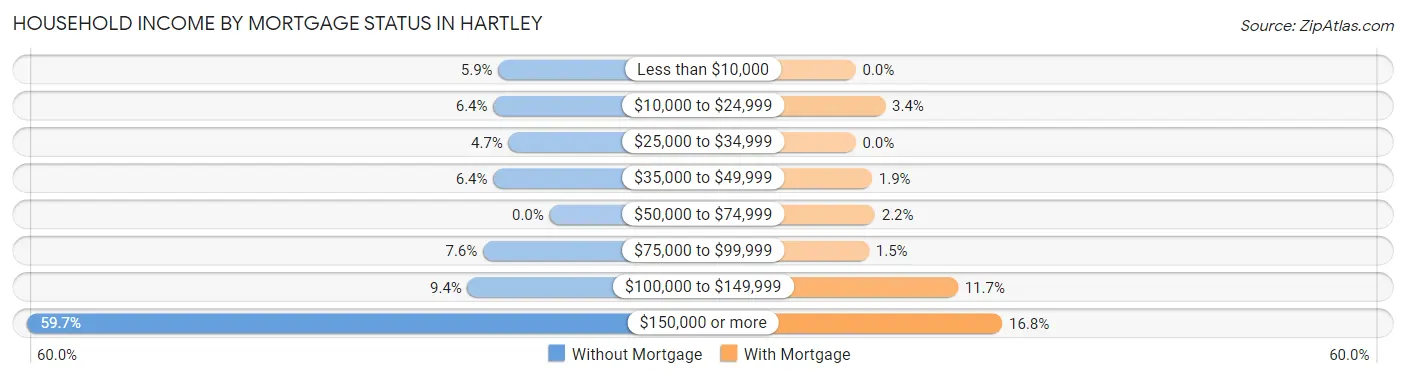
| Household Income | Without Mortgage | With Mortgage |
| Less than $10,000 | 10 (5.9%) | 0 (0.0%) |
| $10,000 to $24,999 | 11 (6.4%) | 20 (3.4%) |
| $25,000 to $34,999 | 8 (4.7%) | 0 (0.0%) |
| $35,000 to $49,999 | 11 (6.4%) | 11 (1.9%) |
| $50,000 to $74,999 | 0 (0.0%) | 13 (2.2%) |
| $75,000 to $99,999 | 13 (7.6%) | 9 (1.5%) |
| $100,000 to $149,999 | 16 (9.4%) | 69 (11.7%) |
| $150,000 or more | 102 (59.7%) | 99 (16.8%) |
| Total | 171 (100.0%) | 591 (100.0%) |
Property Value to Household Income Ratio in Hartley

| Value-to-Income Ratio | Without Mortgage | With Mortgage |
| Less than 2.0x | 0 (0.0%) | 171,325 (28,989.0%) |
| 2.0x to 2.9x | 45 (26.3%) | 54 (9.1%) |
| 3.0x to 3.9x | 3 (1.8%) | 48 (8.1%) |
| 4.0x or more | 123 (71.9%) | 116 (19.6%) |
| Total | 171 (100.0%) | 591 (100.0%) |
Real Estate Taxes by Mortgage Status in Hartley
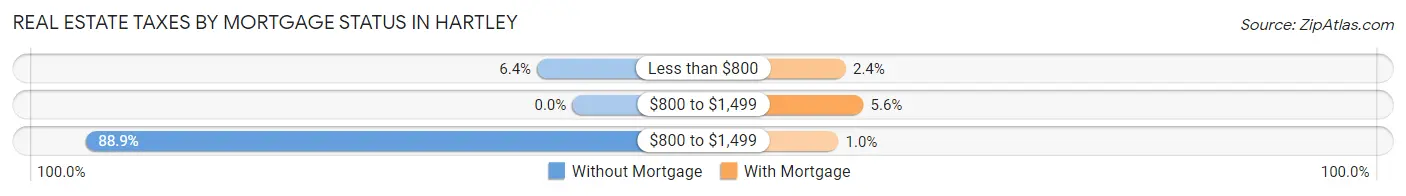
| Property Taxes | Without Mortgage | With Mortgage |
| Less than $800 | 11 (6.4%) | 14 (2.4%) |
| $800 to $1,499 | 0 (0.0%) | 33 (5.6%) |
| $800 to $1,499 | 152 (88.9%) | 6 (1.0%) |
| Total | 171 (100.0%) | 591 (100.0%) |
Health & Disability in Hartley
Health Insurance Coverage by Age in Hartley
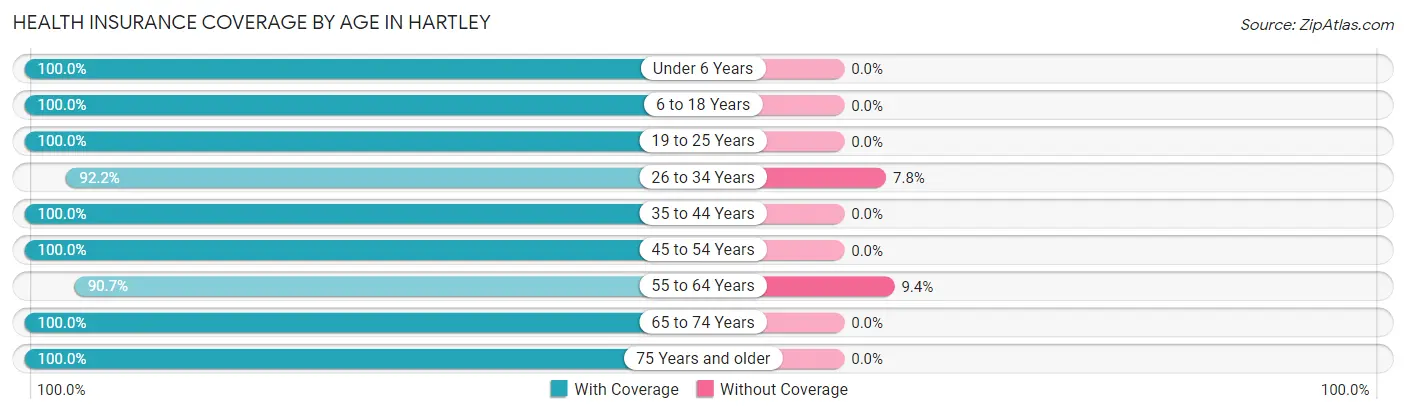
| Age Bracket | With Coverage | Without Coverage |
| Under 6 Years | 186 (100.0%) | 0 (0.0%) |
| 6 to 18 Years | 373 (100.0%) | 0 (0.0%) |
| 19 to 25 Years | 250 (100.0%) | 0 (0.0%) |
| 26 to 34 Years | 260 (92.2%) | 22 (7.8%) |
| 35 to 44 Years | 200 (100.0%) | 0 (0.0%) |
| 45 to 54 Years | 403 (100.0%) | 0 (0.0%) |
| 55 to 64 Years | 485 (90.6%) | 50 (9.3%) |
| 65 to 74 Years | 334 (100.0%) | 0 (0.0%) |
| 75 Years and older | 241 (100.0%) | 0 (0.0%) |
| Total | 2,732 (97.4%) | 72 (2.6%) |
Health Insurance Coverage by Citizenship Status in Hartley
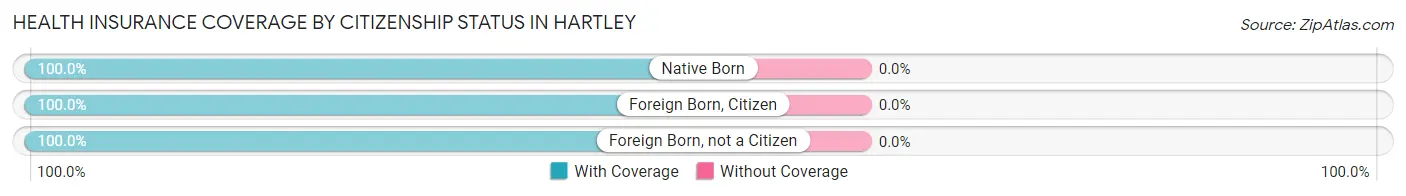
| Citizenship Status | With Coverage | Without Coverage |
| Native Born | 186 (100.0%) | 0 (0.0%) |
| Foreign Born, Citizen | 373 (100.0%) | 0 (0.0%) |
| Foreign Born, not a Citizen | 250 (100.0%) | 0 (0.0%) |
Health Insurance Coverage by Household Income in Hartley
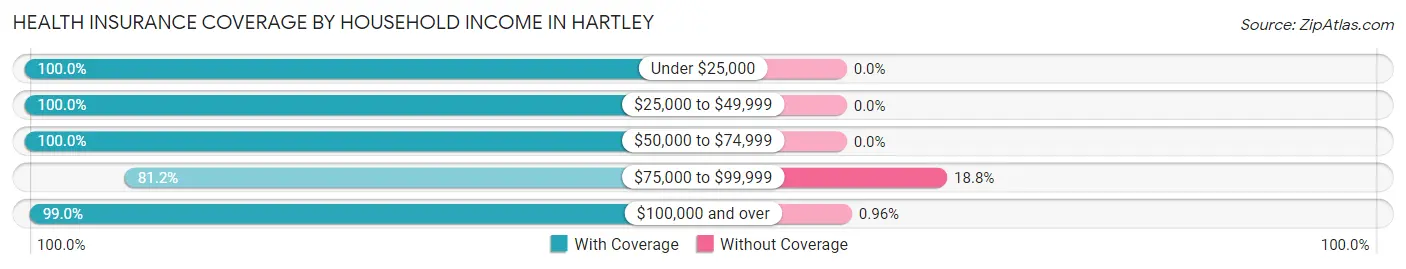
| Household Income | With Coverage | Without Coverage |
| Under $25,000 | 157 (100.0%) | 0 (0.0%) |
| $25,000 to $49,999 | 71 (100.0%) | 0 (0.0%) |
| $50,000 to $74,999 | 23 (100.0%) | 0 (0.0%) |
| $75,000 to $99,999 | 216 (81.2%) | 50 (18.8%) |
| $100,000 and over | 2,265 (99.0%) | 22 (1.0%) |
Public vs Private Health Insurance Coverage by Age in Hartley
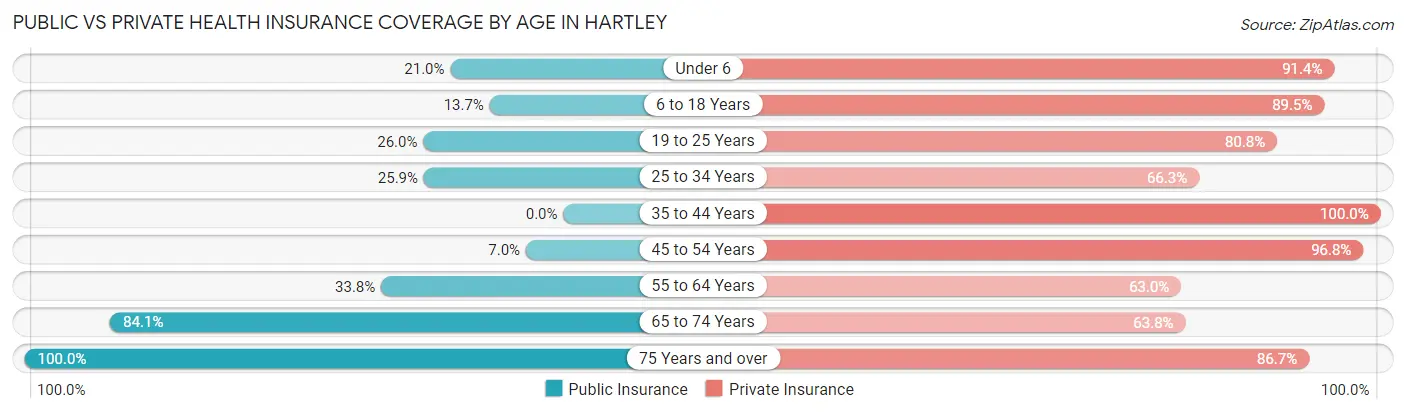
| Age Bracket | Public Insurance | Private Insurance |
| Under 6 | 39 (21.0%) | 170 (91.4%) |
| 6 to 18 Years | 51 (13.7%) | 334 (89.5%) |
| 19 to 25 Years | 65 (26.0%) | 202 (80.8%) |
| 25 to 34 Years | 73 (25.9%) | 187 (66.3%) |
| 35 to 44 Years | 0 (0.0%) | 200 (100.0%) |
| 45 to 54 Years | 28 (7.0%) | 390 (96.8%) |
| 55 to 64 Years | 181 (33.8%) | 337 (63.0%) |
| 65 to 74 Years | 281 (84.1%) | 213 (63.8%) |
| 75 Years and over | 241 (100.0%) | 209 (86.7%) |
| Total | 959 (34.2%) | 2,242 (80.0%) |
Disability Status by Sex by Age in Hartley
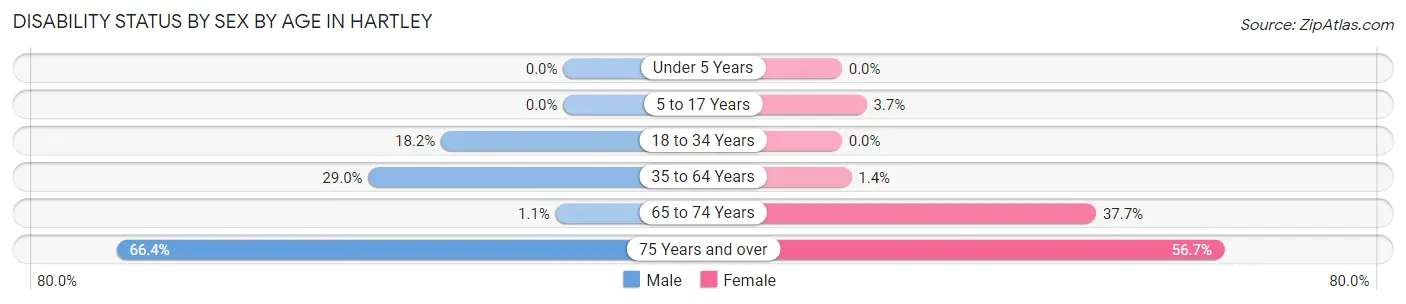
| Age Bracket | Male | Female |
| Under 5 Years | 0 (0.0%) | 0 (0.0%) |
| 5 to 17 Years | 0 (0.0%) | 6 (3.7%) |
| 18 to 34 Years | 49 (18.1%) | 0 (0.0%) |
| 35 to 64 Years | 207 (28.9%) | 6 (1.4%) |
| 65 to 74 Years | 2 (1.1%) | 60 (37.7%) |
| 75 Years and over | 71 (66.4%) | 76 (56.7%) |
Disability Class by Sex by Age in Hartley
Disability Class: Hearing Difficulty
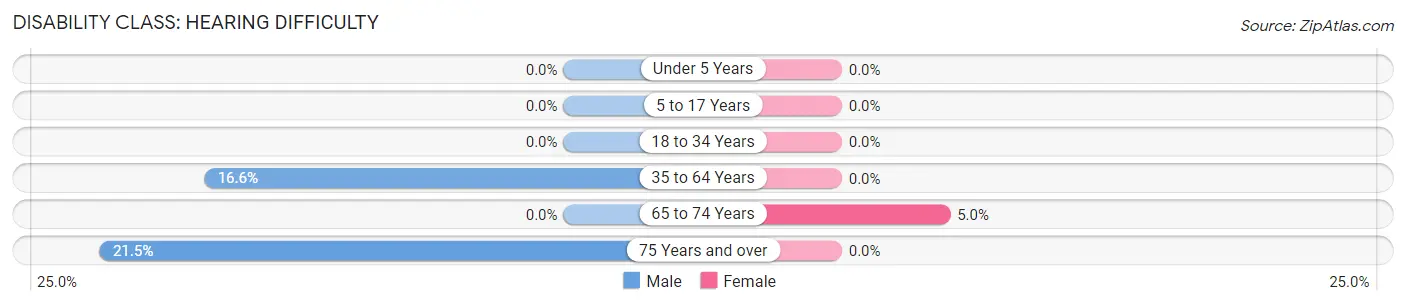
| Age Bracket | Male | Female |
| Under 5 Years | 0 (0.0%) | 0 (0.0%) |
| 5 to 17 Years | 0 (0.0%) | 0 (0.0%) |
| 18 to 34 Years | 0 (0.0%) | 0 (0.0%) |
| 35 to 64 Years | 119 (16.6%) | 0 (0.0%) |
| 65 to 74 Years | 0 (0.0%) | 8 (5.0%) |
| 75 Years and over | 23 (21.5%) | 0 (0.0%) |
Disability Class: Vision Difficulty
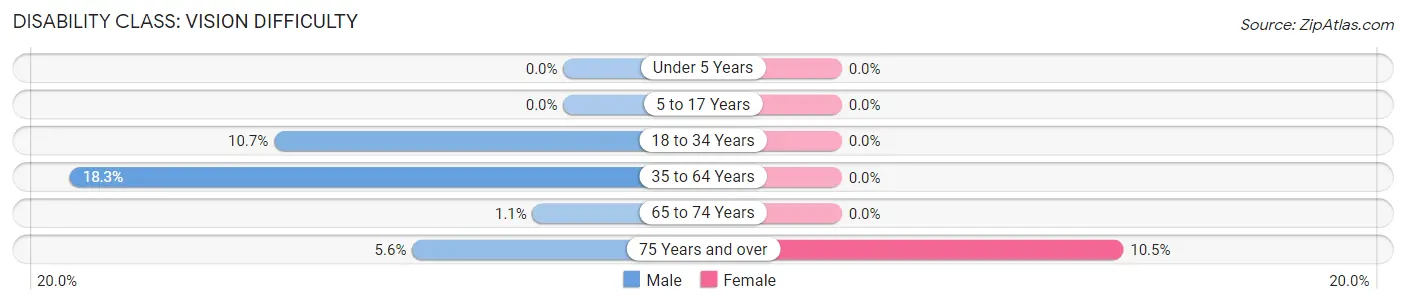
| Age Bracket | Male | Female |
| Under 5 Years | 0 (0.0%) | 0 (0.0%) |
| 5 to 17 Years | 0 (0.0%) | 0 (0.0%) |
| 18 to 34 Years | 29 (10.7%) | 0 (0.0%) |
| 35 to 64 Years | 131 (18.3%) | 0 (0.0%) |
| 65 to 74 Years | 2 (1.1%) | 0 (0.0%) |
| 75 Years and over | 6 (5.6%) | 14 (10.4%) |
Disability Class: Cognitive Difficulty
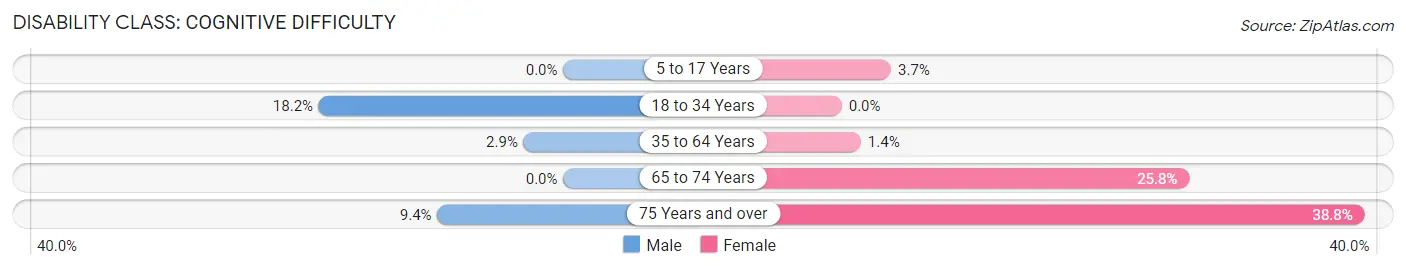
| Age Bracket | Male | Female |
| 5 to 17 Years | 0 (0.0%) | 6 (3.7%) |
| 18 to 34 Years | 49 (18.1%) | 0 (0.0%) |
| 35 to 64 Years | 21 (2.9%) | 6 (1.4%) |
| 65 to 74 Years | 0 (0.0%) | 41 (25.8%) |
| 75 Years and over | 10 (9.3%) | 52 (38.8%) |
Disability Class: Ambulatory Difficulty
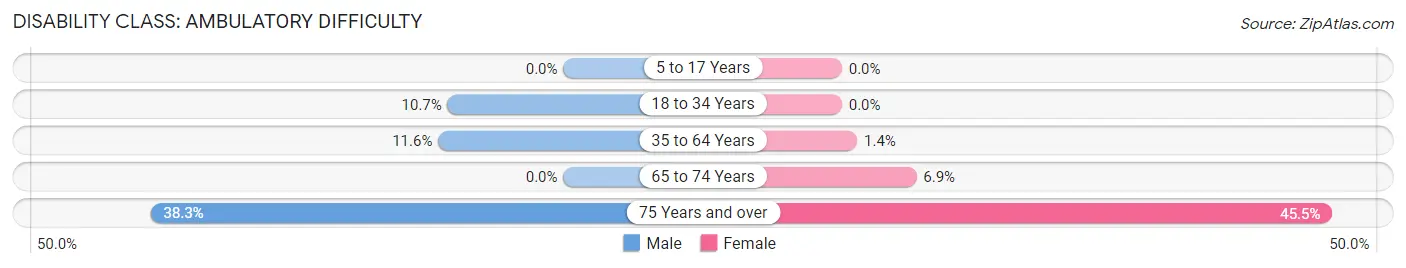
| Age Bracket | Male | Female |
| 5 to 17 Years | 0 (0.0%) | 0 (0.0%) |
| 18 to 34 Years | 29 (10.7%) | 0 (0.0%) |
| 35 to 64 Years | 83 (11.6%) | 6 (1.4%) |
| 65 to 74 Years | 0 (0.0%) | 11 (6.9%) |
| 75 Years and over | 41 (38.3%) | 61 (45.5%) |
Disability Class: Self-Care Difficulty
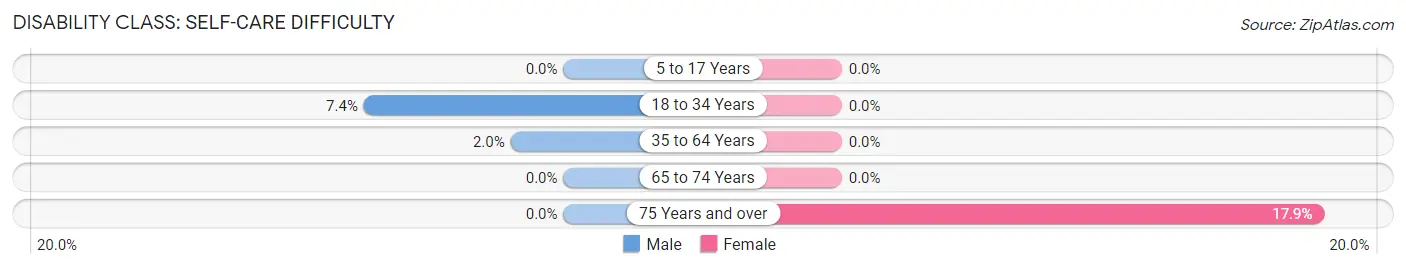
| Age Bracket | Male | Female |
| 5 to 17 Years | 0 (0.0%) | 0 (0.0%) |
| 18 to 34 Years | 20 (7.4%) | 0 (0.0%) |
| 35 to 64 Years | 14 (2.0%) | 0 (0.0%) |
| 65 to 74 Years | 0 (0.0%) | 0 (0.0%) |
| 75 Years and over | 0 (0.0%) | 24 (17.9%) |
Technology Access in Hartley
Computing Device Access in Hartley
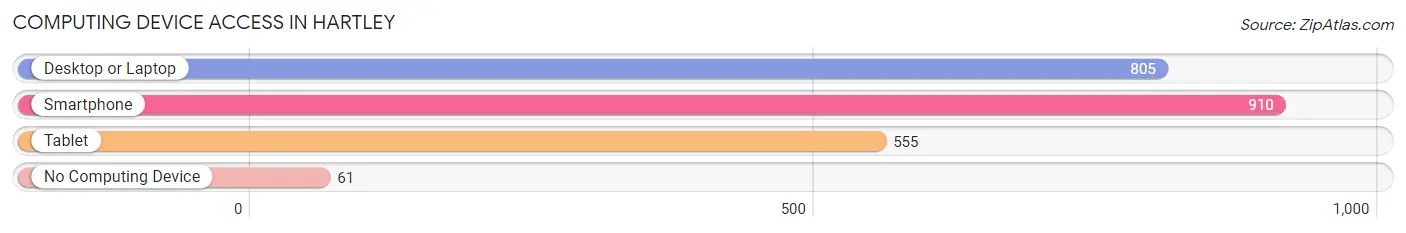
| Device Type | # Households | % Households |
| Desktop or Laptop | 805 | 79.5% |
| Smartphone | 910 | 89.8% |
| Tablet | 555 | 54.8% |
| No Computing Device | 61 | 6.0% |
| Total | 1,013 | 100.0% |
Internet Access in Hartley

| Internet Type | # Households | % Households |
| Dial-Up Internet | 0 | 0.0% |
| Broadband Home | 582 | 57.5% |
| Cellular Data Only | 118 | 11.7% |
| Satellite Internet | 220 | 21.7% |
| No Internet | 159 | 15.7% |
| Total | 1,013 | 100.0% |
Hartley Summary
Hartley, California is a small unincorporated community located in the northern part of San Diego County, California. It is situated in the foothills of the Palomar Mountains, approximately 25 miles northeast of the city of San Diego. The community is located in the 92082 zip code and is part of the San Diego-Carlsbad-San Marcos metropolitan area.
History
The area that is now Hartley was originally inhabited by the Luiseño people, who were part of the larger Kumeyaay Nation. The first European settlers arrived in the area in the late 19th century, and the town was officially founded in 1887. The town was named after the Hartley family, who were among the first settlers in the area.
The town grew slowly over the years, and by the mid-20th century, it had become a popular destination for tourists and outdoor enthusiasts. The town was also home to a number of small businesses, including a general store, a post office, and a gas station.
Geography
Hartley is located in the northern part of San Diego County, approximately 25 miles northeast of the city of San Diego. The town is situated in the foothills of the Palomar Mountains, and is surrounded by rolling hills and open space. The town is located at an elevation of approximately 2,000 feet above sea level.
The climate in Hartley is mild and temperate, with warm summers and cool winters. The average annual temperature is around 65 degrees Fahrenheit, and the average annual precipitation is around 15 inches.
Economy
The economy of Hartley is largely based on tourism and outdoor recreation. The town is home to a number of small businesses, including restaurants, cafes, and shops. The town is also home to a number of outdoor recreation businesses, including camping, fishing, and hiking.
The town is also home to a number of small farms and ranches, which produce a variety of crops and livestock. The town is also home to a number of wineries, which produce a variety of wines.
Demographics
As of the 2010 census, the population of Hartley was 1,845. The racial makeup of the town was 94.3% White, 0.7% African American, 0.3% Native American, 0.7% Asian, 0.1% Pacific Islander, 1.2% from other races, and 2.1% from two or more races. The median household income in Hartley was $50,938, and the median family income was $54,844.
The town is served by the San Diego County Sheriff's Department, and the San Diego County Fire Department. The town is also served by the San Diego County Library System, and the San Diego County Office of Education.
Common Questions
What is Per Capita Income in Hartley?
Per Capita income in Hartley is $54,604.
What is the Median Family Income in Hartley?
Median Family Income in Hartley is $172,900.
What is the Median Household income in Hartley?
Median Household Income in Hartley is $139,904.
What is Income or Wage Gap in Hartley?
Income or Wage Gap in Hartley is 5.5%.
Women in Hartley earn 94.5 cents for every dollar earned by a man.
What is Inequality or Gini Index in Hartley?
Inequality or Gini Index in Hartley is 0.38.
What is the Total Population of Hartley?
Total Population of Hartley is 2,807.
What is the Total Male Population of Hartley?
Total Male Population of Hartley is 1,621.
What is the Total Female Population of Hartley?
Total Female Population of Hartley is 1,186.
What is the Ratio of Males per 100 Females in Hartley?
There are 136.68 Males per 100 Females in Hartley.
What is the Ratio of Females per 100 Males in Hartley?
There are 73.16 Females per 100 Males in Hartley.
What is the Median Population Age in Hartley?
Median Population Age in Hartley is 48.5 Years.
What is the Average Family Size in Hartley
Average Family Size in Hartley is 3.2 People.
What is the Average Household Size in Hartley
Average Household Size in Hartley is 2.8 People.
How Large is the Labor Force in Hartley?
There are 1,266 People in the Labor Forcein in Hartley.
What is the Percentage of People in the Labor Force in Hartley?
55.3% of People are in the Labor Force in Hartley.
What is the Unemployment Rate in Hartley?
Unemployment Rate in Hartley is 1.7%.