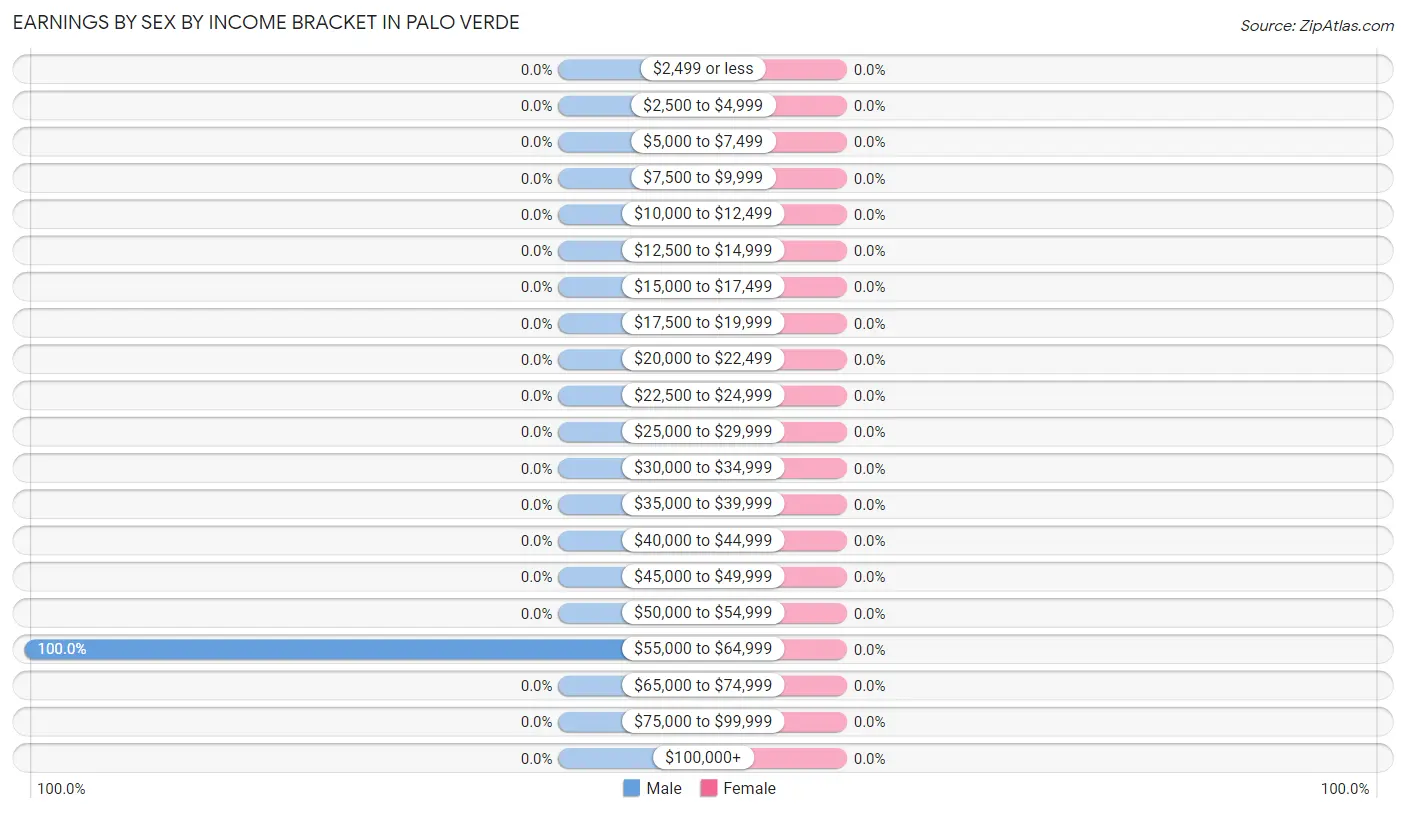
Earnings by Sex by Educational Attainment in Palo Verde
Educational Attainment
Male Income
Female Income
Less than High School
-
-
High School Diploma
-
-
College or Associate's Degree
-
-
Bachelor's Degree
-
-
Graduate Degree
-
-
Total
-
-
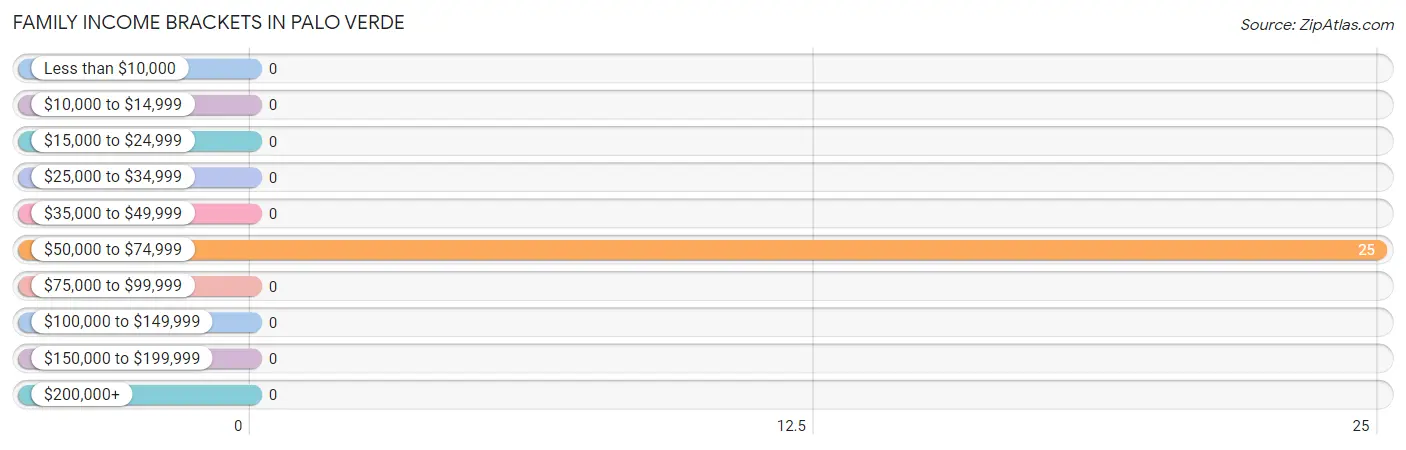
Family Income in Palo Verde
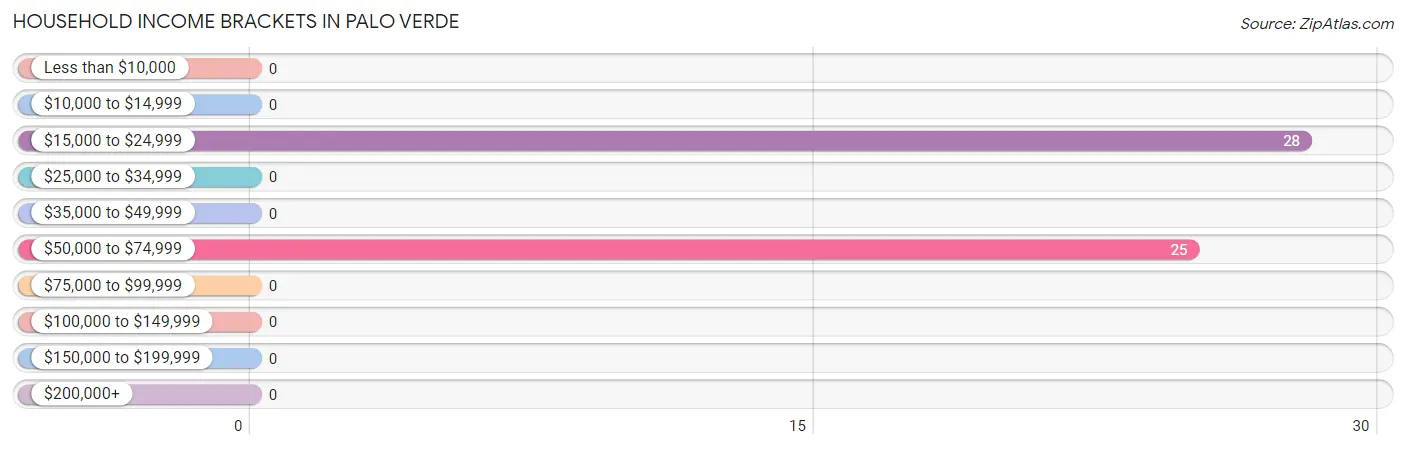
Family Income Brackets in Palo Verde
According to the Palo Verde family income data, there are 25 families falling into the $50,000 to $74,999 income range, which is the most common income bracket and makes up 100.0% of all families.
Income Bracket
# Families
% Families
Less than $10,000
0
0.0%
$10,000 to $14,999
0
0.0%
$15,000 to $24,999
0
0.0%
$25,000 to $34,999
0
0.0%
$35,000 to $49,999
0
0.0%
$50,000 to $74,999
25
100.0%
$75,000 to $99,999
0
0.0%
$100,000 to $149,999
0
0.0%
$150,000 to $199,999
0
0.0%
$200,000+
0
0.0%
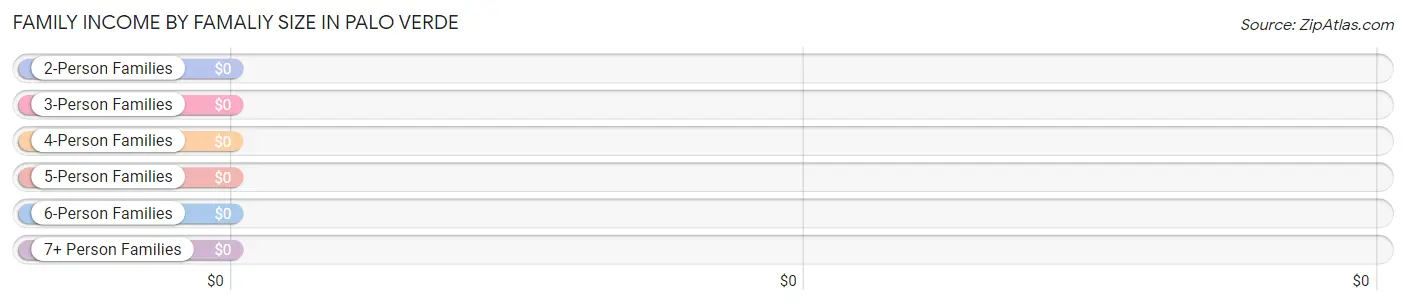
Family Income by Famaliy Size in Palo Verde
Income Bracket
# Families
Median Income
2-Person Families
25 (100.0%)
$0
3-Person Families
0 (0.0%)
$0
4-Person Families
0 (0.0%)
$0
5-Person Families
0 (0.0%)
$0
6-Person Families
0 (0.0%)
$0
7+ Person Families
0 (0.0%)
$0
Total
25 (100.0%)
$0
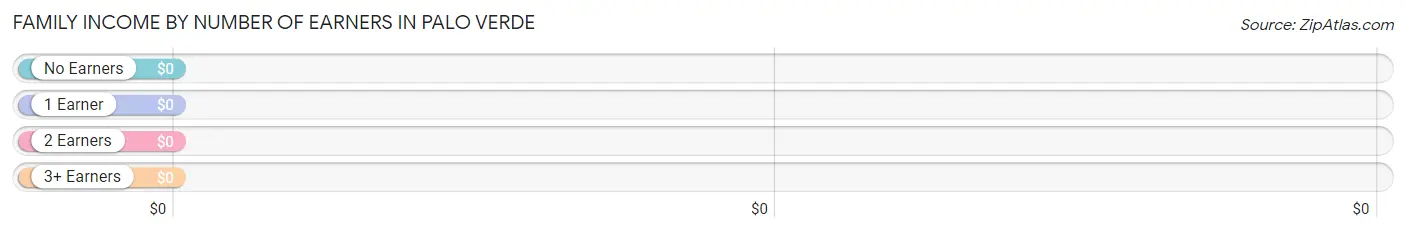
Family Income by Number of Earners in Palo Verde
Number of Earners
# Families
Median Income
No Earners
0 (0.0%)
$0
1 Earner
25 (100.0%)
$0
2 Earners
0 (0.0%)
$0
3+ Earners
0 (0.0%)
$0
Total
25 (100.0%)
$0
Household Income in Palo Verde
Household Income Brackets in Palo Verde
With 28 households falling in the category, the $15,000 to $24,999 income range is the most frequent in Palo Verde, accounting for 52.8% of all households.
Income Bracket
# Households
% Households
Less than $10,000
0
0.0%
$10,000 to $14,999
0
0.0%
$15,000 to $24,999
28
52.8%
$25,000 to $34,999
0
0.0%
$35,000 to $49,999
0
0.0%
$50,000 to $74,999
25
47.2%
$75,000 to $99,999
0
0.0%
$100,000 to $149,999
0
0.0%
$150,000 to $199,999
0
0.0%
$200,000+
0
0.0%
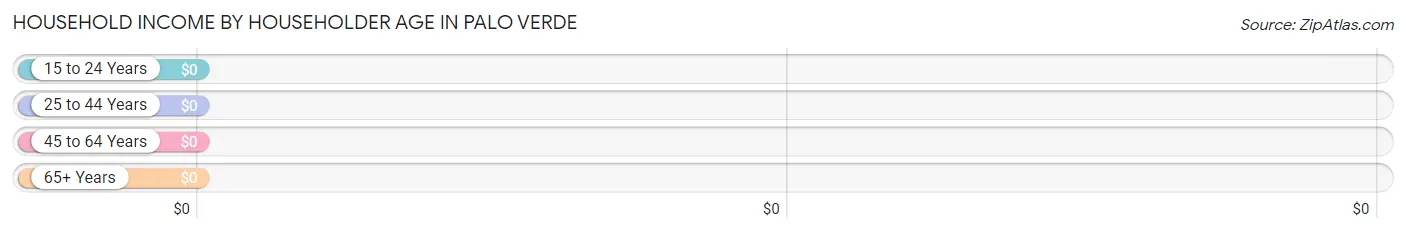
Household Income by Householder Age in Palo Verde
Income Bracket
# Households
Median Income
15 to 24 Years
0 (0.0%)
$0
25 to 44 Years
0 (0.0%)
$0
45 to 64 Years
25 (47.2%)
$0
65+ Years
28 (52.8%)
$0
Total
53 (100.0%)
$0
Poverty in Palo Verde
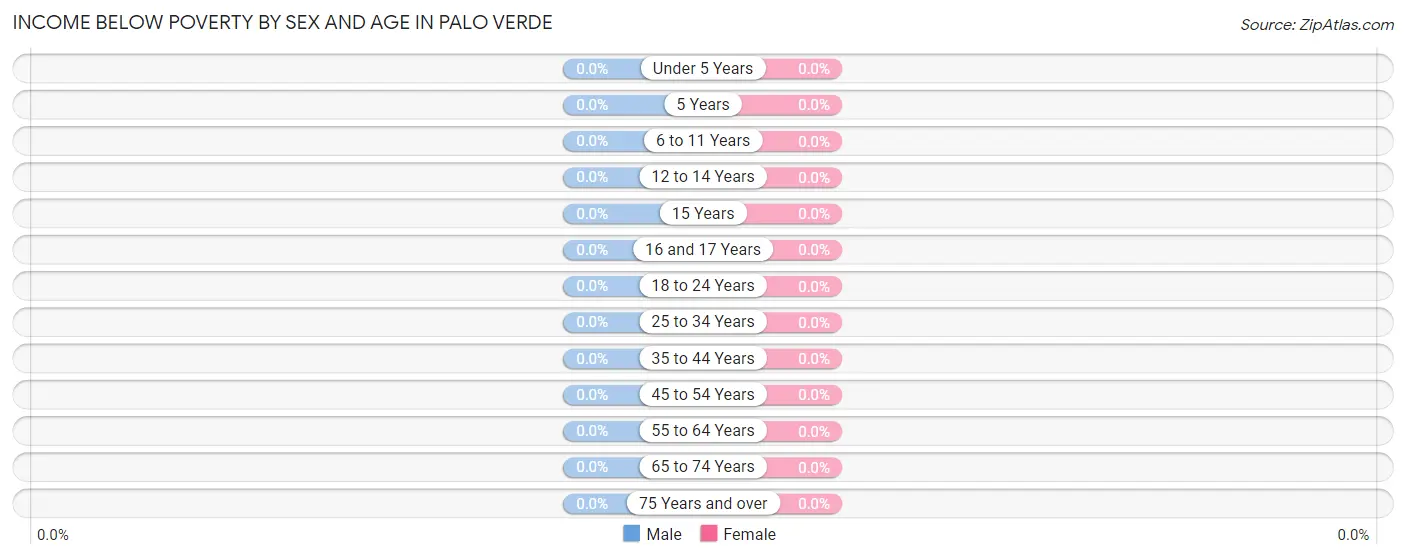
Income Below Poverty by Sex and Age in Palo Verde
Age Bracket
Male
Female
Under 5 Years
0 (0.0%)
0 (0.0%)
5 Years
0 (0.0%)
0 (0.0%)
6 to 11 Years
0 (0.0%)
0 (0.0%)
12 to 14 Years
0 (0.0%)
0 (0.0%)
15 Years
0 (0.0%)
0 (0.0%)
16 and 17 Years
0 (0.0%)
0 (0.0%)
18 to 24 Years
0 (0.0%)
0 (0.0%)
25 to 34 Years
0 (0.0%)
0 (0.0%)
35 to 44 Years
0 (0.0%)
0 (0.0%)
45 to 54 Years
0 (0.0%)
0 (0.0%)
55 to 64 Years
0 (0.0%)
0 (0.0%)
65 to 74 Years
0 (0.0%)
0 (0.0%)
75 Years and over
0 (0.0%)
0 (0.0%)
Total
0 (0.0%)
0 (0.0%)
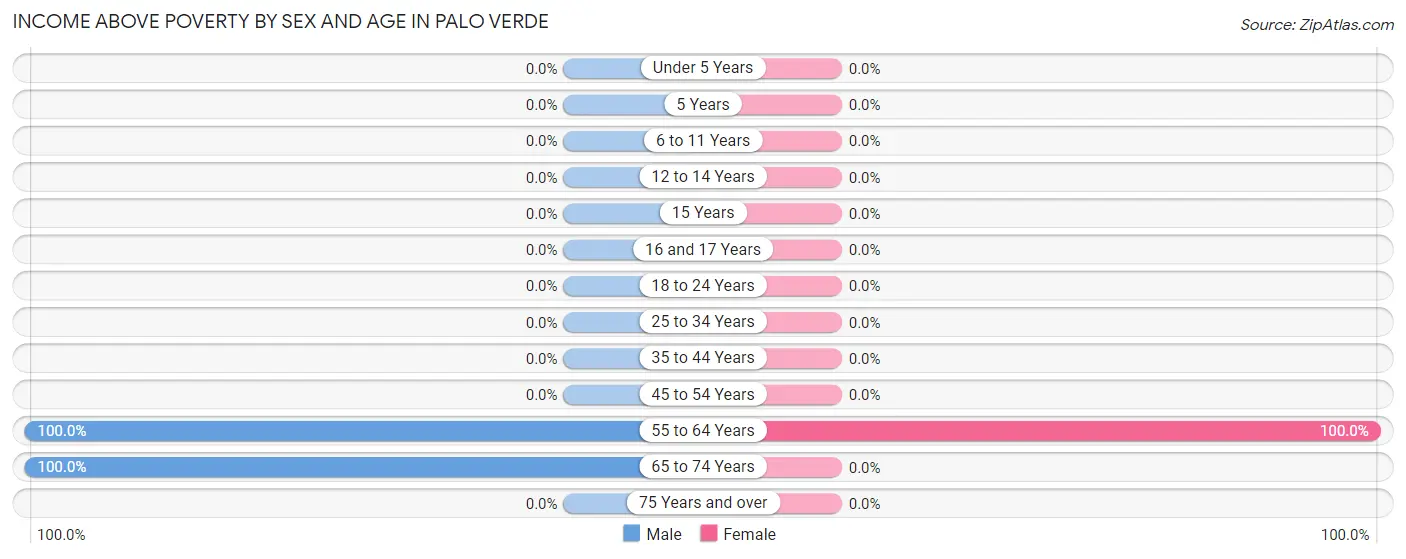
Income Above Poverty by Sex and Age in Palo Verde
According to the poverty statistics in Palo Verde, males aged 55 to 64 years and females aged 55 to 64 years are the age groups that are most secure financially, with 100.0% of males and 100.0% of females in these age groups living above the poverty line.
Age Bracket
Male
Female
Under 5 Years
0 (0.0%)
0 (0.0%)
5 Years
0 (0.0%)
0 (0.0%)
6 to 11 Years
0 (0.0%)
0 (0.0%)
12 to 14 Years
0 (0.0%)
0 (0.0%)
15 Years
0 (0.0%)
0 (0.0%)
16 and 17 Years
0 (0.0%)
0 (0.0%)
18 to 24 Years
0 (0.0%)
0 (0.0%)
25 to 34 Years
0 (0.0%)
0 (0.0%)
35 to 44 Years
0 (0.0%)
0 (0.0%)
45 to 54 Years
0 (0.0%)
0 (0.0%)
55 to 64 Years
28 (100.0%)
25 (100.0%)
65 to 74 Years
28 (100.0%)
0 (0.0%)
75 Years and over
0 (0.0%)
0 (0.0%)
Total
56 (100.0%)
25 (100.0%)
Income Below Poverty Among Married-Couple Families in Palo Verde
Children
Above Poverty
Below Poverty
No Children
25 (100.0%)
0 (0.0%)
1 or 2 Children
0 (0.0%)
0 (0.0%)
3 or 4 Children
0 (0.0%)
0 (0.0%)
5 or more Children
0 (0.0%)
0 (0.0%)
Total
25 (100.0%)
0 (0.0%)
Income Below Poverty Among Single-Parent Households in Palo Verde
Children
Single Father
Single Mother
No Children
0 (0.0%)
0 (0.0%)
1 or 2 Children
0 (0.0%)
0 (0.0%)
3 or 4 Children
0 (0.0%)
0 (0.0%)
5 or more Children
0 (0.0%)
0 (0.0%)
Total
0 (0.0%)
0 (0.0%)
Income Below Poverty Among Married-Couple vs Single-Parent Households in Palo Verde
Children
Married-Couple Families
Single-Parent Households
No Children
0 (0.0%)
0 (0.0%)
1 or 2 Children
0 (0.0%)
0 (0.0%)
3 or 4 Children
0 (0.0%)
0 (0.0%)
5 or more Children
0 (0.0%)
0 (0.0%)
Total
0 (0.0%)
0 (0.0%)
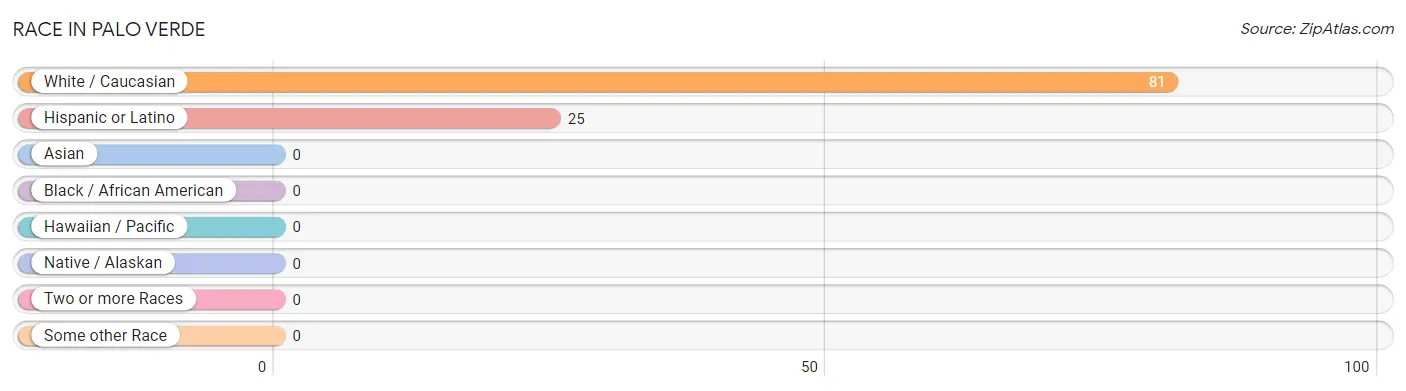
Race in Palo Verde
The most populous races in Palo Verde are White / Caucasian (81 | 100.0%), and Hispanic or Latino (25 | 30.9%).
Race
# Population
% Population
Asian
0
0.0%
Black / African American
0
0.0%
Hawaiian / Pacific
0
0.0%
Hispanic or Latino
25
30.9%
Native / Alaskan
0
0.0%
White / Caucasian
81
100.0%
Two or more Races
0
0.0%
Some other Race
0
0.0%
Total
81
100.0%
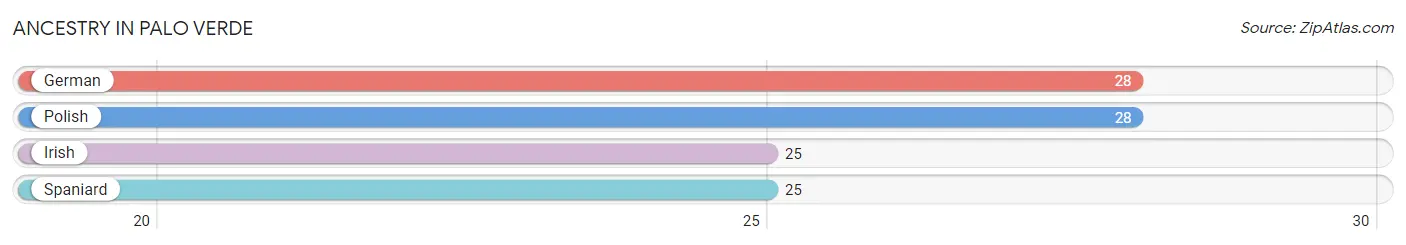
Ancestry in Palo Verde
The most populous ancestries reported in Palo Verde are German (28 | 34.6%), Polish (28 | 34.6%), Irish (25 | 30.9%), and Spaniard (25 | 30.9%), together accounting for 130.9% of all Palo Verde residents.
Ancestry
# Population
% Population
German
28
34.6%
Irish
25
30.9%
Polish
28
34.6%
Spaniard
25
30.9%
View All 4 Rows
Immigrants in Palo Verde
Immigration Origin
# Population
% Population
View All 0 Rows
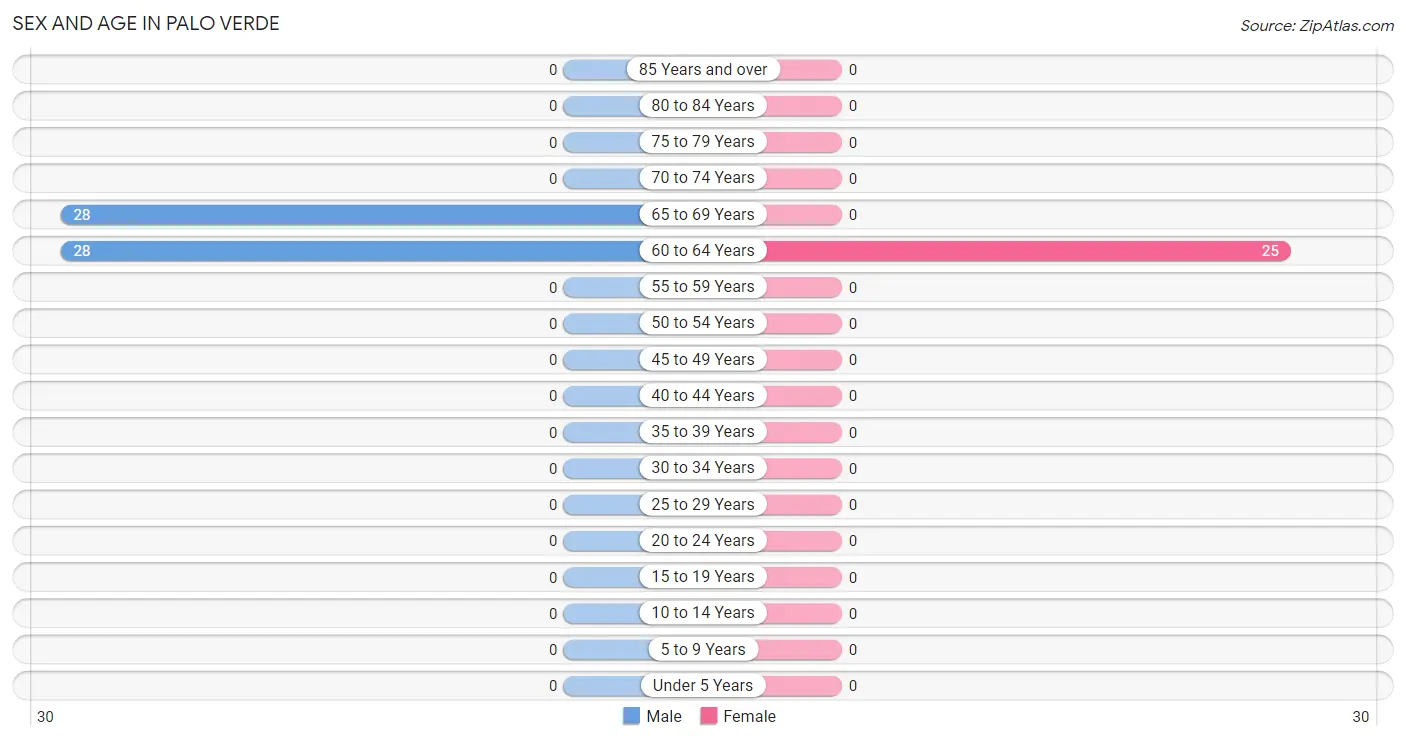
Sex and Age in Palo Verde
Sex and Age in Palo Verde
The most populous age groups in Palo Verde are 60 to 64 Years (28 | 50.0%) for men and 60 to 64 Years (25 | 100.0%) for women.
Age Bracket
Male
Female
Under 5 Years
0 (0.0%)
0 (0.0%)
5 to 9 Years
0 (0.0%)
0 (0.0%)
10 to 14 Years
0 (0.0%)
0 (0.0%)
15 to 19 Years
0 (0.0%)
0 (0.0%)
20 to 24 Years
0 (0.0%)
0 (0.0%)
25 to 29 Years
0 (0.0%)
0 (0.0%)
30 to 34 Years
0 (0.0%)
0 (0.0%)
35 to 39 Years
0 (0.0%)
0 (0.0%)
40 to 44 Years
0 (0.0%)
0 (0.0%)
45 to 49 Years
0 (0.0%)
0 (0.0%)
50 to 54 Years
0 (0.0%)
0 (0.0%)
55 to 59 Years
0 (0.0%)
0 (0.0%)
60 to 64 Years
28 (50.0%)
25 (100.0%)
65 to 69 Years
28 (50.0%)
0 (0.0%)
70 to 74 Years
0 (0.0%)
0 (0.0%)
75 to 79 Years
0 (0.0%)
0 (0.0%)
80 to 84 Years
0 (0.0%)
0 (0.0%)
85 Years and over
0 (0.0%)
0 (0.0%)
Total
56 (100.0%)
25 (100.0%)
Families and Households in Palo Verde
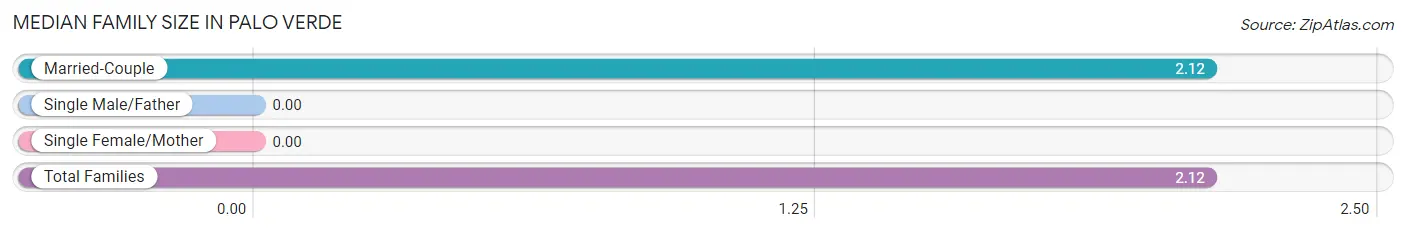
Median Family Size in Palo Verde
Family Type
# Families
Family Size
Married-Couple
25 (100.0%)
2.12
Single Male/Father
0 (0.0%)
-
Single Female/Mother
0 (0.0%)
-
Total Families
25 (100.0%)
2.12
Median Household Size in Palo Verde
Household Type
# Households
Household Size
Married-Couple
25 (47.2%)
2.12
Single Male/Father
0 (0.0%)
-
Single Female/Mother
0 (0.0%)
-
Non-family
28 (52.8%)
-
Total Households
53 (100.0%)
1.53
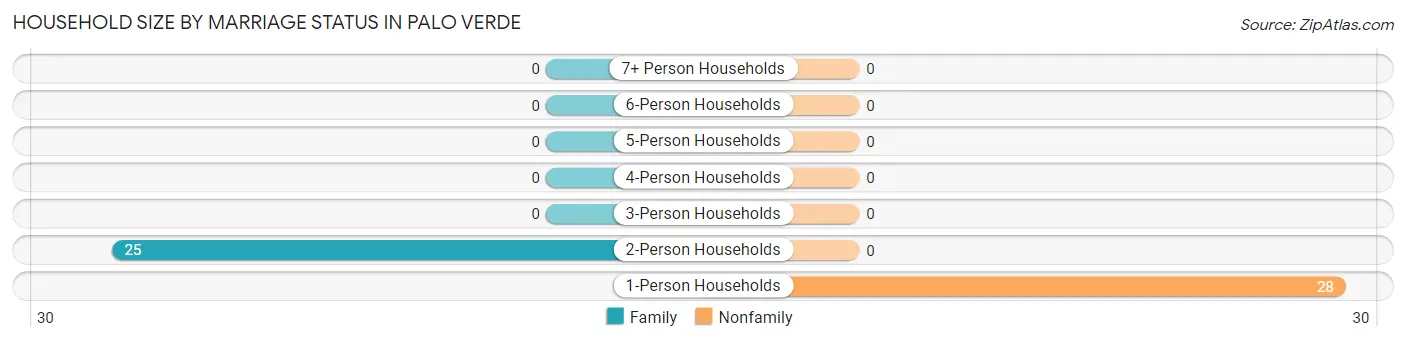
Household Size by Marriage Status in Palo Verde
Out of a total of 53 households in Palo Verde, 25 (47.2%) are family households, while 28 (52.8%) are nonfamily households. The most numerous type of family households are 2-person households, comprising 25, and the most common type of nonfamily households are 1-person households, comprising 28.
Household Size
Family Households
Nonfamily Households
1-Person Households
-
28 (52.8%)
2-Person Households
25 (47.2%)
0 (0.0%)
3-Person Households
0 (0.0%)
0 (0.0%)
4-Person Households
0 (0.0%)
0 (0.0%)
5-Person Households
0 (0.0%)
0 (0.0%)
6-Person Households
0 (0.0%)
0 (0.0%)
7+ Person Households
0 (0.0%)
0 (0.0%)
Total
25 (47.2%)
28 (52.8%)
Female Fertility in Palo Verde
Fertility by Age in Palo Verde
Age Bracket
Women with Births
Births / 1,000 Women
15 to 19 years
0 (0.0%)
0.0
20 to 34 years
0 (0.0%)
0.0
35 to 50 years
0 (0.0%)
0.0
Total
0 (0.0%)
0.0
Fertility by Age by Marriage Status in Palo Verde
Age Bracket
Married
Unmarried
15 to 19 years
0 (0.0%)
0 (0.0%)
20 to 34 years
0 (0.0%)
0 (0.0%)
35 to 50 years
0 (0.0%)
0 (0.0%)
Total
0 (0.0%)
0 (0.0%)
Fertility by Education in Palo Verde
Educational Attainment
Women with Births
Births / 1,000 Women
Less than High School
0 (0.0%)
0.0
High School Diploma
0 (0.0%)
0.0
College or Associate's Degree
0 (0.0%)
0.0
Bachelor's Degree
0 (0.0%)
0.0
Graduate Degree
0 (0.0%)
0.0
Total
0 (0.0%)
0.0
Fertility by Education by Marriage Status in Palo Verde
Educational Attainment
Married
Unmarried
Less than High School
0 (0.0%)
0 (0.0%)
High School Diploma
0 (0.0%)
0 (0.0%)
College or Associate's Degree
0 (0.0%)
0 (0.0%)
Bachelor's Degree
0 (0.0%)
0 (0.0%)
Graduate Degree
0 (0.0%)
0 (0.0%)
Total
0 (0.0%)
0 (0.0%)
Employment Characteristics in Palo Verde
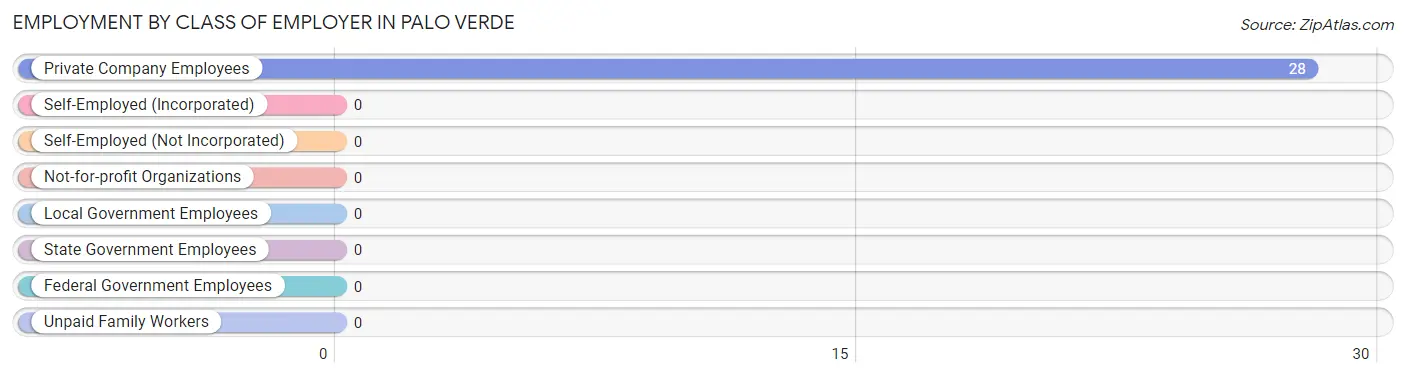
Employment by Class of Employer in Palo Verde
Among the 28 employed individuals in Palo Verde, , and private company employees (28 | 100.0%) make up the most common classes of employment.
Employer Class
# Employees
% Employees
Private Company Employees
28
100.0%
Self-Employed (Incorporated)
0
0.0%
Self-Employed (Not Incorporated)
0
0.0%
Not-for-profit Organizations
0
0.0%
Local Government Employees
0
0.0%
State Government Employees
0
0.0%
Federal Government Employees
0
0.0%
Unpaid Family Workers
0
0.0%
Total
28
100.0%
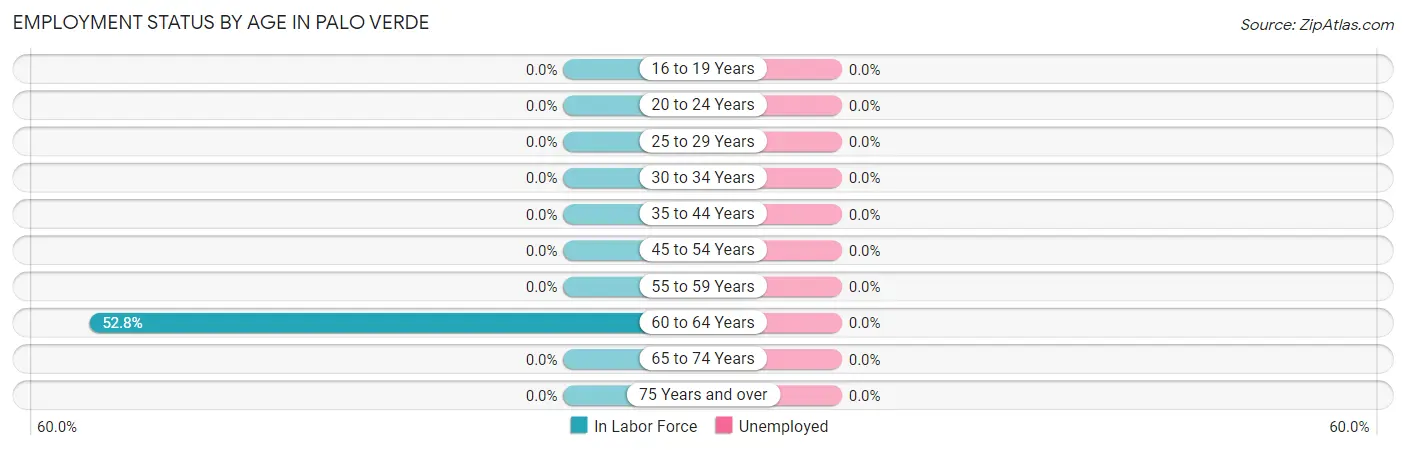
Employment Status by Age in Palo Verde
Age Bracket
In Labor Force
Unemployed
16 to 19 Years
0 (0.0%)
0 (0.0%)
20 to 24 Years
0 (0.0%)
0 (0.0%)
25 to 29 Years
0 (0.0%)
0 (0.0%)
30 to 34 Years
0 (0.0%)
0 (0.0%)
35 to 44 Years
0 (0.0%)
0 (0.0%)
45 to 54 Years
0 (0.0%)
0 (0.0%)
55 to 59 Years
0 (0.0%)
0 (0.0%)
60 to 64 Years
28 (52.8%)
0 (0.0%)
65 to 74 Years
0 (0.0%)
0 (0.0%)
75 Years and over
0 (0.0%)
0 (0.0%)
Total
28 (34.6%)
0 (0.0%)
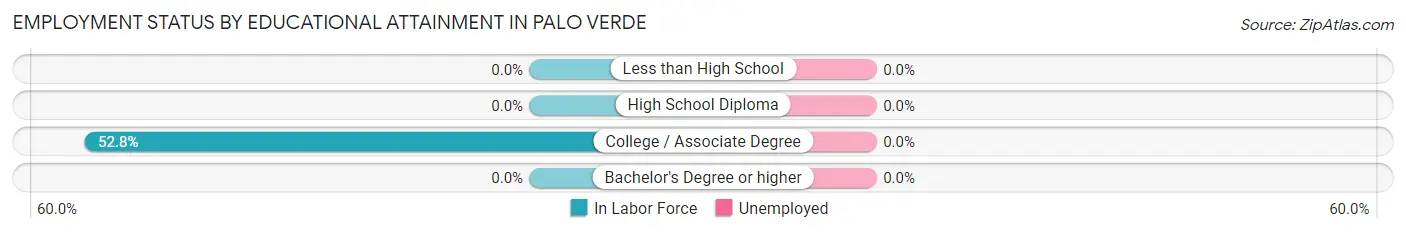
Employment Status by Educational Attainment in Palo Verde
Educational Attainment
In Labor Force
Unemployed
Less than High School
0 (0.0%)
0 (0.0%)
High School Diploma
0 (0.0%)
0 (0.0%)
College / Associate Degree
28 (52.8%)
0 (0.0%)
Bachelor's Degree or higher
0 (0.0%)
0 (0.0%)
Total
28 (52.8%)
0 (0.0%)
Employment Occupations by Sex in Palo Verde
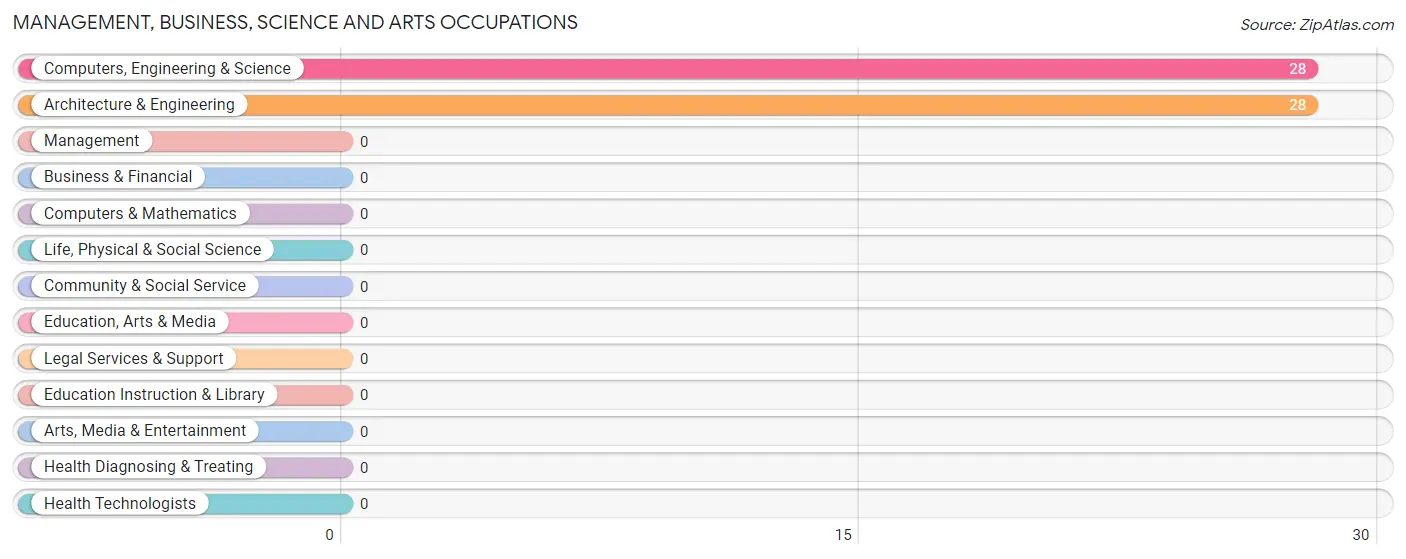
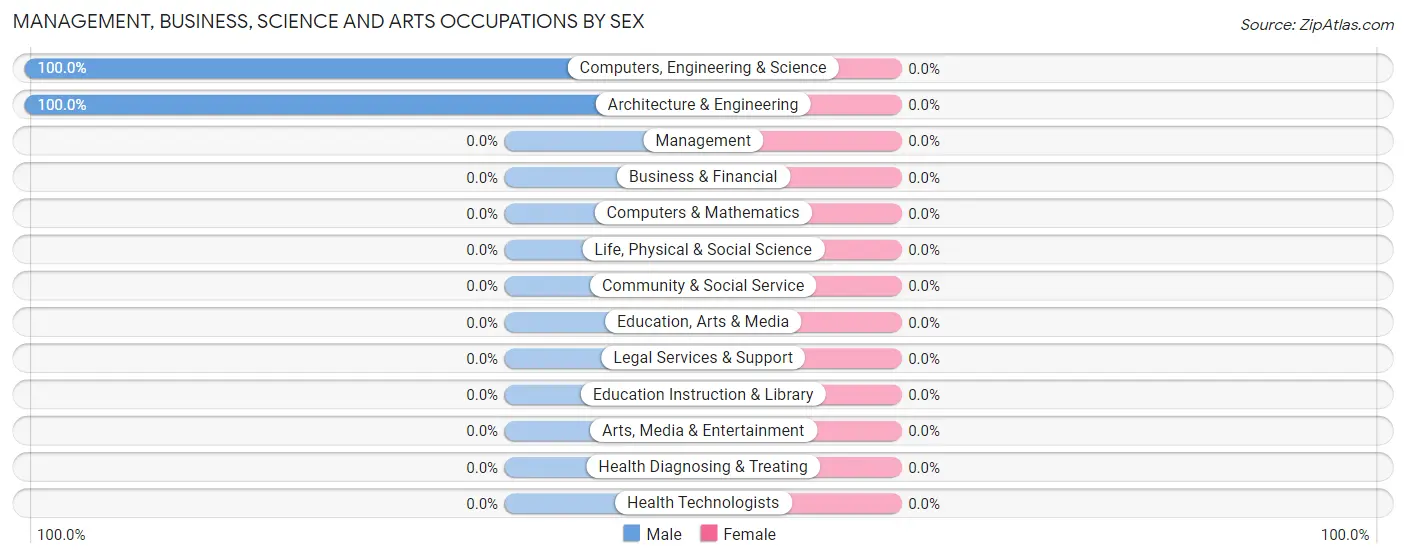
Management, Business, Science and Arts Occupations
The most common Management, Business, Science and Arts occupations in Palo Verde are Computers, Engineering & Science (28 | 100.0%), and Architecture & Engineering (28 | 100.0%).
Management, Business, Science and Arts Occupations by Sex
Occupation
Male
Female
Management
0 (0.0%)
0 (0.0%)
Business & Financial
0 (0.0%)
0 (0.0%)
Computers, Engineering & Science
28 (100.0%)
0 (0.0%)
Computers & Mathematics
0 (0.0%)
0 (0.0%)
Architecture & Engineering
28 (100.0%)
0 (0.0%)
Life, Physical & Social Science
0 (0.0%)
0 (0.0%)
Community & Social Service
0 (0.0%)
0 (0.0%)
Education, Arts & Media
0 (0.0%)
0 (0.0%)
Legal Services & Support
0 (0.0%)
0 (0.0%)
Education Instruction & Library
0 (0.0%)
0 (0.0%)
Arts, Media & Entertainment
0 (0.0%)
0 (0.0%)
Health Diagnosing & Treating
0 (0.0%)
0 (0.0%)
Health Technologists
0 (0.0%)
0 (0.0%)
Total (Category)
28 (100.0%)
0 (0.0%)
Total (Overall)
28 (100.0%)
0 (0.0%)
Services Occupations
Services Occupations by Sex
Occupation
Male
Female
Healthcare Support
0 (0.0%)
0 (0.0%)
Security & Protection
0 (0.0%)
0 (0.0%)
Firefighting & Prevention
0 (0.0%)
0 (0.0%)
Law Enforcement
0 (0.0%)
0 (0.0%)
Food Preparation & Serving
0 (0.0%)
0 (0.0%)
Cleaning & Maintenance
0 (0.0%)
0 (0.0%)
Personal Care & Service
0 (0.0%)
0 (0.0%)
Total (Category)
0 (0.0%)
0 (0.0%)
Total (Overall)
28 (100.0%)
0 (0.0%)
Sales and Office Occupations
Sales and Office Occupations by Sex
Occupation
Male
Female
Sales & Related
0 (0.0%)
0 (0.0%)
Office & Administration
0 (0.0%)
0 (0.0%)
Total (Category)
0 (0.0%)
0 (0.0%)
Total (Overall)
28 (100.0%)
0 (0.0%)
Natural Resources, Construction and Maintenance Occupations
Natural Resources, Construction and Maintenance Occupations by Sex
Occupation
Male
Female
Farming, Fishing & Forestry
0 (0.0%)
0 (0.0%)
Construction & Extraction
0 (0.0%)
0 (0.0%)
Installation, Maintenance & Repair
0 (0.0%)
0 (0.0%)
Total (Category)
0 (0.0%)
0 (0.0%)
Total (Overall)
28 (100.0%)
0 (0.0%)
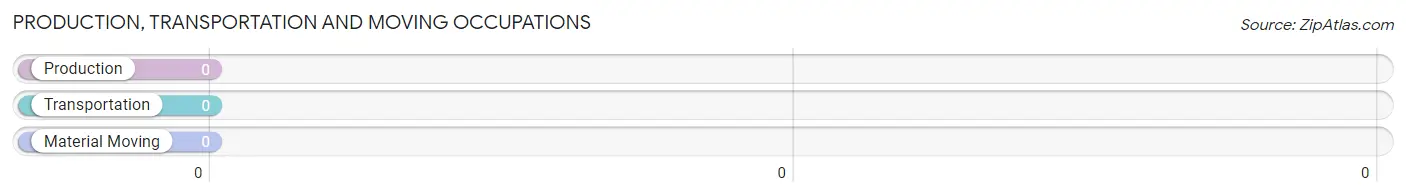
Production, Transportation and Moving Occupations
Production, Transportation and Moving Occupations by Sex
Occupation
Male
Female
Production
0 (0.0%)
0 (0.0%)
Transportation
0 (0.0%)
0 (0.0%)
Material Moving
0 (0.0%)
0 (0.0%)
Total (Category)
0 (0.0%)
0 (0.0%)
Total (Overall)
28 (100.0%)
0 (0.0%)
Employment Industries by Sex in Palo Verde
Employment Industries in Palo Verde
The major employment industries in Palo Verde include , and Information (28 | 100.0%).
Employment Industries by Sex in Palo Verde
Industry
Male
Female
Agriculture, Fishing & Hunting
0 (0.0%)
0 (0.0%)
Mining, Quarrying, & Extraction
0 (0.0%)
0 (0.0%)
Construction
0 (0.0%)
0 (0.0%)
Manufacturing
0 (0.0%)
0 (0.0%)
Wholesale Trade
0 (0.0%)
0 (0.0%)
Retail Trade
0 (0.0%)
0 (0.0%)
Transportation & Warehousing
0 (0.0%)
0 (0.0%)
Utilities
0 (0.0%)
0 (0.0%)
Information
28 (100.0%)
0 (0.0%)
Finance & Insurance
0 (0.0%)
0 (0.0%)
Real Estate, Rental & Leasing
0 (0.0%)
0 (0.0%)
Professional & Scientific
0 (0.0%)
0 (0.0%)
Enterprise Management
0 (0.0%)
0 (0.0%)
Administrative & Support
0 (0.0%)
0 (0.0%)
Educational Services
0 (0.0%)
0 (0.0%)
Health Care & Social Assistance
0 (0.0%)
0 (0.0%)
Arts, Entertainment & Recreation
0 (0.0%)
0 (0.0%)
Accommodation & Food Services
0 (0.0%)
0 (0.0%)
Public Administration
0 (0.0%)
0 (0.0%)
Total
28 (100.0%)
0 (0.0%)
Education in Palo Verde
School Enrollment in Palo Verde
School Level
# Students
% Students
Nursery / Preschool
0
0.0%
Kindergarten
0
0.0%
Elementary School
0
0.0%
Middle School
0
0.0%
High School
0
0.0%
College / Undergraduate
0
0.0%
Graduate / Professional
0
0.0%
Total
0
0.0%
School Enrollment by Age by Funding Source in Palo Verde
Age Bracket
Public School
Private School
3 to 4 Year Olds
0 (0.0%)
0 (0.0%)
5 to 9 Year Old
0 (0.0%)
0 (0.0%)
10 to 14 Year Olds
0 (0.0%)
0 (0.0%)
15 to 17 Year Olds
0 (0.0%)
0 (0.0%)
18 to 19 Year Olds
0 (0.0%)
0 (0.0%)
20 to 24 Year Olds
0 (0.0%)
0 (0.0%)
25 to 34 Year Olds
0 (0.0%)
0 (0.0%)
35 Years and over
0 (0.0%)
0 (0.0%)
Total
0 (0.0%)
0 (0.0%)
Educational Attainment by Field of Study in Palo Verde
Field of Study
# Graduates
% Graduates
Computers & Mathematics
0
0.0%
Bio, Nature & Agricultural
0
0.0%
Physical & Health Sciences
0
0.0%
Psychology
0
0.0%
Social Sciences
0
0.0%
Engineering
0
0.0%
Multidisciplinary Studies
0
0.0%
Science & Technology
0
0.0%
Business
0
0.0%
Education
0
0.0%
Literature & Languages
0
0.0%
Liberal Arts & History
0
0.0%
Visual & Performing Arts
0
0.0%
Communications
0
0.0%
Arts & Humanities
0
0.0%
Total
0
0.0%
Transportation & Commute in Palo Verde
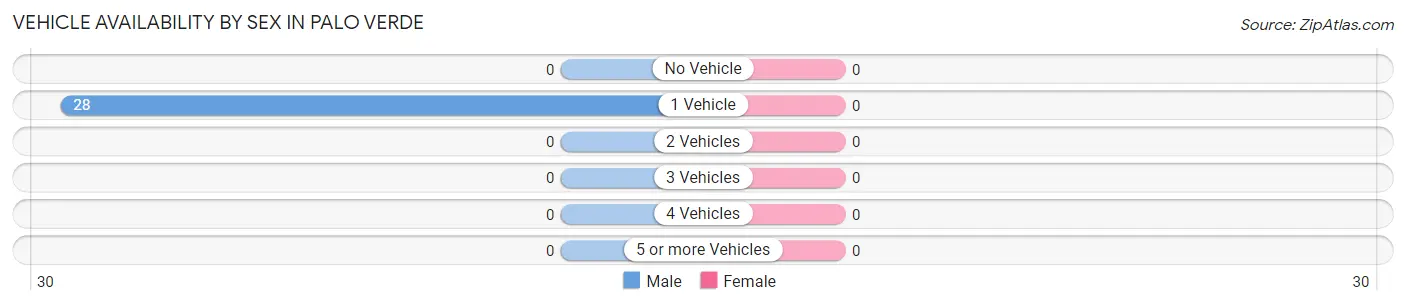
Vehicle Availability by Sex in Palo Verde
Vehicles Available
Male
Female
No Vehicle
0 (0.0%)
0 (0.0%)
1 Vehicle
28 (100.0%)
0 (0.0%)
2 Vehicles
0 (0.0%)
0 (0.0%)
3 Vehicles
0 (0.0%)
0 (0.0%)
4 Vehicles
0 (0.0%)
0 (0.0%)
5 or more Vehicles
0 (0.0%)
0 (0.0%)
Total
28 (100.0%)
0 (0.0%)
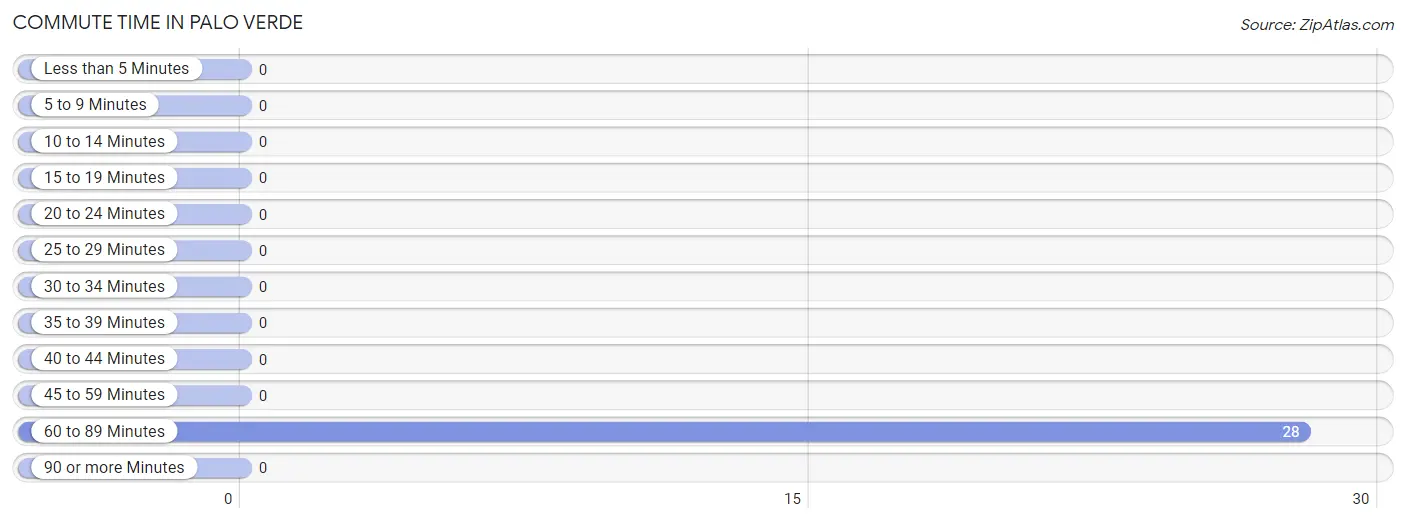
Commute Time in Palo Verde
The most frequently occuring commute durations in Palo Verde are 60 to 89 minutes (28 commuters, 100.0%), less than 5 minutes (0 commuters, 0.0%), and 5 to 9 minutes (0 commuters, 0.0%).
Commute Time
# Commuters
% Commuters
Less than 5 Minutes
0
0.0%
5 to 9 Minutes
0
0.0%
10 to 14 Minutes
0
0.0%
15 to 19 Minutes
0
0.0%
20 to 24 Minutes
0
0.0%
25 to 29 Minutes
0
0.0%
30 to 34 Minutes
0
0.0%
35 to 39 Minutes
0
0.0%
40 to 44 Minutes
0
0.0%
45 to 59 Minutes
0
0.0%
60 to 89 Minutes
28
100.0%
90 or more Minutes
0
0.0%
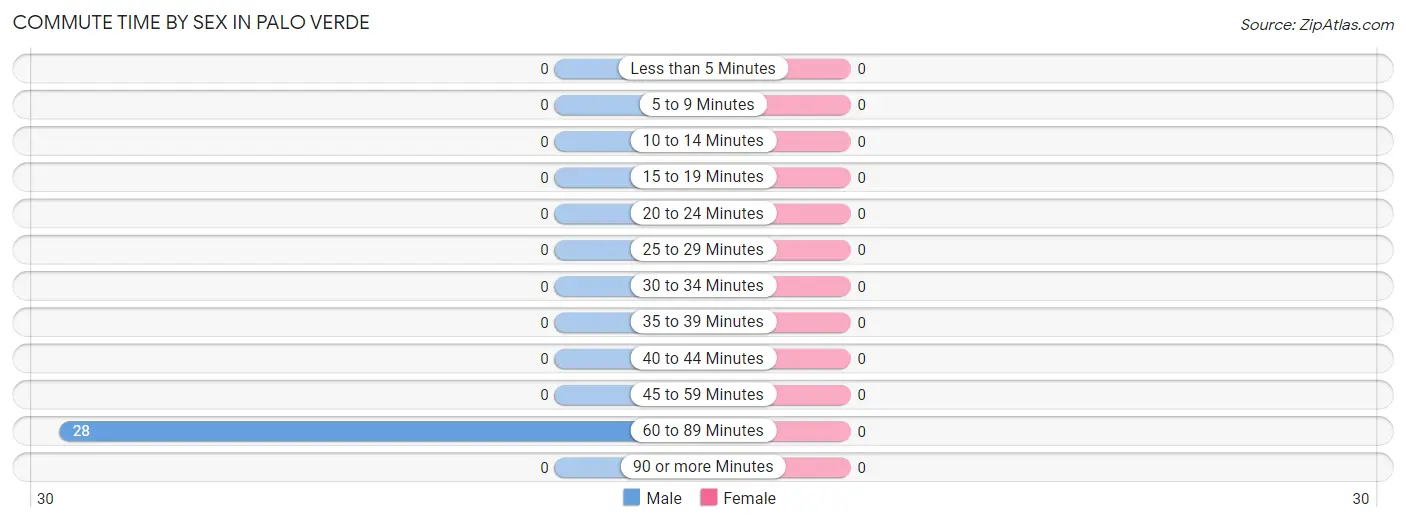
Commute Time by Sex in Palo Verde
Commute Time
Male
Female
Less than 5 Minutes
0 (0.0%)
0 (0.0%)
5 to 9 Minutes
0 (0.0%)
0 (0.0%)
10 to 14 Minutes
0 (0.0%)
0 (0.0%)
15 to 19 Minutes
0 (0.0%)
0 (0.0%)
20 to 24 Minutes
0 (0.0%)
0 (0.0%)
25 to 29 Minutes
0 (0.0%)
0 (0.0%)
30 to 34 Minutes
0 (0.0%)
0 (0.0%)
35 to 39 Minutes
0 (0.0%)
0 (0.0%)
40 to 44 Minutes
0 (0.0%)
0 (0.0%)
45 to 59 Minutes
0 (0.0%)
0 (0.0%)
60 to 89 Minutes
28 (100.0%)
0 (0.0%)
90 or more Minutes
0 (0.0%)
0 (0.0%)
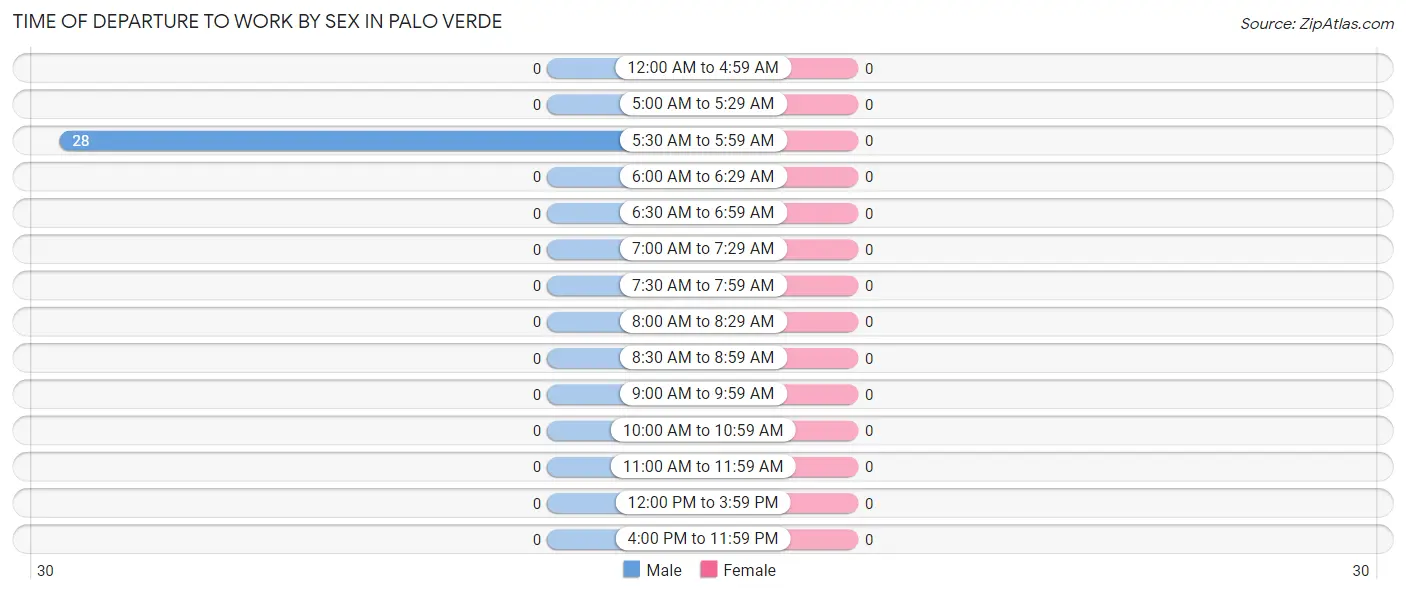
Time of Departure to Work by Sex in Palo Verde
Time of Departure
Male
Female
12:00 AM to 4:59 AM
0 (0.0%)
0 (0.0%)
5:00 AM to 5:29 AM
0 (0.0%)
0 (0.0%)
5:30 AM to 5:59 AM
28 (100.0%)
0 (0.0%)
6:00 AM to 6:29 AM
0 (0.0%)
0 (0.0%)
6:30 AM to 6:59 AM
0 (0.0%)
0 (0.0%)
7:00 AM to 7:29 AM
0 (0.0%)
0 (0.0%)
7:30 AM to 7:59 AM
0 (0.0%)
0 (0.0%)
8:00 AM to 8:29 AM
0 (0.0%)
0 (0.0%)
8:30 AM to 8:59 AM
0 (0.0%)
0 (0.0%)
9:00 AM to 9:59 AM
0 (0.0%)
0 (0.0%)
10:00 AM to 10:59 AM
0 (0.0%)
0 (0.0%)
11:00 AM to 11:59 AM
0 (0.0%)
0 (0.0%)
12:00 PM to 3:59 PM
0 (0.0%)
0 (0.0%)
4:00 PM to 11:59 PM
0 (0.0%)
0 (0.0%)
Total
28 (100.0%)
0 (0.0%)
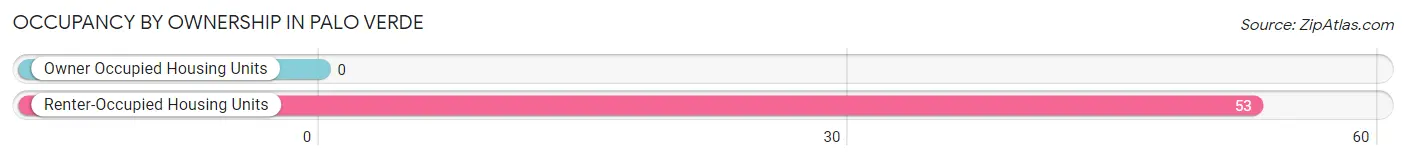
Housing Occupancy in Palo Verde
Occupancy by Ownership in Palo Verde
Of the total 53 dwellings in Palo Verde, owner-occupied units account for 0 (0.0%), while renter-occupied units make up 53 (100.0%).
Occupancy
# Housing Units
% Housing Units
Owner Occupied Housing Units
0
0.0%
Renter-Occupied Housing Units
53
100.0%
Total Occupied Housing Units
53
100.0%
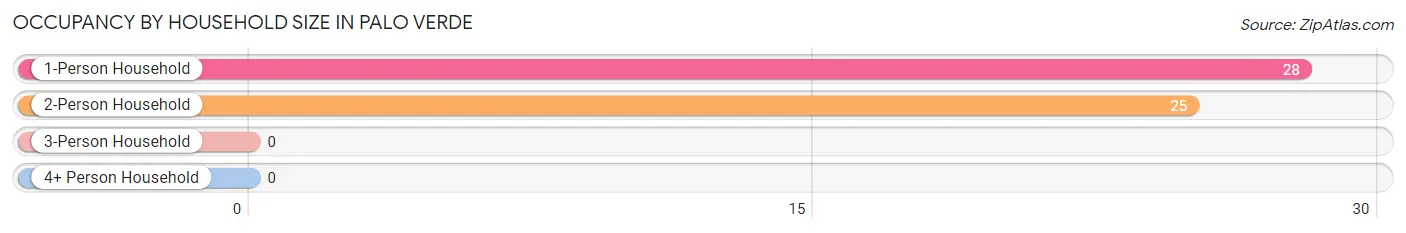
Occupancy by Household Size in Palo Verde
Household Size
# Housing Units
% Housing Units
1-Person Household
28
52.8%
2-Person Household
25
47.2%
3-Person Household
0
0.0%
4+ Person Household
0
0.0%
Total Housing Units
53
100.0%
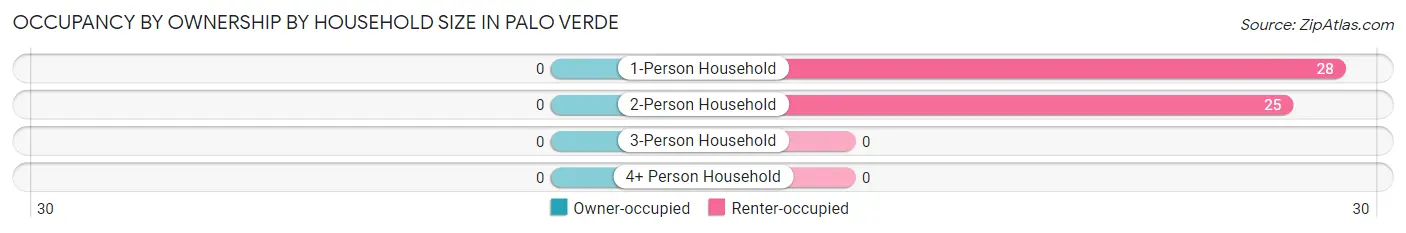
Occupancy by Ownership by Household Size in Palo Verde
Household Size
Owner-occupied
Renter-occupied
1-Person Household
0 (0.0%)
28 (100.0%)
2-Person Household
0 (0.0%)
25 (100.0%)
3-Person Household
0 (0.0%)
0 (0.0%)
4+ Person Household
0 (0.0%)
0 (0.0%)
Total Housing Units
0 (0.0%)
53 (100.0%)
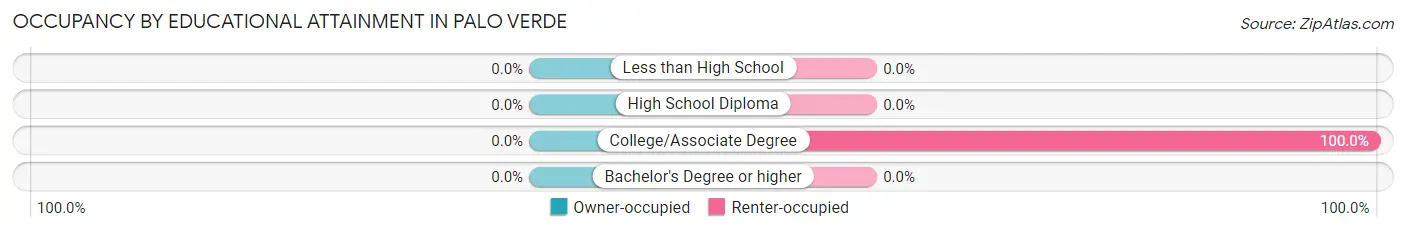
Occupancy by Educational Attainment in Palo Verde
Household Size
Owner-occupied
Renter-occupied
Less than High School
0 (0.0%)
0 (0.0%)
High School Diploma
0 (0.0%)
0 (0.0%)
College/Associate Degree
0 (0.0%)
53 (100.0%)
Bachelor's Degree or higher
0 (0.0%)
0 (0.0%)
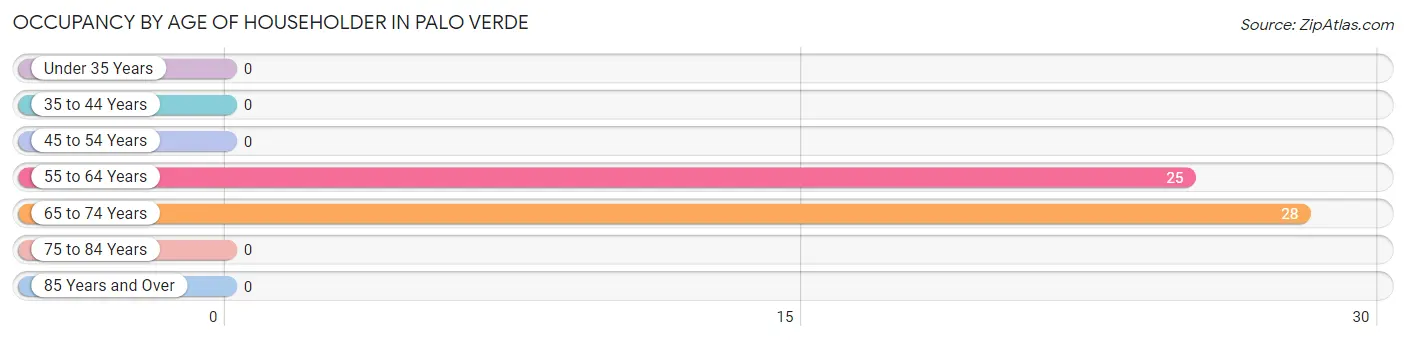
Occupancy by Age of Householder in Palo Verde
Age Bracket
# Households
% Households
Under 35 Years
0
0.0%
35 to 44 Years
0
0.0%
45 to 54 Years
0
0.0%
55 to 64 Years
25
47.2%
65 to 74 Years
28
52.8%
75 to 84 Years
0
0.0%
85 Years and Over
0
0.0%
Total
53
100.0%
Housing Finances in Palo Verde
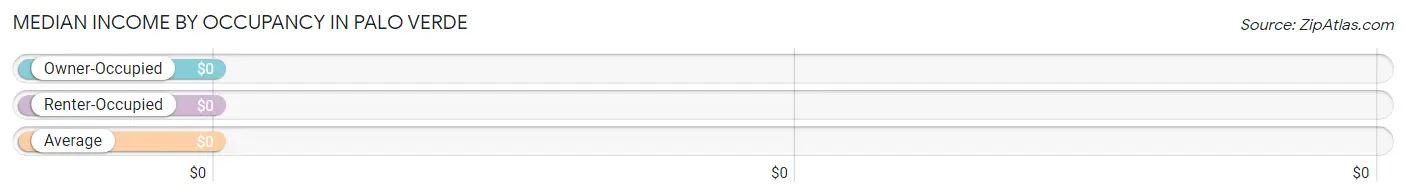
Median Income by Occupancy in Palo Verde
Occupancy Type
# Households
Median Income
Owner-Occupied
0 (0.0%)
$0
Renter-Occupied
53 (100.0%)
$0
Average
53 (100.0%)
$0
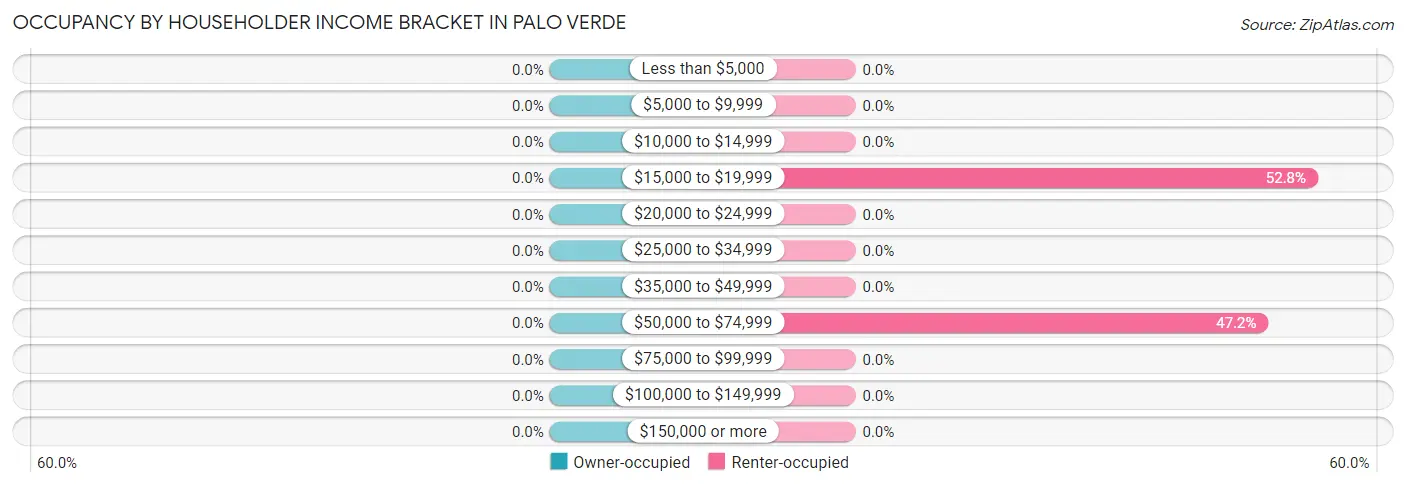
Occupancy by Householder Income Bracket in Palo Verde
Income Bracket
Owner-occupied
Renter-occupied
Less than $5,000
0 (0.0%)
0 (0.0%)
$5,000 to $9,999
0 (0.0%)
0 (0.0%)
$10,000 to $14,999
0 (0.0%)
0 (0.0%)
$15,000 to $19,999
0 (0.0%)
28 (52.8%)
$20,000 to $24,999
0 (0.0%)
0 (0.0%)
$25,000 to $34,999
0 (0.0%)
0 (0.0%)
$35,000 to $49,999
0 (0.0%)
0 (0.0%)
$50,000 to $74,999
0 (0.0%)
25 (47.2%)
$75,000 to $99,999
0 (0.0%)
0 (0.0%)
$100,000 to $149,999
0 (0.0%)
0 (0.0%)
$150,000 or more
0 (0.0%)
0 (0.0%)
Total
0 (0.0%)
53 (100.0%)
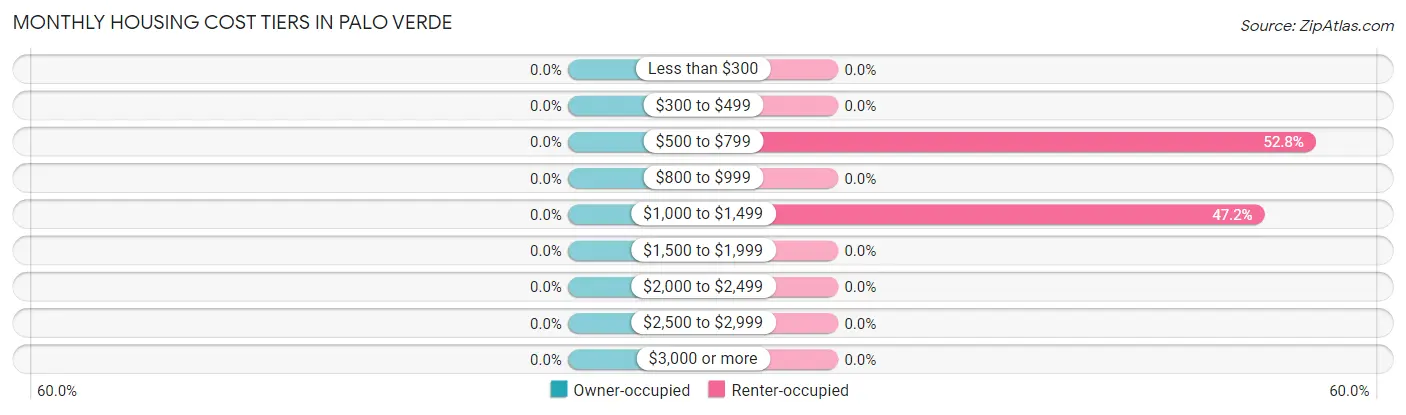
Monthly Housing Cost Tiers in Palo Verde
Monthly Cost
Owner-occupied
Renter-occupied
Less than $300
0 (0.0%)
0 (0.0%)
$300 to $499
0 (0.0%)
0 (0.0%)
$500 to $799
0 (0.0%)
28 (52.8%)
$800 to $999
0 (0.0%)
0 (0.0%)
$1,000 to $1,499
0 (0.0%)
25 (47.2%)
$1,500 to $1,999
0 (0.0%)
0 (0.0%)
$2,000 to $2,499
0 (0.0%)
0 (0.0%)
$2,500 to $2,999
0 (0.0%)
0 (0.0%)
$3,000 or more
0 (0.0%)
0 (0.0%)
Total
0 (0.0%)
53 (100.0%)
Physical Housing Characteristics in Palo Verde
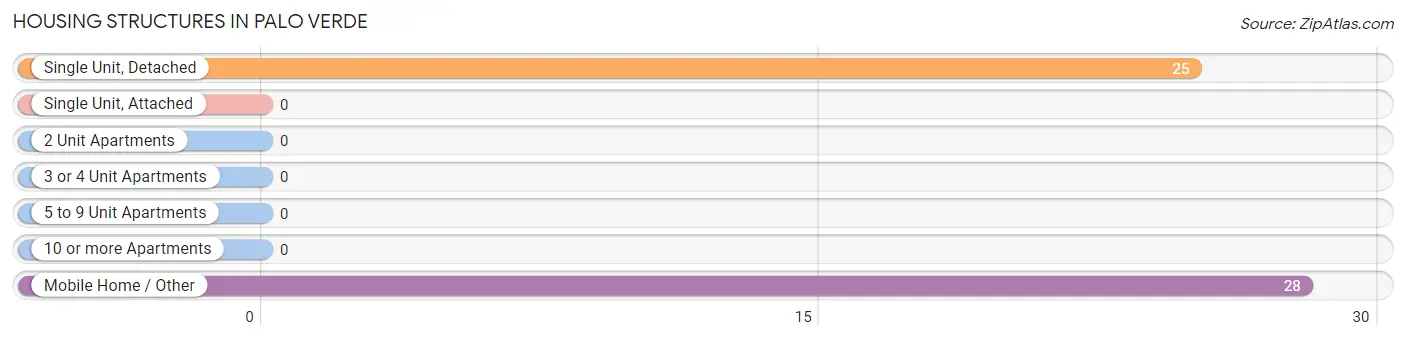
Housing Structures in Palo Verde
Structure Type
# Housing Units
% Housing Units
Single Unit, Detached
25
47.2%
Single Unit, Attached
0
0.0%
2 Unit Apartments
0
0.0%
3 or 4 Unit Apartments
0
0.0%
5 to 9 Unit Apartments
0
0.0%
10 or more Apartments
0
0.0%
Mobile Home / Other
28
52.8%
Total
53
100.0%
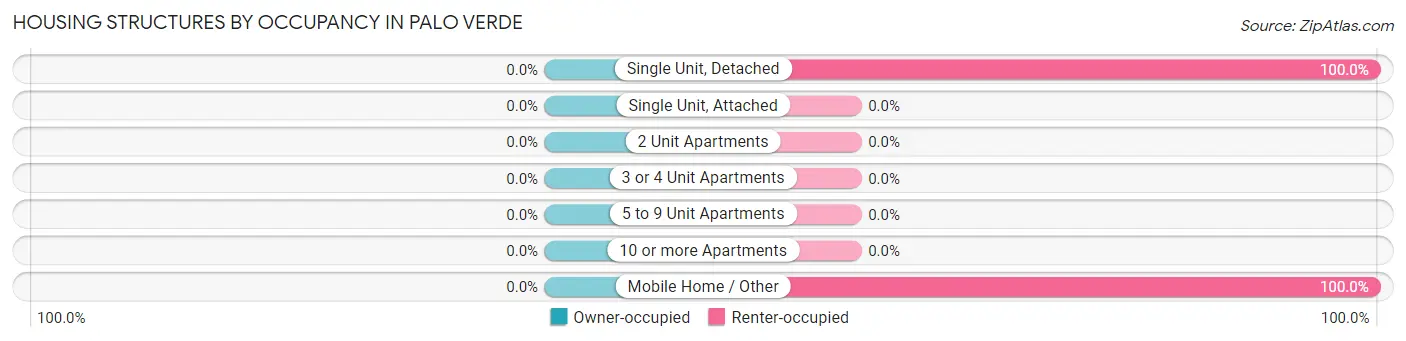
Housing Structures by Occupancy in Palo Verde
Structure Type
Owner-occupied
Renter-occupied
Single Unit, Detached
0 (0.0%)
25 (100.0%)
Single Unit, Attached
0 (0.0%)
0 (0.0%)
2 Unit Apartments
0 (0.0%)
0 (0.0%)
3 or 4 Unit Apartments
0 (0.0%)
0 (0.0%)
5 to 9 Unit Apartments
0 (0.0%)
0 (0.0%)
10 or more Apartments
0 (0.0%)
0 (0.0%)
Mobile Home / Other
0 (0.0%)
28 (100.0%)
Total
0 (0.0%)
53 (100.0%)
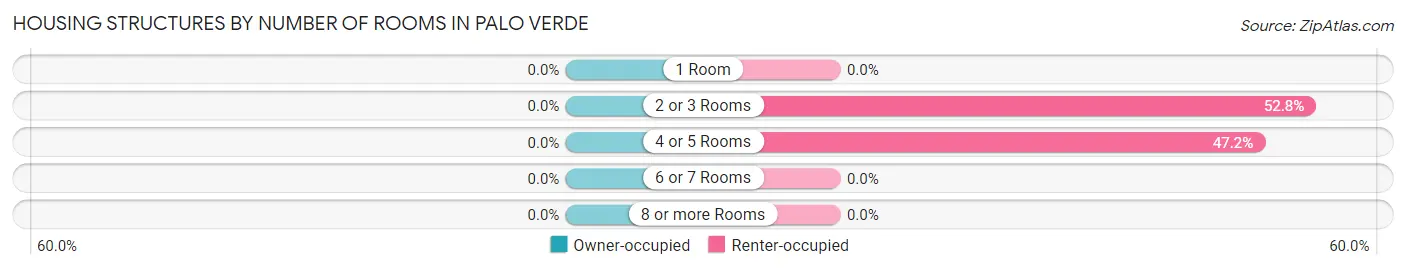
Housing Structures by Number of Rooms in Palo Verde
Number of Rooms
Owner-occupied
Renter-occupied
1 Room
0 (0.0%)
0 (0.0%)
2 or 3 Rooms
0 (0.0%)
28 (52.8%)
4 or 5 Rooms
0 (0.0%)
25 (47.2%)
6 or 7 Rooms
0 (0.0%)
0 (0.0%)
8 or more Rooms
0 (0.0%)
0 (0.0%)
Total
0 (0.0%)
53 (100.0%)
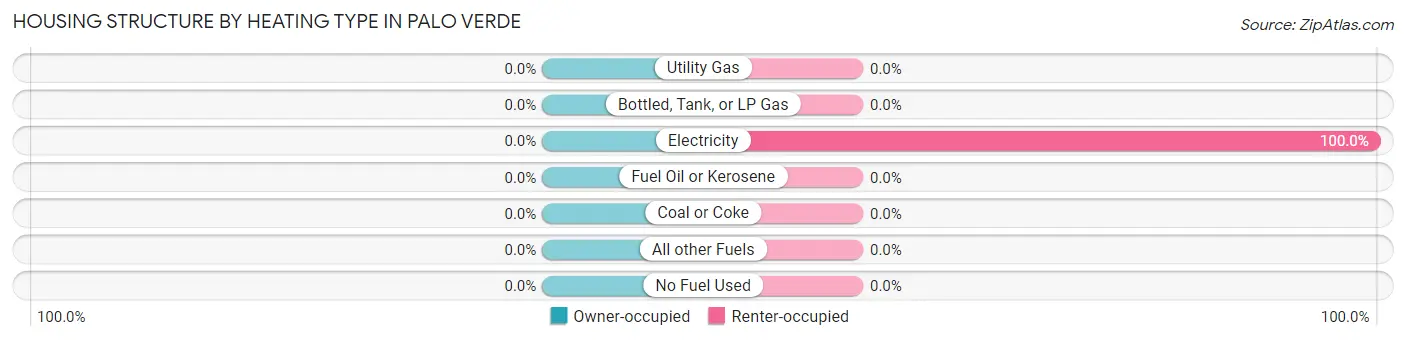
Housing Structure by Heating Type in Palo Verde
Heating Type
Owner-occupied
Renter-occupied
Utility Gas
0 (0.0%)
0 (0.0%)
Bottled, Tank, or LP Gas
0 (0.0%)
0 (0.0%)
Electricity
0 (0.0%)
53 (100.0%)
Fuel Oil or Kerosene
0 (0.0%)
0 (0.0%)
Coal or Coke
0 (0.0%)
0 (0.0%)
All other Fuels
0 (0.0%)
0 (0.0%)
No Fuel Used
0 (0.0%)
0 (0.0%)
Total
0 (0.0%)
53 (100.0%)
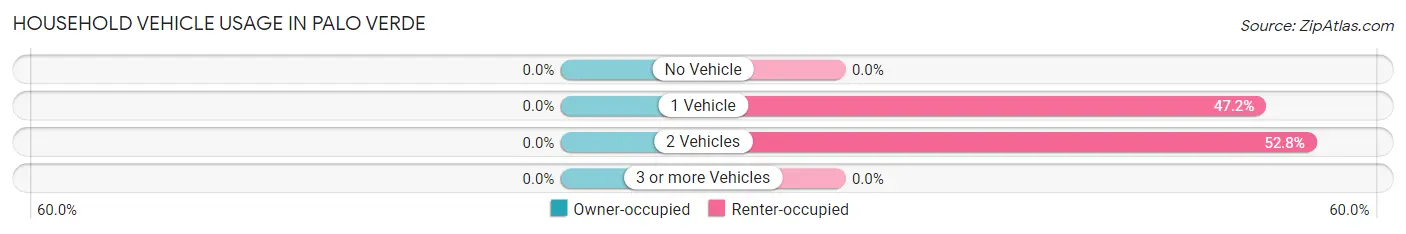
Household Vehicle Usage in Palo Verde
Vehicles per Household
Owner-occupied
Renter-occupied
No Vehicle
0 (0.0%)
0 (0.0%)
1 Vehicle
0 (0.0%)
25 (47.2%)
2 Vehicles
0 (0.0%)
28 (52.8%)
3 or more Vehicles
0 (0.0%)
0 (0.0%)
Total
0 (0.0%)
53 (100.0%)
Real Estate & Mortgages in Palo Verde
Real Estate and Mortgage Overview in Palo Verde
Characteristic
Without Mortgage
With Mortgage
Housing Units
0
0
Median Property Value
-
-
Median Household Income
-
-
Monthly Housing Costs
-
-
Real Estate Taxes
-
-
Property Value by Mortgage Status in Palo Verde
Property Value
Without Mortgage
With Mortgage
Less than $50,000
0 (0.0%)
0 (0.0%)
$50,000 to $99,999
0 (0.0%)
0 (0.0%)
$100,000 to $299,999
0 (0.0%)
0 (0.0%)
$300,000 to $499,999
0 (0.0%)
0 (0.0%)
$500,000 to $749,999
0 (0.0%)
0 (0.0%)
$750,000 to $999,999
0 (0.0%)
0 (0.0%)
$1,000,000 or more
0 (0.0%)
0 (0.0%)
Total
0 (0.0%)
0 (0.0%)
Household Income by Mortgage Status in Palo Verde
Household Income
Without Mortgage
With Mortgage
Less than $10,000
0 (0.0%)
0 (0.0%)
$10,000 to $24,999
0 (0.0%)
0 (0.0%)
$25,000 to $34,999
0 (0.0%)
0 (0.0%)
$35,000 to $49,999
0 (0.0%)
0 (0.0%)
$50,000 to $74,999
0 (0.0%)
0 (0.0%)
$75,000 to $99,999
0 (0.0%)
0 (0.0%)
$100,000 to $149,999
0 (0.0%)
0 (0.0%)
$150,000 or more
0 (0.0%)
0 (0.0%)
Total
0 (0.0%)
0 (0.0%)
Property Value to Household Income Ratio in Palo Verde
Value-to-Income Ratio
Without Mortgage
With Mortgage
Less than 2.0x
0 (0.0%)
0 (0.0%)
2.0x to 2.9x
0 (0.0%)
0 (0.0%)
3.0x to 3.9x
0 (0.0%)
0 (0.0%)
4.0x or more
0 (0.0%)
0 (0.0%)
Total
0 (0.0%)
0 (0.0%)
Real Estate Taxes by Mortgage Status in Palo Verde
Property Taxes
Without Mortgage
With Mortgage
Less than $800
0 (0.0%)
0 (0.0%)
$800 to $1,499
0 (0.0%)
0 (0.0%)
$800 to $1,499
0 (0.0%)
0 (0.0%)
Total
0 (0.0%)
0 (0.0%)
Health & Disability in Palo Verde
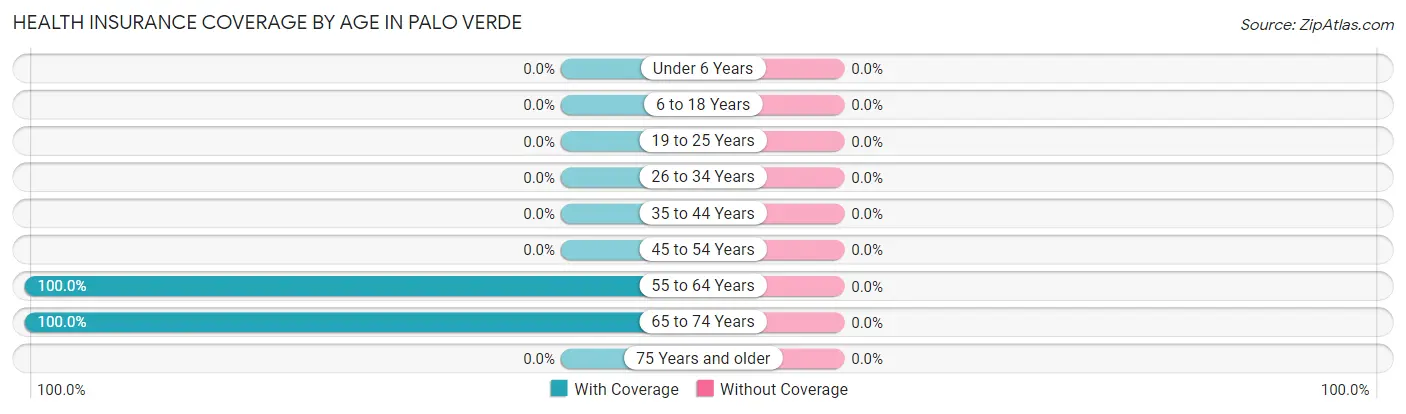
Health Insurance Coverage by Age in Palo Verde
Age Bracket
With Coverage
Without Coverage
Under 6 Years
0 (0.0%)
0 (0.0%)
6 to 18 Years
0 (0.0%)
0 (0.0%)
19 to 25 Years
0 (0.0%)
0 (0.0%)
26 to 34 Years
0 (0.0%)
0 (0.0%)
35 to 44 Years
0 (0.0%)
0 (0.0%)
45 to 54 Years
0 (0.0%)
0 (0.0%)
55 to 64 Years
53 (100.0%)
0 (0.0%)
65 to 74 Years
28 (100.0%)
0 (0.0%)
75 Years and older
0 (0.0%)
0 (0.0%)
Total
81 (100.0%)
0 (0.0%)
Health Insurance Coverage by Citizenship Status in Palo Verde
Citizenship Status
With Coverage
Without Coverage
Native Born
0 (0.0%)
0 (0.0%)
Foreign Born, Citizen
0 (0.0%)
0 (0.0%)
Foreign Born, not a Citizen
0 (0.0%)
0 (0.0%)
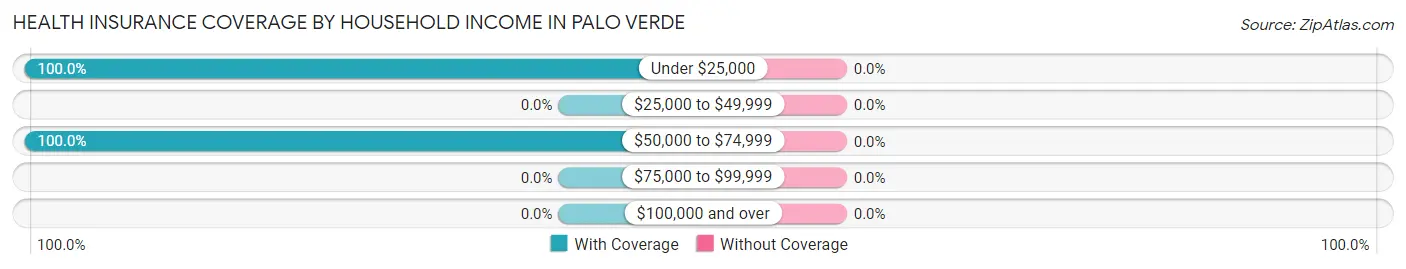
Health Insurance Coverage by Household Income in Palo Verde
Household Income
With Coverage
Without Coverage
Under $25,000
28 (100.0%)
0 (0.0%)
$25,000 to $49,999
0 (0.0%)
0 (0.0%)
$50,000 to $74,999
53 (100.0%)
0 (0.0%)
$75,000 to $99,999
0 (0.0%)
0 (0.0%)
$100,000 and over
0 (0.0%)
0 (0.0%)
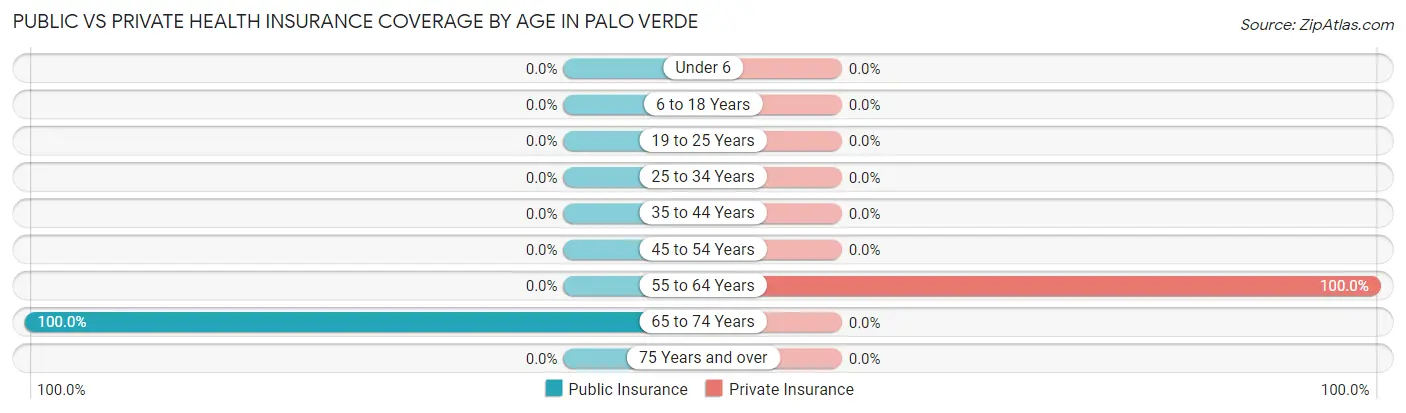
Public vs Private Health Insurance Coverage by Age in Palo Verde
Age Bracket
Public Insurance
Private Insurance
Under 6
0 (0.0%)
0 (0.0%)
6 to 18 Years
0 (0.0%)
0 (0.0%)
19 to 25 Years
0 (0.0%)
0 (0.0%)
25 to 34 Years
0 (0.0%)
0 (0.0%)
35 to 44 Years
0 (0.0%)
0 (0.0%)
45 to 54 Years
0 (0.0%)
0 (0.0%)
55 to 64 Years
0 (0.0%)
53 (100.0%)
65 to 74 Years
28 (100.0%)
0 (0.0%)
75 Years and over
0 (0.0%)
0 (0.0%)
Total
28 (34.6%)
53 (65.4%)
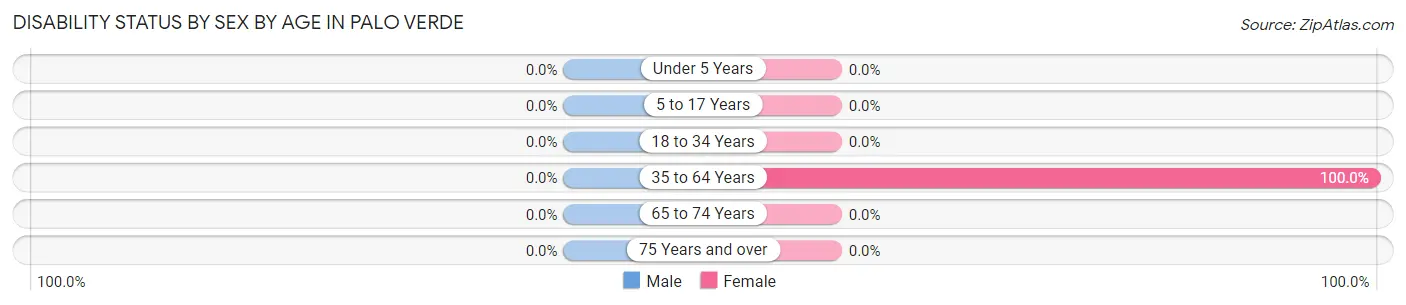
Disability Status by Sex by Age in Palo Verde
Age Bracket
Male
Female
Under 5 Years
0 (0.0%)
0 (0.0%)
5 to 17 Years
0 (0.0%)
0 (0.0%)
18 to 34 Years
0 (0.0%)
0 (0.0%)
35 to 64 Years
0 (0.0%)
25 (100.0%)
65 to 74 Years
0 (0.0%)
0 (0.0%)
75 Years and over
0 (0.0%)
0 (0.0%)
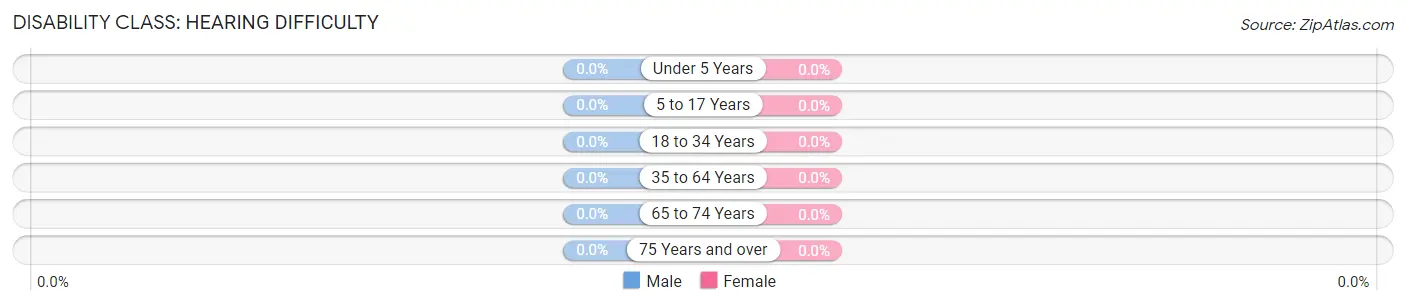
Disability Class by Sex by Age in Palo Verde
Disability Class: Hearing Difficulty
Age Bracket
Male
Female
Under 5 Years
0 (0.0%)
0 (0.0%)
5 to 17 Years
0 (0.0%)
0 (0.0%)
18 to 34 Years
0 (0.0%)
0 (0.0%)
35 to 64 Years
0 (0.0%)
0 (0.0%)
65 to 74 Years
0 (0.0%)
0 (0.0%)
75 Years and over
0 (0.0%)
0 (0.0%)
Disability Class: Vision Difficulty
Age Bracket
Male
Female
Under 5 Years
0 (0.0%)
0 (0.0%)
5 to 17 Years
0 (0.0%)
0 (0.0%)
18 to 34 Years
0 (0.0%)
0 (0.0%)
35 to 64 Years
0 (0.0%)
0 (0.0%)
65 to 74 Years
0 (0.0%)
0 (0.0%)
75 Years and over
0 (0.0%)
0 (0.0%)
Disability Class: Cognitive Difficulty
Age Bracket
Male
Female
5 to 17 Years
0 (0.0%)
0 (0.0%)
18 to 34 Years
0 (0.0%)
0 (0.0%)
35 to 64 Years
0 (0.0%)
0 (0.0%)
65 to 74 Years
0 (0.0%)
0 (0.0%)
75 Years and over
0 (0.0%)
0 (0.0%)
Disability Class: Ambulatory Difficulty
Age Bracket
Male
Female
5 to 17 Years
0 (0.0%)
0 (0.0%)
18 to 34 Years
0 (0.0%)
0 (0.0%)
35 to 64 Years
0 (0.0%)
25 (100.0%)
65 to 74 Years
0 (0.0%)
0 (0.0%)
75 Years and over
0 (0.0%)
0 (0.0%)
Disability Class: Self-Care Difficulty
Age Bracket
Male
Female
5 to 17 Years
0 (0.0%)
0 (0.0%)
18 to 34 Years
0 (0.0%)
0 (0.0%)
35 to 64 Years
0 (0.0%)
25 (100.0%)
65 to 74 Years
0 (0.0%)
0 (0.0%)
75 Years and over
0 (0.0%)
0 (0.0%)
Technology Access in Palo Verde
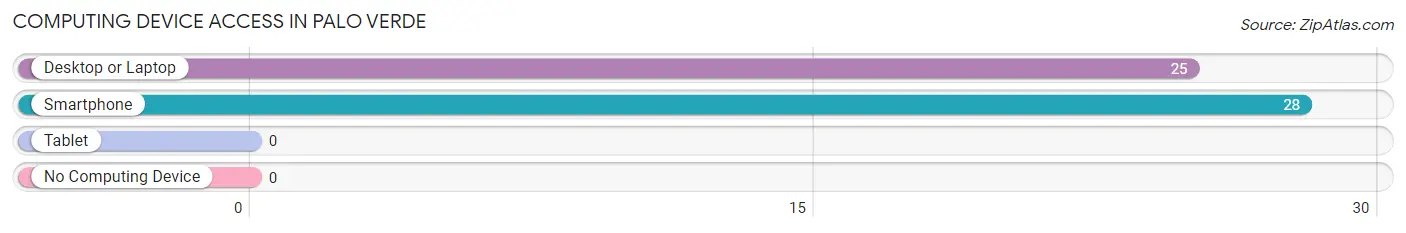
Computing Device Access in Palo Verde
Device Type
# Households
% Households
Desktop or Laptop
25
47.2%
Smartphone
28
52.8%
Tablet
0
0.0%
No Computing Device
0
0.0%
Total
53
100.0%
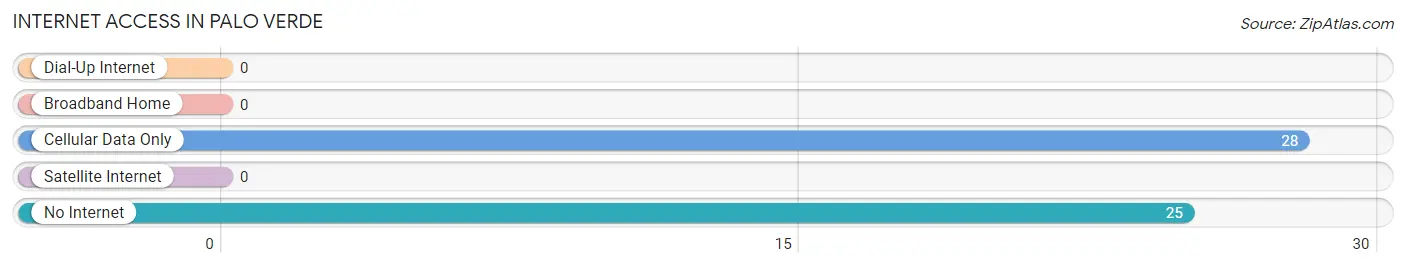
Internet Access in Palo Verde
Internet Type
# Households
% Households
Dial-Up Internet
0
0.0%
Broadband Home
0
0.0%
Cellular Data Only
28
52.8%
Satellite Internet
0
0.0%
No Internet
25
47.2%
Total
53
100.0%
Palo Verde Summary
Palo Verde is a small unincorporated community located in Riverside County, California. It is situated in the Palo Verde Valley, which is part of the Colorado Desert. The community is located about 25 miles east of Blythe, California, and is bordered by the Palo Verde Mountains to the north and the Chocolate Mountains to the south. The population of Palo Verde was estimated to be 1,845 in 2019.
History
The area that is now Palo Verde was originally inhabited by the Cahuilla Indians. The first non-native settlers arrived in the area in the late 19th century, and the town was established in the early 1900s. The town was named after the Palo Verde tree, which is native to the area.
The town was originally a farming community, and the main crops grown were cotton, alfalfa, and citrus. The town also had a small mining industry, and the local mines produced gold, silver, and copper.
In the 1950s, the town began to experience a population boom due to the construction of the Palo Verde Nuclear Generating Station. The plant was built to provide electricity to the growing population of Southern California. The plant is still in operation today and is the largest nuclear power plant in the United States.
Geography
Palo Verde is located in the Palo Verde Valley, which is part of the Colorado Desert. The valley is surrounded by the Palo Verde Mountains to the north and the Chocolate Mountains to the south. The valley is also home to the Palo Verde River, which flows through the town.
The climate in Palo Verde is hot and dry, with temperatures ranging from the mid-90s in the summer to the mid-60s in the winter. The area receives very little rainfall, with an average of only 4 inches per year.
Economy
The economy of Palo Verde is largely based on agriculture and tourism. The town is home to several farms that grow cotton, alfalfa, and citrus. The town also has a small mining industry, and the local mines produce gold, silver, and copper.
The Palo Verde Nuclear Generating Station is the largest employer in the area. The plant provides electricity to the growing population of Southern California.
The town also has a small tourism industry, and the area is popular with hikers, campers, and birdwatchers.
Demographics
The population of Palo Verde was estimated to be 1,845 in 2019. The town is predominantly white, with a small Hispanic population. The median household income in the town is $45,000, and the median home value is $150,000.
Common Questions
What is Inequality or Gini Index in Palo Verde?
Inequality or Gini Index in Palo Verde is 0.26.
What is the Total Population of Palo Verde?
Total Population of Palo Verde is 81.
What is the Total Male Population of Palo Verde?
Total Male Population of Palo Verde is 56.
What is the Total Female Population of Palo Verde?
Total Female Population of Palo Verde is 25.
What is the Ratio of Males per 100 Females in Palo Verde?
There are 224.00 Males per 100 Females in Palo Verde.
What is the Ratio of Females per 100 Males in Palo Verde?
There are 44.64 Females per 100 Males in Palo Verde.
What is the Median Population Age in Palo Verde?
Median Population Age in Palo Verde is 64.5 Years.
What is the Average Family Size in Palo Verde
Average Family Size in Palo Verde is 2.1 People.
What is the Average Household Size in Palo Verde
Average Household Size in Palo Verde is 1.5 People.
How Large is the Labor Force in Palo Verde?
There are 28 People in the Labor Forcein in Palo Verde.
What is the Percentage of People in the Labor Force in Palo Verde?
34.6% of People are in the Labor Force in Palo Verde.
Report Title
Report Link
HTML Copy & Paste Link
Social Media
Copy and paste the folowing code into any webpage where you would like this interactive chart to display