Cities with the Highest Percentage of Population Employed in Architecture & Engineering in South Carolina
RELATED REPORTS & OPTIONS
Architecture & Engineering
South Carolina
Compare Cities
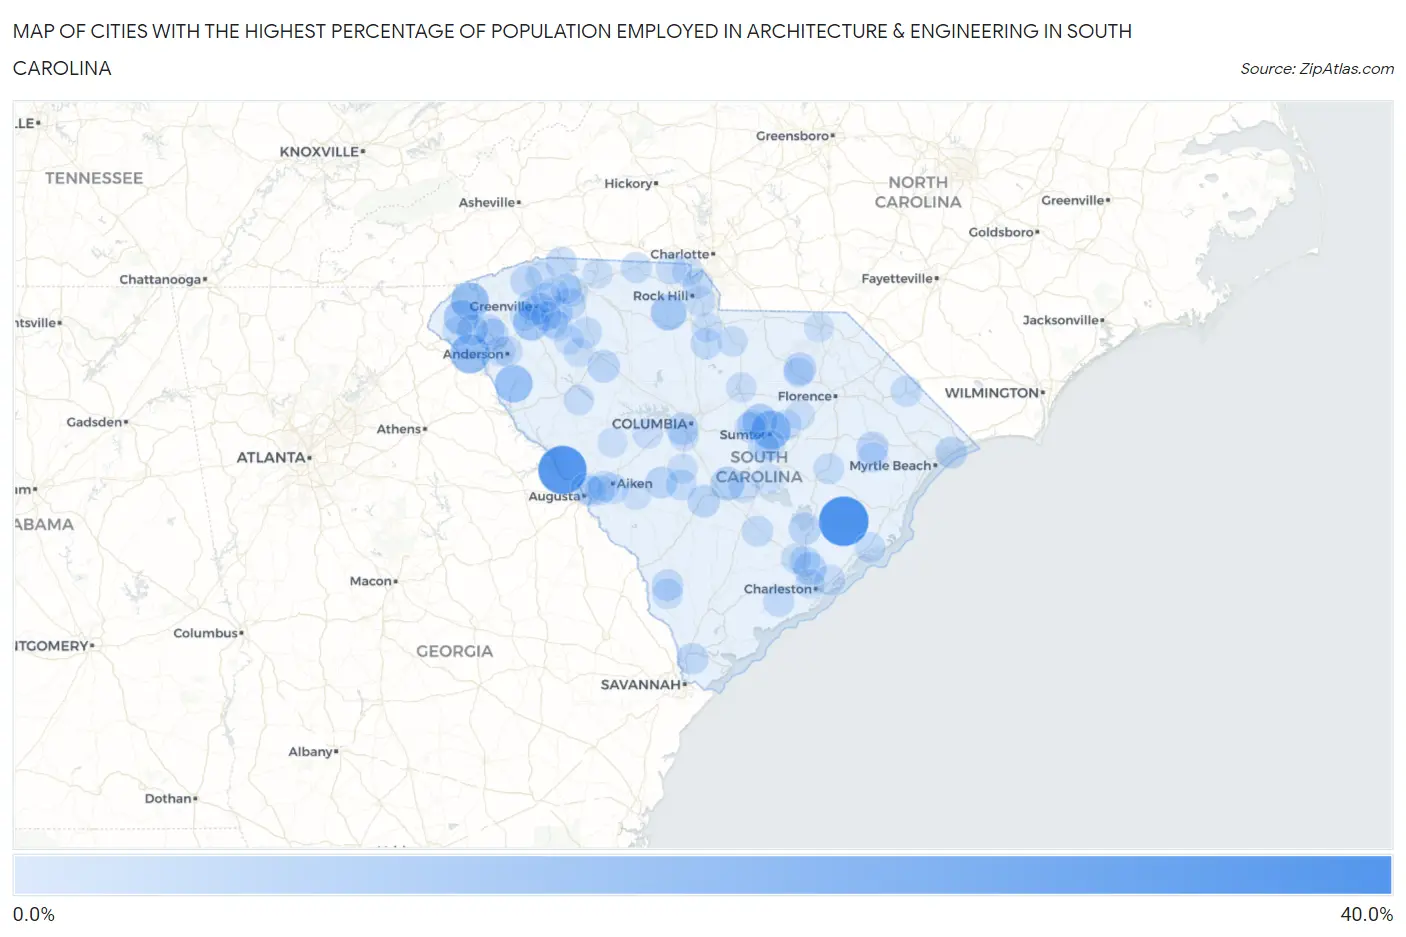
Map of Cities with the Highest Percentage of Population Employed in Architecture & Engineering in South Carolina
0.0%
40.0%
Cities with the Highest Percentage of Population Employed in Architecture & Engineering in South Carolina
| City | % Employed | vs State | vs National | |
| 1. | Jamestown | 31.9% | 2.2%(+29.7)#1 | 2.1%(+29.8)#53 |
| 2. | Clarks Hill | 30.0% | 2.2%(+27.8)#2 | 2.1%(+27.9)#59 |
| 3. | Helena | 25.9% | 2.2%(+23.7)#3 | 2.1%(+23.7)#81 |
| 4. | Fair Play | 16.2% | 2.2%(+14.0)#4 | 2.1%(+14.0)#198 |
| 5. | Mulberry | 15.5% | 2.2%(+13.3)#5 | 2.1%(+13.3)#215 |
| 6. | Salem | 13.7% | 2.2%(+11.5)#6 | 2.1%(+11.6)#278 |
| 7. | Lake Secession | 13.5% | 2.2%(+11.3)#7 | 2.1%(+11.3)#290 |
| 8. | Golden Grove | 11.4% | 2.2%(+9.22)#8 | 2.1%(+9.27)#393 |
| 9. | Floydale | 11.4% | 2.2%(+9.17)#9 | 2.1%(+9.21)#394 |
| 10. | Lowrys | 11.1% | 2.2%(+8.91)#10 | 2.1%(+8.96)#407 |
| 11. | Walhalla | 10.2% | 2.2%(+7.97)#11 | 2.1%(+8.02)#482 |
| 12. | Dalzell | 9.6% | 2.2%(+7.38)#12 | 2.1%(+7.43)#529 |
| 13. | Cameron | 8.1% | 2.2%(+5.86)#13 | 2.1%(+5.91)#713 |
| 14. | Hanahan | 7.2% | 2.2%(+5.03)#14 | 2.1%(+5.08)#866 |
| 15. | North Hartsville | 6.5% | 2.2%(+4.29)#15 | 2.1%(+4.34)#1,049 |
| 16. | Baxter | 6.5% | 2.2%(+4.26)#16 | 2.1%(+4.31)#1,058 |
| 17. | Joanna | 6.2% | 2.2%(+4.02)#17 | 2.1%(+4.07)#1,151 |
| 18. | Pendleton | 6.2% | 2.2%(+4.01)#18 | 2.1%(+4.06)#1,160 |
| 19. | Springdale | 6.1% | 2.2%(+3.88)#19 | 2.1%(+3.93)#1,201 |
| 20. | Cordova | 6.0% | 2.2%(+3.76)#20 | 2.1%(+3.80)#1,267 |
| 21. | Five Forks | 5.9% | 2.2%(+3.70)#21 | 2.1%(+3.75)#1,289 |
| 22. | Pinopolis | 5.9% | 2.2%(+3.67)#22 | 2.1%(+3.72)#1,308 |
| 23. | Briarcliffe Acres | 5.6% | 2.2%(+3.38)#23 | 2.1%(+3.43)#1,460 |
| 24. | Johnsonville | 5.4% | 2.2%(+3.22)#24 | 2.1%(+3.27)#1,552 |
| 25. | Salley | 5.4% | 2.2%(+3.21)#25 | 2.1%(+3.26)#1,561 |
| 26. | Slater Marietta | 5.2% | 2.2%(+3.04)#26 | 2.1%(+3.09)#1,674 |
| 27. | Landrum | 5.1% | 2.2%(+2.91)#27 | 2.1%(+2.96)#1,758 |
| 28. | Hardeeville | 4.9% | 2.2%(+2.72)#28 | 2.1%(+2.77)#1,892 |
| 29. | Clemson | 4.8% | 2.2%(+2.65)#29 | 2.1%(+2.70)#1,945 |
| 30. | Reidville | 4.8% | 2.2%(+2.64)#30 | 2.1%(+2.69)#1,953 |
| 31. | Greenville | 4.8% | 2.2%(+2.61)#31 | 2.1%(+2.66)#1,974 |
| 32. | Luray | 4.8% | 2.2%(+2.61)#32 | 2.1%(+2.66)#1,976 |
| 33. | Seneca | 4.8% | 2.2%(+2.57)#33 | 2.1%(+2.62)#2,001 |
| 34. | North Augusta | 4.7% | 2.2%(+2.50)#34 | 2.1%(+2.55)#2,055 |
| 35. | Enoree | 4.5% | 2.2%(+2.33)#35 | 2.1%(+2.37)#2,214 |
| 36. | Camp Croft | 4.5% | 2.2%(+2.30)#36 | 2.1%(+2.35)#2,238 |
| 37. | Meggett | 4.4% | 2.2%(+2.24)#37 | 2.1%(+2.29)#2,274 |
| 38. | Privateer | 4.4% | 2.2%(+2.16)#38 | 2.1%(+2.21)#2,356 |
| 39. | Great Falls | 4.3% | 2.2%(+2.15)#39 | 2.1%(+2.20)#2,364 |
| 40. | Lake Wylie | 4.3% | 2.2%(+2.15)#40 | 2.1%(+2.20)#2,371 |
| 41. | Nichols | 4.3% | 2.2%(+2.09)#41 | 2.1%(+2.14)#2,419 |
| 42. | Harleyville | 4.3% | 2.2%(+2.06)#42 | 2.1%(+2.11)#2,445 |
| 43. | Warrenville | 4.3% | 2.2%(+2.06)#43 | 2.1%(+2.11)#2,452 |
| 44. | Aiken | 4.2% | 2.2%(+2.00)#44 | 2.1%(+2.05)#2,523 |
| 45. | Kingstree | 4.2% | 2.2%(+1.97)#45 | 2.1%(+2.02)#2,557 |
| 46. | Blacksburg | 4.1% | 2.2%(+1.92)#46 | 2.1%(+1.97)#2,631 |
| 47. | Goose Creek | 4.1% | 2.2%(+1.90)#47 | 2.1%(+1.94)#2,650 |
| 48. | Mayesville | 3.9% | 2.2%(+1.75)#48 | 2.1%(+1.80)#2,830 |
| 49. | City View | 3.9% | 2.2%(+1.75)#49 | 2.1%(+1.80)#2,836 |
| 50. | Wellford | 3.9% | 2.2%(+1.75)#50 | 2.1%(+1.79)#2,839 |
| 51. | Livingston | 3.9% | 2.2%(+1.73)#51 | 2.1%(+1.77)#2,869 |
| 52. | Centenary | 3.9% | 2.2%(+1.69)#52 | 2.1%(+1.74)#2,912 |
| 53. | Mcclellanville | 3.8% | 2.2%(+1.64)#53 | 2.1%(+1.68)#2,976 |
| 54. | Clearwater | 3.8% | 2.2%(+1.59)#54 | 2.1%(+1.63)#3,043 |
| 55. | Stateburg | 3.8% | 2.2%(+1.58)#55 | 2.1%(+1.62)#3,057 |
| 56. | Lesslie | 3.8% | 2.2%(+1.57)#56 | 2.1%(+1.61)#3,073 |
| 57. | Elloree | 3.7% | 2.2%(+1.52)#57 | 2.1%(+1.57)#3,135 |
| 58. | Estill | 3.7% | 2.2%(+1.49)#58 | 2.1%(+1.53)#3,204 |
| 59. | Clover | 3.7% | 2.2%(+1.48)#59 | 2.1%(+1.53)#3,220 |
| 60. | Centerville | 3.6% | 2.2%(+1.38)#60 | 2.1%(+1.43)#3,377 |
| 61. | Lyman | 3.6% | 2.2%(+1.37)#61 | 2.1%(+1.41)#3,410 |
| 62. | Lakewood | 3.5% | 2.2%(+1.34)#62 | 2.1%(+1.39)#3,468 |
| 63. | Mount Pleasant | 3.5% | 2.2%(+1.33)#63 | 2.1%(+1.38)#3,482 |
| 64. | Fripp Island | 3.5% | 2.2%(+1.32)#64 | 2.1%(+1.37)#3,489 |
| 65. | Simpsonville | 3.5% | 2.2%(+1.27)#65 | 2.1%(+1.31)#3,590 |
| 66. | Ninety Six | 3.5% | 2.2%(+1.26)#66 | 2.1%(+1.30)#3,602 |
| 67. | Anderson | 3.4% | 2.2%(+1.24)#67 | 2.1%(+1.28)#3,659 |
| 68. | Oakland | 3.4% | 2.2%(+1.18)#68 | 2.1%(+1.23)#3,763 |
| 69. | Heath Springs | 3.4% | 2.2%(+1.18)#69 | 2.1%(+1.23)#3,772 |
| 70. | Ladson | 3.3% | 2.2%(+1.12)#70 | 2.1%(+1.17)#3,873 |
| 71. | Camden | 3.3% | 2.2%(+1.11)#71 | 2.1%(+1.16)#3,892 |
| 72. | Pimlico | 3.3% | 2.2%(+1.11)#72 | 2.1%(+1.16)#3,896 |
| 73. | Hemingway | 3.2% | 2.2%(+1.05)#73 | 2.1%(+1.10)#4,003 |
| 74. | Dunean | 3.2% | 2.2%(+1.03)#74 | 2.1%(+1.08)#4,035 |
| 75. | Summit | 3.2% | 2.2%(+1.03)#75 | 2.1%(+1.08)#4,046 |
| 76. | Conestee | 3.1% | 2.2%(+0.929)#76 | 2.1%(+0.976)#4,273 |
| 77. | Litchfield Beach | 3.1% | 2.2%(+0.879)#77 | 2.1%(+0.926)#4,382 |
| 78. | Hartsville | 3.1% | 2.2%(+0.876)#78 | 2.1%(+0.923)#4,389 |
| 79. | Taylors | 3.1% | 2.2%(+0.868)#79 | 2.1%(+0.915)#4,412 |
| 80. | Westminster | 3.0% | 2.2%(+0.834)#80 | 2.1%(+0.881)#4,492 |
| 81. | Greer | 3.0% | 2.2%(+0.809)#81 | 2.1%(+0.856)#4,576 |
| 82. | Riverview | 3.0% | 2.2%(+0.791)#82 | 2.1%(+0.838)#4,613 |
| 83. | Woodford | 3.0% | 2.2%(+0.789)#83 | 2.1%(+0.836)#4,628 |
| 84. | Fountain Inn | 2.9% | 2.2%(+0.725)#84 | 2.1%(+0.772)#4,790 |
| 85. | Fort Lawn | 2.9% | 2.2%(+0.702)#85 | 2.1%(+0.749)#4,849 |
| 86. | Pine Ridge | 2.9% | 2.2%(+0.666)#86 | 2.1%(+0.713)#4,945 |
| 87. | Powdersville | 2.8% | 2.2%(+0.620)#87 | 2.1%(+0.667)#5,072 |
| 88. | Laurens | 2.7% | 2.2%(+0.536)#88 | 2.1%(+0.583)#5,312 |
| 89. | Ward | 2.7% | 2.2%(+0.531)#89 | 2.1%(+0.578)#5,338 |
| 90. | Tigerville | 2.7% | 2.2%(+0.497)#90 | 2.1%(+0.544)#5,451 |
| 91. | Mauldin | 2.7% | 2.2%(+0.481)#91 | 2.1%(+0.528)#5,502 |
| 92. | Cheraw | 2.7% | 2.2%(+0.472)#92 | 2.1%(+0.519)#5,527 |
| 93. | Gray Court | 2.7% | 2.2%(+0.459)#93 | 2.1%(+0.506)#5,563 |
| 94. | Charleston | 2.6% | 2.2%(+0.447)#94 | 2.1%(+0.494)#5,601 |
| 95. | Windsor | 2.6% | 2.2%(+0.435)#95 | 2.1%(+0.482)#5,641 |
| 96. | Lynchburg | 2.6% | 2.2%(+0.435)#96 | 2.1%(+0.482)#5,643 |
| 97. | Langley | 2.6% | 2.2%(+0.431)#97 | 2.1%(+0.478)#5,655 |
| 98. | Summerton | 2.6% | 2.2%(+0.424)#98 | 2.1%(+0.471)#5,671 |
| 99. | Mayo | 2.6% | 2.2%(+0.399)#99 | 2.1%(+0.446)#5,738 |
| 100. | White Knoll | 2.6% | 2.2%(+0.392)#100 | 2.1%(+0.440)#5,764 |
Common Questions
What are the Top 10 Cities with the Highest Percentage of Population Employed in Architecture & Engineering in South Carolina?
Top 10 Cities with the Highest Percentage of Population Employed in Architecture & Engineering in South Carolina are:
#1
31.9%
#2
30.0%
#3
16.2%
#4
15.5%
#5
13.7%
#6
13.5%
#7
11.4%
#8
11.1%
#9
10.2%
#10
9.6%
What city has the Highest Percentage of Population Employed in Architecture & Engineering in South Carolina?
Jamestown has the Highest Percentage of Population Employed in Architecture & Engineering in South Carolina with 31.9%.
What is the Percentage of Population Employed in Architecture & Engineering in the State of South Carolina?
Percentage of Population Employed in Architecture & Engineering in South Carolina is 2.2%.
What is the Percentage of Population Employed in Architecture & Engineering in the United States?
Percentage of Population Employed in Architecture & Engineering in the United States is 2.1%.