Cities with the Highest Percentage of Population Employed in Architecture & Engineering in Wyoming
RELATED REPORTS & OPTIONS
Architecture & Engineering
Wyoming
Compare Cities
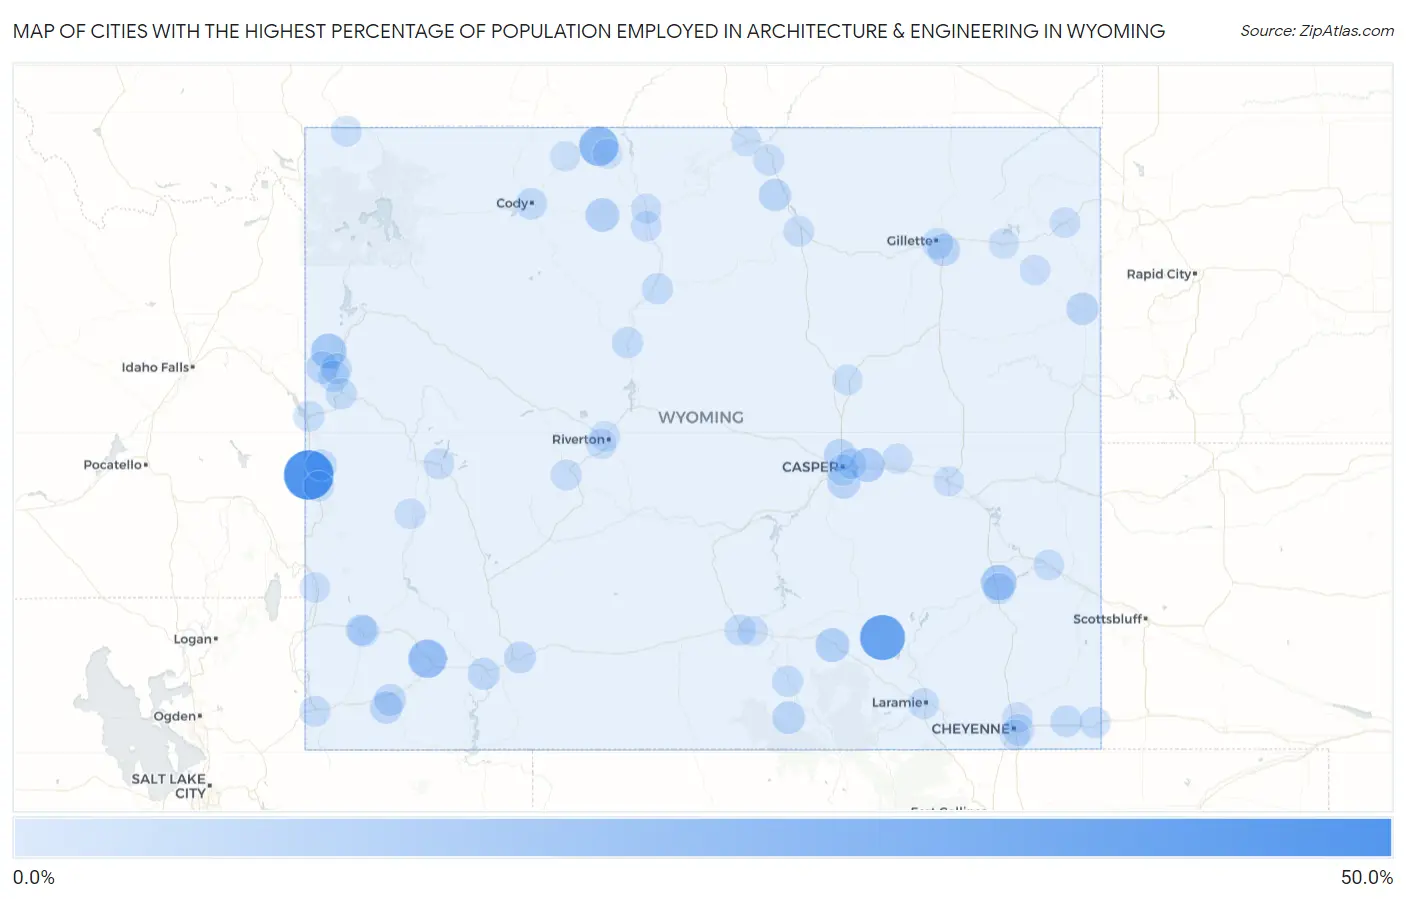
Map of Cities with the Highest Percentage of Population Employed in Architecture & Engineering in Wyoming
0.0%
50.0%
Cities with the Highest Percentage of Population Employed in Architecture & Engineering in Wyoming
| City | % Employed | vs State | vs National | |
| 1. | Auburn | 40.7% | 1.9%(+38.8)#1 | 2.1%(+38.5)#39 |
| 2. | Rock River | 30.9% | 1.9%(+29.0)#2 | 2.1%(+28.8)#56 |
| 3. | Cowley | 18.7% | 1.9%(+16.8)#3 | 2.1%(+16.5)#153 |
| 4. | Granger | 16.3% | 1.9%(+14.4)#4 | 2.1%(+14.2)#194 |
| 5. | Lakeview North | 10.9% | 1.9%(+8.98)#5 | 2.1%(+8.76)#430 |
| 6. | Teton Village | 10.4% | 1.9%(+8.45)#6 | 2.1%(+8.23)#465 |
| 7. | Meadow Acres | 7.9% | 1.9%(+5.97)#7 | 2.1%(+5.75)#742 |
| 8. | Elk Mountain | 7.7% | 1.9%(+5.77)#8 | 2.1%(+5.54)#772 |
| 9. | Burlington | 7.0% | 1.9%(+5.09)#9 | 2.1%(+4.87)#925 |
| 10. | Encampment | 5.1% | 1.9%(+3.22)#10 | 2.1%(+2.99)#1,739 |
| 11. | Casper Mountain | 5.0% | 1.9%(+3.07)#11 | 2.1%(+2.85)#1,833 |
| 12. | Story | 4.3% | 1.9%(+2.37)#12 | 2.1%(+2.14)#2,411 |
| 13. | Newcastle | 4.3% | 1.9%(+2.34)#13 | 2.1%(+2.12)#2,432 |
| 14. | Wilson | 4.1% | 1.9%(+2.19)#14 | 2.1%(+1.97)#2,632 |
| 15. | Mountain View | 4.1% | 1.9%(+2.15)#15 | 2.1%(+1.93)#2,672 |
| 16. | La Grange | 4.1% | 1.9%(+2.14)#16 | 2.1%(+1.92)#2,686 |
| 17. | Sleepy Hollow | 4.0% | 1.9%(+2.11)#17 | 2.1%(+1.89)#2,735 |
| 18. | Bar Nunn | 3.9% | 1.9%(+1.94)#18 | 2.1%(+1.71)#2,946 |
| 19. | Lyman | 3.5% | 1.9%(+1.57)#19 | 2.1%(+1.35)#3,540 |
| 20. | Green River | 3.3% | 1.9%(+1.40)#20 | 2.1%(+1.18)#3,858 |
| 21. | Rock Springs | 3.2% | 1.9%(+1.26)#21 | 2.1%(+1.04)#4,133 |
| 22. | Cody | 3.0% | 1.9%(+1.10)#22 | 2.1%(+0.879)#4,520 |
| 23. | Burns | 2.9% | 1.9%(+0.946)#23 | 2.1%(+0.724)#4,918 |
| 24. | Casper | 2.5% | 1.9%(+0.587)#24 | 2.1%(+0.365)#6,001 |
| 25. | Worland | 2.5% | 1.9%(+0.543)#25 | 2.1%(+0.321)#6,125 |
| 26. | South Park | 2.4% | 1.9%(+0.443)#26 | 2.1%(+0.220)#6,479 |
| 27. | Gillette | 2.3% | 1.9%(+0.392)#27 | 2.1%(+0.170)#6,671 |
| 28. | Diamondville | 2.3% | 1.9%(+0.351)#28 | 2.1%(+0.129)#6,816 |
| 29. | Cheyenne | 2.2% | 1.9%(+0.261)#29 | 2.1%(+0.039)#7,173 |
| 30. | Jackson | 2.2% | 1.9%(+0.261)#30 | 2.1%(+0.039)#7,174 |
| 31. | Hoback | 2.2% | 1.9%(+0.247)#31 | 2.1%(+0.025)#7,236 |
| 32. | Kemmerer | 2.0% | 1.9%(+0.078)#32 | 2.1%(-0.144)#7,910 |
| 33. | Turnerville | 2.0% | 1.9%(+0.073)#33 | 2.1%(-0.149)#7,933 |
| 34. | Rawlins | 1.9% | 1.9%(+0.009)#34 | 2.1%(-0.213)#8,157 |
| 35. | Wheatland | 1.9% | 1.9%(-0.011)#35 | 2.1%(-0.234)#8,236 |
| 36. | Pine Bluffs | 1.9% | 1.9%(-0.017)#36 | 2.1%(-0.239)#8,270 |
| 37. | Thermopolis | 1.9% | 1.9%(-0.021)#37 | 2.1%(-0.243)#8,285 |
| 38. | Saratoga | 1.9% | 1.9%(-0.049)#38 | 2.1%(-0.271)#8,399 |
| 39. | Sheridan | 1.8% | 1.9%(-0.142)#39 | 2.1%(-0.364)#8,829 |
| 40. | Evanston | 1.8% | 1.9%(-0.155)#40 | 2.1%(-0.377)#8,881 |
| 41. | Alpine | 1.7% | 1.9%(-0.235)#41 | 2.1%(-0.457)#9,272 |
| 42. | Lander | 1.7% | 1.9%(-0.257)#42 | 2.1%(-0.479)#9,362 |
| 43. | Evansville | 1.5% | 1.9%(-0.402)#43 | 2.1%(-0.624)#10,104 |
| 44. | Pinedale | 1.5% | 1.9%(-0.476)#44 | 2.1%(-0.698)#10,464 |
| 45. | Mammoth | 1.4% | 1.9%(-0.478)#45 | 2.1%(-0.700)#10,484 |
| 46. | Laramie | 1.4% | 1.9%(-0.524)#46 | 2.1%(-0.746)#10,711 |
| 47. | Buffalo | 1.3% | 1.9%(-0.577)#47 | 2.1%(-0.799)#10,986 |
| 48. | Fort Laramie | 1.3% | 1.9%(-0.594)#48 | 2.1%(-0.816)#11,092 |
| 49. | Afton | 1.0% | 1.9%(-0.885)#49 | 2.1%(-1.11)#12,605 |
| 50. | Ranchettes | 1.0% | 1.9%(-0.906)#50 | 2.1%(-1.13)#12,725 |
| 51. | Sundance | 1.0% | 1.9%(-0.917)#51 | 2.1%(-1.14)#12,785 |
| 52. | South Greeley | 0.97% | 1.9%(-0.956)#52 | 2.1%(-1.18)#12,994 |
| 53. | Big Piney | 0.97% | 1.9%(-0.956)#53 | 2.1%(-1.18)#12,998 |
| 54. | Midwest | 0.86% | 1.9%(-1.07)#54 | 2.1%(-1.29)#13,627 |
| 55. | Upton | 0.79% | 1.9%(-1.14)#55 | 2.1%(-1.36)#14,042 |
| 56. | Basin | 0.74% | 1.9%(-1.19)#56 | 2.1%(-1.41)#14,339 |
| 57. | Rolling Hills | 0.70% | 1.9%(-1.23)#57 | 2.1%(-1.45)#14,568 |
| 58. | Riverton | 0.67% | 1.9%(-1.26)#58 | 2.1%(-1.48)#14,717 |
| 59. | Cokeville | 0.56% | 1.9%(-1.37)#59 | 2.1%(-1.59)#15,286 |
| 60. | Douglas | 0.54% | 1.9%(-1.38)#60 | 2.1%(-1.60)#15,386 |
| 61. | Arapahoe | 0.51% | 1.9%(-1.41)#61 | 2.1%(-1.63)#15,526 |
| 62. | Greybull | 0.45% | 1.9%(-1.48)#62 | 2.1%(-1.70)#15,862 |
| 63. | Powell | 0.42% | 1.9%(-1.50)#63 | 2.1%(-1.72)#15,963 |
| 64. | Sinclair | 0.40% | 1.9%(-1.53)#64 | 2.1%(-1.75)#16,084 |
| 65. | Ranchester | 0.40% | 1.9%(-1.53)#65 | 2.1%(-1.75)#16,103 |
| 66. | Moorcroft | 0.36% | 1.9%(-1.57)#66 | 2.1%(-1.79)#16,259 |
| 67. | Lovell | 0.11% | 1.9%(-1.82)#67 | 2.1%(-2.04)#16,829 |
1
2Common Questions
What are the Top 10 Cities with the Highest Percentage of Population Employed in Architecture & Engineering in Wyoming?
Top 10 Cities with the Highest Percentage of Population Employed in Architecture & Engineering in Wyoming are:
#1
40.7%
#2
30.9%
#3
18.7%
#4
16.3%
#5
10.9%
#6
10.4%
#7
7.9%
#8
7.7%
#9
7.0%
#10
5.1%
What city has the Highest Percentage of Population Employed in Architecture & Engineering in Wyoming?
Auburn has the Highest Percentage of Population Employed in Architecture & Engineering in Wyoming with 40.7%.
What is the Percentage of Population Employed in Architecture & Engineering in the State of Wyoming?
Percentage of Population Employed in Architecture & Engineering in Wyoming is 1.9%.
What is the Percentage of Population Employed in Architecture & Engineering in the United States?
Percentage of Population Employed in Architecture & Engineering in the United States is 2.1%.