Zip Codes with the Highest Percentage of Population Employed in Architecture & Engineering in Compton, CA
RELATED REPORTS & OPTIONS
Architecture & Engineering
Compton
Compare Zip Codes
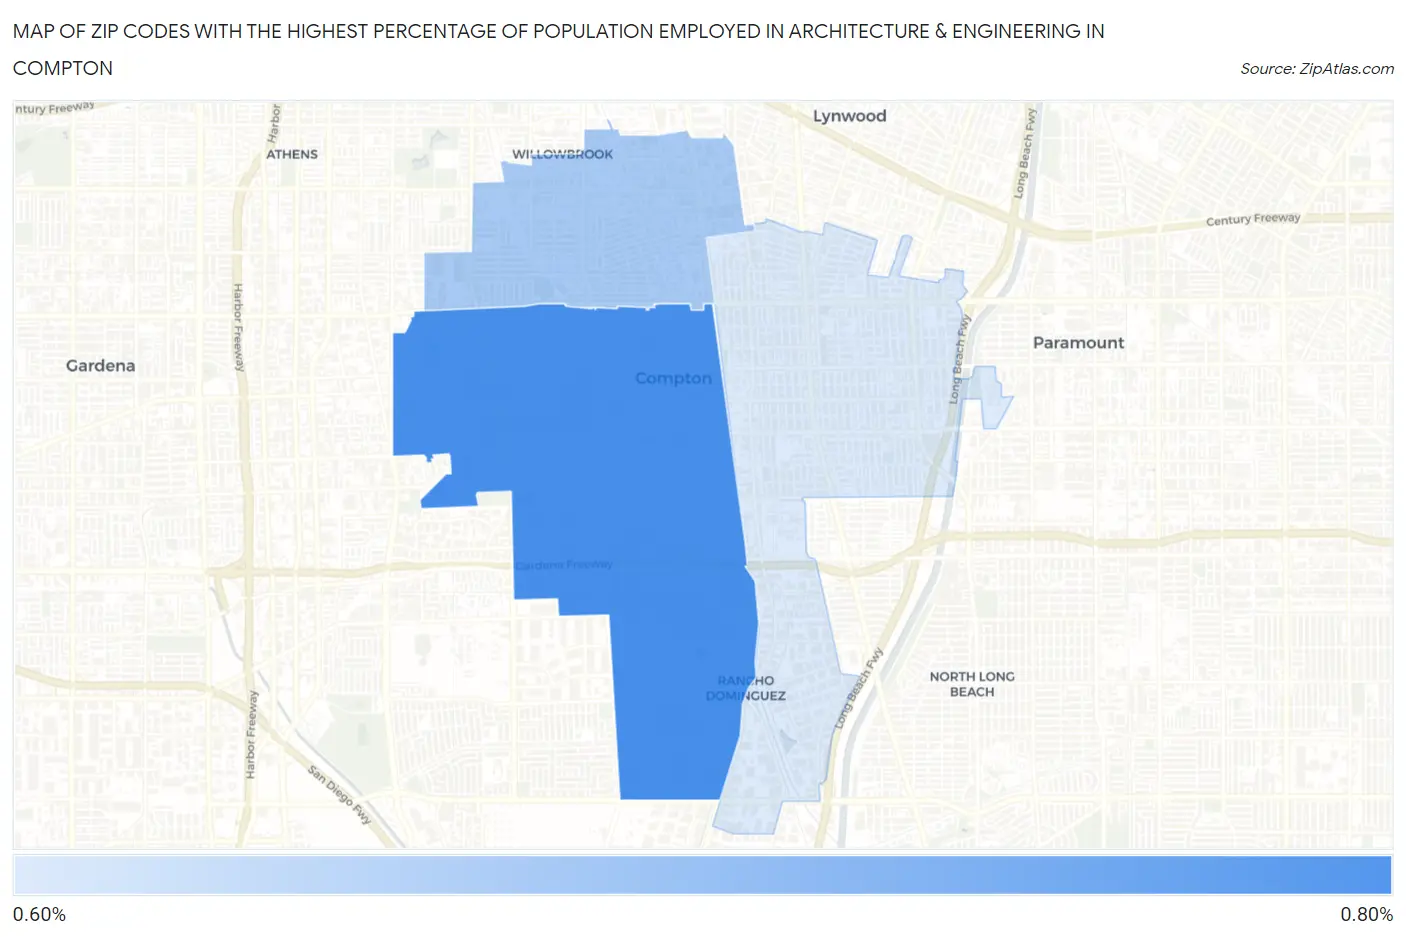
Map of Zip Codes with the Highest Percentage of Population Employed in Architecture & Engineering in Compton
0.62%
0.67%
Zip Codes with the Highest Percentage of Population Employed in Architecture & Engineering in Compton, CA
| Zip Code | % Employed | vs State | vs National | |
| 1. | 90220 | 0.67% | 2.6%(-1.89)#1,159 | 2.1%(-1.48)#19,128 |
| 2. | 90222 | 0.64% | 2.6%(-1.92)#1,173 | 2.1%(-1.51)#19,330 |
| 3. | 90221 | 0.62% | 2.6%(-1.93)#1,182 | 2.1%(-1.53)#19,450 |
1
Common Questions
What are the Top Zip Codes with the Highest Percentage of Population Employed in Architecture & Engineering in Compton, CA?
Top Zip Codes with the Highest Percentage of Population Employed in Architecture & Engineering in Compton, CA are:
What zip code has the Highest Percentage of Population Employed in Architecture & Engineering in Compton, CA?
90220 has the Highest Percentage of Population Employed in Architecture & Engineering in Compton, CA with 0.67%.
What is the Percentage of Population Employed in Architecture & Engineering in Compton, CA?
Percentage of Population Employed in Architecture & Engineering in Compton is 0.68%.
What is the Percentage of Population Employed in Architecture & Engineering in California?
Percentage of Population Employed in Architecture & Engineering in California is 2.6%.
What is the Percentage of Population Employed in Architecture & Engineering in the United States?
Percentage of Population Employed in Architecture & Engineering in the United States is 2.1%.