Milpitas, CA Map & Demographics
Milpitas Map
Milpitas Overview
$61,826
PER CAPITA INCOME
$171,937
AVG FAMILY INCOME
$166,769
AVG HOUSEHOLD INCOME
40.6%
WAGE / INCOME GAP [ % ]
59.4¢/ $1
WAGE / INCOME GAP [ $ ]
$12,259
FAMILY INCOME DEFICIT
0.40
INEQUALITY / GINI INDEX
79,092
TOTAL POPULATION
41,996
MALE POPULATION
37,096
FEMALE POPULATION
113.21
MALES / 100 FEMALES
88.33
FEMALES / 100 MALES
36.1
MEDIAN AGE
3.4
AVG FAMILY SIZE
3.2
AVG HOUSEHOLD SIZE
43,871
LABOR FORCE [ PEOPLE ]
67.8%
PERCENT IN LABOR FORCE
4.5%
UNEMPLOYMENT RATE
Milpitas Zip Codes
Milpitas Area Codes
Income in Milpitas
Income Overview in Milpitas
Per Capita Income in Milpitas is $61,826, while median incomes of families and households are $171,937 and $166,769 respectively.
| Characteristic | Number | Measure |
| Per Capita Income | 79,092 | $61,826 |
| Median Family Income | 19,421 | $171,937 |
| Mean Family Income | 19,421 | $204,734 |
| Median Household Income | 24,395 | $166,769 |
| Mean Household Income | 24,395 | $195,424 |
| Income Deficit | 19,421 | $12,259 |
| Wage / Income Gap (%) | 79,092 | 40.63% |
| Wage / Income Gap ($) | 79,092 | 59.37¢ per $1 |
| Gini / Inequality Index | 79,092 | 0.40 |
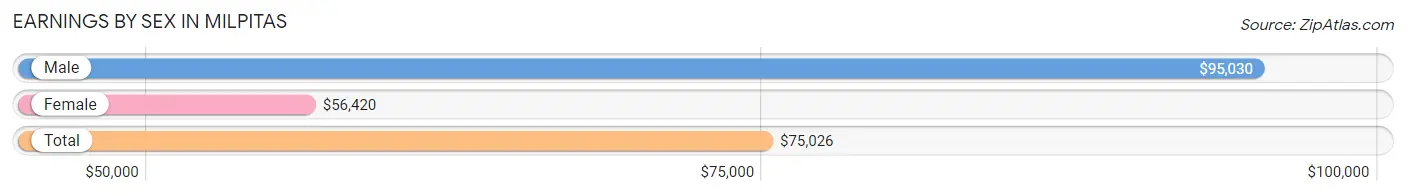
Earnings by Sex in Milpitas
Average Earnings in Milpitas are $75,026, $95,030 for men and $56,420 for women, a difference of 40.6%.
| Sex | Number | Average Earnings |
| Male | 25,557 (56.7%) | $95,030 |
| Female | 19,546 (43.3%) | $56,420 |
| Total | 45,103 (100.0%) | $75,026 |
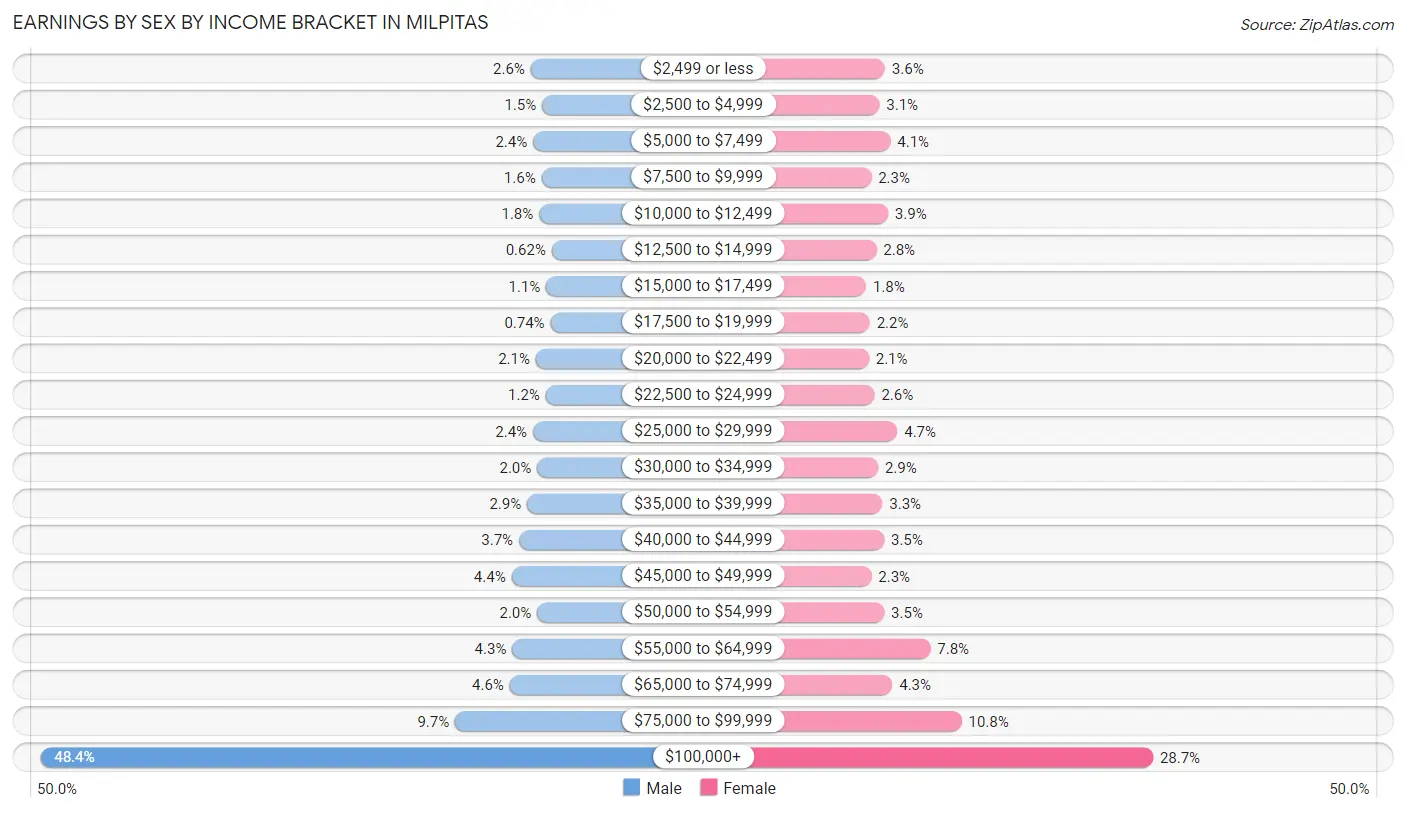
Earnings by Sex by Income Bracket in Milpitas
The most common earnings brackets in Milpitas are $100,000+ for men (12,377 | 48.4%) and $100,000+ for women (5,605 | 28.7%).
| Income | Male | Female |
| $2,499 or less | 661 (2.6%) | 698 (3.6%) |
| $2,500 to $4,999 | 389 (1.5%) | 596 (3.0%) |
| $5,000 to $7,499 | 605 (2.4%) | 798 (4.1%) |
| $7,500 to $9,999 | 403 (1.6%) | 448 (2.3%) |
| $10,000 to $12,499 | 459 (1.8%) | 752 (3.8%) |
| $12,500 to $14,999 | 158 (0.6%) | 542 (2.8%) |
| $15,000 to $17,499 | 292 (1.1%) | 351 (1.8%) |
| $17,500 to $19,999 | 189 (0.7%) | 421 (2.1%) |
| $20,000 to $22,499 | 538 (2.1%) | 403 (2.1%) |
| $22,500 to $24,999 | 305 (1.2%) | 507 (2.6%) |
| $25,000 to $29,999 | 607 (2.4%) | 925 (4.7%) |
| $30,000 to $34,999 | 509 (2.0%) | 570 (2.9%) |
| $35,000 to $39,999 | 748 (2.9%) | 651 (3.3%) |
| $40,000 to $44,999 | 942 (3.7%) | 682 (3.5%) |
| $45,000 to $49,999 | 1,122 (4.4%) | 449 (2.3%) |
| $50,000 to $54,999 | 508 (2.0%) | 684 (3.5%) |
| $55,000 to $64,999 | 1,105 (4.3%) | 1,530 (7.8%) |
| $65,000 to $74,999 | 1,166 (4.6%) | 833 (4.3%) |
| $75,000 to $99,999 | 2,474 (9.7%) | 2,101 (10.7%) |
| $100,000+ | 12,377 (48.4%) | 5,605 (28.7%) |
| Total | 25,557 (100.0%) | 19,546 (100.0%) |
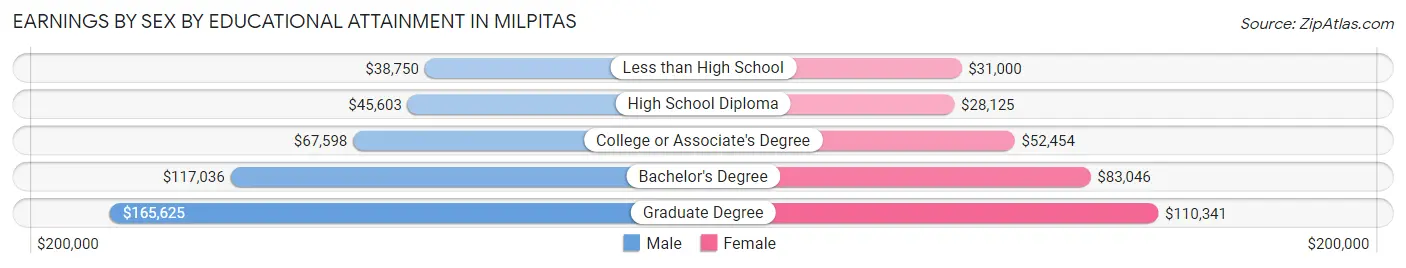
Earnings by Sex by Educational Attainment in Milpitas
Average earnings in Milpitas are $103,987 for men and $61,724 for women, a difference of 40.6%. Men with an educational attainment of graduate degree enjoy the highest average annual earnings of $165,625, while those with less than high school education earn the least with $38,750. Women with an educational attainment of graduate degree earn the most with the average annual earnings of $110,341, while those with high school diploma education have the smallest earnings of $28,125.
| Educational Attainment | Male Income | Female Income |
| Less than High School | $38,750 | $31,000 |
| High School Diploma | $45,603 | $28,125 |
| College or Associate's Degree | $67,598 | $52,454 |
| Bachelor's Degree | $117,036 | $83,046 |
| Graduate Degree | $165,625 | $110,341 |
| Total | $103,987 | $61,724 |
Family Income in Milpitas
Family Income Brackets in Milpitas
According to the Milpitas family income data, there are 8,215 families falling into the $200,000+ income range, which is the most common income bracket and makes up 42.3% of all families. Conversely, the $10,000 to $14,999 income bracket is the least frequent group with only 175 families (0.9%) belonging to this category.
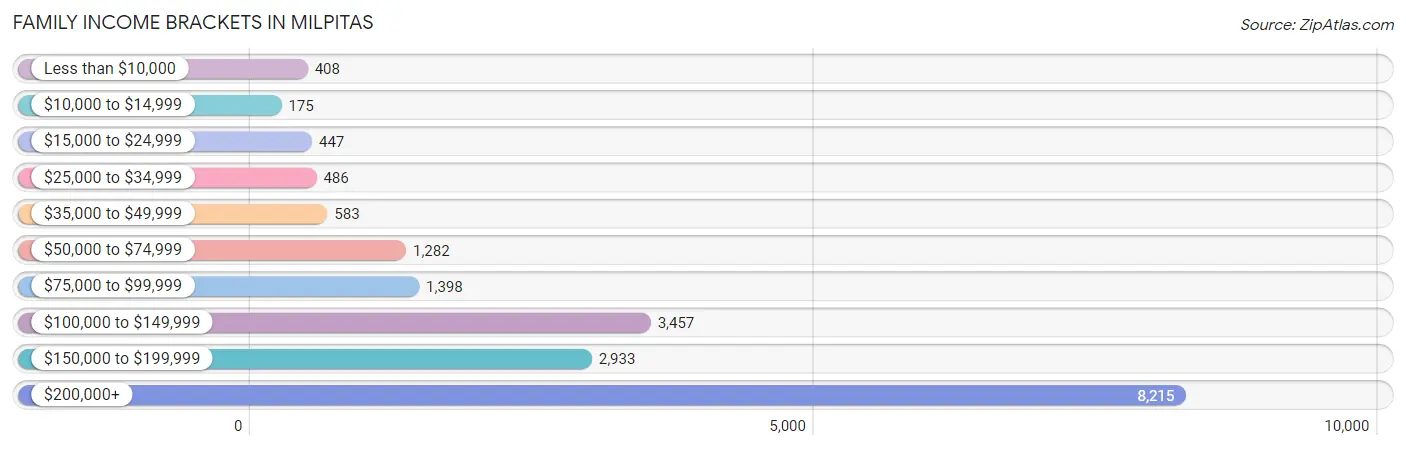
| Income Bracket | # Families | % Families |
| Less than $10,000 | 408 | 2.1% |
| $10,000 to $14,999 | 175 | 0.9% |
| $15,000 to $24,999 | 447 | 2.3% |
| $25,000 to $34,999 | 486 | 2.5% |
| $35,000 to $49,999 | 583 | 3.0% |
| $50,000 to $74,999 | 1,282 | 6.6% |
| $75,000 to $99,999 | 1,398 | 7.2% |
| $100,000 to $149,999 | 3,457 | 17.8% |
| $150,000 to $199,999 | 2,933 | 15.1% |
| $200,000+ | 8,215 | 42.3% |
Family Income by Famaliy Size in Milpitas
6-person families (681 | 3.5%) account for the highest median family income in Milpitas with $235,724 per family, while 2-person families (6,724 | 34.6%) have the highest median income of $72,932 per family member.
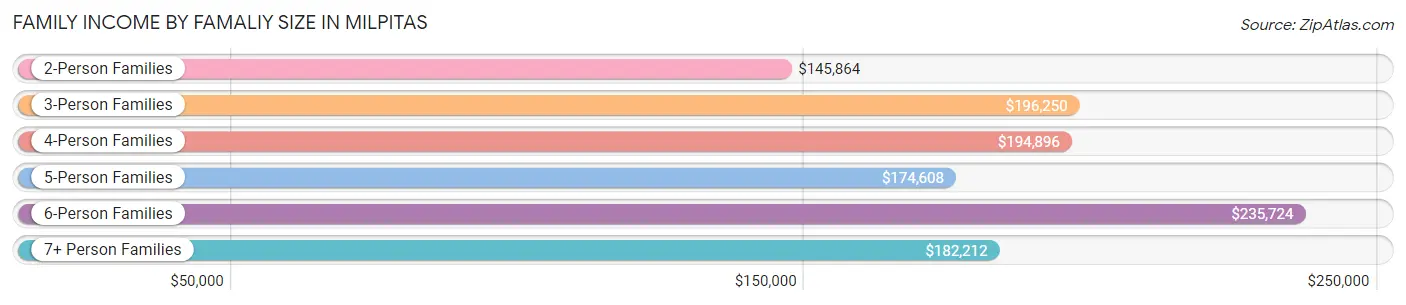
| Income Bracket | # Families | Median Income |
| 2-Person Families | 6,724 (34.6%) | $145,864 |
| 3-Person Families | 4,896 (25.2%) | $196,250 |
| 4-Person Families | 4,654 (24.0%) | $194,896 |
| 5-Person Families | 1,933 (10.0%) | $174,608 |
| 6-Person Families | 681 (3.5%) | $235,724 |
| 7+ Person Families | 533 (2.7%) | $182,212 |
| Total | 19,421 (100.0%) | $171,937 |
Family Income by Number of Earners in Milpitas
The median family income in Milpitas is $171,937, with families comprising 2 earners (9,173) having the highest median family income of $228,545, while families with no earners (1,662) have the lowest median family income of $34,489, accounting for 47.2% and 8.6% of families, respectively.
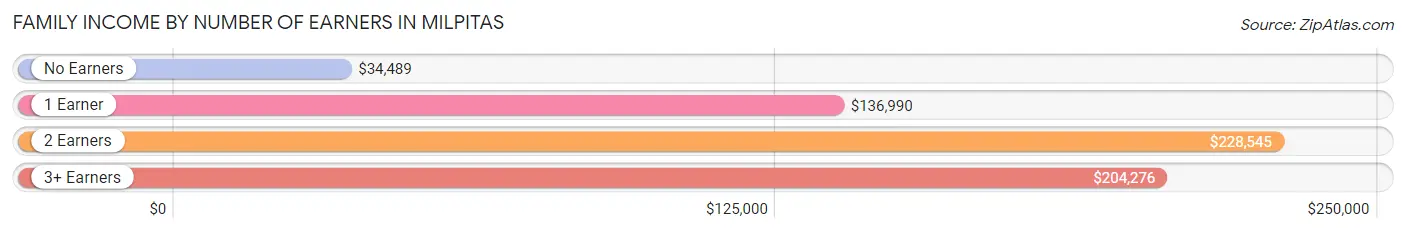
| Number of Earners | # Families | Median Income |
| No Earners | 1,662 (8.6%) | $34,489 |
| 1 Earner | 5,226 (26.9%) | $136,990 |
| 2 Earners | 9,173 (47.2%) | $228,545 |
| 3+ Earners | 3,360 (17.3%) | $204,276 |
| Total | 19,421 (100.0%) | $171,937 |
Household Income in Milpitas
Household Income Brackets in Milpitas
With 9,734 households falling in the category, the $200,000+ income range is the most frequent in Milpitas, accounting for 39.9% of all households. In contrast, only 537 households (2.2%) fall into the $10,000 to $14,999 income bracket, making it the least populous group.
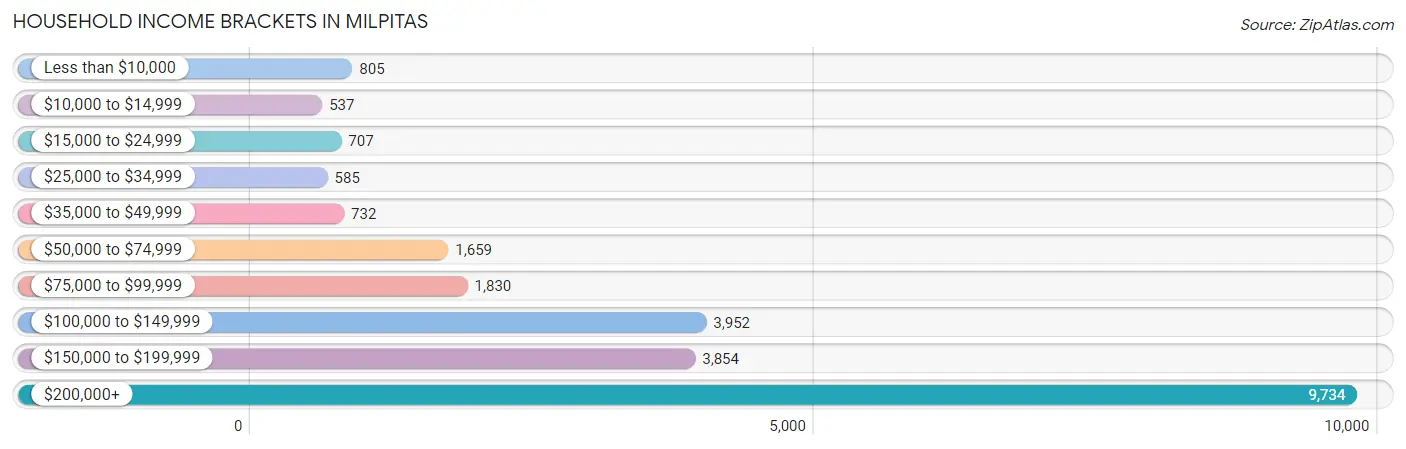
| Income Bracket | # Households | % Households |
| Less than $10,000 | 805 | 3.3% |
| $10,000 to $14,999 | 537 | 2.2% |
| $15,000 to $24,999 | 707 | 2.9% |
| $25,000 to $34,999 | 585 | 2.4% |
| $35,000 to $49,999 | 732 | 3.0% |
| $50,000 to $74,999 | 1,659 | 6.8% |
| $75,000 to $99,999 | 1,830 | 7.5% |
| $100,000 to $149,999 | 3,952 | 16.2% |
| $150,000 to $199,999 | 3,854 | 15.8% |
| $200,000+ | 9,734 | 39.9% |
Household Income by Householder Age in Milpitas
The median household income in Milpitas is $166,769, with the highest median household income of $216,096 found in the 25 to 44 years age bracket for the primary householder. A total of 10,598 households (43.4%) fall into this category. Meanwhile, the 15 to 24 years age bracket for the primary householder has the lowest median household income of $0, with 246 households (1.0%) in this group.
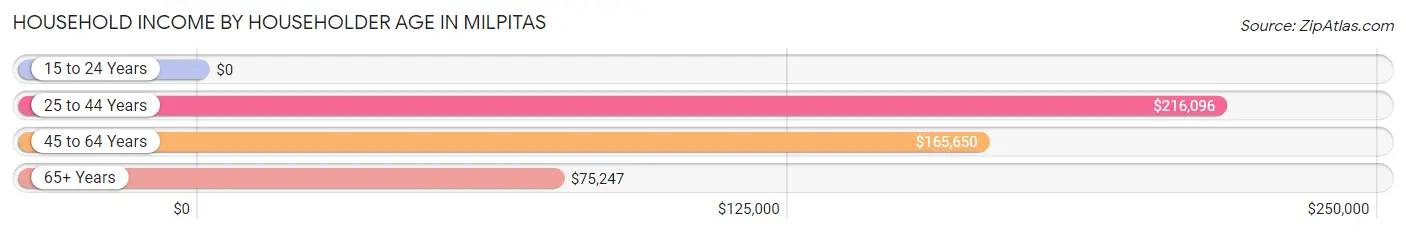
| Income Bracket | # Households | Median Income |
| 15 to 24 Years | 246 (1.0%) | $0 |
| 25 to 44 Years | 10,598 (43.4%) | $216,096 |
| 45 to 64 Years | 9,003 (36.9%) | $165,650 |
| 65+ Years | 4,548 (18.6%) | $75,247 |
| Total | 24,395 (100.0%) | $166,769 |
Poverty in Milpitas
Income Below Poverty by Sex and Age in Milpitas
With 5.1% poverty level for males and 6.8% for females among the residents of Milpitas, 75 year old and over males and 75 year old and over females are the most vulnerable to poverty, with 226 males (12.0%) and 473 females (23.4%) in their respective age groups living below the poverty level.
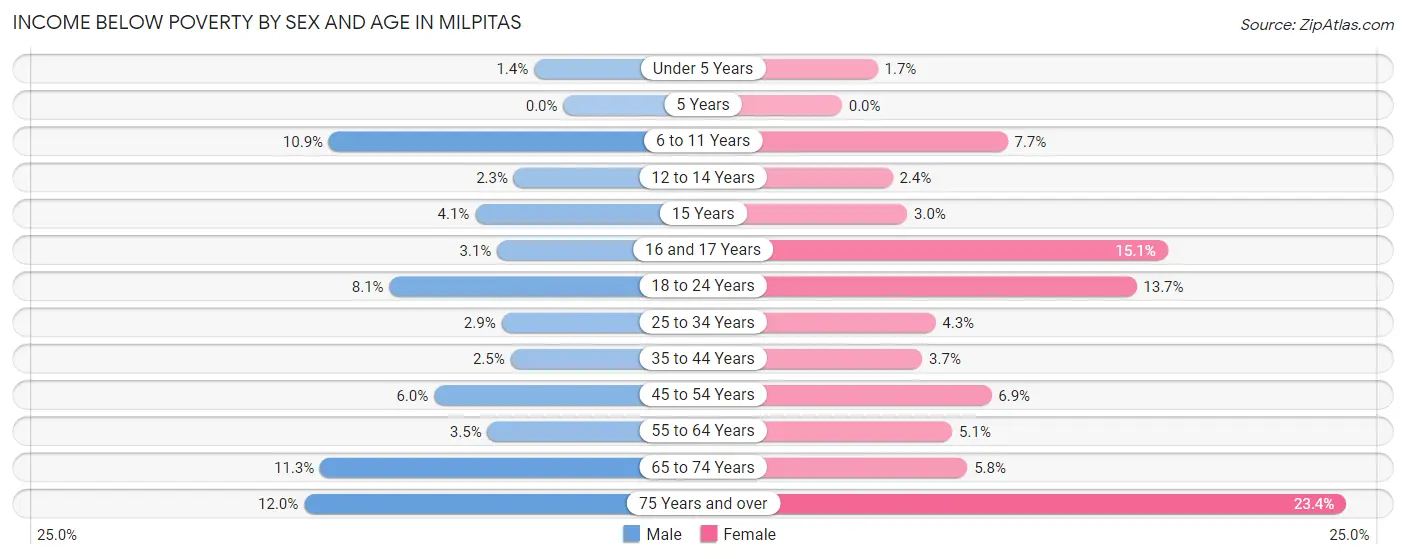
| Age Bracket | Male | Female |
| Under 5 Years | 35 (1.4%) | 31 (1.7%) |
| 5 Years | 0 (0.0%) | 0 (0.0%) |
| 6 to 11 Years | 353 (10.9%) | 197 (7.7%) |
| 12 to 14 Years | 31 (2.3%) | 29 (2.4%) |
| 15 Years | 19 (4.1%) | 7 (3.0%) |
| 16 and 17 Years | 26 (3.1%) | 171 (15.1%) |
| 18 to 24 Years | 224 (8.1%) | 340 (13.7%) |
| 25 to 34 Years | 229 (2.9%) | 303 (4.3%) |
| 35 to 44 Years | 158 (2.5%) | 210 (3.7%) |
| 45 to 54 Years | 296 (6.0%) | 300 (6.9%) |
| 55 to 64 Years | 167 (3.5%) | 250 (5.1%) |
| 65 to 74 Years | 296 (11.3%) | 180 (5.8%) |
| 75 Years and over | 226 (12.0%) | 473 (23.4%) |
| Total | 2,060 (5.1%) | 2,491 (6.8%) |
Income Above Poverty by Sex and Age in Milpitas
According to the poverty statistics in Milpitas, males aged 5 years and females aged 5 years are the age groups that are most secure financially, with 100.0% of males and 100.0% of females in these age groups living above the poverty line.
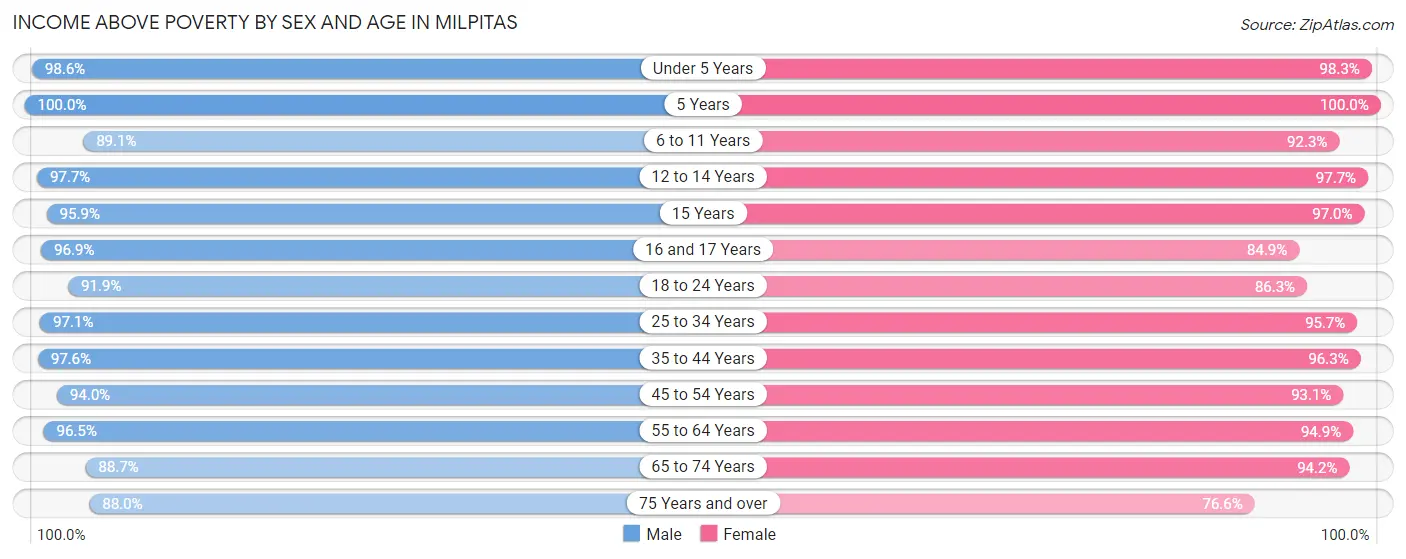
| Age Bracket | Male | Female |
| Under 5 Years | 2,535 (98.6%) | 1,836 (98.3%) |
| 5 Years | 484 (100.0%) | 291 (100.0%) |
| 6 to 11 Years | 2,890 (89.1%) | 2,366 (92.3%) |
| 12 to 14 Years | 1,318 (97.7%) | 1,204 (97.7%) |
| 15 Years | 446 (95.9%) | 224 (97.0%) |
| 16 and 17 Years | 820 (96.9%) | 960 (84.9%) |
| 18 to 24 Years | 2,552 (91.9%) | 2,147 (86.3%) |
| 25 to 34 Years | 7,764 (97.1%) | 6,677 (95.7%) |
| 35 to 44 Years | 6,282 (97.6%) | 5,419 (96.3%) |
| 45 to 54 Years | 4,634 (94.0%) | 4,024 (93.1%) |
| 55 to 64 Years | 4,578 (96.5%) | 4,630 (94.9%) |
| 65 to 74 Years | 2,326 (88.7%) | 2,913 (94.2%) |
| 75 Years and over | 1,652 (88.0%) | 1,548 (76.6%) |
| Total | 38,281 (94.9%) | 34,239 (93.2%) |
Income Below Poverty Among Married-Couple Families in Milpitas
The poverty statistics for married-couple families in Milpitas show that 2.9% or 446 of the total 15,481 families live below the poverty line. Families with no children have the highest poverty rate of 3.5%, comprising of 266 families. On the other hand, families with 3 or 4 children have the lowest poverty rate of 0.0%, which includes 0 families.
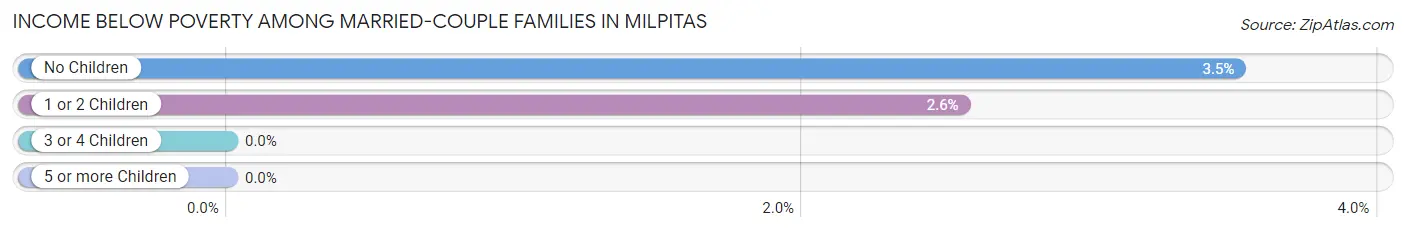
| Children | Above Poverty | Below Poverty |
| No Children | 7,317 (96.5%) | 266 (3.5%) |
| 1 or 2 Children | 6,882 (97.5%) | 180 (2.5%) |
| 3 or 4 Children | 819 (100.0%) | 0 (0.0%) |
| 5 or more Children | 17 (100.0%) | 0 (0.0%) |
| Total | 15,035 (97.1%) | 446 (2.9%) |
Income Below Poverty Among Single-Parent Households in Milpitas
According to the poverty data in Milpitas, 5.7% or 81 single-father households and 11.7% or 293 single-mother households are living below the poverty line. Among single-father households, those with 1 or 2 children have the highest poverty rate, with 65 households (11.3%) experiencing poverty. Likewise, among single-mother households, those with 3 or 4 children have the highest poverty rate, with 108 households (44.6%) falling below the poverty line.
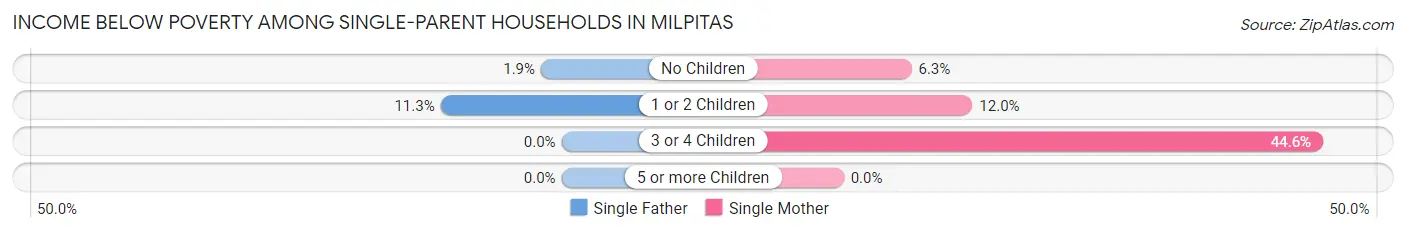
| Children | Single Father | Single Mother |
| No Children | 16 (1.9%) | 96 (6.3%) |
| 1 or 2 Children | 65 (11.3%) | 89 (12.0%) |
| 3 or 4 Children | 0 (0.0%) | 108 (44.6%) |
| 5 or more Children | 0 (0.0%) | 0 (0.0%) |
| Total | 81 (5.7%) | 293 (11.7%) |
Income Below Poverty Among Married-Couple vs Single-Parent Households in Milpitas
The poverty data for Milpitas shows that 446 of the married-couple family households (2.9%) and 374 of the single-parent households (9.5%) are living below the poverty level. Within the married-couple family households, those with no children have the highest poverty rate, with 266 households (3.5%) falling below the poverty line. Among the single-parent households, those with 3 or 4 children have the highest poverty rate, with 108 household (42.0%) living below poverty.
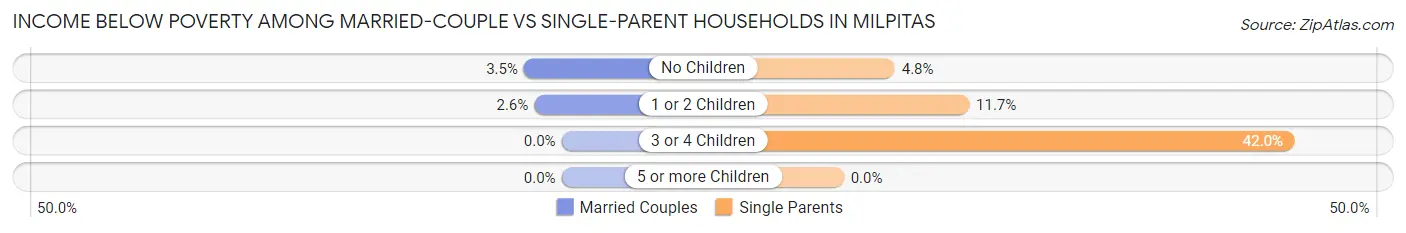
| Children | Married-Couple Families | Single-Parent Households |
| No Children | 266 (3.5%) | 112 (4.8%) |
| 1 or 2 Children | 180 (2.5%) | 154 (11.7%) |
| 3 or 4 Children | 0 (0.0%) | 108 (42.0%) |
| 5 or more Children | 0 (0.0%) | 0 (0.0%) |
| Total | 446 (2.9%) | 374 (9.5%) |
Race in Milpitas
The most populous races in Milpitas are Asian (55,266 | 69.9%), Hispanic or Latino (10,676 | 13.5%), and White / Caucasian (10,530 | 13.3%).
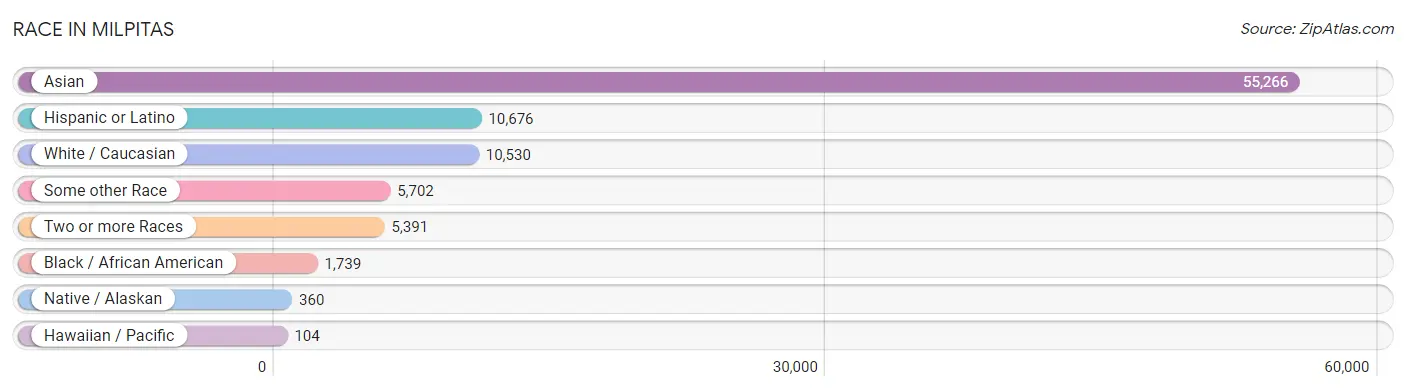
| Race | # Population | % Population |
| Asian | 55,266 | 69.9% |
| Black / African American | 1,739 | 2.2% |
| Hawaiian / Pacific | 104 | 0.1% |
| Hispanic or Latino | 10,676 | 13.5% |
| Native / Alaskan | 360 | 0.5% |
| White / Caucasian | 10,530 | 13.3% |
| Two or more Races | 5,391 | 6.8% |
| Some other Race | 5,702 | 7.2% |
| Total | 79,092 | 100.0% |
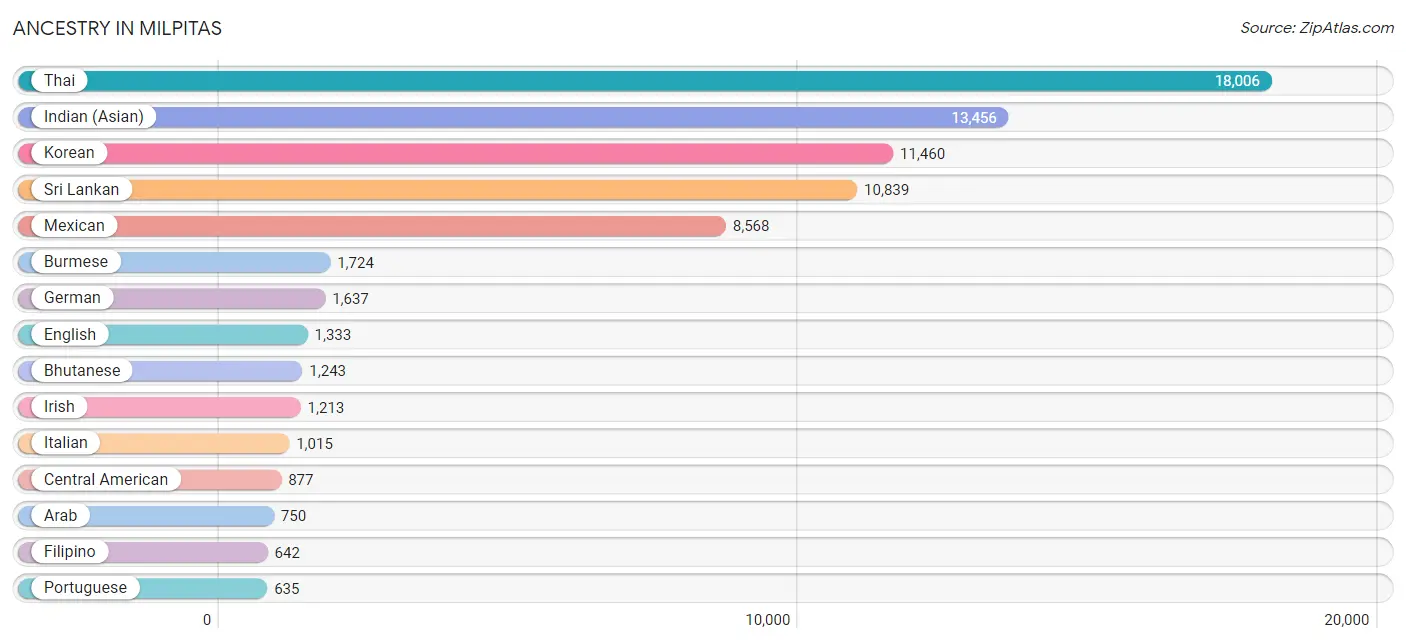
Ancestry in Milpitas
The most populous ancestries reported in Milpitas are Thai (18,006 | 22.8%), Indian (Asian) (13,456 | 17.0%), Korean (11,460 | 14.5%), Sri Lankan (10,839 | 13.7%), and Mexican (8,568 | 10.8%), together accounting for 78.8% of all Milpitas residents.
| Ancestry | # Population | % Population |
| Afghan | 153 | 0.2% |
| African | 111 | 0.1% |
| Alaskan Athabascan | 11 | 0.0% |
| American | 624 | 0.8% |
| Apache | 29 | 0.0% |
| Arab | 750 | 0.9% |
| Argentinean | 2 | 0.0% |
| Armenian | 92 | 0.1% |
| Assyrian / Chaldean / Syriac | 59 | 0.1% |
| Australian | 62 | 0.1% |
| Austrian | 80 | 0.1% |
| Bangladeshi | 203 | 0.3% |
| Basque | 4 | 0.0% |
| Belizean | 4 | 0.0% |
| Bhutanese | 1,243 | 1.6% |
| Blackfeet | 39 | 0.1% |
| Brazilian | 63 | 0.1% |
| British | 126 | 0.2% |
| Burmese | 1,724 | 2.2% |
| Cambodian | 26 | 0.0% |
| Canadian | 45 | 0.1% |
| Celtic | 11 | 0.0% |
| Central American | 877 | 1.1% |
| Central American Indian | 94 | 0.1% |
| Cherokee | 53 | 0.1% |
| Chippewa | 83 | 0.1% |
| Choctaw | 33 | 0.0% |
| Colombian | 64 | 0.1% |
| Costa Rican | 172 | 0.2% |
| Croatian | 22 | 0.0% |
| Cuban | 51 | 0.1% |
| Czech | 20 | 0.0% |
| Danish | 57 | 0.1% |
| Dominican | 36 | 0.1% |
| Dutch | 237 | 0.3% |
| Eastern European | 26 | 0.0% |
| Ecuadorian | 59 | 0.1% |
| English | 1,333 | 1.7% |
| Estonian | 7 | 0.0% |
| Ethiopian | 34 | 0.0% |
| European | 509 | 0.6% |
| Filipino | 642 | 0.8% |
| Finnish | 39 | 0.1% |
| French | 409 | 0.5% |
| French Canadian | 48 | 0.1% |
| German | 1,637 | 2.1% |
| Greek | 177 | 0.2% |
| Guamanian / Chamorro | 49 | 0.1% |
| Guatemalan | 182 | 0.2% |
| Honduran | 81 | 0.1% |
| Hungarian | 19 | 0.0% |
| Indian (Asian) | 13,456 | 17.0% |
| Indonesian | 135 | 0.2% |
| Iranian | 118 | 0.2% |
| Iraqi | 184 | 0.2% |
| Irish | 1,213 | 1.5% |
| Iroquois | 14 | 0.0% |
| Israeli | 27 | 0.0% |
| Italian | 1,015 | 1.3% |
| Jamaican | 16 | 0.0% |
| Japanese | 69 | 0.1% |
| Korean | 11,460 | 14.5% |
| Laotian | 408 | 0.5% |
| Lebanese | 15 | 0.0% |
| Lithuanian | 48 | 0.1% |
| Macedonian | 23 | 0.0% |
| Malaysian | 269 | 0.3% |
| Mexican | 8,568 | 10.8% |
| Mexican American Indian | 126 | 0.2% |
| Mongolian | 65 | 0.1% |
| Moroccan | 28 | 0.0% |
| Native Hawaiian | 248 | 0.3% |
| Navajo | 9 | 0.0% |
| Nicaraguan | 109 | 0.1% |
| Nigerian | 5 | 0.0% |
| Northern European | 25 | 0.0% |
| Norwegian | 151 | 0.2% |
| Ottawa | 4 | 0.0% |
| Pakistani | 204 | 0.3% |
| Palestinian | 5 | 0.0% |
| Panamanian | 23 | 0.0% |
| Peruvian | 106 | 0.1% |
| Polish | 347 | 0.4% |
| Portuguese | 635 | 0.8% |
| Pueblo | 8 | 0.0% |
| Puerto Rican | 326 | 0.4% |
| Romanian | 27 | 0.0% |
| Russian | 313 | 0.4% |
| Salvadoran | 310 | 0.4% |
| Samoan | 80 | 0.1% |
| Scandinavian | 56 | 0.1% |
| Scotch-Irish | 95 | 0.1% |
| Scottish | 103 | 0.1% |
| Serbian | 6 | 0.0% |
| Slovene | 58 | 0.1% |
| Somali | 11 | 0.0% |
| South American | 299 | 0.4% |
| Spaniard | 51 | 0.1% |
| Spanish | 84 | 0.1% |
| Sri Lankan | 10,839 | 13.7% |
| Subsaharan African | 177 | 0.2% |
| Swedish | 222 | 0.3% |
| Swiss | 47 | 0.1% |
| Thai | 18,006 | 22.8% |
| Tongan | 9 | 0.0% |
| Trinidadian and Tobagonian | 64 | 0.1% |
| Ukrainian | 230 | 0.3% |
| Venezuelan | 68 | 0.1% |
| Vietnamese | 43 | 0.1% |
| Welsh | 11 | 0.0% | View All 110 Rows |
Immigrants in Milpitas
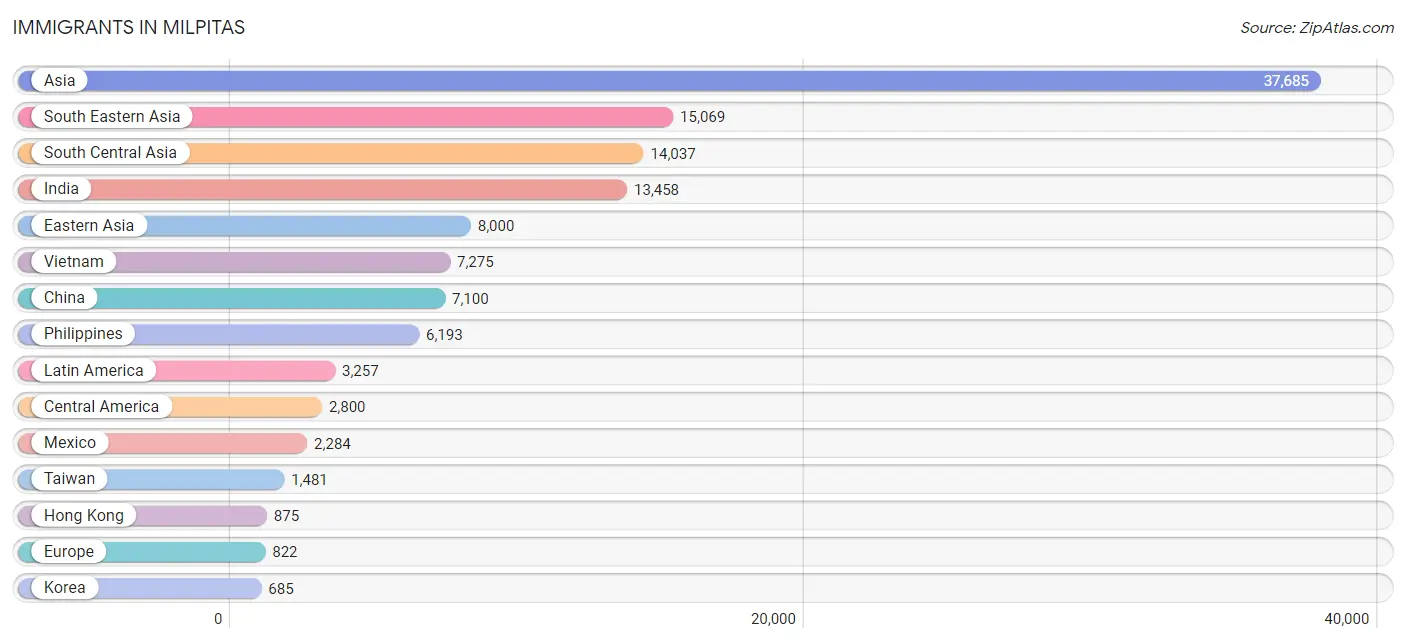
The most numerous immigrant groups reported in Milpitas came from Asia (37,685 | 47.6%), South Eastern Asia (15,069 | 19.1%), South Central Asia (14,037 | 17.7%), India (13,458 | 17.0%), and Eastern Asia (8,000 | 10.1%), together accounting for 111.6% of all Milpitas residents.
| Immigration Origin | # Population | % Population |
| Afghanistan | 153 | 0.2% |
| Africa | 512 | 0.6% |
| Argentina | 2 | 0.0% |
| Armenia | 100 | 0.1% |
| Asia | 37,685 | 47.6% |
| Australia | 67 | 0.1% |
| Azores | 46 | 0.1% |
| Bangladesh | 26 | 0.0% |
| Brazil | 225 | 0.3% |
| Cambodia | 49 | 0.1% |
| Canada | 111 | 0.1% |
| Caribbean | 119 | 0.2% |
| Central America | 2,800 | 3.5% |
| China | 7,100 | 9.0% |
| Colombia | 28 | 0.0% |
| Costa Rica | 34 | 0.0% |
| Cuba | 13 | 0.0% |
| Czechoslovakia | 52 | 0.1% |
| Dominican Republic | 12 | 0.0% |
| Eastern Africa | 56 | 0.1% |
| Eastern Asia | 8,000 | 10.1% |
| Eastern Europe | 448 | 0.6% |
| Ecuador | 18 | 0.0% |
| Egypt | 285 | 0.4% |
| El Salvador | 161 | 0.2% |
| England | 32 | 0.0% |
| Ethiopia | 15 | 0.0% |
| Europe | 822 | 1.0% |
| Fiji | 11 | 0.0% |
| France | 40 | 0.1% |
| Germany | 53 | 0.1% |
| Ghana | 8 | 0.0% |
| Greece | 18 | 0.0% |
| Guatemala | 149 | 0.2% |
| Honduras | 74 | 0.1% |
| Hong Kong | 875 | 1.1% |
| India | 13,458 | 17.0% |
| Indonesia | 260 | 0.3% |
| Iran | 80 | 0.1% |
| Iraq | 103 | 0.1% |
| Ireland | 8 | 0.0% |
| Israel | 45 | 0.1% |
| Italy | 13 | 0.0% |
| Jamaica | 74 | 0.1% |
| Japan | 215 | 0.3% |
| Kazakhstan | 93 | 0.1% |
| Kenya | 14 | 0.0% |
| Korea | 685 | 0.9% |
| Kuwait | 52 | 0.1% |
| Laos | 110 | 0.1% |
| Latin America | 3,257 | 4.1% |
| Malaysia | 557 | 0.7% |
| Mexico | 2,284 | 2.9% |
| Moldova | 5 | 0.0% |
| Morocco | 7 | 0.0% |
| Nepal | 102 | 0.1% |
| Netherlands | 45 | 0.1% |
| Nicaragua | 68 | 0.1% |
| Nigeria | 10 | 0.0% |
| North Macedonia | 17 | 0.0% |
| Northern Africa | 374 | 0.5% |
| Northern Europe | 135 | 0.2% |
| Oceania | 78 | 0.1% |
| Pakistan | 114 | 0.1% |
| Panama | 30 | 0.0% |
| Peru | 62 | 0.1% |
| Philippines | 6,193 | 7.8% |
| Poland | 66 | 0.1% |
| Portugal | 56 | 0.1% |
| Romania | 22 | 0.0% |
| Russia | 113 | 0.1% |
| Saudi Arabia | 6 | 0.0% |
| Serbia | 6 | 0.0% |
| Singapore | 201 | 0.3% |
| South America | 338 | 0.4% |
| South Central Asia | 14,037 | 17.7% |
| South Eastern Asia | 15,069 | 19.1% |
| Southern Europe | 101 | 0.1% |
| Spain | 14 | 0.0% |
| Sweden | 22 | 0.0% |
| Taiwan | 1,481 | 1.9% |
| Thailand | 158 | 0.2% |
| Trinidad and Tobago | 20 | 0.0% |
| Ukraine | 60 | 0.1% |
| Uzbekistan | 11 | 0.0% |
| Venezuela | 3 | 0.0% |
| Vietnam | 7,275 | 9.2% |
| Western Africa | 18 | 0.0% |
| Western Asia | 541 | 0.7% |
| Western Europe | 138 | 0.2% |
| Yemen | 3 | 0.0% | View All 91 Rows |
Sex and Age in Milpitas
Sex and Age in Milpitas
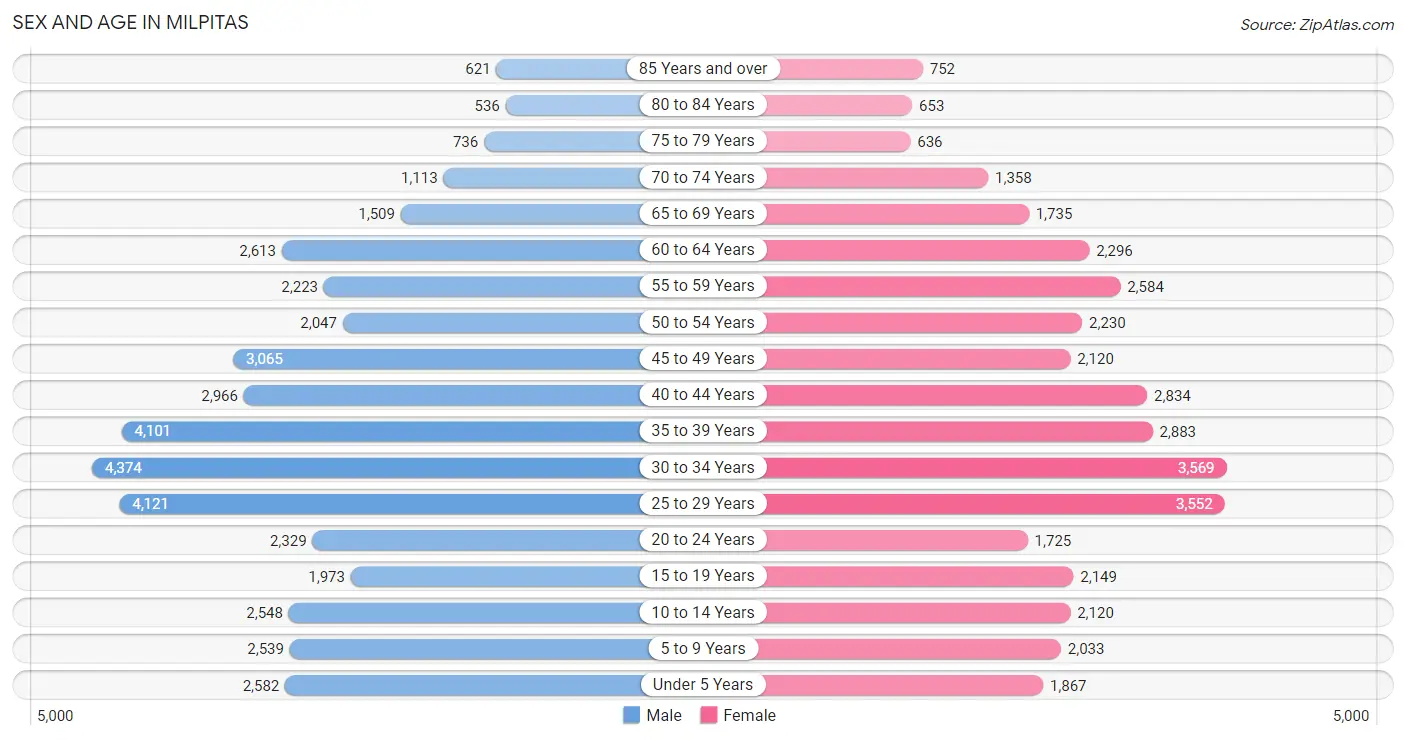
The most populous age groups in Milpitas are 30 to 34 Years (4,374 | 10.4%) for men and 30 to 34 Years (3,569 | 9.6%) for women.
| Age Bracket | Male | Female |
| Under 5 Years | 2,582 (6.1%) | 1,867 (5.0%) |
| 5 to 9 Years | 2,539 (6.0%) | 2,033 (5.5%) |
| 10 to 14 Years | 2,548 (6.1%) | 2,120 (5.7%) |
| 15 to 19 Years | 1,973 (4.7%) | 2,149 (5.8%) |
| 20 to 24 Years | 2,329 (5.6%) | 1,725 (4.6%) |
| 25 to 29 Years | 4,121 (9.8%) | 3,552 (9.6%) |
| 30 to 34 Years | 4,374 (10.4%) | 3,569 (9.6%) |
| 35 to 39 Years | 4,101 (9.8%) | 2,883 (7.8%) |
| 40 to 44 Years | 2,966 (7.1%) | 2,834 (7.6%) |
| 45 to 49 Years | 3,065 (7.3%) | 2,120 (5.7%) |
| 50 to 54 Years | 2,047 (4.9%) | 2,230 (6.0%) |
| 55 to 59 Years | 2,223 (5.3%) | 2,584 (7.0%) |
| 60 to 64 Years | 2,613 (6.2%) | 2,296 (6.2%) |
| 65 to 69 Years | 1,509 (3.6%) | 1,735 (4.7%) |
| 70 to 74 Years | 1,113 (2.6%) | 1,358 (3.7%) |
| 75 to 79 Years | 736 (1.8%) | 636 (1.7%) |
| 80 to 84 Years | 536 (1.3%) | 653 (1.8%) |
| 85 Years and over | 621 (1.5%) | 752 (2.0%) |
| Total | 41,996 (100.0%) | 37,096 (100.0%) |
Families and Households in Milpitas
Median Family Size in Milpitas
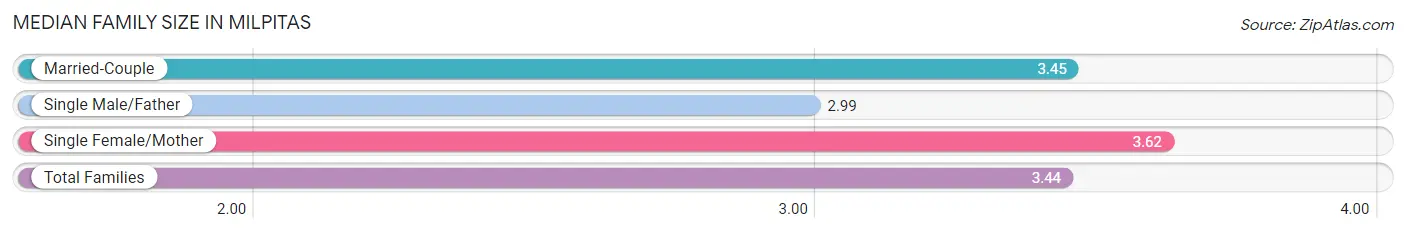
The median family size in Milpitas is 3.44 persons per family, with single female/mother families (2,515 | 13.0%) accounting for the largest median family size of 3.62 persons per family. On the other hand, single male/father families (1,425 | 7.3%) represent the smallest median family size with 2.99 persons per family.
| Family Type | # Families | Family Size |
| Married-Couple | 15,481 (79.7%) | 3.45 |
| Single Male/Father | 1,425 (7.3%) | 2.99 |
| Single Female/Mother | 2,515 (13.0%) | 3.62 |
| Total Families | 19,421 (100.0%) | 3.44 |
Median Household Size in Milpitas
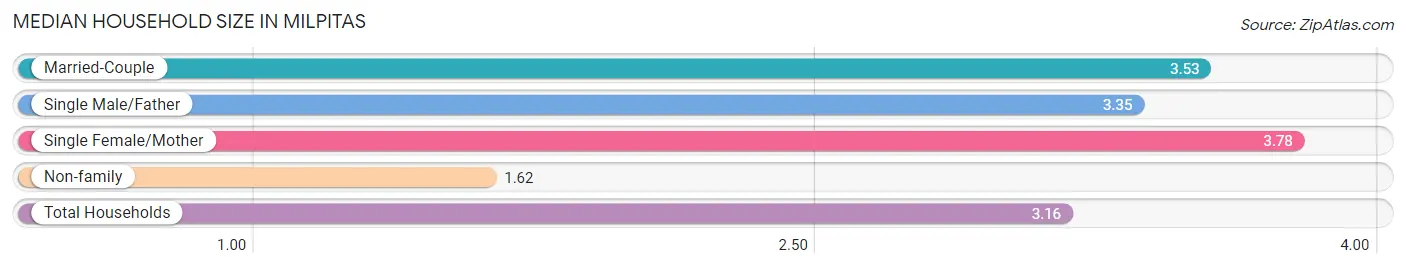
The median household size in Milpitas is 3.16 persons per household, with single female/mother households (2,515 | 10.3%) accounting for the largest median household size of 3.78 persons per household. non-family households (4,974 | 20.4%) represent the smallest median household size with 1.62 persons per household.
| Household Type | # Households | Household Size |
| Married-Couple | 15,481 (63.5%) | 3.53 |
| Single Male/Father | 1,425 (5.8%) | 3.35 |
| Single Female/Mother | 2,515 (10.3%) | 3.78 |
| Non-family | 4,974 (20.4%) | 1.62 |
| Total Households | 24,395 (100.0%) | 3.16 |
Household Size by Marriage Status in Milpitas
Out of a total of 24,395 households in Milpitas, 19,421 (79.6%) are family households, while 4,974 (20.4%) are nonfamily households. The most numerous type of family households are 2-person households, comprising 6,260, and the most common type of nonfamily households are 1-person households, comprising 3,156.
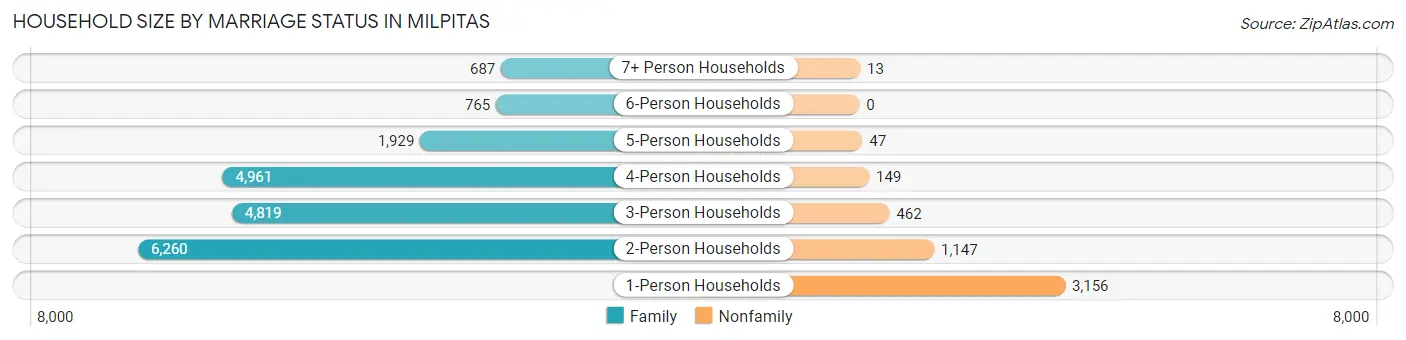
| Household Size | Family Households | Nonfamily Households |
| 1-Person Households | - | 3,156 (12.9%) |
| 2-Person Households | 6,260 (25.7%) | 1,147 (4.7%) |
| 3-Person Households | 4,819 (19.8%) | 462 (1.9%) |
| 4-Person Households | 4,961 (20.3%) | 149 (0.6%) |
| 5-Person Households | 1,929 (7.9%) | 47 (0.2%) |
| 6-Person Households | 765 (3.1%) | 0 (0.0%) |
| 7+ Person Households | 687 (2.8%) | 13 (0.1%) |
| Total | 19,421 (79.6%) | 4,974 (20.4%) |
Female Fertility in Milpitas
Fertility by Age in Milpitas
Average fertility rate in Milpitas is 46.0 births per 1,000 women. Women in the age bracket of 20 to 34 years have the highest fertility rate with 59.0 births per 1,000 women. Women in the age bracket of 20 to 34 years acount for 58.3% of all women with births.
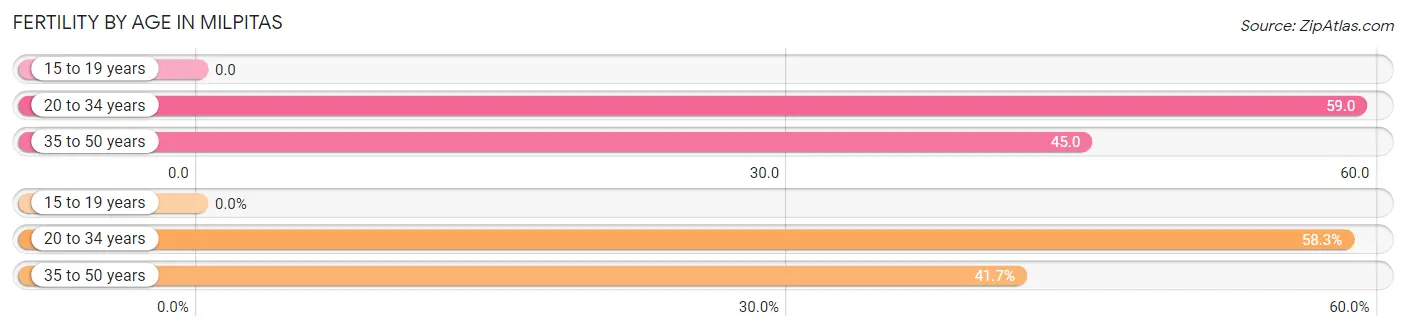
| Age Bracket | Women with Births | Births / 1,000 Women |
| 15 to 19 years | 0 (0.0%) | 0.0 |
| 20 to 34 years | 518 (58.3%) | 59.0 |
| 35 to 50 years | 370 (41.7%) | 45.0 |
| Total | 888 (100.0%) | 46.0 |
Fertility by Age by Marriage Status in Milpitas
91.4% of women with births (888) in Milpitas are married. The highest percentage of unmarried women with births falls into 35 to 50 years age bracket with 13.5% of them unmarried at the time of birth, while the lowest percentage of unmarried women with births belong to 20 to 34 years age bracket with 5.0% of them unmarried.
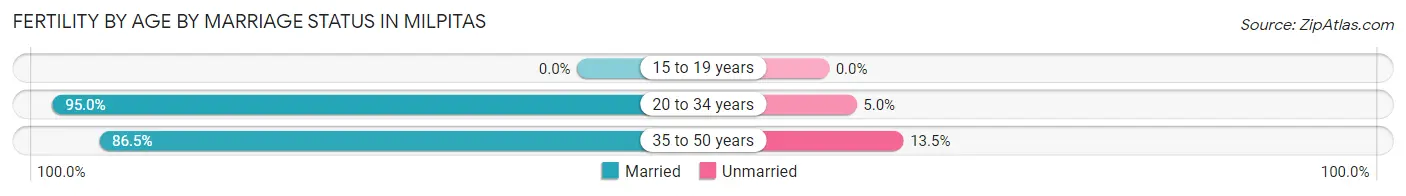
| Age Bracket | Married | Unmarried |
| 15 to 19 years | 0 (0.0%) | 0 (0.0%) |
| 20 to 34 years | 492 (95.0%) | 26 (5.0%) |
| 35 to 50 years | 320 (86.5%) | 50 (13.5%) |
| Total | 812 (91.4%) | 76 (8.6%) |
Fertility by Education in Milpitas
Average fertility rate in Milpitas is 46.0 births per 1,000 women. Women with the education attainment of graduate degree have the highest fertility rate of 64.0 births per 1,000 women, while women with the education attainment of high school diploma have the lowest fertility at 14.0 births per 1,000 women. Women with the education attainment of bachelor's degree represent 41.0% of all women with births.
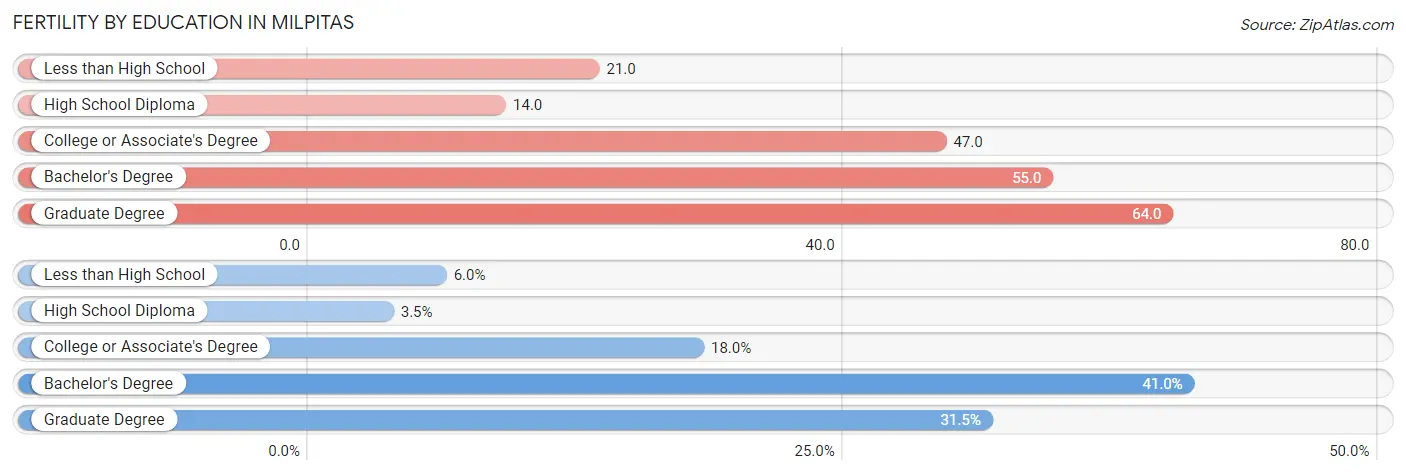
| Educational Attainment | Women with Births | Births / 1,000 Women |
| Less than High School | 53 (6.0%) | 21.0 |
| High School Diploma | 31 (3.5%) | 14.0 |
| College or Associate's Degree | 160 (18.0%) | 47.0 |
| Bachelor's Degree | 364 (41.0%) | 55.0 |
| Graduate Degree | 280 (31.5%) | 64.0 |
| Total | 888 (100.0%) | 46.0 |
Fertility by Education by Marriage Status in Milpitas
8.6% of women with births in Milpitas are unmarried. Women with the educational attainment of high school diploma are most likely to be married with 100.0% of them married at childbirth, while women with the educational attainment of less than high school are least likely to be married with 92.4% of them unmarried at childbirth.
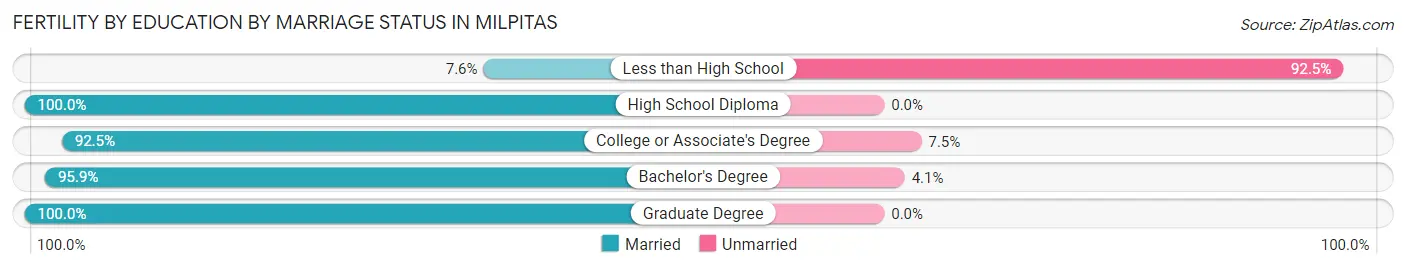
| Educational Attainment | Married | Unmarried |
| Less than High School | 4 (7.5%) | 49 (92.4%) |
| High School Diploma | 31 (100.0%) | 0 (0.0%) |
| College or Associate's Degree | 148 (92.5%) | 12 (7.5%) |
| Bachelor's Degree | 349 (95.9%) | 15 (4.1%) |
| Graduate Degree | 280 (100.0%) | 0 (0.0%) |
| Total | 812 (91.4%) | 76 (8.6%) |
Employment Characteristics in Milpitas
Employment by Class of Employer in Milpitas
Among the 40,713 employed individuals in Milpitas, private company employees (32,838 | 80.7%), not-for-profit organizations (2,098 | 5.1%), and local government employees (1,979 | 4.9%) make up the most common classes of employment.
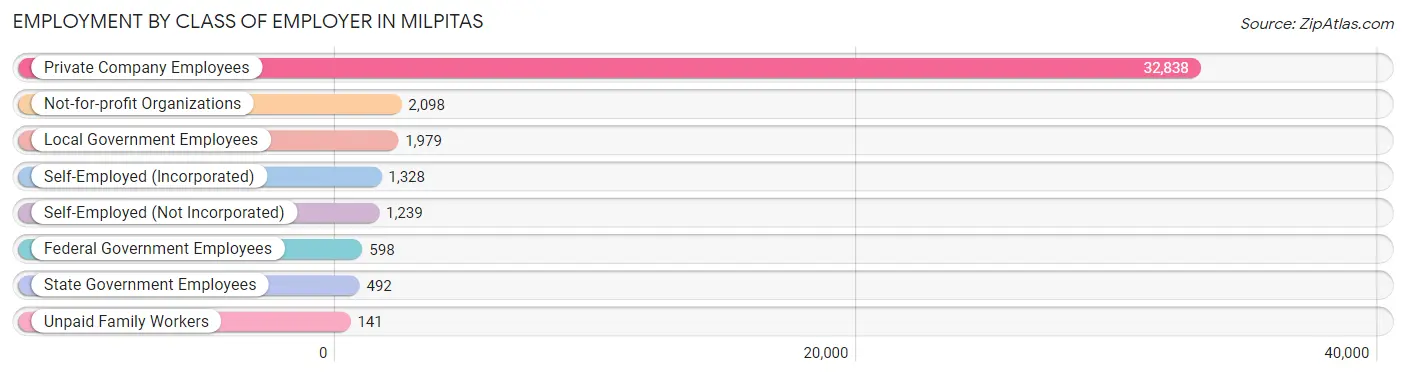
| Employer Class | # Employees | % Employees |
| Private Company Employees | 32,838 | 80.7% |
| Self-Employed (Incorporated) | 1,328 | 3.3% |
| Self-Employed (Not Incorporated) | 1,239 | 3.0% |
| Not-for-profit Organizations | 2,098 | 5.1% |
| Local Government Employees | 1,979 | 4.9% |
| State Government Employees | 492 | 1.2% |
| Federal Government Employees | 598 | 1.5% |
| Unpaid Family Workers | 141 | 0.4% |
| Total | 40,713 | 100.0% |
Employment Status by Age in Milpitas
According to the labor force statistics for Milpitas, out of the total population over 16 years of age (64,706), 67.8% or 43,871 individuals are in the labor force, with 4.5% or 1,974 of them unemployed. The age group with the highest labor force participation rate is 45 to 54 years, with 85.6% or 8,099 individuals in the labor force. Within the labor force, the 16 to 19 years age range has the highest percentage of unemployed individuals, with 21.4% or 173 of them being unemployed.
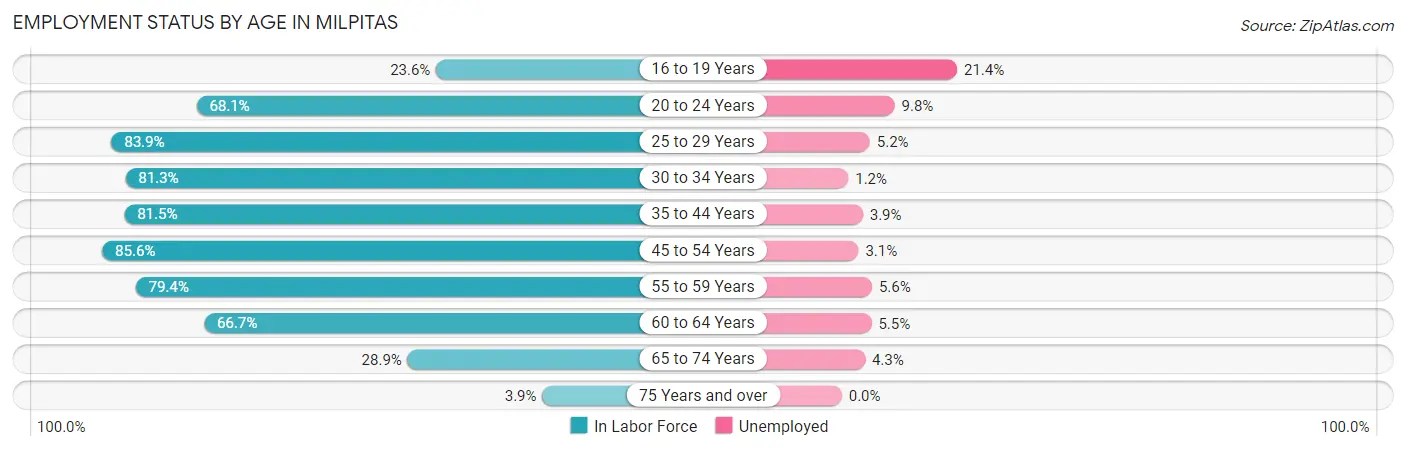
| Age Bracket | In Labor Force | Unemployed |
| 16 to 19 Years | 808 (23.6%) | 173 (21.4%) |
| 20 to 24 Years | 2,761 (68.1%) | 271 (9.8%) |
| 25 to 29 Years | 6,438 (83.9%) | 335 (5.2%) |
| 30 to 34 Years | 6,458 (81.3%) | 77 (1.2%) |
| 35 to 44 Years | 10,419 (81.5%) | 406 (3.9%) |
| 45 to 54 Years | 8,099 (85.6%) | 251 (3.1%) |
| 55 to 59 Years | 3,817 (79.4%) | 214 (5.6%) |
| 60 to 64 Years | 3,274 (66.7%) | 180 (5.5%) |
| 65 to 74 Years | 1,652 (28.9%) | 71 (4.3%) |
| 75 Years and over | 153 (3.9%) | 0 (0.0%) |
| Total | 43,871 (67.8%) | 1,974 (4.5%) |
Employment Status by Educational Attainment in Milpitas
According to labor force statistics for Milpitas, 80.9% of individuals (38,491) out of the total population between 25 and 64 years of age (47,578) are in the labor force, with 3.8% or 1,463 of them being unemployed. The group with the highest labor force participation rate are those with the educational attainment of bachelor's degree or higher, with 87.2% or 25,191 individuals in the labor force. Within the labor force, individuals with high school diploma education have the highest percentage of unemployment, with 6.5% or 274 of them being unemployed.
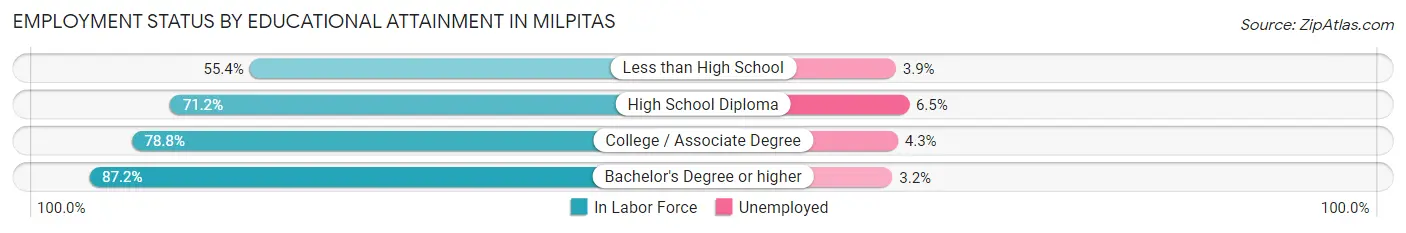
| Educational Attainment | In Labor Force | Unemployed |
| Less than High School | 2,294 (55.4%) | 161 (3.9%) |
| High School Diploma | 4,215 (71.2%) | 385 (6.5%) |
| College / Associate Degree | 6,799 (78.8%) | 371 (4.3%) |
| Bachelor's Degree or higher | 25,191 (87.2%) | 924 (3.2%) |
| Total | 38,491 (80.9%) | 1,808 (3.8%) |
Employment Occupations by Sex in Milpitas
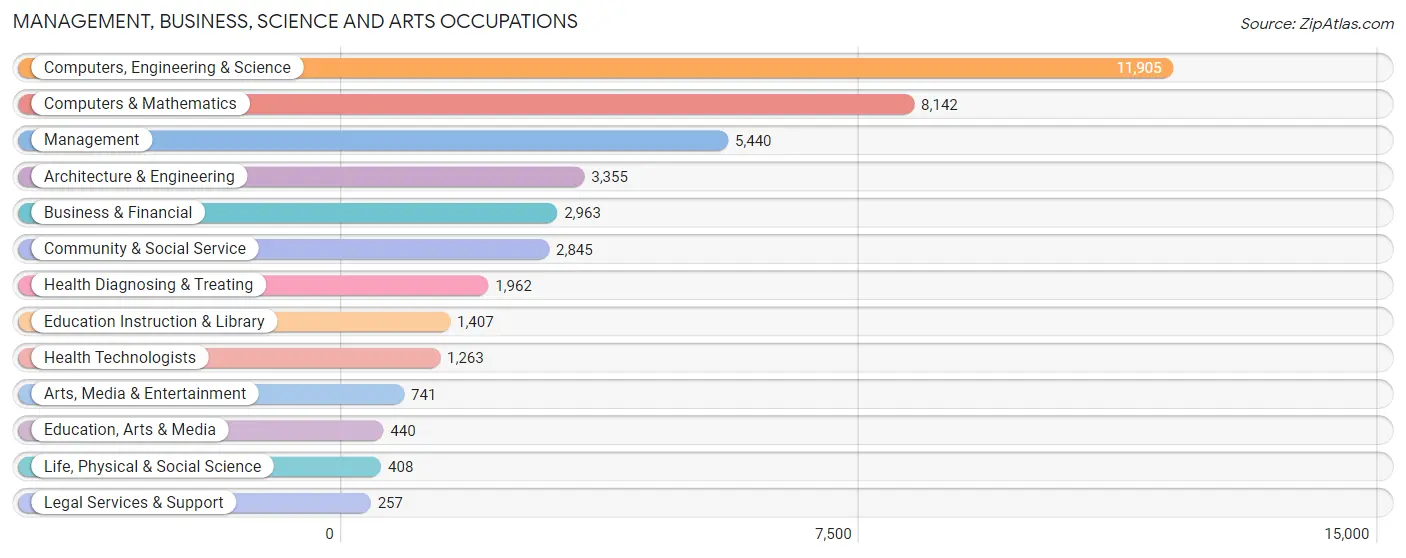
Management, Business, Science and Arts Occupations
The most common Management, Business, Science and Arts occupations in Milpitas are Computers, Engineering & Science (11,905 | 28.4%), Computers & Mathematics (8,142 | 19.5%), Management (5,440 | 13.0%), Architecture & Engineering (3,355 | 8.0%), and Business & Financial (2,963 | 7.1%).
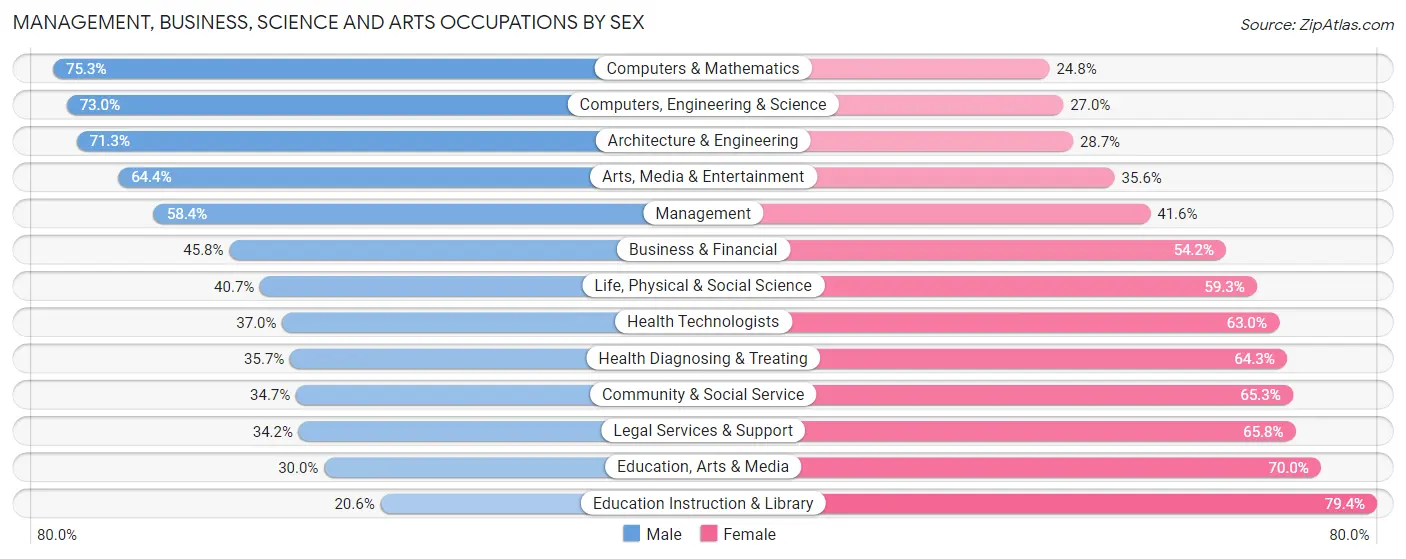
Management, Business, Science and Arts Occupations by Sex
Within the Management, Business, Science and Arts occupations in Milpitas, the most male-oriented occupations are Computers & Mathematics (75.2%), Computers, Engineering & Science (73.0%), and Architecture & Engineering (71.3%), while the most female-oriented occupations are Education Instruction & Library (79.4%), Education, Arts & Media (70.0%), and Legal Services & Support (65.8%).
| Occupation | Male | Female |
| Management | 3,178 (58.4%) | 2,262 (41.6%) |
| Business & Financial | 1,358 (45.8%) | 1,605 (54.2%) |
| Computers, Engineering & Science | 8,686 (73.0%) | 3,219 (27.0%) |
| Computers & Mathematics | 6,127 (75.2%) | 2,015 (24.7%) |
| Architecture & Engineering | 2,393 (71.3%) | 962 (28.7%) |
| Life, Physical & Social Science | 166 (40.7%) | 242 (59.3%) |
| Community & Social Service | 987 (34.7%) | 1,858 (65.3%) |
| Education, Arts & Media | 132 (30.0%) | 308 (70.0%) |
| Legal Services & Support | 88 (34.2%) | 169 (65.8%) |
| Education Instruction & Library | 290 (20.6%) | 1,117 (79.4%) |
| Arts, Media & Entertainment | 477 (64.4%) | 264 (35.6%) |
| Health Diagnosing & Treating | 700 (35.7%) | 1,262 (64.3%) |
| Health Technologists | 467 (37.0%) | 796 (63.0%) |
| Total (Category) | 14,909 (59.4%) | 10,206 (40.6%) |
| Total (Overall) | 23,764 (56.8%) | 18,094 (43.2%) |
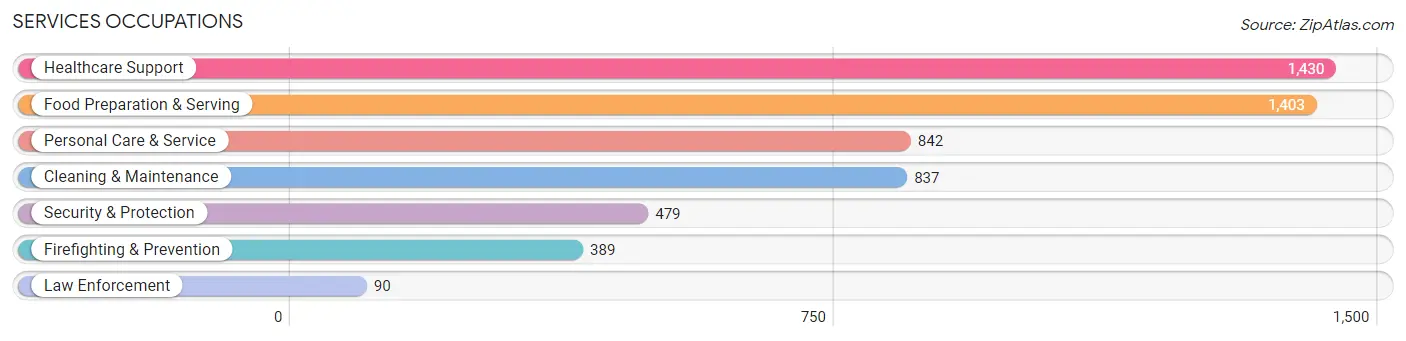
Services Occupations
The most common Services occupations in Milpitas are Healthcare Support (1,430 | 3.4%), Food Preparation & Serving (1,403 | 3.4%), Personal Care & Service (842 | 2.0%), Cleaning & Maintenance (837 | 2.0%), and Security & Protection (479 | 1.1%).
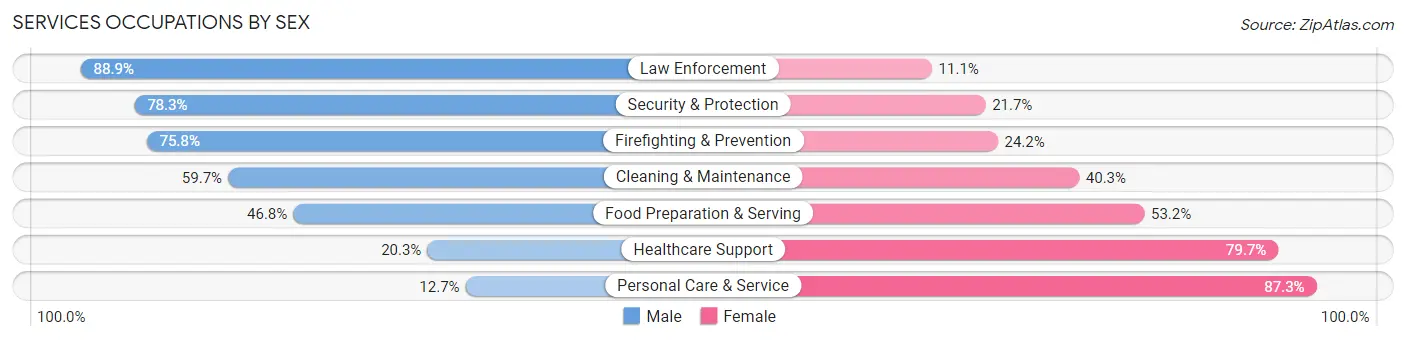
Services Occupations by Sex
Within the Services occupations in Milpitas, the most male-oriented occupations are Law Enforcement (88.9%), Security & Protection (78.3%), and Firefighting & Prevention (75.8%), while the most female-oriented occupations are Personal Care & Service (87.3%), Healthcare Support (79.7%), and Food Preparation & Serving (53.2%).
| Occupation | Male | Female |
| Healthcare Support | 290 (20.3%) | 1,140 (79.7%) |
| Security & Protection | 375 (78.3%) | 104 (21.7%) |
| Firefighting & Prevention | 295 (75.8%) | 94 (24.2%) |
| Law Enforcement | 80 (88.9%) | 10 (11.1%) |
| Food Preparation & Serving | 657 (46.8%) | 746 (53.2%) |
| Cleaning & Maintenance | 500 (59.7%) | 337 (40.3%) |
| Personal Care & Service | 107 (12.7%) | 735 (87.3%) |
| Total (Category) | 1,929 (38.7%) | 3,062 (61.4%) |
| Total (Overall) | 23,764 (56.8%) | 18,094 (43.2%) |
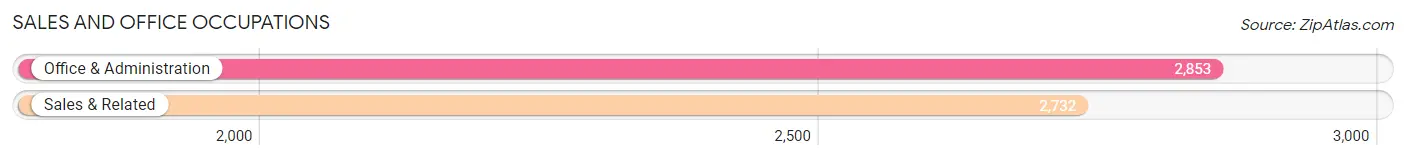
Sales and Office Occupations
The most common Sales and Office occupations in Milpitas are Office & Administration (2,853 | 6.8%), and Sales & Related (2,732 | 6.5%).
Sales and Office Occupations by Sex
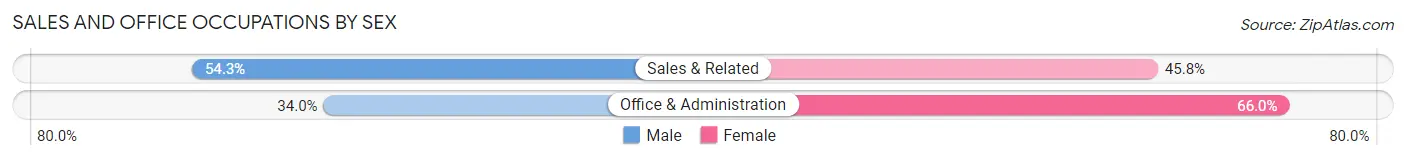
| Occupation | Male | Female |
| Sales & Related | 1,482 (54.2%) | 1,250 (45.8%) |
| Office & Administration | 971 (34.0%) | 1,882 (66.0%) |
| Total (Category) | 2,453 (43.9%) | 3,132 (56.1%) |
| Total (Overall) | 23,764 (56.8%) | 18,094 (43.2%) |
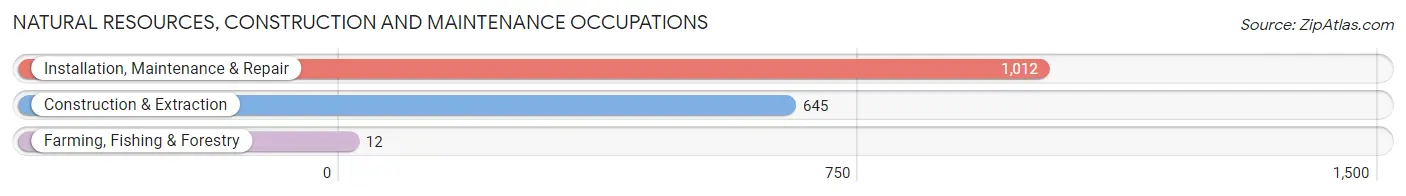
Natural Resources, Construction and Maintenance Occupations
The most common Natural Resources, Construction and Maintenance occupations in Milpitas are Installation, Maintenance & Repair (1,012 | 2.4%), Construction & Extraction (645 | 1.5%), and Farming, Fishing & Forestry (12 | 0.0%).
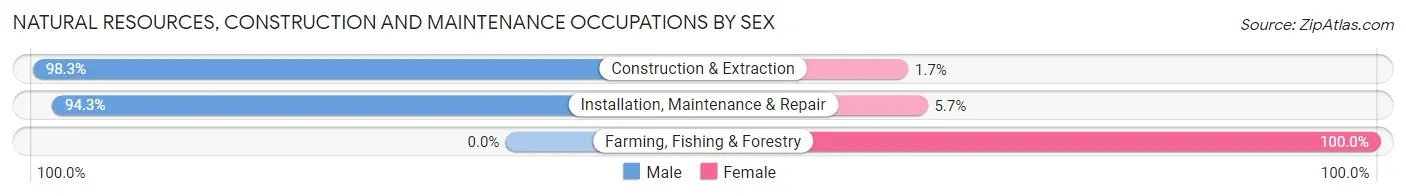
Natural Resources, Construction and Maintenance Occupations by Sex
| Occupation | Male | Female |
| Farming, Fishing & Forestry | 0 (0.0%) | 12 (100.0%) |
| Construction & Extraction | 634 (98.3%) | 11 (1.7%) |
| Installation, Maintenance & Repair | 954 (94.3%) | 58 (5.7%) |
| Total (Category) | 1,588 (95.2%) | 81 (4.9%) |
| Total (Overall) | 23,764 (56.8%) | 18,094 (43.2%) |
Production, Transportation and Moving Occupations
The most common Production, Transportation and Moving occupations in Milpitas are Production (3,117 | 7.4%), Transportation (702 | 1.7%), and Material Moving (679 | 1.6%).
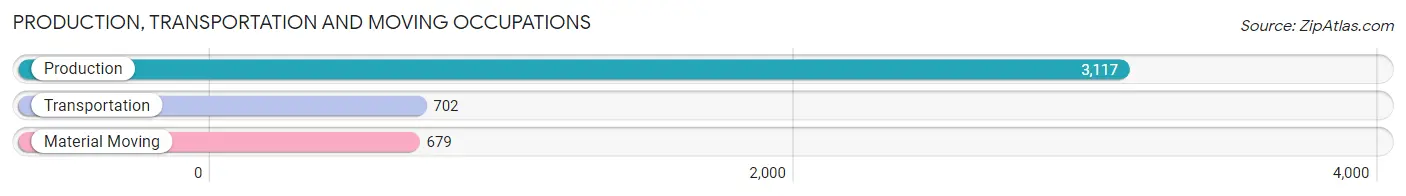
Production, Transportation and Moving Occupations by Sex
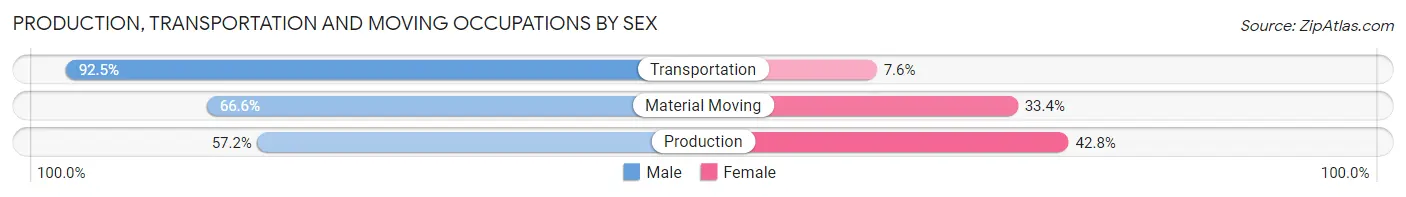
| Occupation | Male | Female |
| Production | 1,784 (57.2%) | 1,333 (42.8%) |
| Transportation | 649 (92.4%) | 53 (7.5%) |
| Material Moving | 452 (66.6%) | 227 (33.4%) |
| Total (Category) | 2,885 (64.1%) | 1,613 (35.9%) |
| Total (Overall) | 23,764 (56.8%) | 18,094 (43.2%) |
Employment Industries by Sex in Milpitas
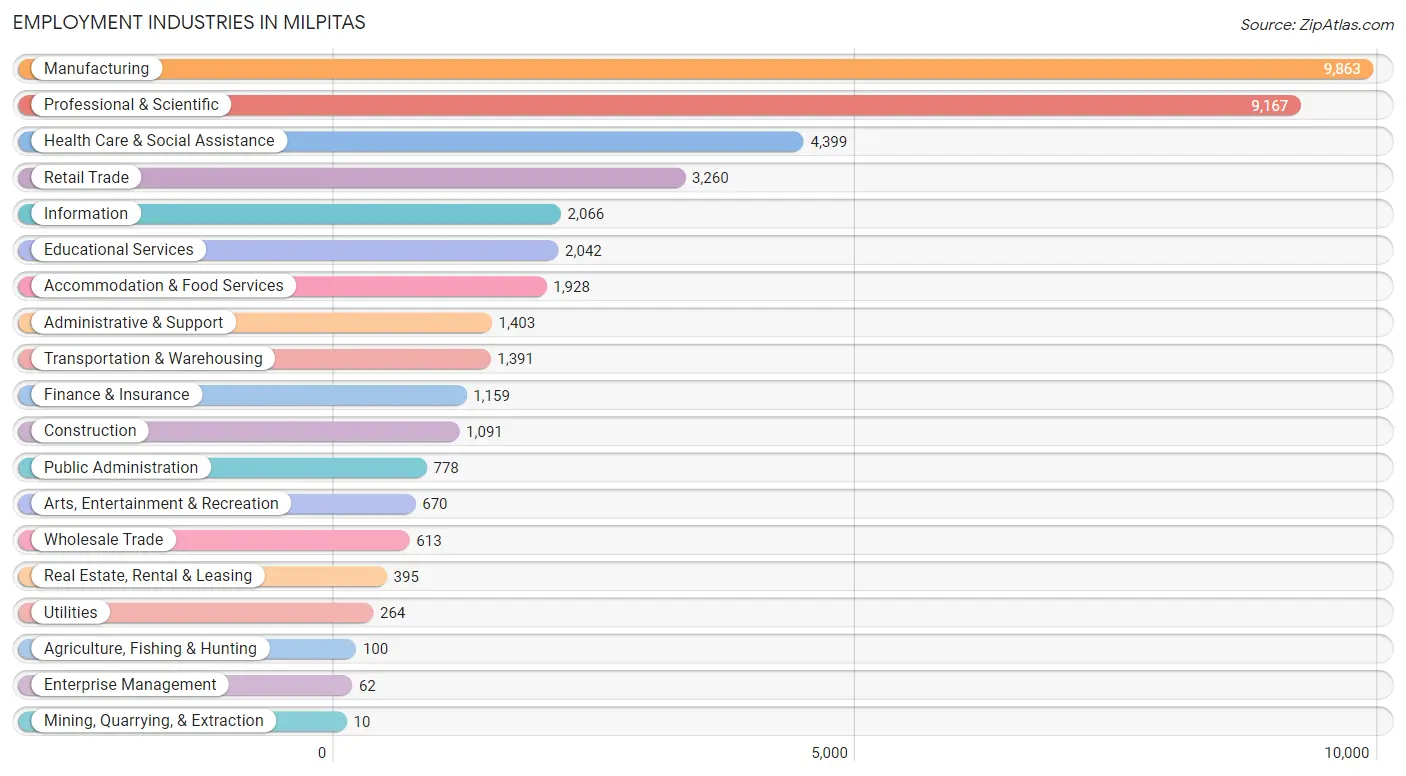
Employment Industries in Milpitas
The major employment industries in Milpitas include Manufacturing (9,863 | 23.6%), Professional & Scientific (9,167 | 21.9%), Health Care & Social Assistance (4,399 | 10.5%), Retail Trade (3,260 | 7.8%), and Information (2,066 | 4.9%).
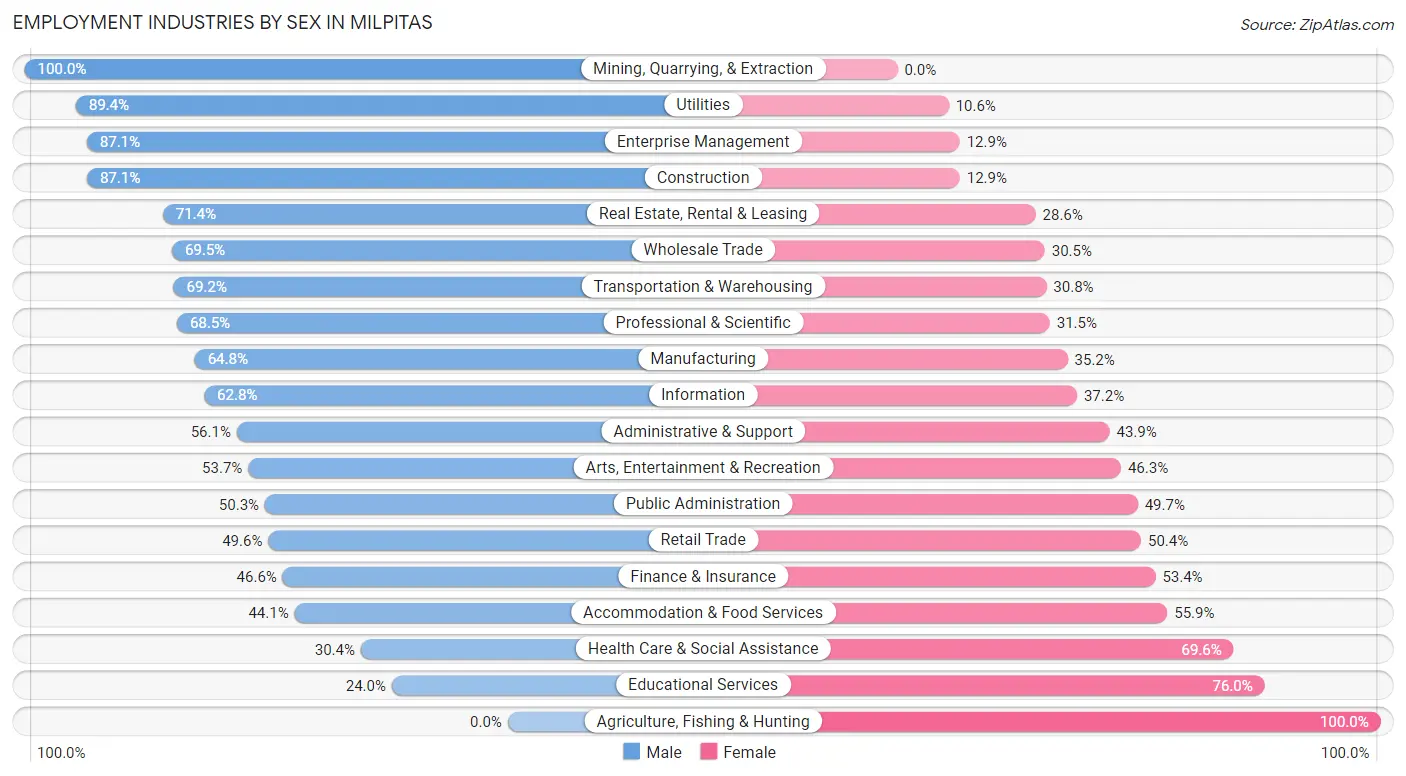
Employment Industries by Sex in Milpitas
The Milpitas industries that see more men than women are Mining, Quarrying, & Extraction (100.0%), Utilities (89.4%), and Enterprise Management (87.1%), whereas the industries that tend to have a higher number of women are Agriculture, Fishing & Hunting (100.0%), Educational Services (76.0%), and Health Care & Social Assistance (69.6%).
| Industry | Male | Female |
| Agriculture, Fishing & Hunting | 0 (0.0%) | 100 (100.0%) |
| Mining, Quarrying, & Extraction | 10 (100.0%) | 0 (0.0%) |
| Construction | 950 (87.1%) | 141 (12.9%) |
| Manufacturing | 6,389 (64.8%) | 3,474 (35.2%) |
| Wholesale Trade | 426 (69.5%) | 187 (30.5%) |
| Retail Trade | 1,616 (49.6%) | 1,644 (50.4%) |
| Transportation & Warehousing | 962 (69.2%) | 429 (30.8%) |
| Utilities | 236 (89.4%) | 28 (10.6%) |
| Information | 1,298 (62.8%) | 768 (37.2%) |
| Finance & Insurance | 540 (46.6%) | 619 (53.4%) |
| Real Estate, Rental & Leasing | 282 (71.4%) | 113 (28.6%) |
| Professional & Scientific | 6,276 (68.5%) | 2,891 (31.5%) |
| Enterprise Management | 54 (87.1%) | 8 (12.9%) |
| Administrative & Support | 787 (56.1%) | 616 (43.9%) |
| Educational Services | 490 (24.0%) | 1,552 (76.0%) |
| Health Care & Social Assistance | 1,338 (30.4%) | 3,061 (69.6%) |
| Arts, Entertainment & Recreation | 360 (53.7%) | 310 (46.3%) |
| Accommodation & Food Services | 851 (44.1%) | 1,077 (55.9%) |
| Public Administration | 391 (50.3%) | 387 (49.7%) |
| Total | 23,764 (56.8%) | 18,094 (43.2%) |
Education in Milpitas
School Enrollment in Milpitas
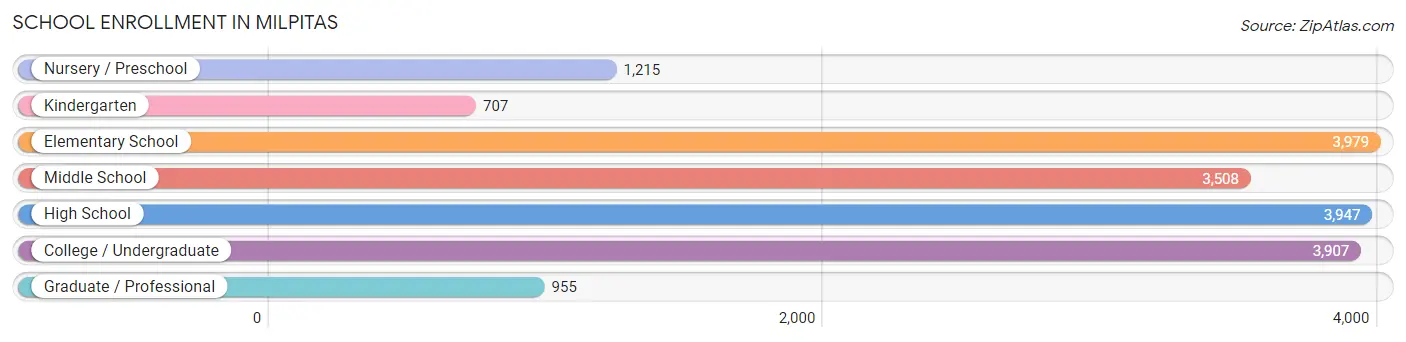
The most common levels of schooling among the 18,218 students in Milpitas are elementary school (3,979 | 21.8%), high school (3,947 | 21.7%), and college / undergraduate (3,907 | 21.4%).
| School Level | # Students | % Students |
| Nursery / Preschool | 1,215 | 6.7% |
| Kindergarten | 707 | 3.9% |
| Elementary School | 3,979 | 21.8% |
| Middle School | 3,508 | 19.3% |
| High School | 3,947 | 21.7% |
| College / Undergraduate | 3,907 | 21.4% |
| Graduate / Professional | 955 | 5.2% |
| Total | 18,218 | 100.0% |
School Enrollment by Age by Funding Source in Milpitas
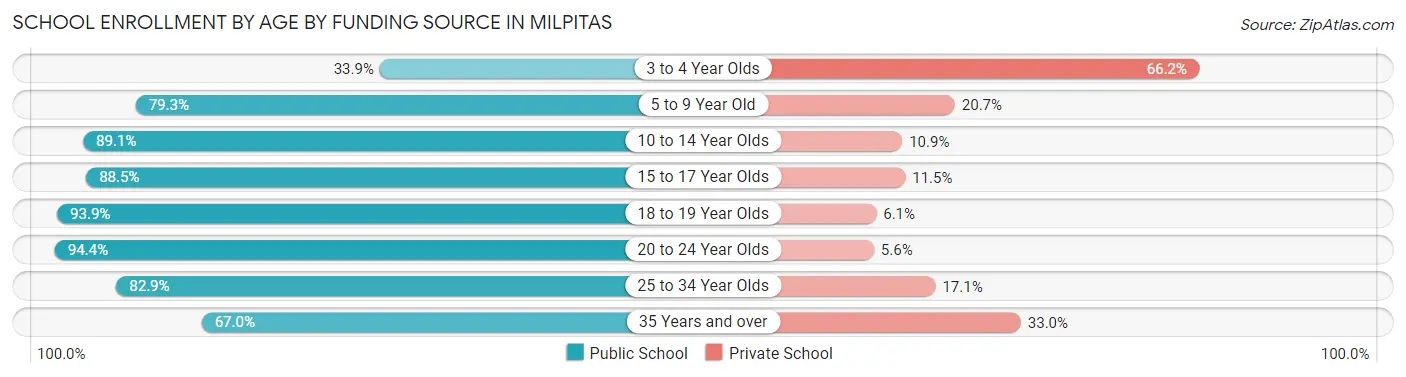
Out of a total of 18,218 students who are enrolled in schools in Milpitas, 3,133 (17.2%) attend a private institution, while the remaining 15,085 (82.8%) are enrolled in public schools. The age group of 3 to 4 year olds has the highest likelihood of being enrolled in private schools, with 723 (66.1% in the age bracket) enrolled. Conversely, the age group of 20 to 24 year olds has the lowest likelihood of being enrolled in a private school, with 1,877 (94.4% in the age bracket) attending a public institution.
| Age Bracket | Public School | Private School |
| 3 to 4 Year Olds | 370 (33.9%) | 723 (66.1%) |
| 5 to 9 Year Old | 3,403 (79.3%) | 889 (20.7%) |
| 10 to 14 Year Olds | 4,133 (89.1%) | 506 (10.9%) |
| 15 to 17 Year Olds | 2,359 (88.5%) | 306 (11.5%) |
| 18 to 19 Year Olds | 1,222 (93.9%) | 79 (6.1%) |
| 20 to 24 Year Olds | 1,877 (94.4%) | 112 (5.6%) |
| 25 to 34 Year Olds | 1,193 (82.9%) | 246 (17.1%) |
| 35 Years and over | 536 (67.0%) | 264 (33.0%) |
| Total | 15,085 (82.8%) | 3,133 (17.2%) |
Educational Attainment by Field of Study in Milpitas
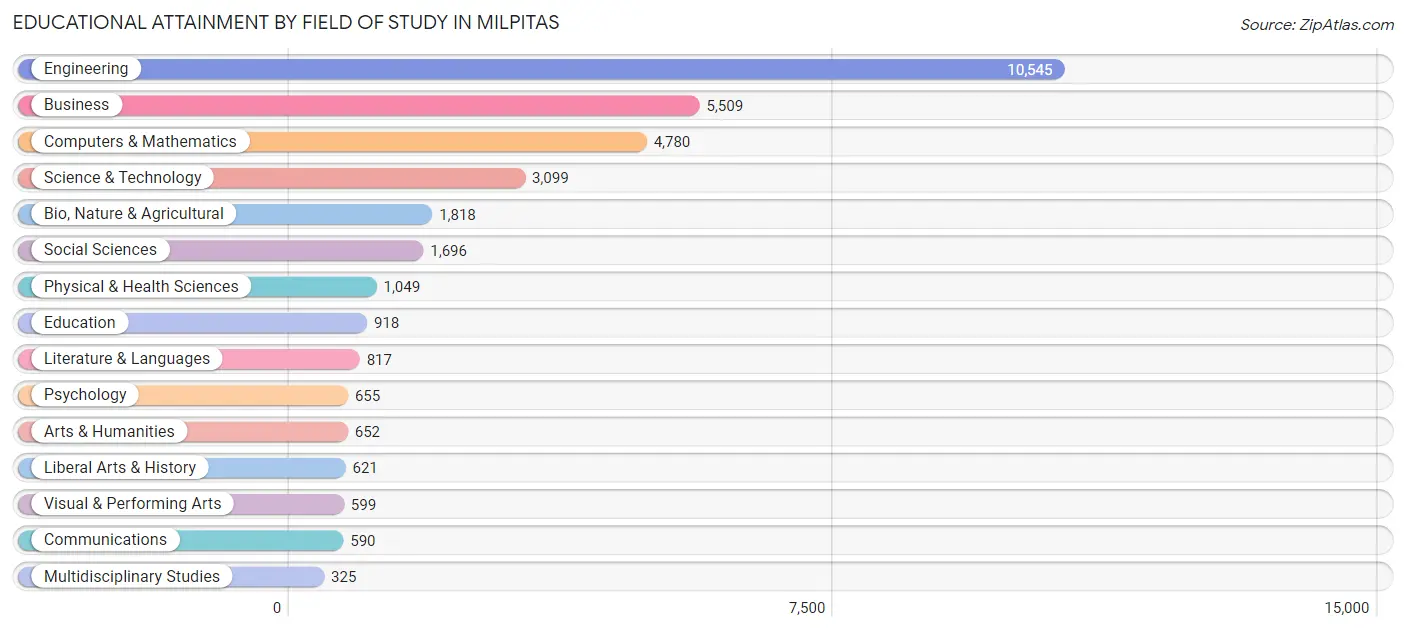
Engineering (10,545 | 31.3%), business (5,509 | 16.4%), computers & mathematics (4,780 | 14.2%), science & technology (3,099 | 9.2%), and bio, nature & agricultural (1,818 | 5.4%) are the most common fields of study among 33,673 individuals in Milpitas who have obtained a bachelor's degree or higher.
| Field of Study | # Graduates | % Graduates |
| Computers & Mathematics | 4,780 | 14.2% |
| Bio, Nature & Agricultural | 1,818 | 5.4% |
| Physical & Health Sciences | 1,049 | 3.1% |
| Psychology | 655 | 1.9% |
| Social Sciences | 1,696 | 5.0% |
| Engineering | 10,545 | 31.3% |
| Multidisciplinary Studies | 325 | 1.0% |
| Science & Technology | 3,099 | 9.2% |
| Business | 5,509 | 16.4% |
| Education | 918 | 2.7% |
| Literature & Languages | 817 | 2.4% |
| Liberal Arts & History | 621 | 1.8% |
| Visual & Performing Arts | 599 | 1.8% |
| Communications | 590 | 1.8% |
| Arts & Humanities | 652 | 1.9% |
| Total | 33,673 | 100.0% |
Transportation & Commute in Milpitas
Vehicle Availability by Sex in Milpitas
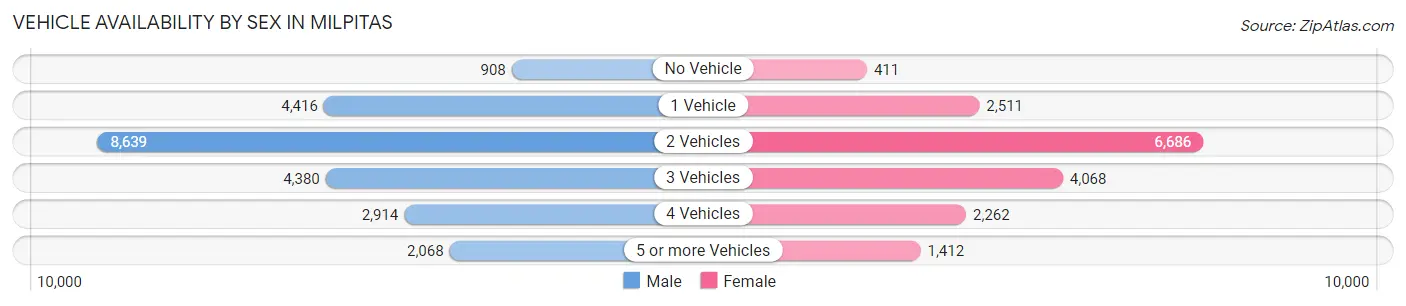
The most prevalent vehicle ownership categories in Milpitas are males with 2 vehicles (8,639, accounting for 37.0%) and females with 2 vehicles (6,686, making up 49.8%).
| Vehicles Available | Male | Female |
| No Vehicle | 908 (3.9%) | 411 (2.4%) |
| 1 Vehicle | 4,416 (18.9%) | 2,511 (14.5%) |
| 2 Vehicles | 8,639 (37.0%) | 6,686 (38.5%) |
| 3 Vehicles | 4,380 (18.8%) | 4,068 (23.4%) |
| 4 Vehicles | 2,914 (12.5%) | 2,262 (13.0%) |
| 5 or more Vehicles | 2,068 (8.9%) | 1,412 (8.1%) |
| Total | 23,325 (100.0%) | 17,350 (100.0%) |
Commute Time in Milpitas
The most frequently occuring commute durations in Milpitas are 30 to 34 minutes (6,174 commuters, 19.1%), 20 to 24 minutes (5,310 commuters, 16.4%), and 15 to 19 minutes (5,168 commuters, 16.0%).
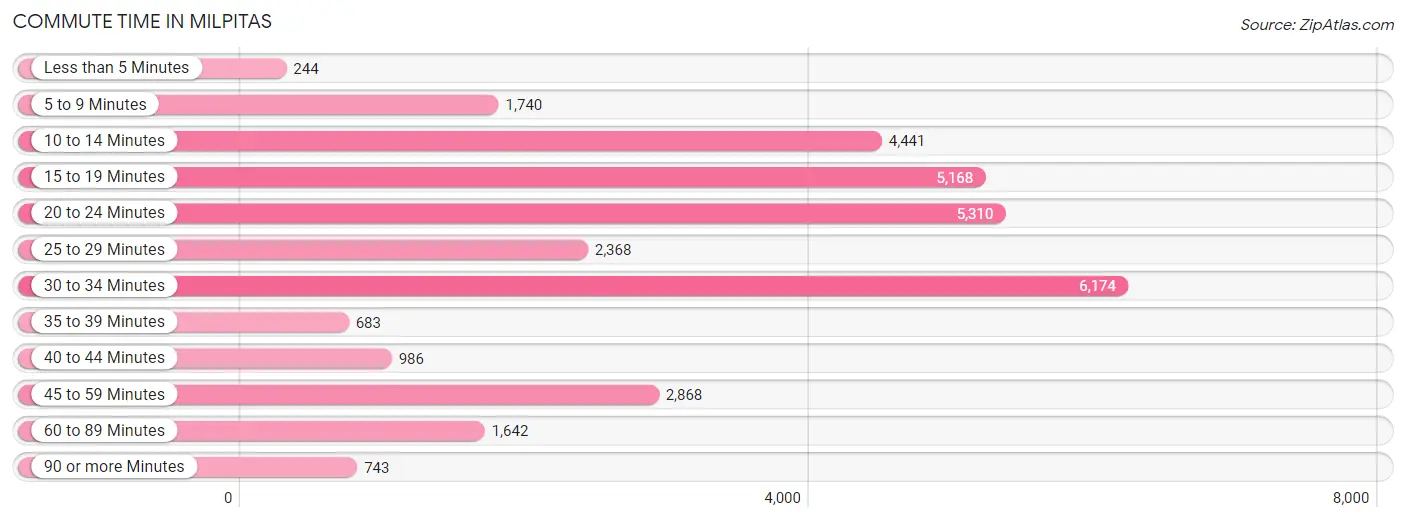
| Commute Time | # Commuters | % Commuters |
| Less than 5 Minutes | 244 | 0.7% |
| 5 to 9 Minutes | 1,740 | 5.4% |
| 10 to 14 Minutes | 4,441 | 13.7% |
| 15 to 19 Minutes | 5,168 | 16.0% |
| 20 to 24 Minutes | 5,310 | 16.4% |
| 25 to 29 Minutes | 2,368 | 7.3% |
| 30 to 34 Minutes | 6,174 | 19.1% |
| 35 to 39 Minutes | 683 | 2.1% |
| 40 to 44 Minutes | 986 | 3.0% |
| 45 to 59 Minutes | 2,868 | 8.9% |
| 60 to 89 Minutes | 1,642 | 5.1% |
| 90 or more Minutes | 743 | 2.3% |
Commute Time by Sex in Milpitas
The most common commute times in Milpitas are 30 to 34 minutes (3,491 commuters, 19.0%) for males and 30 to 34 minutes (2,683 commuters, 19.2%) for females.
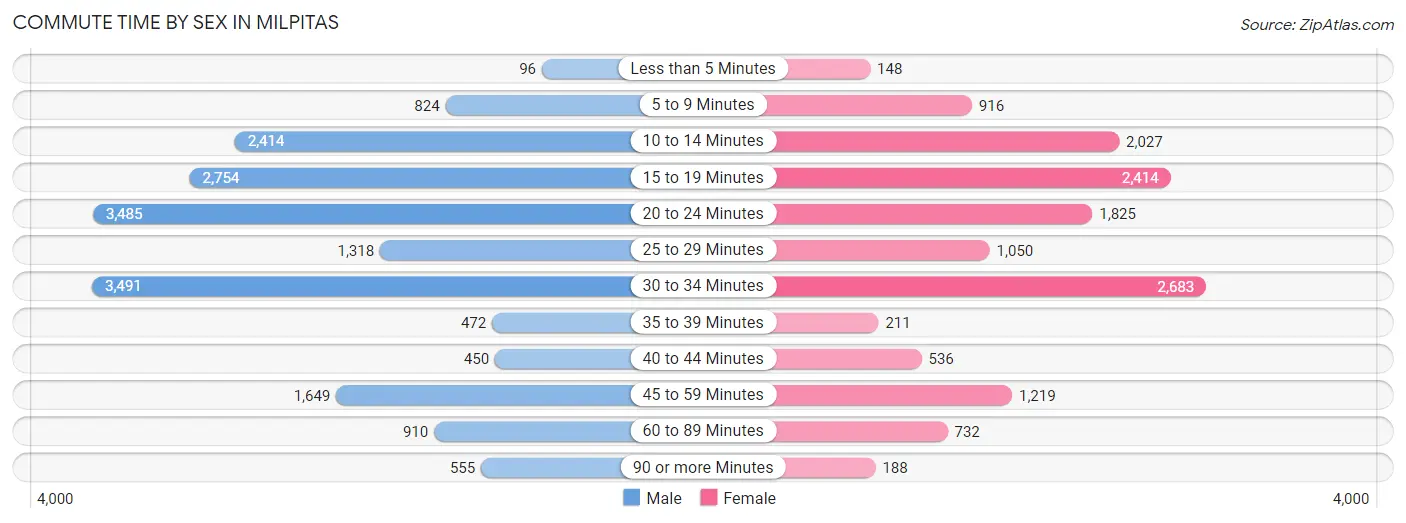
| Commute Time | Male | Female |
| Less than 5 Minutes | 96 (0.5%) | 148 (1.1%) |
| 5 to 9 Minutes | 824 (4.5%) | 916 (6.6%) |
| 10 to 14 Minutes | 2,414 (13.1%) | 2,027 (14.5%) |
| 15 to 19 Minutes | 2,754 (14.9%) | 2,414 (17.3%) |
| 20 to 24 Minutes | 3,485 (18.9%) | 1,825 (13.1%) |
| 25 to 29 Minutes | 1,318 (7.2%) | 1,050 (7.5%) |
| 30 to 34 Minutes | 3,491 (19.0%) | 2,683 (19.2%) |
| 35 to 39 Minutes | 472 (2.6%) | 211 (1.5%) |
| 40 to 44 Minutes | 450 (2.4%) | 536 (3.8%) |
| 45 to 59 Minutes | 1,649 (8.9%) | 1,219 (8.7%) |
| 60 to 89 Minutes | 910 (4.9%) | 732 (5.2%) |
| 90 or more Minutes | 555 (3.0%) | 188 (1.3%) |
Time of Departure to Work by Sex in Milpitas
The most frequent times of departure to work in Milpitas are 8:00 AM to 8:29 AM (3,579, 19.4%) for males and 9:00 AM to 9:59 AM (2,416, 17.3%) for females.
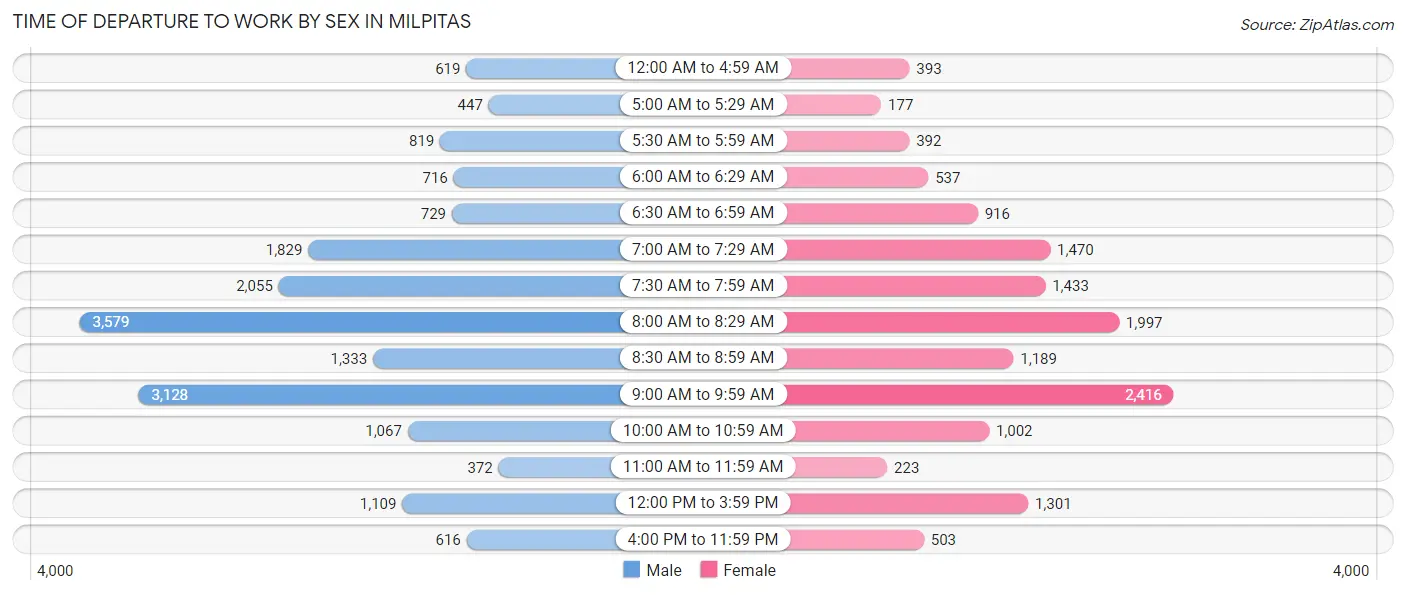
| Time of Departure | Male | Female |
| 12:00 AM to 4:59 AM | 619 (3.4%) | 393 (2.8%) |
| 5:00 AM to 5:29 AM | 447 (2.4%) | 177 (1.3%) |
| 5:30 AM to 5:59 AM | 819 (4.4%) | 392 (2.8%) |
| 6:00 AM to 6:29 AM | 716 (3.9%) | 537 (3.8%) |
| 6:30 AM to 6:59 AM | 729 (4.0%) | 916 (6.6%) |
| 7:00 AM to 7:29 AM | 1,829 (9.9%) | 1,470 (10.5%) |
| 7:30 AM to 7:59 AM | 2,055 (11.2%) | 1,433 (10.3%) |
| 8:00 AM to 8:29 AM | 3,579 (19.4%) | 1,997 (14.3%) |
| 8:30 AM to 8:59 AM | 1,333 (7.2%) | 1,189 (8.5%) |
| 9:00 AM to 9:59 AM | 3,128 (17.0%) | 2,416 (17.3%) |
| 10:00 AM to 10:59 AM | 1,067 (5.8%) | 1,002 (7.2%) |
| 11:00 AM to 11:59 AM | 372 (2.0%) | 223 (1.6%) |
| 12:00 PM to 3:59 PM | 1,109 (6.0%) | 1,301 (9.3%) |
| 4:00 PM to 11:59 PM | 616 (3.3%) | 503 (3.6%) |
| Total | 18,418 (100.0%) | 13,949 (100.0%) |
Housing Occupancy in Milpitas
Occupancy by Ownership in Milpitas
Of the total 24,395 dwellings in Milpitas, owner-occupied units account for 14,786 (60.6%), while renter-occupied units make up 9,609 (39.4%).
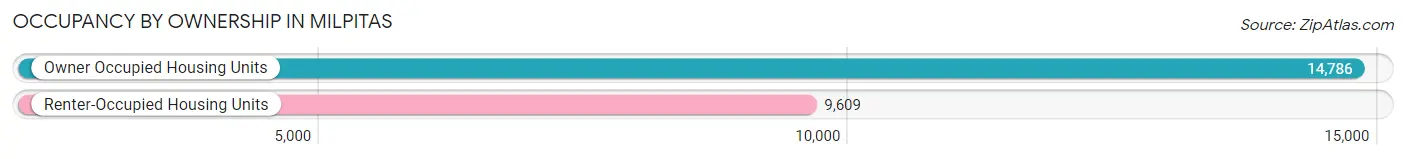
| Occupancy | # Housing Units | % Housing Units |
| Owner Occupied Housing Units | 14,786 | 60.6% |
| Renter-Occupied Housing Units | 9,609 | 39.4% |
| Total Occupied Housing Units | 24,395 | 100.0% |
Occupancy by Household Size in Milpitas
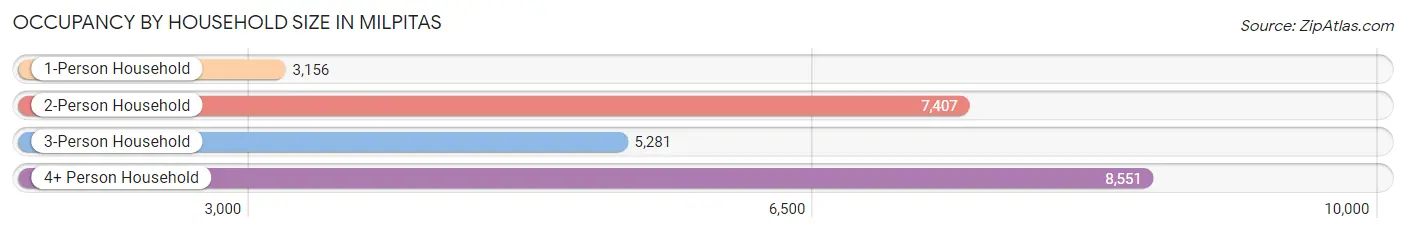
| Household Size | # Housing Units | % Housing Units |
| 1-Person Household | 3,156 | 12.9% |
| 2-Person Household | 7,407 | 30.4% |
| 3-Person Household | 5,281 | 21.6% |
| 4+ Person Household | 8,551 | 35.0% |
| Total Housing Units | 24,395 | 100.0% |
Occupancy by Ownership by Household Size in Milpitas
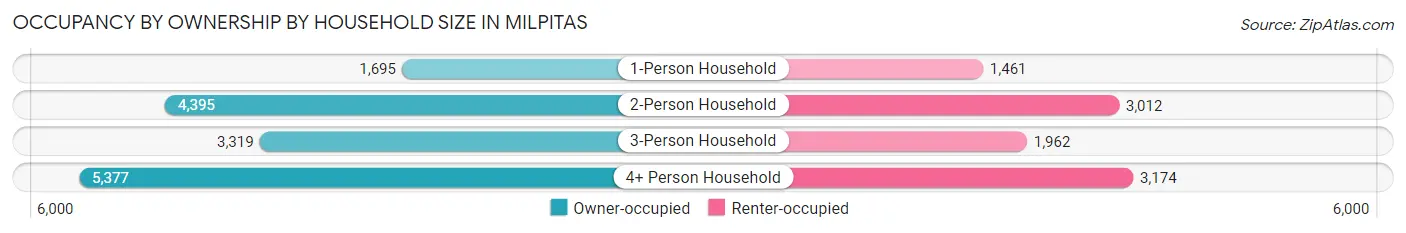
| Household Size | Owner-occupied | Renter-occupied |
| 1-Person Household | 1,695 (53.7%) | 1,461 (46.3%) |
| 2-Person Household | 4,395 (59.3%) | 3,012 (40.7%) |
| 3-Person Household | 3,319 (62.8%) | 1,962 (37.1%) |
| 4+ Person Household | 5,377 (62.9%) | 3,174 (37.1%) |
| Total Housing Units | 14,786 (60.6%) | 9,609 (39.4%) |
Occupancy by Educational Attainment in Milpitas
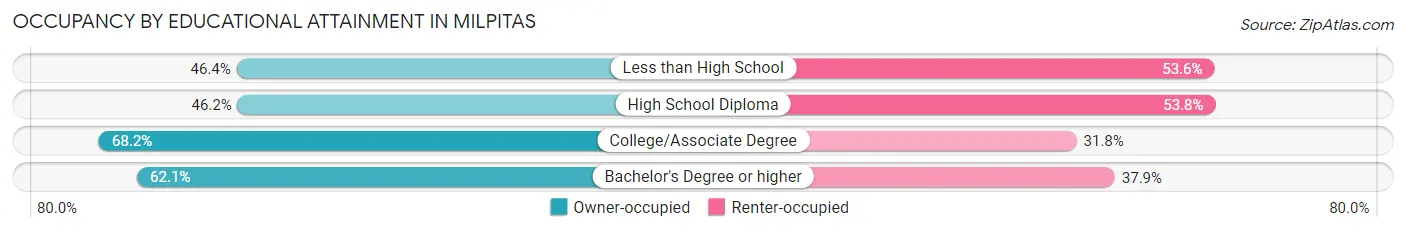
| Household Size | Owner-occupied | Renter-occupied |
| Less than High School | 712 (46.4%) | 823 (53.6%) |
| High School Diploma | 1,165 (46.2%) | 1,356 (53.8%) |
| College/Associate Degree | 3,038 (68.2%) | 1,416 (31.8%) |
| Bachelor's Degree or higher | 9,871 (62.1%) | 6,014 (37.9%) |
Occupancy by Age of Householder in Milpitas
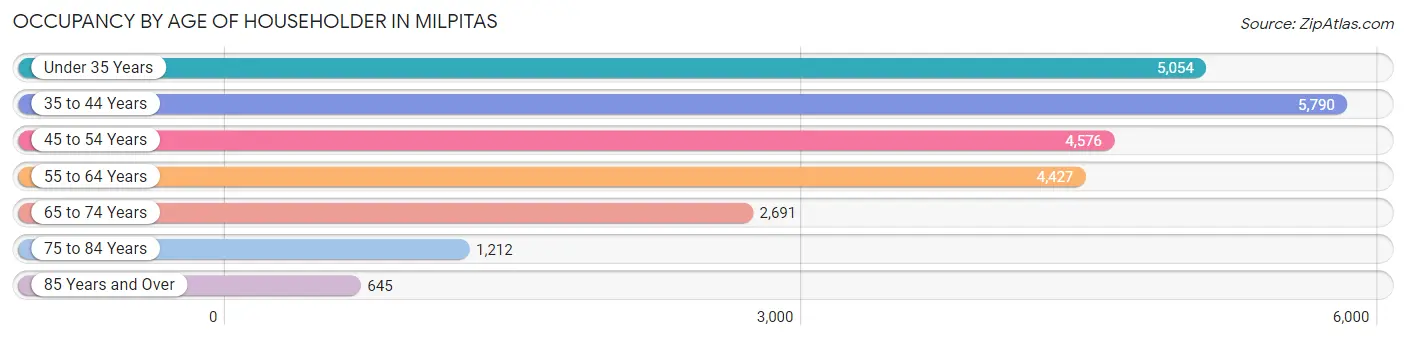
| Age Bracket | # Households | % Households |
| Under 35 Years | 5,054 | 20.7% |
| 35 to 44 Years | 5,790 | 23.7% |
| 45 to 54 Years | 4,576 | 18.8% |
| 55 to 64 Years | 4,427 | 18.1% |
| 65 to 74 Years | 2,691 | 11.0% |
| 75 to 84 Years | 1,212 | 5.0% |
| 85 Years and Over | 645 | 2.6% |
| Total | 24,395 | 100.0% |
Housing Finances in Milpitas
Median Income by Occupancy in Milpitas
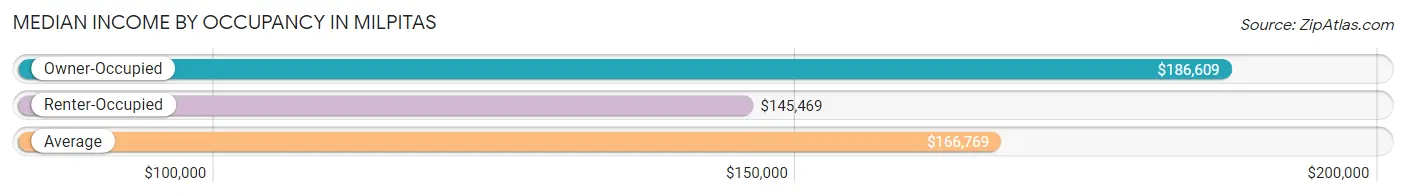
| Occupancy Type | # Households | Median Income |
| Owner-Occupied | 14,786 (60.6%) | $186,609 |
| Renter-Occupied | 9,609 (39.4%) | $145,469 |
| Average | 24,395 (100.0%) | $166,769 |
Occupancy by Householder Income Bracket in Milpitas
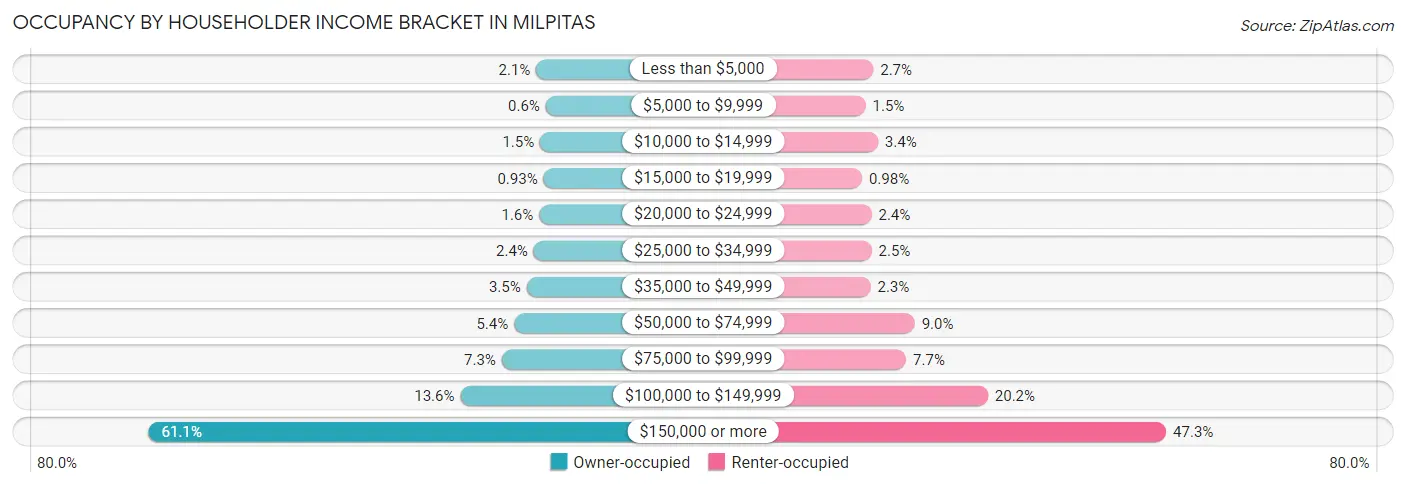
| Income Bracket | Owner-occupied | Renter-occupied |
| Less than $5,000 | 303 (2.1%) | 259 (2.7%) |
| $5,000 to $9,999 | 88 (0.6%) | 147 (1.5%) |
| $10,000 to $14,999 | 216 (1.5%) | 328 (3.4%) |
| $15,000 to $19,999 | 138 (0.9%) | 94 (1.0%) |
| $20,000 to $24,999 | 237 (1.6%) | 234 (2.4%) |
| $25,000 to $34,999 | 358 (2.4%) | 235 (2.5%) |
| $35,000 to $49,999 | 519 (3.5%) | 219 (2.3%) |
| $50,000 to $74,999 | 801 (5.4%) | 867 (9.0%) |
| $75,000 to $99,999 | 1,079 (7.3%) | 741 (7.7%) |
| $100,000 to $149,999 | 2,012 (13.6%) | 1,937 (20.2%) |
| $150,000 or more | 9,035 (61.1%) | 4,548 (47.3%) |
| Total | 14,786 (100.0%) | 9,609 (100.0%) |
Monthly Housing Cost Tiers in Milpitas
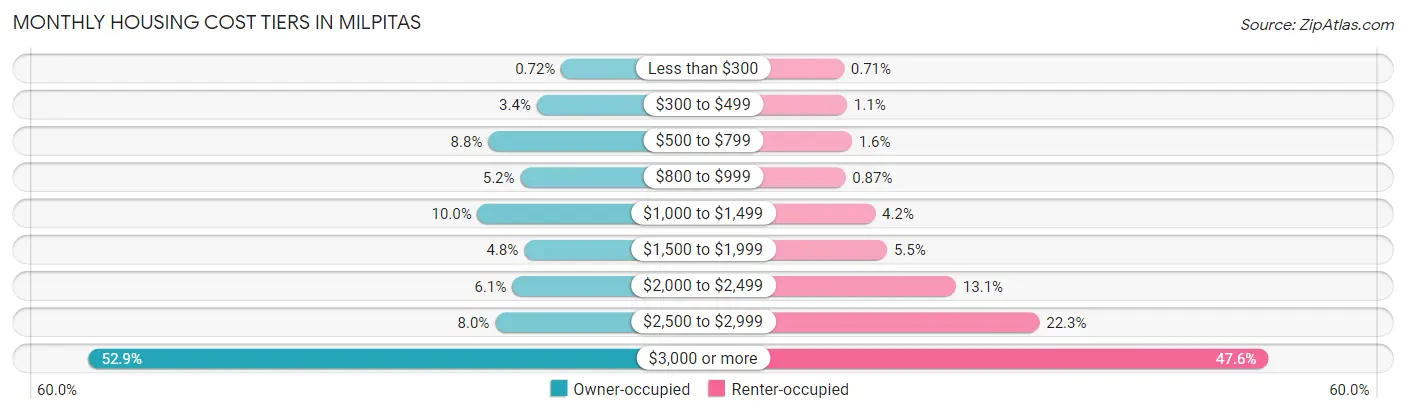
| Monthly Cost | Owner-occupied | Renter-occupied |
| Less than $300 | 107 (0.7%) | 68 (0.7%) |
| $300 to $499 | 505 (3.4%) | 101 (1.1%) |
| $500 to $799 | 1,298 (8.8%) | 153 (1.6%) |
| $800 to $999 | 774 (5.2%) | 84 (0.9%) |
| $1,000 to $1,499 | 1,472 (10.0%) | 401 (4.2%) |
| $1,500 to $1,999 | 713 (4.8%) | 526 (5.5%) |
| $2,000 to $2,499 | 907 (6.1%) | 1,258 (13.1%) |
| $2,500 to $2,999 | 1,184 (8.0%) | 2,143 (22.3%) |
| $3,000 or more | 7,826 (52.9%) | 4,572 (47.6%) |
| Total | 14,786 (100.0%) | 9,609 (100.0%) |
Physical Housing Characteristics in Milpitas
Housing Structures in Milpitas
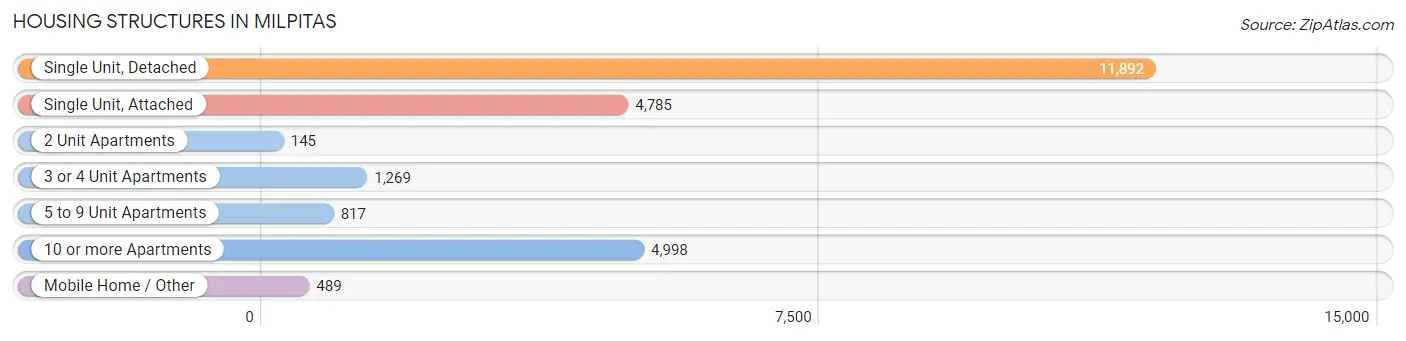
| Structure Type | # Housing Units | % Housing Units |
| Single Unit, Detached | 11,892 | 48.7% |
| Single Unit, Attached | 4,785 | 19.6% |
| 2 Unit Apartments | 145 | 0.6% |
| 3 or 4 Unit Apartments | 1,269 | 5.2% |
| 5 to 9 Unit Apartments | 817 | 3.4% |
| 10 or more Apartments | 4,998 | 20.5% |
| Mobile Home / Other | 489 | 2.0% |
| Total | 24,395 | 100.0% |
Housing Structures by Occupancy in Milpitas
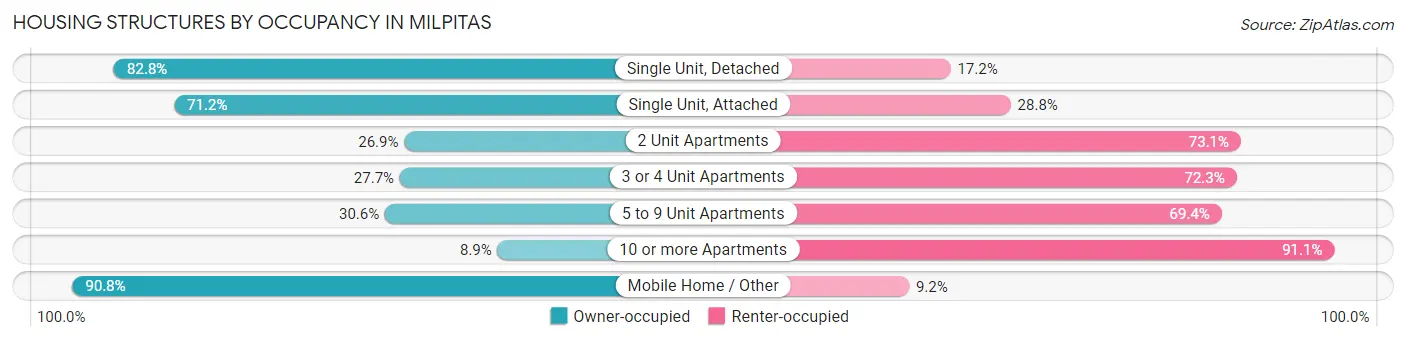
| Structure Type | Owner-occupied | Renter-occupied |
| Single Unit, Detached | 9,847 (82.8%) | 2,045 (17.2%) |
| Single Unit, Attached | 3,408 (71.2%) | 1,377 (28.8%) |
| 2 Unit Apartments | 39 (26.9%) | 106 (73.1%) |
| 3 or 4 Unit Apartments | 352 (27.7%) | 917 (72.3%) |
| 5 to 9 Unit Apartments | 250 (30.6%) | 567 (69.4%) |
| 10 or more Apartments | 446 (8.9%) | 4,552 (91.1%) |
| Mobile Home / Other | 444 (90.8%) | 45 (9.2%) |
| Total | 14,786 (60.6%) | 9,609 (39.4%) |
Housing Structures by Number of Rooms in Milpitas
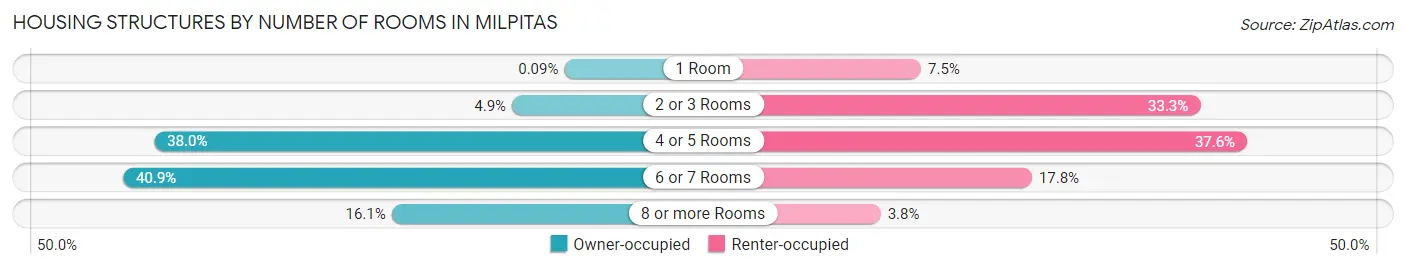
| Number of Rooms | Owner-occupied | Renter-occupied |
| 1 Room | 14 (0.1%) | 722 (7.5%) |
| 2 or 3 Rooms | 729 (4.9%) | 3,201 (33.3%) |
| 4 or 5 Rooms | 5,621 (38.0%) | 3,617 (37.6%) |
| 6 or 7 Rooms | 6,048 (40.9%) | 1,707 (17.8%) |
| 8 or more Rooms | 2,374 (16.1%) | 362 (3.8%) |
| Total | 14,786 (100.0%) | 9,609 (100.0%) |
Housing Structure by Heating Type in Milpitas
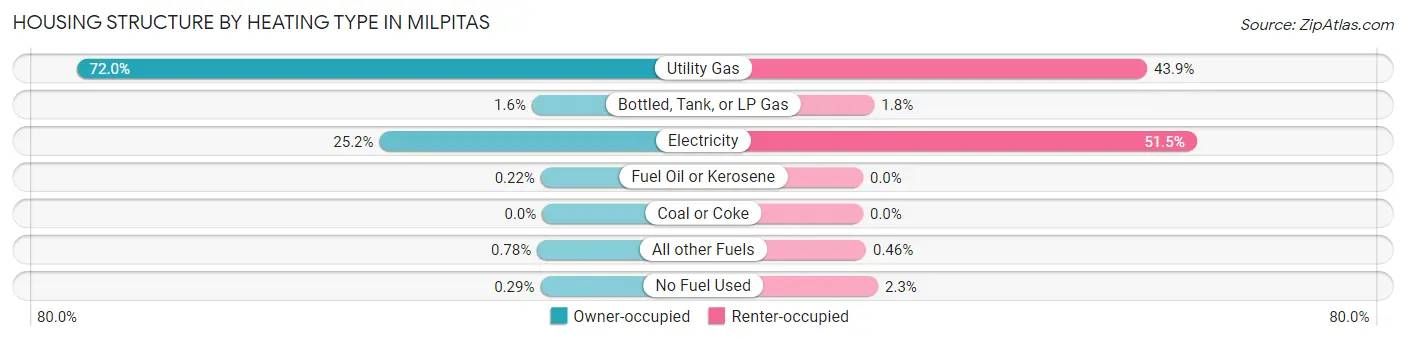
| Heating Type | Owner-occupied | Renter-occupied |
| Utility Gas | 10,638 (72.0%) | 4,220 (43.9%) |
| Bottled, Tank, or LP Gas | 236 (1.6%) | 169 (1.8%) |
| Electricity | 3,720 (25.2%) | 4,952 (51.5%) |
| Fuel Oil or Kerosene | 33 (0.2%) | 0 (0.0%) |
| Coal or Coke | 0 (0.0%) | 0 (0.0%) |
| All other Fuels | 116 (0.8%) | 44 (0.5%) |
| No Fuel Used | 43 (0.3%) | 224 (2.3%) |
| Total | 14,786 (100.0%) | 9,609 (100.0%) |
Household Vehicle Usage in Milpitas
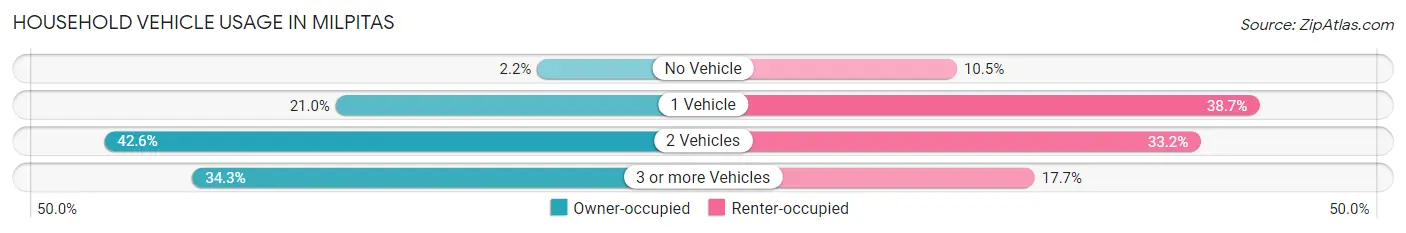
| Vehicles per Household | Owner-occupied | Renter-occupied |
| No Vehicle | 318 (2.1%) | 1,005 (10.5%) |
| 1 Vehicle | 3,099 (21.0%) | 3,715 (38.7%) |
| 2 Vehicles | 6,292 (42.5%) | 3,185 (33.2%) |
| 3 or more Vehicles | 5,077 (34.3%) | 1,704 (17.7%) |
| Total | 14,786 (100.0%) | 9,609 (100.0%) |
Real Estate & Mortgages in Milpitas
Real Estate and Mortgage Overview in Milpitas
| Characteristic | Without Mortgage | With Mortgage |
| Housing Units | 4,260 | 10,526 |
| Median Property Value | $1,138,300 | $1,160,600 |
| Median Household Income | $116,146 | $7,207 |
| Monthly Housing Costs | $857 | $7,752 |
| Real Estate Taxes | $5,683 | $144 |
Property Value by Mortgage Status in Milpitas
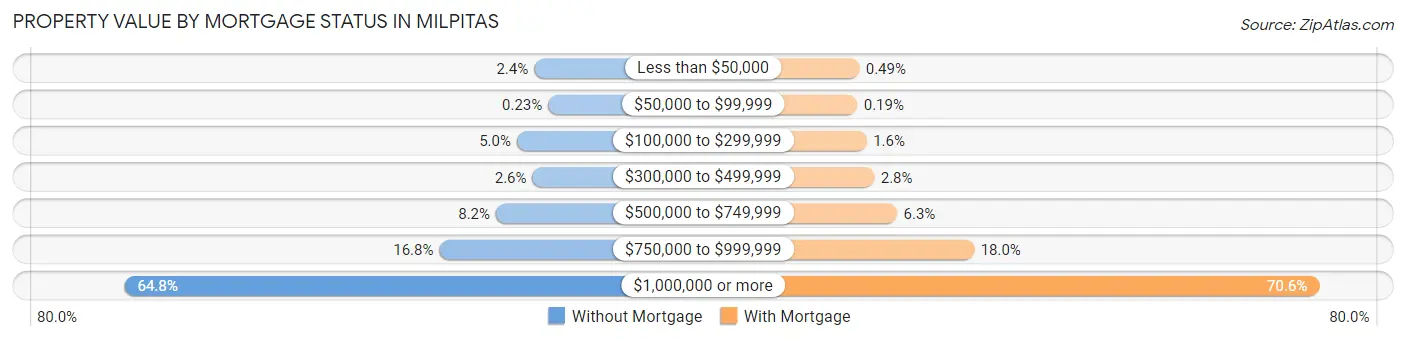
| Property Value | Without Mortgage | With Mortgage |
| Less than $50,000 | 101 (2.4%) | 52 (0.5%) |
| $50,000 to $99,999 | 10 (0.2%) | 20 (0.2%) |
| $100,000 to $299,999 | 213 (5.0%) | 172 (1.6%) |
| $300,000 to $499,999 | 112 (2.6%) | 293 (2.8%) |
| $500,000 to $749,999 | 349 (8.2%) | 658 (6.2%) |
| $750,000 to $999,999 | 716 (16.8%) | 1,895 (18.0%) |
| $1,000,000 or more | 2,759 (64.8%) | 7,436 (70.6%) |
| Total | 4,260 (100.0%) | 10,526 (100.0%) |
Household Income by Mortgage Status in Milpitas
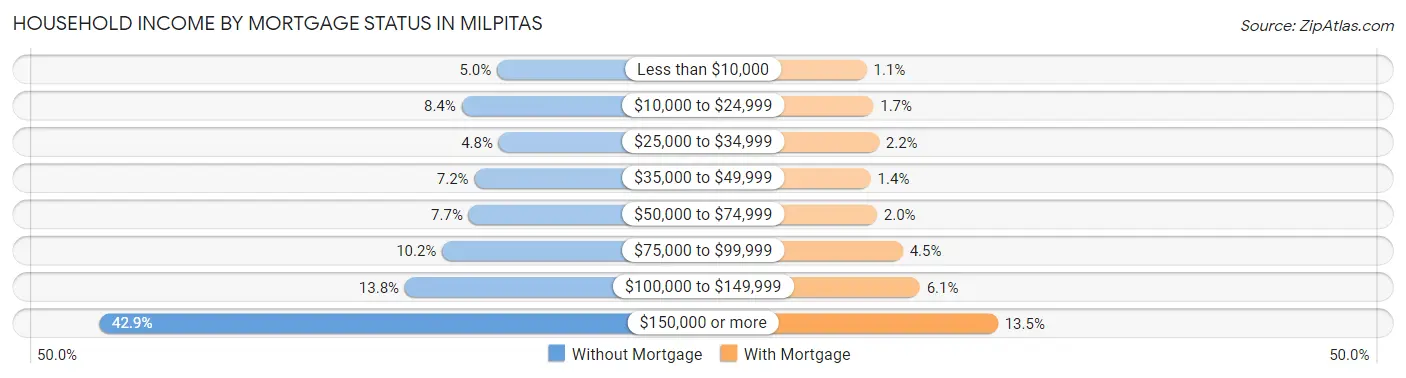
| Household Income | Without Mortgage | With Mortgage |
| Less than $10,000 | 213 (5.0%) | 111 (1.1%) |
| $10,000 to $24,999 | 357 (8.4%) | 178 (1.7%) |
| $25,000 to $34,999 | 206 (4.8%) | 234 (2.2%) |
| $35,000 to $49,999 | 305 (7.2%) | 152 (1.4%) |
| $50,000 to $74,999 | 328 (7.7%) | 214 (2.0%) |
| $75,000 to $99,999 | 436 (10.2%) | 473 (4.5%) |
| $100,000 to $149,999 | 587 (13.8%) | 643 (6.1%) |
| $150,000 or more | 1,828 (42.9%) | 1,425 (13.5%) |
| Total | 4,260 (100.0%) | 10,526 (100.0%) |
Property Value to Household Income Ratio in Milpitas
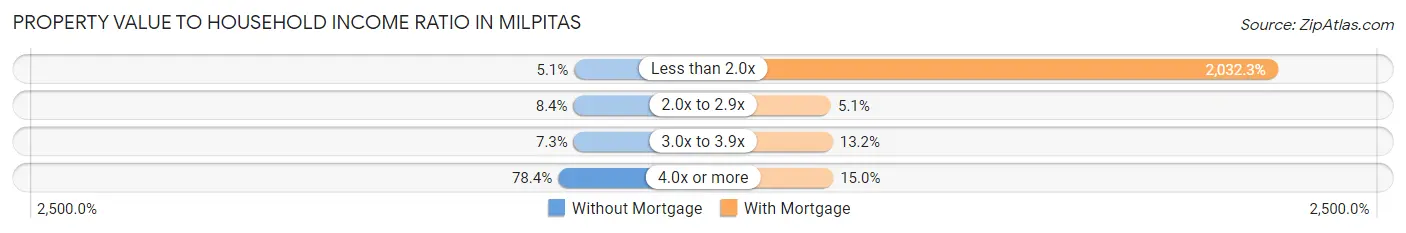
| Value-to-Income Ratio | Without Mortgage | With Mortgage |
| Less than 2.0x | 219 (5.1%) | 213,922 (2,032.3%) |
| 2.0x to 2.9x | 356 (8.4%) | 536 (5.1%) |
| 3.0x to 3.9x | 309 (7.2%) | 1,386 (13.2%) |
| 4.0x or more | 3,339 (78.4%) | 1,580 (15.0%) |
| Total | 4,260 (100.0%) | 10,526 (100.0%) |
Real Estate Taxes by Mortgage Status in Milpitas
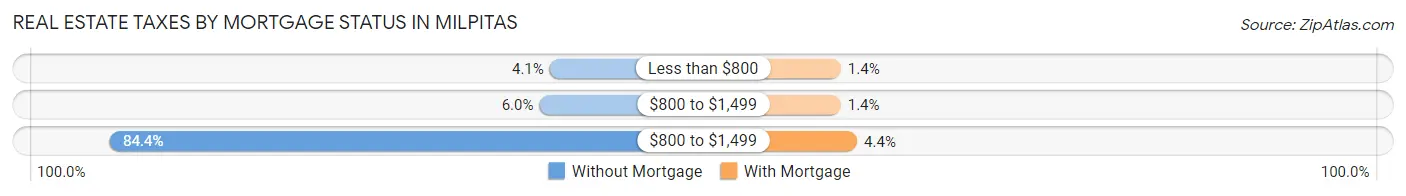
| Property Taxes | Without Mortgage | With Mortgage |
| Less than $800 | 175 (4.1%) | 152 (1.4%) |
| $800 to $1,499 | 255 (6.0%) | 148 (1.4%) |
| $800 to $1,499 | 3,595 (84.4%) | 463 (4.4%) |
| Total | 4,260 (100.0%) | 10,526 (100.0%) |
Health & Disability in Milpitas
Health Insurance Coverage by Age in Milpitas
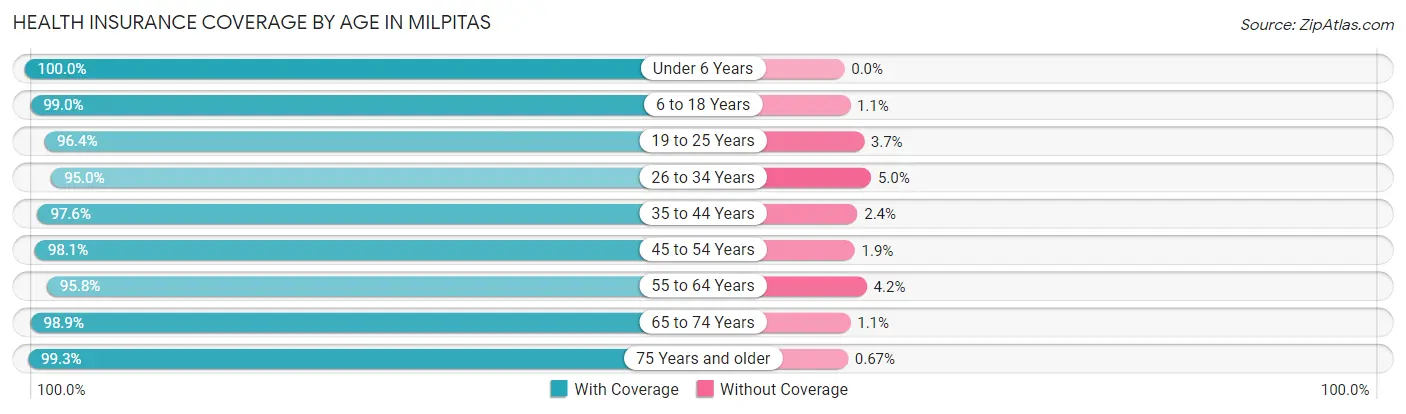
| Age Bracket | With Coverage | Without Coverage |
| Under 6 Years | 5,224 (100.0%) | 0 (0.0%) |
| 6 to 18 Years | 11,819 (99.0%) | 125 (1.1%) |
| 19 to 25 Years | 5,352 (96.4%) | 203 (3.6%) |
| 26 to 34 Years | 13,184 (95.0%) | 690 (5.0%) |
| 35 to 44 Years | 11,737 (97.6%) | 291 (2.4%) |
| 45 to 54 Years | 9,076 (98.1%) | 178 (1.9%) |
| 55 to 64 Years | 9,224 (95.8%) | 401 (4.2%) |
| 65 to 74 Years | 5,651 (98.9%) | 64 (1.1%) |
| 75 Years and older | 3,873 (99.3%) | 26 (0.7%) |
| Total | 75,140 (97.4%) | 1,978 (2.6%) |
Health Insurance Coverage by Citizenship Status in Milpitas
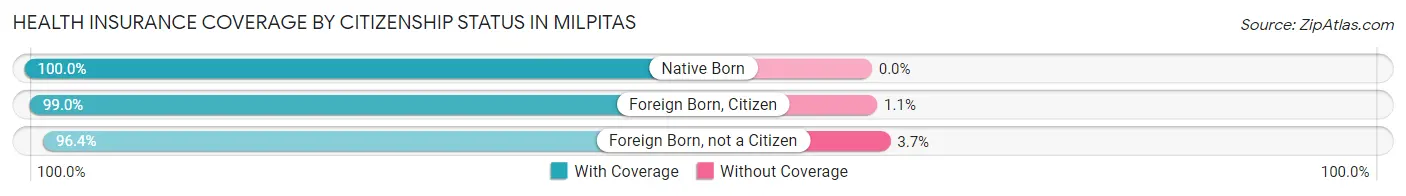
| Citizenship Status | With Coverage | Without Coverage |
| Native Born | 5,224 (100.0%) | 0 (0.0%) |
| Foreign Born, Citizen | 11,819 (99.0%) | 125 (1.1%) |
| Foreign Born, not a Citizen | 5,352 (96.4%) | 203 (3.6%) |
Health Insurance Coverage by Household Income in Milpitas
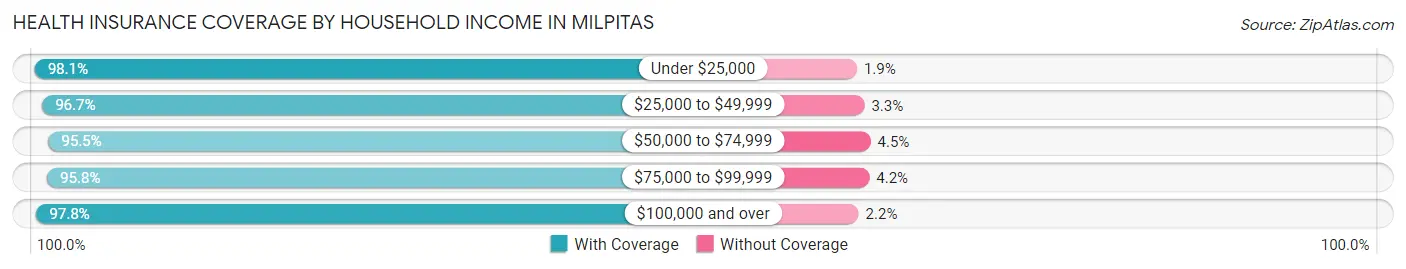
| Household Income | With Coverage | Without Coverage |
| Under $25,000 | 3,698 (98.1%) | 72 (1.9%) |
| $25,000 to $49,999 | 3,128 (96.7%) | 107 (3.3%) |
| $50,000 to $74,999 | 4,731 (95.5%) | 221 (4.5%) |
| $75,000 to $99,999 | 5,734 (95.8%) | 253 (4.2%) |
| $100,000 and over | 57,701 (97.8%) | 1,313 (2.2%) |
Public vs Private Health Insurance Coverage by Age in Milpitas
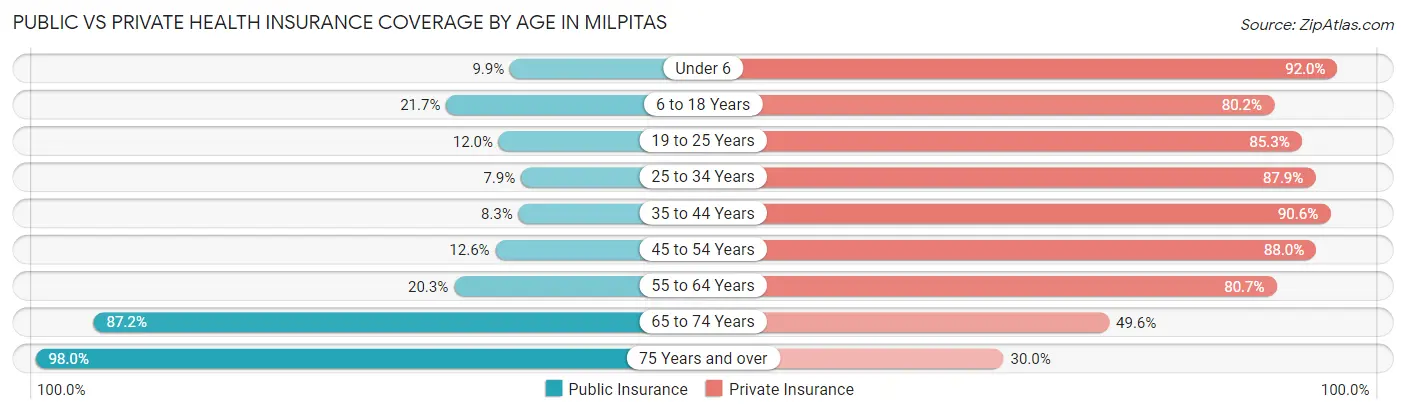
| Age Bracket | Public Insurance | Private Insurance |
| Under 6 | 517 (9.9%) | 4,805 (92.0%) |
| 6 to 18 Years | 2,597 (21.7%) | 9,577 (80.2%) |
| 19 to 25 Years | 665 (12.0%) | 4,740 (85.3%) |
| 25 to 34 Years | 1,089 (7.9%) | 12,188 (87.8%) |
| 35 to 44 Years | 999 (8.3%) | 10,899 (90.6%) |
| 45 to 54 Years | 1,167 (12.6%) | 8,146 (88.0%) |
| 55 to 64 Years | 1,953 (20.3%) | 7,763 (80.6%) |
| 65 to 74 Years | 4,983 (87.2%) | 2,836 (49.6%) |
| 75 Years and over | 3,820 (98.0%) | 1,171 (30.0%) |
| Total | 17,790 (23.1%) | 62,125 (80.6%) |
Disability Status by Sex by Age in Milpitas
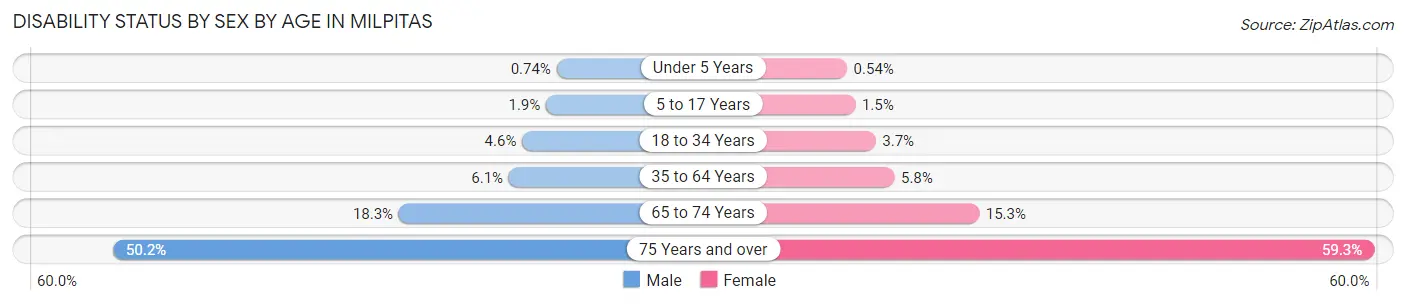
| Age Bracket | Male | Female |
| Under 5 Years | 19 (0.7%) | 10 (0.5%) |
| 5 to 17 Years | 123 (1.9%) | 81 (1.5%) |
| 18 to 34 Years | 493 (4.6%) | 354 (3.7%) |
| 35 to 64 Years | 975 (6.1%) | 861 (5.8%) |
| 65 to 74 Years | 480 (18.3%) | 472 (15.3%) |
| 75 Years and over | 942 (50.2%) | 1,198 (59.3%) |
Disability Class by Sex by Age in Milpitas
Disability Class: Hearing Difficulty
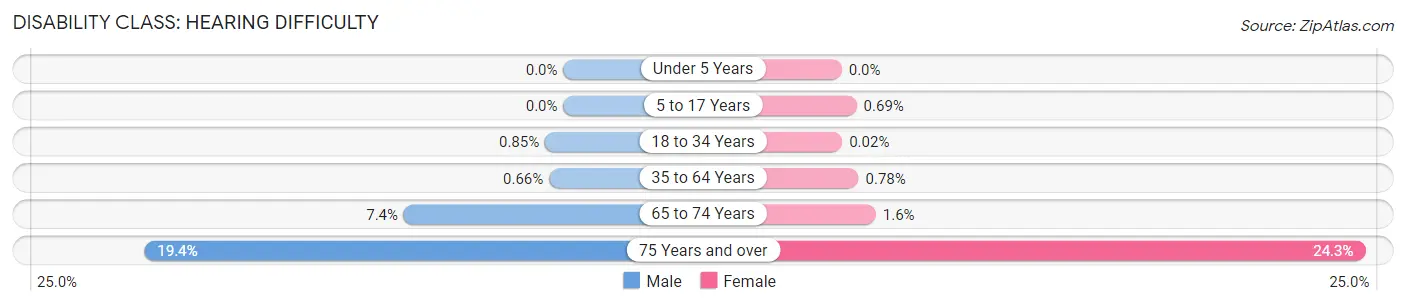
| Age Bracket | Male | Female |
| Under 5 Years | 0 (0.0%) | 0 (0.0%) |
| 5 to 17 Years | 0 (0.0%) | 38 (0.7%) |
| 18 to 34 Years | 92 (0.9%) | 2 (0.0%) |
| 35 to 64 Years | 107 (0.7%) | 116 (0.8%) |
| 65 to 74 Years | 194 (7.4%) | 49 (1.6%) |
| 75 Years and over | 365 (19.4%) | 491 (24.3%) |
Disability Class: Vision Difficulty
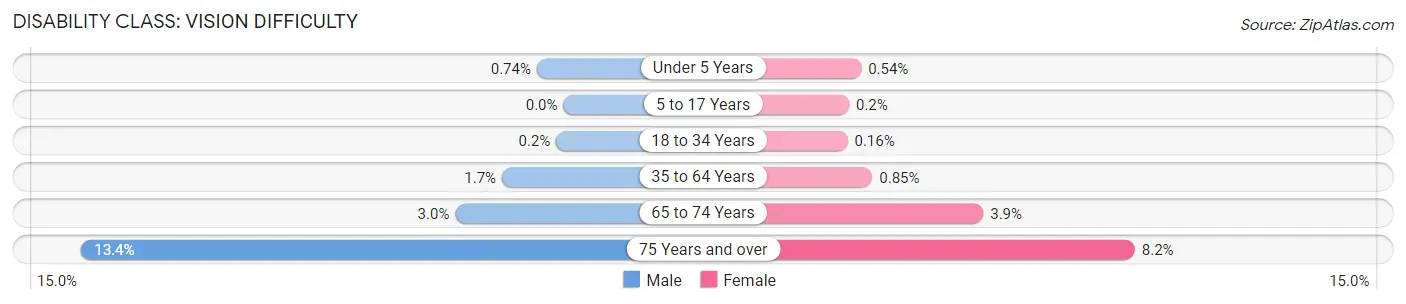
| Age Bracket | Male | Female |
| Under 5 Years | 19 (0.7%) | 10 (0.5%) |
| 5 to 17 Years | 0 (0.0%) | 11 (0.2%) |
| 18 to 34 Years | 22 (0.2%) | 15 (0.2%) |
| 35 to 64 Years | 275 (1.7%) | 126 (0.9%) |
| 65 to 74 Years | 79 (3.0%) | 122 (3.9%) |
| 75 Years and over | 252 (13.4%) | 165 (8.2%) |
Disability Class: Cognitive Difficulty
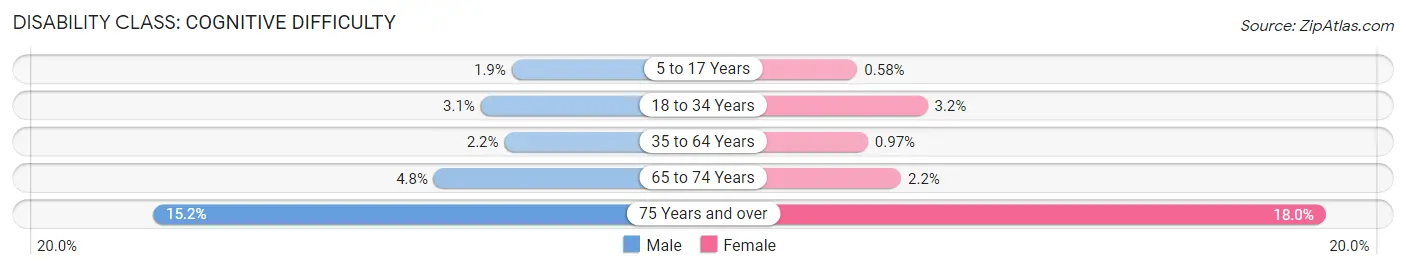
| Age Bracket | Male | Female |
| 5 to 17 Years | 123 (1.9%) | 32 (0.6%) |
| 18 to 34 Years | 331 (3.1%) | 301 (3.2%) |
| 35 to 64 Years | 353 (2.2%) | 144 (1.0%) |
| 65 to 74 Years | 126 (4.8%) | 68 (2.2%) |
| 75 Years and over | 286 (15.2%) | 363 (18.0%) |
Disability Class: Ambulatory Difficulty
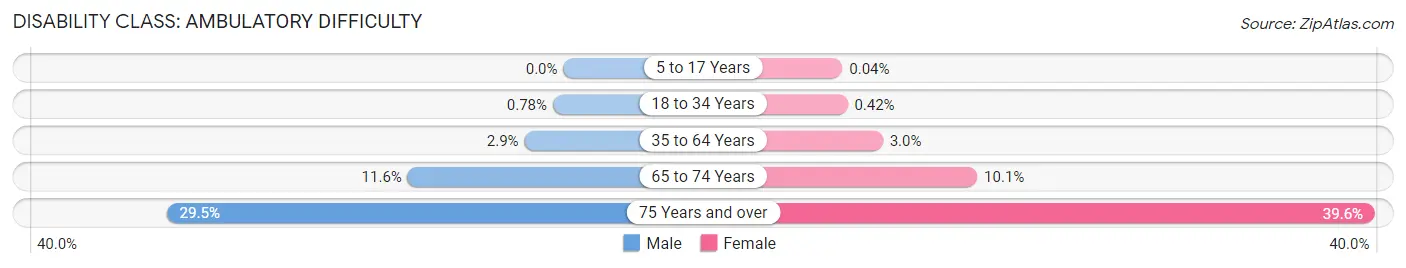
| Age Bracket | Male | Female |
| 5 to 17 Years | 0 (0.0%) | 2 (0.0%) |
| 18 to 34 Years | 84 (0.8%) | 40 (0.4%) |
| 35 to 64 Years | 466 (2.9%) | 450 (3.0%) |
| 65 to 74 Years | 303 (11.6%) | 311 (10.1%) |
| 75 Years and over | 553 (29.4%) | 800 (39.6%) |
Disability Class: Self-Care Difficulty
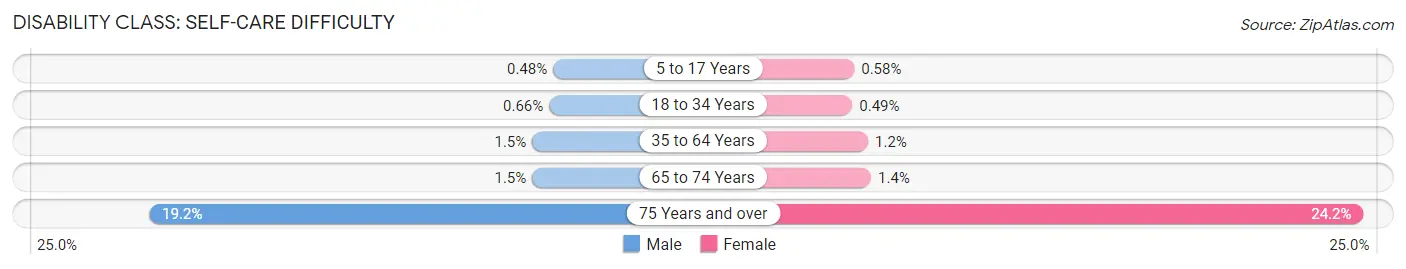
| Age Bracket | Male | Female |
| 5 to 17 Years | 31 (0.5%) | 32 (0.6%) |
| 18 to 34 Years | 71 (0.7%) | 46 (0.5%) |
| 35 to 64 Years | 234 (1.5%) | 181 (1.2%) |
| 65 to 74 Years | 38 (1.5%) | 42 (1.4%) |
| 75 Years and over | 361 (19.2%) | 489 (24.2%) |
Technology Access in Milpitas
Computing Device Access in Milpitas
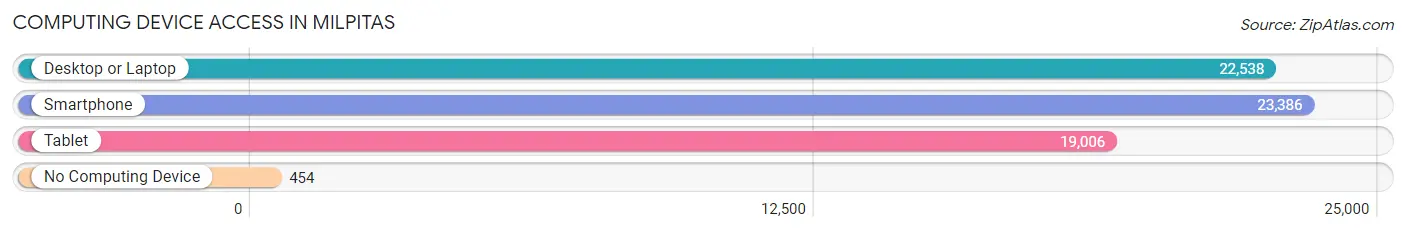
| Device Type | # Households | % Households |
| Desktop or Laptop | 22,538 | 92.4% |
| Smartphone | 23,386 | 95.9% |
| Tablet | 19,006 | 77.9% |
| No Computing Device | 454 | 1.9% |
| Total | 24,395 | 100.0% |
Internet Access in Milpitas
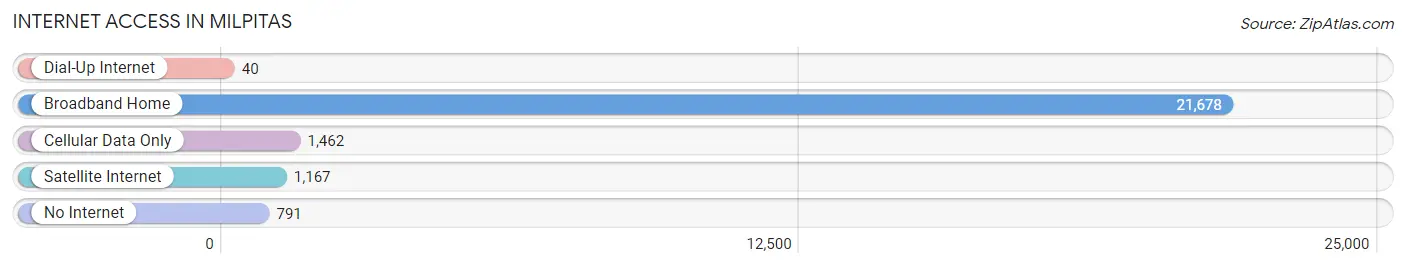
| Internet Type | # Households | % Households |
| Dial-Up Internet | 40 | 0.2% |
| Broadband Home | 21,678 | 88.9% |
| Cellular Data Only | 1,462 | 6.0% |
| Satellite Internet | 1,167 | 4.8% |
| No Internet | 791 | 3.2% |
| Total | 24,395 | 100.0% |
Milpitas Summary
Milpitas, California is a city located in the San Francisco Bay Area in Santa Clara County. It is situated between the cities of San Jose and Fremont, and is part of the Silicon Valley. The city has a population of approximately 75,000 people and is known for its diverse population and vibrant economy.
History
The area that is now Milpitas was originally inhabited by the Ohlone people, who were the first inhabitants of the San Francisco Bay Area. The Ohlone people lived in the area for thousands of years before the arrival of the Spanish in the late 1700s. The Spanish established a mission in the area in 1797, and the area was later incorporated as a town in 1852.
The town was originally called Milpitas, which is derived from the Spanish word for “little cornfields.” The town was a small agricultural community until the 1950s, when the population began to grow rapidly due to the influx of people from the San Francisco Bay Area. The population continued to grow throughout the 1960s and 1970s, and the city was officially incorporated in 1959.
Geography
Milpitas is located in the San Francisco Bay Area in Santa Clara County. It is situated between the cities of San Jose and Fremont, and is part of the Silicon Valley. The city is located at the base of the Diablo Range, and is surrounded by hills and mountains. The city has a total area of 13.2 square miles, and is located at an elevation of about 500 feet.
The climate in Milpitas is mild and temperate, with warm summers and cool winters. The average temperature in the summer is around 75 degrees Fahrenheit, and the average temperature in the winter is around 55 degrees Fahrenheit. The city receives an average of 17 inches of rain per year.
Economy
Milpitas is part of the Silicon Valley, and is home to many technology companies. The city is home to several major employers, including Cisco Systems, SanDisk, and KLA-Tencor. The city is also home to several shopping centers, including the Great Mall of the Bay Area, which is the largest shopping mall in Northern California.
The city’s economy is also supported by its tourism industry. The city is home to several attractions, including the Great Mall of the Bay Area, the Milpitas Historical Museum, and the Milpitas Sports Complex. The city also hosts several annual events, including the Milpitas International Festival and the Milpitas Music and Arts Festival.
Demographics
As of the 2010 census, the population of Milpitas was 75,000. The city has a diverse population, with a large Asian population, as well as a significant Hispanic population. The city also has a large population of people from India, the Philippines, and Vietnam.
The median household income in Milpitas is $90,000, and the median home value is $735,000. The city has a high rate of homeownership, with over 70% of the population owning their own homes. The city also has a high rate of educational attainment, with over 80% of the population having a high school diploma or higher.
Common Questions
What is Per Capita Income in Milpitas?
Per Capita income in Milpitas is $61,826.
What is the Median Family Income in Milpitas?
Median Family Income in Milpitas is $171,937.
What is the Median Household income in Milpitas?
Median Household Income in Milpitas is $166,769.
What is Income or Wage Gap in Milpitas?
Income or Wage Gap in Milpitas is 40.6%.
Women in Milpitas earn 59.4 cents for every dollar earned by a man.
What is Family Income Deficit in Milpitas?
Family Income Deficit in Milpitas is $12,259.
Families that are below poverty line in Milpitas earn $12,259 less on average than the poverty threshold level.
What is Inequality or Gini Index in Milpitas?
Inequality or Gini Index in Milpitas is 0.40.
What is the Total Population of Milpitas?
Total Population of Milpitas is 79,092.
What is the Total Male Population of Milpitas?
Total Male Population of Milpitas is 41,996.
What is the Total Female Population of Milpitas?
Total Female Population of Milpitas is 37,096.
What is the Ratio of Males per 100 Females in Milpitas?
There are 113.21 Males per 100 Females in Milpitas.
What is the Ratio of Females per 100 Males in Milpitas?
There are 88.33 Females per 100 Males in Milpitas.
What is the Median Population Age in Milpitas?
Median Population Age in Milpitas is 36.1 Years.
What is the Average Family Size in Milpitas
Average Family Size in Milpitas is 3.4 People.
What is the Average Household Size in Milpitas
Average Household Size in Milpitas is 3.2 People.
How Large is the Labor Force in Milpitas?
There are 43,871 People in the Labor Forcein in Milpitas.
What is the Percentage of People in the Labor Force in Milpitas?
67.8% of People are in the Labor Force in Milpitas.
What is the Unemployment Rate in Milpitas?
Unemployment Rate in Milpitas is 4.5%.