Cities with the Highest Percentage of Population Employed in Architecture & Engineering in Oklahoma
RELATED REPORTS & OPTIONS
Architecture & Engineering
Oklahoma
Compare Cities
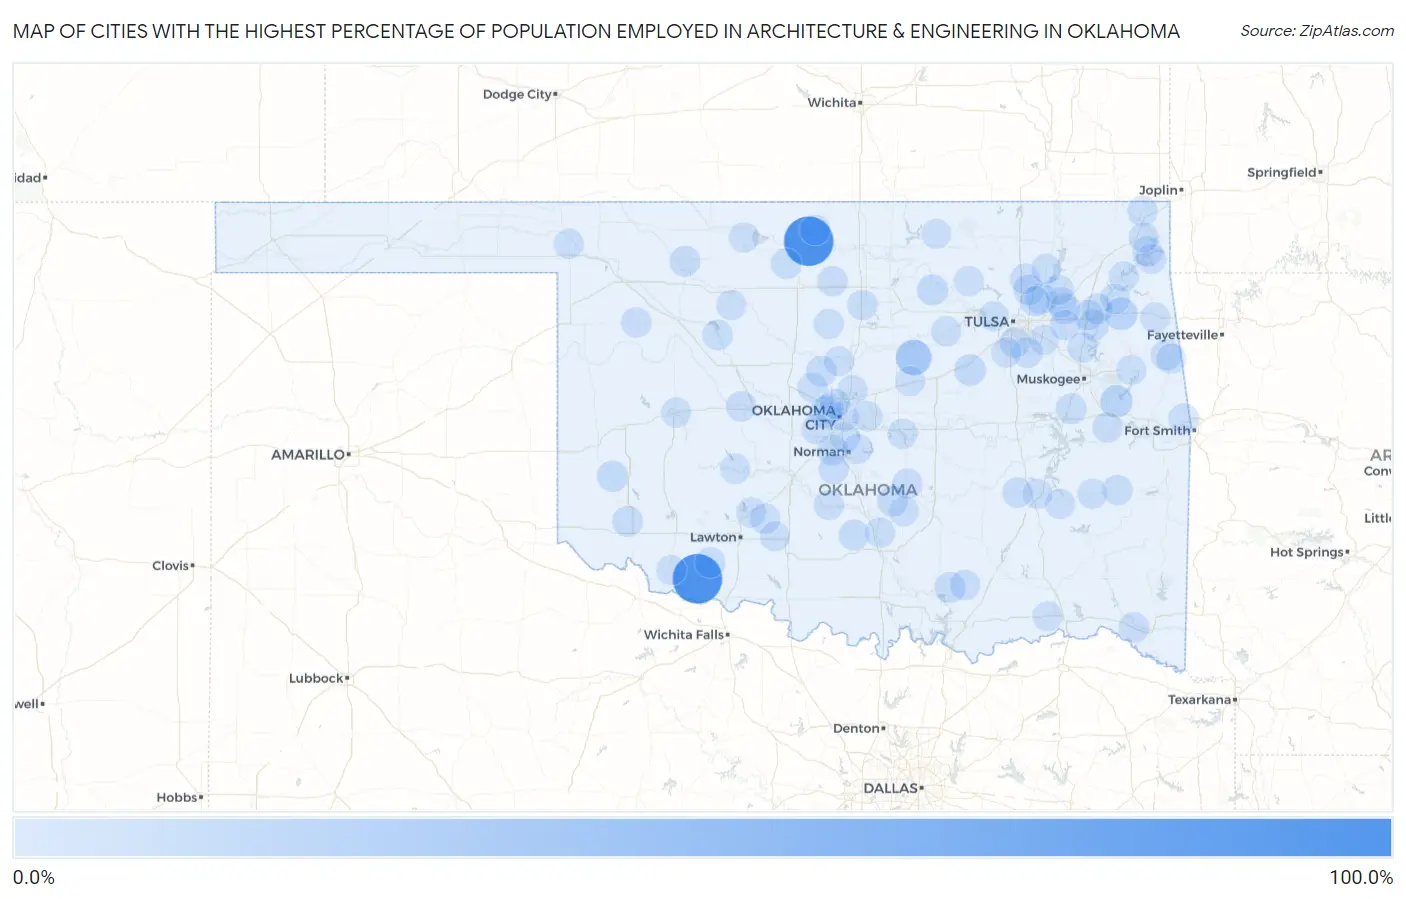
Map of Cities with the Highest Percentage of Population Employed in Architecture & Engineering in Oklahoma
0.0%
100.0%
Cities with the Highest Percentage of Population Employed in Architecture & Engineering in Oklahoma
| City | % Employed | vs State | vs National | |
| 1. | Jefferson | 100.0% | 1.8%(+98.2)#1 | 2.1%(+97.9)#10 |
| 2. | Loveland | 100.0% | 1.8%(+98.2)#2 | 2.1%(+97.9)#11 |
| 3. | Agra | 27.9% | 1.8%(+26.1)#3 | 2.1%(+25.8)#67 |
| 4. | Sportmans Shores | 16.7% | 1.8%(+14.8)#4 | 2.1%(+14.5)#185 |
| 5. | Middleberg | 15.2% | 1.8%(+13.3)#5 | 2.1%(+13.0)#225 |
| 6. | Rose | 14.3% | 1.8%(+12.4)#6 | 2.1%(+12.1)#251 |
| 7. | Notchietown | 12.9% | 1.8%(+11.0)#7 | 2.1%(+10.7)#311 |
| 8. | Hochatown | 9.8% | 1.8%(+7.97)#8 | 2.1%(+7.65)#514 |
| 9. | Woodlawn Park | 9.4% | 1.8%(+7.60)#9 | 2.1%(+7.28)#544 |
| 10. | Slick | 8.8% | 1.8%(+6.93)#10 | 2.1%(+6.62)#611 |
| 11. | Rocky Point | 8.6% | 1.8%(+6.75)#11 | 2.1%(+6.43)#628 |
| 12. | Willow | 7.1% | 1.8%(+5.30)#12 | 2.1%(+4.99)#894 |
| 13. | Skedee | 7.1% | 1.8%(+5.30)#13 | 2.1%(+4.99)#898 |
| 14. | Limestone | 6.7% | 1.8%(+4.86)#14 | 2.1%(+4.55)#997 |
| 15. | Welty | 6.4% | 1.8%(+4.54)#15 | 2.1%(+4.23)#1,091 |
| 16. | Cashion | 6.0% | 1.8%(+4.16)#16 | 2.1%(+3.85)#1,238 |
| 17. | Rentiesville | 5.9% | 1.8%(+4.04)#17 | 2.1%(+3.73)#1,300 |
| 18. | Milburn | 5.7% | 1.8%(+3.88)#18 | 2.1%(+3.57)#1,378 |
| 19. | West Peavine | 5.6% | 1.8%(+3.80)#19 | 2.1%(+3.48)#1,425 |
| 20. | Collinsville | 5.6% | 1.8%(+3.79)#20 | 2.1%(+3.47)#1,432 |
| 21. | Martha | 5.5% | 1.8%(+3.62)#21 | 2.1%(+3.31)#1,530 |
| 22. | Tiawah | 5.4% | 1.8%(+3.60)#22 | 2.1%(+3.29)#1,541 |
| 23. | Hillsdale | 5.4% | 1.8%(+3.57)#23 | 2.1%(+3.26)#1,565 |
| 24. | Waynoka | 5.3% | 1.8%(+3.42)#24 | 2.1%(+3.11)#1,647 |
| 25. | Bentley | 5.3% | 1.8%(+3.42)#25 | 2.1%(+3.11)#1,659 |
| 26. | Byars | 5.2% | 1.8%(+3.33)#26 | 2.1%(+3.02)#1,715 |
| 27. | Elmore City | 5.1% | 1.8%(+3.23)#27 | 2.1%(+2.91)#1,788 |
| 28. | Newcastle | 4.9% | 1.8%(+3.05)#28 | 2.1%(+2.74)#1,905 |
| 29. | Pin Oak Acres | 4.6% | 1.8%(+2.74)#29 | 2.1%(+2.43)#2,158 |
| 30. | Sportsmen Acres | 4.4% | 1.8%(+2.57)#30 | 2.1%(+2.26)#2,297 |
| 31. | Remy | 4.4% | 1.8%(+2.57)#31 | 2.1%(+2.26)#2,306 |
| 32. | Chattanooga | 4.2% | 1.8%(+2.35)#32 | 2.1%(+2.04)#2,533 |
| 33. | Asher | 4.2% | 1.8%(+2.33)#33 | 2.1%(+2.02)#2,562 |
| 34. | Garvin | 4.2% | 1.8%(+2.33)#34 | 2.1%(+2.02)#2,566 |
| 35. | Bridgeport | 4.2% | 1.8%(+2.33)#35 | 2.1%(+2.02)#2,568 |
| 36. | Justice | 4.1% | 1.8%(+2.30)#36 | 2.1%(+1.98)#2,610 |
| 37. | Canton | 4.0% | 1.8%(+2.16)#37 | 2.1%(+1.85)#2,770 |
| 38. | Garber | 3.9% | 1.8%(+2.08)#38 | 2.1%(+1.77)#2,865 |
| 39. | Coleman | 3.8% | 1.8%(+1.98)#39 | 2.1%(+1.67)#2,993 |
| 40. | Bixby | 3.8% | 1.8%(+1.95)#40 | 2.1%(+1.64)#3,042 |
| 41. | Copeland | 3.7% | 1.8%(+1.89)#41 | 2.1%(+1.58)#3,127 |
| 42. | Jenks | 3.7% | 1.8%(+1.89)#42 | 2.1%(+1.58)#3,130 |
| 43. | Sterling | 3.7% | 1.8%(+1.82)#43 | 2.1%(+1.51)#3,242 |
| 44. | Cole | 3.5% | 1.8%(+1.68)#44 | 2.1%(+1.37)#3,497 |
| 45. | Arpelar | 3.4% | 1.8%(+1.61)#45 | 2.1%(+1.30)#3,616 |
| 46. | Simms | 3.4% | 1.8%(+1.55)#46 | 2.1%(+1.24)#3,736 |
| 47. | Medford | 3.3% | 1.8%(+1.50)#47 | 2.1%(+1.18)#3,844 |
| 48. | White Eagle | 3.3% | 1.8%(+1.50)#48 | 2.1%(+1.18)#3,847 |
| 49. | Chouteau | 3.3% | 1.8%(+1.49)#49 | 2.1%(+1.18)#3,869 |
| 50. | Vici | 3.3% | 1.8%(+1.45)#50 | 2.1%(+1.14)#3,926 |
| 51. | Inola | 3.2% | 1.8%(+1.37)#51 | 2.1%(+1.06)#4,089 |
| 52. | Red Oak | 3.0% | 1.8%(+1.21)#52 | 2.1%(+0.900)#4,461 |
| 53. | Perry | 3.0% | 1.8%(+1.17)#53 | 2.1%(+0.857)#4,574 |
| 54. | Vera | 3.0% | 1.8%(+1.13)#54 | 2.1%(+0.817)#4,667 |
| 55. | Wagoner | 2.9% | 1.8%(+1.08)#55 | 2.1%(+0.768)#4,803 |
| 56. | Frederick | 2.9% | 1.8%(+1.02)#56 | 2.1%(+0.706)#4,976 |
| 57. | Mustang | 2.8% | 1.8%(+0.992)#57 | 2.1%(+0.681)#5,027 |
| 58. | Moore | 2.7% | 1.8%(+0.874)#58 | 2.1%(+0.563)#5,390 |
| 59. | Broken Arrow | 2.7% | 1.8%(+0.866)#59 | 2.1%(+0.555)#5,409 |
| 60. | Clinton | 2.7% | 1.8%(+0.856)#60 | 2.1%(+0.545)#5,447 |
| 61. | Edmond | 2.7% | 1.8%(+0.856)#61 | 2.1%(+0.545)#5,449 |
| 62. | Piedmont | 2.7% | 1.8%(+0.838)#62 | 2.1%(+0.527)#5,506 |
| 63. | Elgin | 2.7% | 1.8%(+0.819)#63 | 2.1%(+0.508)#5,557 |
| 64. | Flint Creek | 2.6% | 1.8%(+0.809)#64 | 2.1%(+0.498)#5,591 |
| 65. | Grove | 2.6% | 1.8%(+0.788)#65 | 2.1%(+0.477)#5,658 |
| 66. | Haileyville | 2.6% | 1.8%(+0.748)#66 | 2.1%(+0.437)#5,770 |
| 67. | Oilton | 2.6% | 1.8%(+0.742)#67 | 2.1%(+0.431)#5,790 |
| 68. | Norman | 2.6% | 1.8%(+0.729)#68 | 2.1%(+0.418)#5,833 |
| 69. | Disney | 2.6% | 1.8%(+0.726)#69 | 2.1%(+0.415)#5,844 |
| 70. | Sequoyah | 2.6% | 1.8%(+0.719)#70 | 2.1%(+0.408)#5,866 |
| 71. | Shawnee | 2.5% | 1.8%(+0.688)#71 | 2.1%(+0.377)#5,969 |
| 72. | Central High | 2.5% | 1.8%(+0.674)#72 | 2.1%(+0.363)#6,003 |
| 73. | Wilburton | 2.5% | 1.8%(+0.650)#73 | 2.1%(+0.339)#6,073 |
| 74. | Owasso | 2.5% | 1.8%(+0.639)#74 | 2.1%(+0.328)#6,100 |
| 75. | Marshall | 2.5% | 1.8%(+0.637)#75 | 2.1%(+0.326)#6,108 |
| 76. | Cherokee | 2.5% | 1.8%(+0.622)#76 | 2.1%(+0.311)#6,156 |
| 77. | Fairview | 2.5% | 1.8%(+0.619)#77 | 2.1%(+0.308)#6,169 |
| 78. | Commerce | 2.4% | 1.8%(+0.609)#78 | 2.1%(+0.298)#6,201 |
| 79. | Wynnewood | 2.4% | 1.8%(+0.594)#79 | 2.1%(+0.283)#6,253 |
| 80. | Warr Acres | 2.4% | 1.8%(+0.512)#80 | 2.1%(+0.201)#6,550 |
| 81. | Sand Springs | 2.3% | 1.8%(+0.505)#81 | 2.1%(+0.194)#6,578 |
| 82. | Fort Cobb | 2.3% | 1.8%(+0.498)#82 | 2.1%(+0.187)#6,606 |
| 83. | Wickliffe | 2.3% | 1.8%(+0.475)#83 | 2.1%(+0.164)#6,692 |
| 84. | Keys | 2.3% | 1.8%(+0.450)#84 | 2.1%(+0.139)#6,782 |
| 85. | Oklahoma City | 2.3% | 1.8%(+0.435)#85 | 2.1%(+0.124)#6,842 |
| 86. | Laverne | 2.2% | 1.8%(+0.402)#86 | 2.1%(+0.091)#6,967 |
| 87. | Kiefer | 2.2% | 1.8%(+0.401)#87 | 2.1%(+0.090)#6,970 |
| 88. | Talala | 2.2% | 1.8%(+0.401)#88 | 2.1%(+0.090)#6,975 |
| 89. | Choctaw | 2.2% | 1.8%(+0.400)#89 | 2.1%(+0.089)#6,977 |
| 90. | Soper | 2.2% | 1.8%(+0.384)#90 | 2.1%(+0.073)#7,041 |
| 91. | Cedar Valley | 2.2% | 1.8%(+0.372)#91 | 2.1%(+0.061)#7,086 |
| 92. | Fairland | 2.2% | 1.8%(+0.362)#92 | 2.1%(+0.051)#7,122 |
| 93. | Peavine | 2.2% | 1.8%(+0.352)#93 | 2.1%(+0.041)#7,168 |
| 94. | Lindsay | 2.2% | 1.8%(+0.344)#94 | 2.1%(+0.033)#7,191 |
| 95. | Hominy | 2.2% | 1.8%(+0.318)#95 | 2.1%(+0.007)#7,308 |
| 96. | Chandler | 2.1% | 1.8%(+0.297)#96 | 2.1%(-0.014)#7,387 |
| 97. | Stratford | 2.1% | 1.8%(+0.289)#97 | 2.1%(-0.022)#7,407 |
| 98. | The Village | 2.1% | 1.8%(+0.287)#98 | 2.1%(-0.024)#7,413 |
| 99. | Mcalester | 2.1% | 1.8%(+0.279)#99 | 2.1%(-0.032)#7,442 |
| 100. | Shidler | 2.1% | 1.8%(+0.278)#100 | 2.1%(-0.033)#7,444 |
Common Questions
What are the Top 10 Cities with the Highest Percentage of Population Employed in Architecture & Engineering in Oklahoma?
Top 10 Cities with the Highest Percentage of Population Employed in Architecture & Engineering in Oklahoma are:
#1
100.0%
#2
100.0%
#3
27.9%
#4
14.3%
#5
12.9%
#6
9.4%
#7
8.8%
#8
7.1%
#9
7.1%
#10
6.7%
What city has the Highest Percentage of Population Employed in Architecture & Engineering in Oklahoma?
Jefferson has the Highest Percentage of Population Employed in Architecture & Engineering in Oklahoma with 100.0%.
What is the Percentage of Population Employed in Architecture & Engineering in the State of Oklahoma?
Percentage of Population Employed in Architecture & Engineering in Oklahoma is 1.8%.
What is the Percentage of Population Employed in Architecture & Engineering in the United States?
Percentage of Population Employed in Architecture & Engineering in the United States is 2.1%.