Sunnyvale, CA Map & Demographics
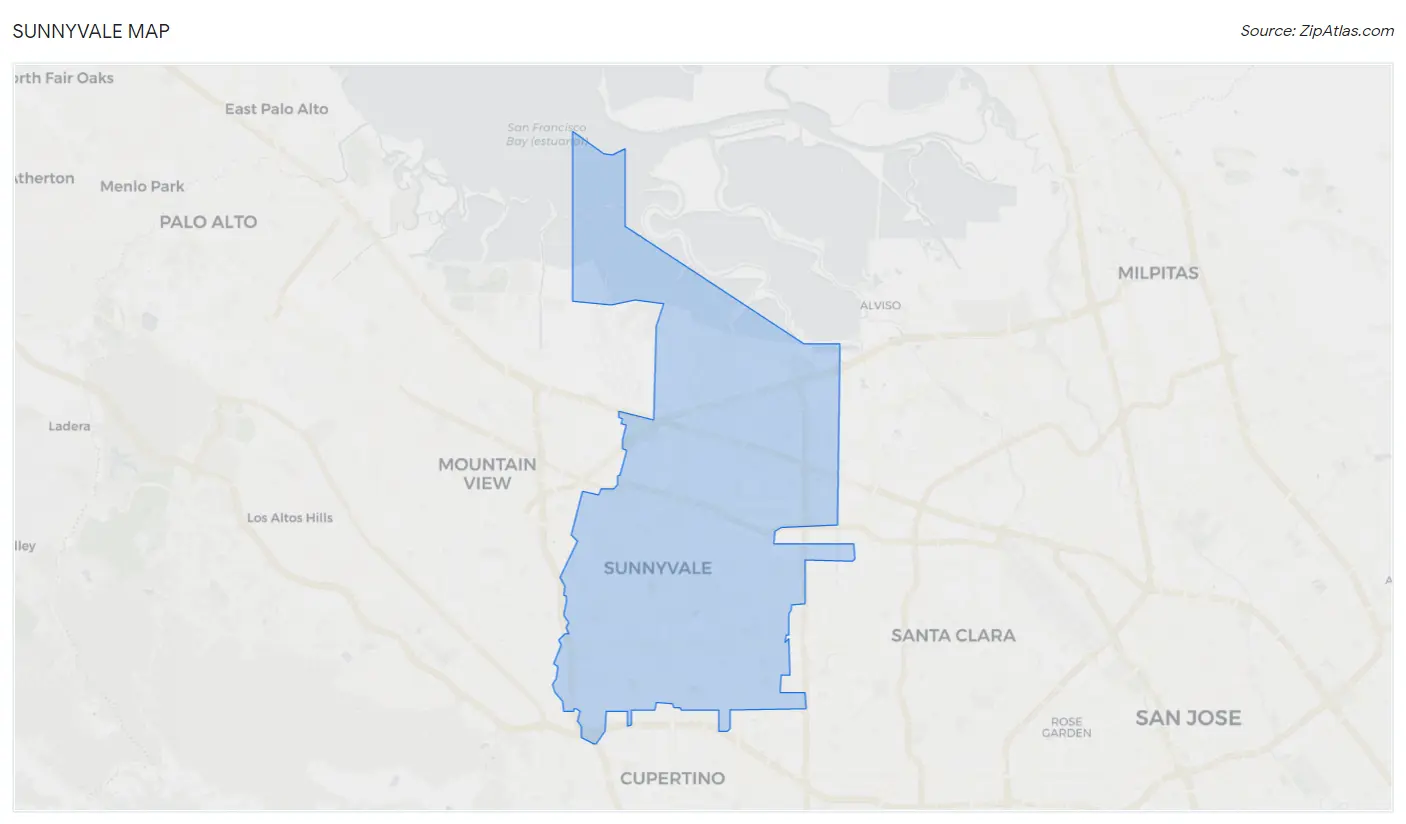
Sunnyvale Map
Sunnyvale Overview
$89,432
PER CAPITA INCOME
$190,031
AVG FAMILY INCOME
$174,506
AVG HOUSEHOLD INCOME
35.9%
WAGE / INCOME GAP [ % ]
64.1¢/ $1
WAGE / INCOME GAP [ $ ]
$10,529
FAMILY INCOME DEFICIT
0.45
INEQUALITY / GINI INDEX
154,573
TOTAL POPULATION
80,751
MALE POPULATION
73,822
FEMALE POPULATION
109.39
MALES / 100 FEMALES
91.42
FEMALES / 100 MALES
35.1
MEDIAN AGE
3.1
AVG FAMILY SIZE
2.6
AVG HOUSEHOLD SIZE
90,971
LABOR FORCE [ PEOPLE ]
71.8%
PERCENT IN LABOR FORCE
4.1%
UNEMPLOYMENT RATE
Income in Sunnyvale
Income Overview in Sunnyvale
Per Capita Income in Sunnyvale is $89,432, while median incomes of families and households are $190,031 and $174,506 respectively.
| Characteristic | Number | Measure |
| Per Capita Income | 154,573 | $89,432 |
| Median Family Income | 37,702 | $190,031 |
| Mean Family Income | 37,702 | $253,705 |
| Median Household Income | 58,646 | $174,506 |
| Mean Household Income | 58,646 | $231,726 |
| Income Deficit | 37,702 | $10,529 |
| Wage / Income Gap (%) | 154,573 | 35.93% |
| Wage / Income Gap ($) | 154,573 | 64.07¢ per $1 |
| Gini / Inequality Index | 154,573 | 0.45 |
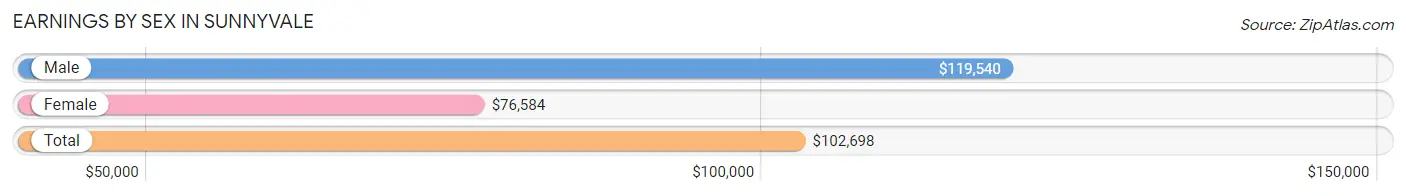
Earnings by Sex in Sunnyvale
Average Earnings in Sunnyvale are $102,698, $119,540 for men and $76,584 for women, a difference of 35.9%.
| Sex | Number | Average Earnings |
| Male | 53,164 (57.5%) | $119,540 |
| Female | 39,365 (42.5%) | $76,584 |
| Total | 92,529 (100.0%) | $102,698 |
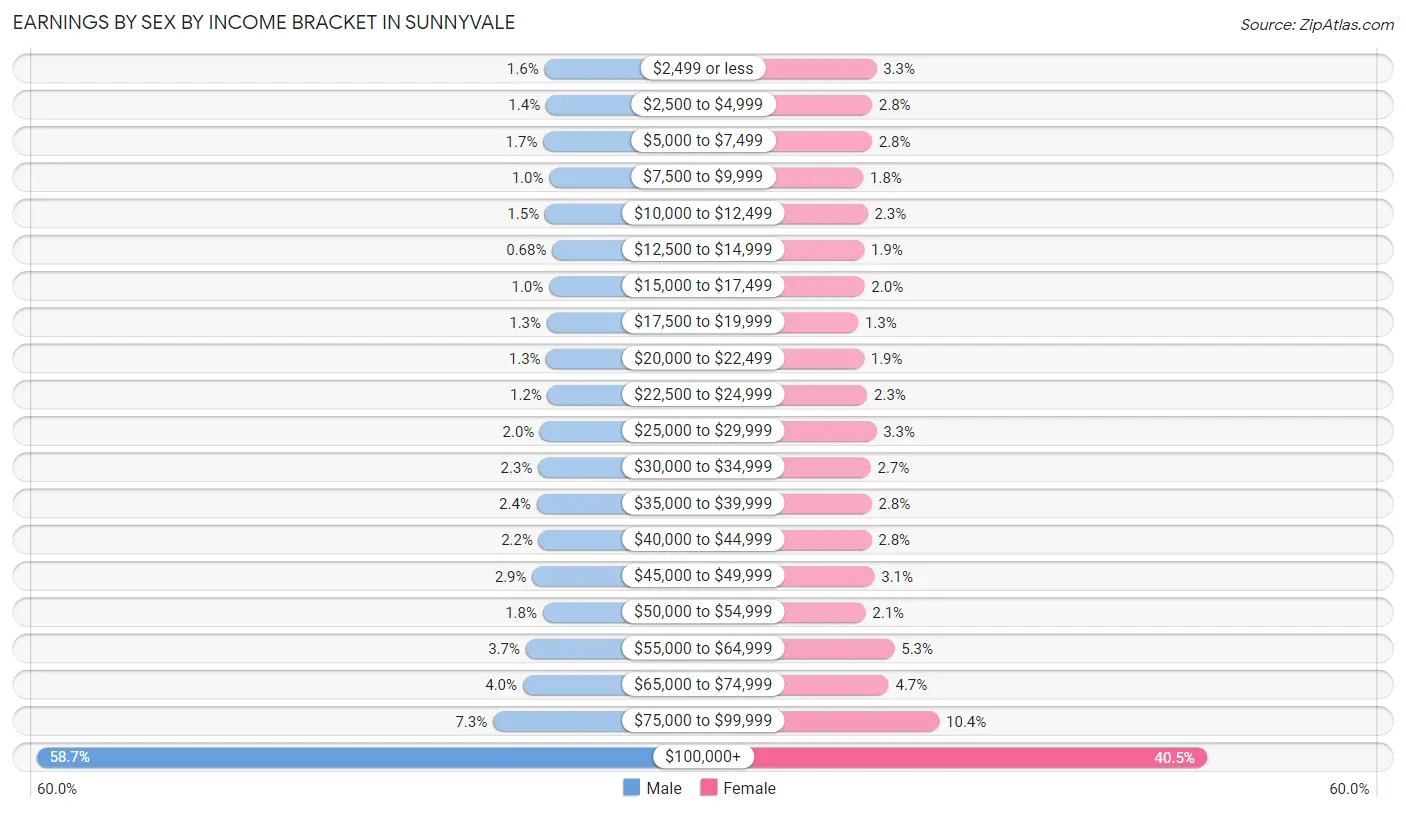
Earnings by Sex by Income Bracket in Sunnyvale
The most common earnings brackets in Sunnyvale are $100,000+ for men (31,188 | 58.7%) and $100,000+ for women (15,924 | 40.5%).
| Income | Male | Female |
| $2,499 or less | 828 (1.6%) | 1,303 (3.3%) |
| $2,500 to $4,999 | 741 (1.4%) | 1,109 (2.8%) |
| $5,000 to $7,499 | 903 (1.7%) | 1,108 (2.8%) |
| $7,500 to $9,999 | 543 (1.0%) | 721 (1.8%) |
| $10,000 to $12,499 | 798 (1.5%) | 912 (2.3%) |
| $12,500 to $14,999 | 361 (0.7%) | 761 (1.9%) |
| $15,000 to $17,499 | 553 (1.0%) | 778 (2.0%) |
| $17,500 to $19,999 | 685 (1.3%) | 497 (1.3%) |
| $20,000 to $22,499 | 712 (1.3%) | 751 (1.9%) |
| $22,500 to $24,999 | 638 (1.2%) | 897 (2.3%) |
| $25,000 to $29,999 | 1,087 (2.0%) | 1,304 (3.3%) |
| $30,000 to $34,999 | 1,204 (2.3%) | 1,051 (2.7%) |
| $35,000 to $39,999 | 1,294 (2.4%) | 1,093 (2.8%) |
| $40,000 to $44,999 | 1,170 (2.2%) | 1,086 (2.8%) |
| $45,000 to $49,999 | 1,555 (2.9%) | 1,216 (3.1%) |
| $50,000 to $54,999 | 932 (1.8%) | 821 (2.1%) |
| $55,000 to $64,999 | 1,948 (3.7%) | 2,102 (5.3%) |
| $65,000 to $74,999 | 2,123 (4.0%) | 1,845 (4.7%) |
| $75,000 to $99,999 | 3,901 (7.3%) | 4,086 (10.4%) |
| $100,000+ | 31,188 (58.7%) | 15,924 (40.5%) |
| Total | 53,164 (100.0%) | 39,365 (100.0%) |
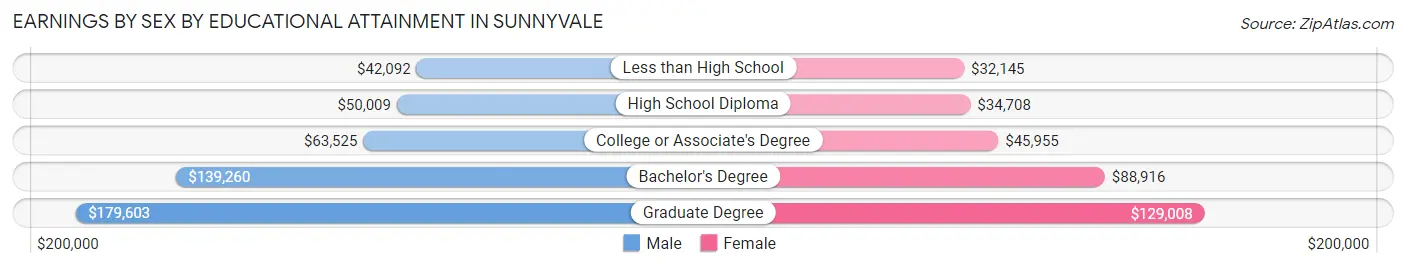
Earnings by Sex by Educational Attainment in Sunnyvale
Average earnings in Sunnyvale are $133,785 for men and $83,838 for women, a difference of 37.3%. Men with an educational attainment of graduate degree enjoy the highest average annual earnings of $179,603, while those with less than high school education earn the least with $42,092. Women with an educational attainment of graduate degree earn the most with the average annual earnings of $129,008, while those with less than high school education have the smallest earnings of $32,145.
| Educational Attainment | Male Income | Female Income |
| Less than High School | $42,092 | $32,145 |
| High School Diploma | $50,009 | $34,708 |
| College or Associate's Degree | $63,525 | $45,955 |
| Bachelor's Degree | $139,260 | $88,916 |
| Graduate Degree | $179,603 | $129,008 |
| Total | $133,785 | $83,838 |
Family Income in Sunnyvale
Family Income Brackets in Sunnyvale
According to the Sunnyvale family income data, there are 18,022 families falling into the $200,000+ income range, which is the most common income bracket and makes up 47.8% of all families. Conversely, the $10,000 to $14,999 income bracket is the least frequent group with only 302 families (0.8%) belonging to this category.
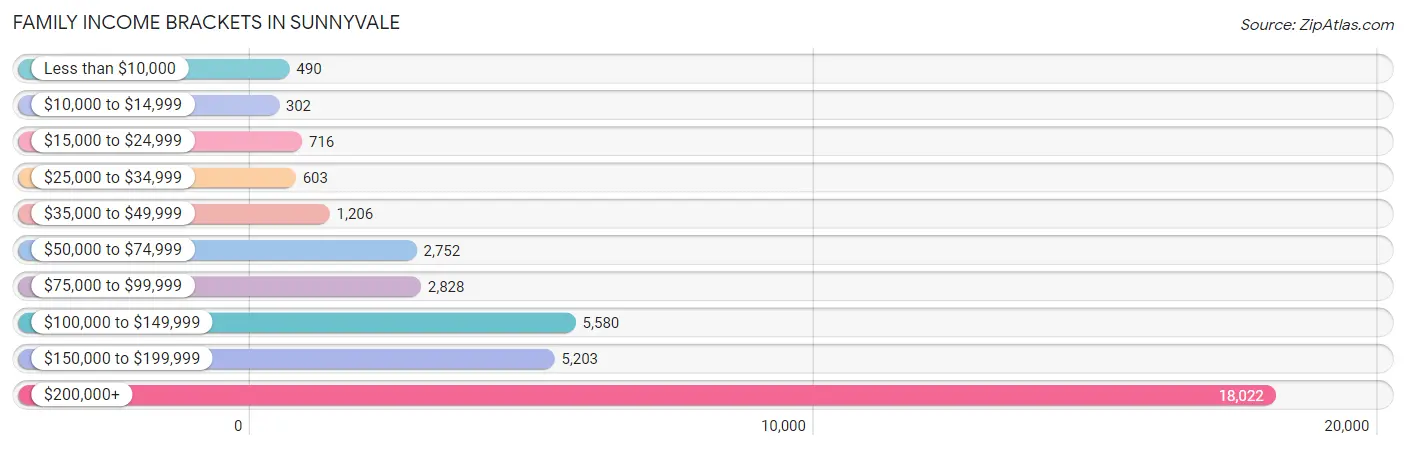
| Income Bracket | # Families | % Families |
| Less than $10,000 | 490 | 1.3% |
| $10,000 to $14,999 | 302 | 0.8% |
| $15,000 to $24,999 | 716 | 1.9% |
| $25,000 to $34,999 | 603 | 1.6% |
| $35,000 to $49,999 | 1,206 | 3.2% |
| $50,000 to $74,999 | 2,752 | 7.3% |
| $75,000 to $99,999 | 2,828 | 7.5% |
| $100,000 to $149,999 | 5,580 | 14.8% |
| $150,000 to $199,999 | 5,203 | 13.8% |
| $200,000+ | 18,022 | 47.8% |
Family Income by Famaliy Size in Sunnyvale
7+ person families (295 | 0.8%) account for the highest median family income in Sunnyvale with $250,001 per family, while 2-person families (14,924 | 39.6%) have the highest median income of $87,204 per family member.
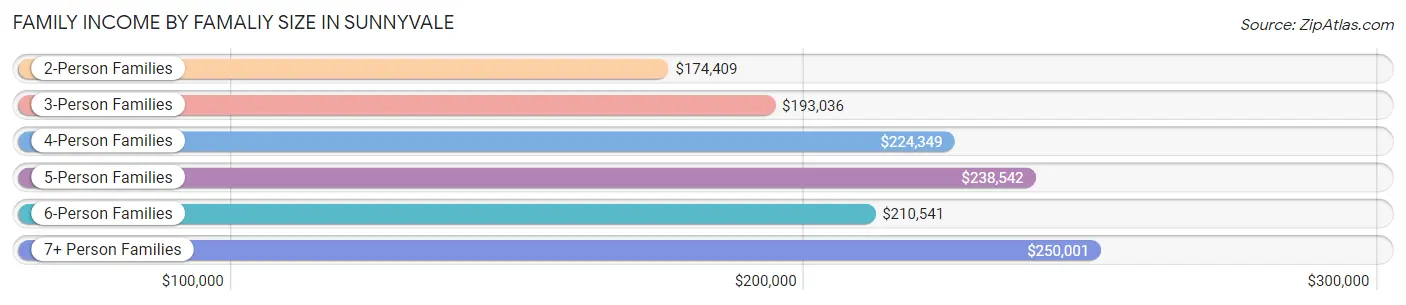
| Income Bracket | # Families | Median Income |
| 2-Person Families | 14,924 (39.6%) | $174,409 |
| 3-Person Families | 10,903 (28.9%) | $193,036 |
| 4-Person Families | 8,285 (22.0%) | $224,349 |
| 5-Person Families | 2,599 (6.9%) | $238,542 |
| 6-Person Families | 696 (1.8%) | $210,541 |
| 7+ Person Families | 295 (0.8%) | $250,001 |
| Total | 37,702 (100.0%) | $190,031 |
Family Income by Number of Earners in Sunnyvale
The median family income in Sunnyvale is $190,031, with families comprising 2 earners (18,210) having the highest median family income of $250,001, while families with no earners (3,203) have the lowest median family income of $70,729, accounting for 48.3% and 8.5% of families, respectively.
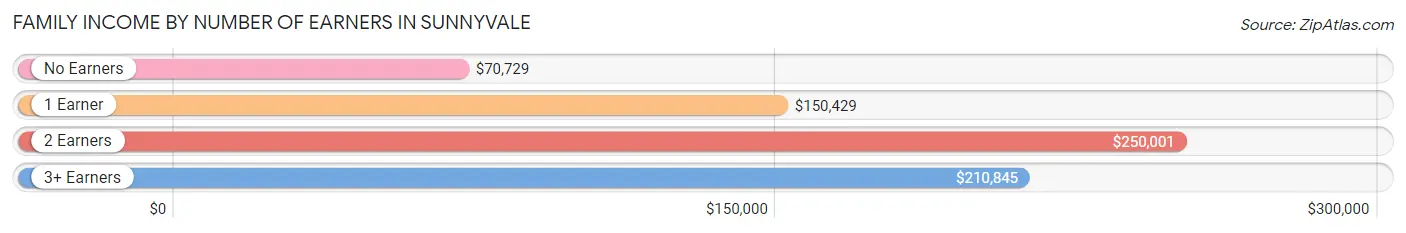
| Number of Earners | # Families | Median Income |
| No Earners | 3,203 (8.5%) | $70,729 |
| 1 Earner | 12,205 (32.4%) | $150,429 |
| 2 Earners | 18,210 (48.3%) | $250,001 |
| 3+ Earners | 4,084 (10.8%) | $210,845 |
| Total | 37,702 (100.0%) | $190,031 |
Household Income in Sunnyvale
Household Income Brackets in Sunnyvale
With 25,100 households falling in the category, the $200,000+ income range is the most frequent in Sunnyvale, accounting for 42.8% of all households. In contrast, only 762 households (1.3%) fall into the $10,000 to $14,999 income bracket, making it the least populous group.
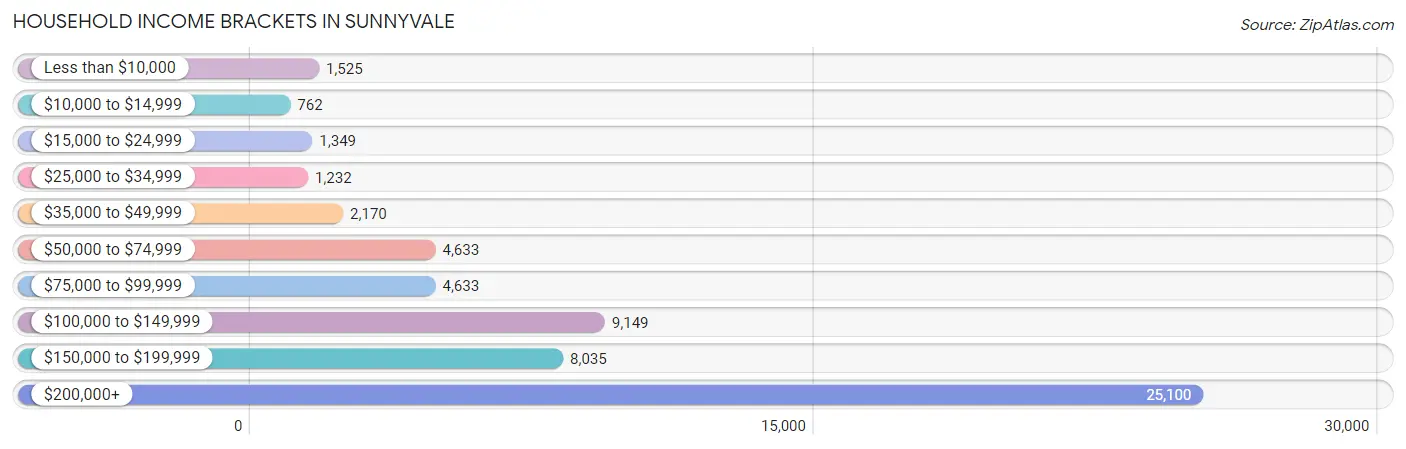
| Income Bracket | # Households | % Households |
| Less than $10,000 | 1,525 | 2.6% |
| $10,000 to $14,999 | 762 | 1.3% |
| $15,000 to $24,999 | 1,349 | 2.3% |
| $25,000 to $34,999 | 1,232 | 2.1% |
| $35,000 to $49,999 | 2,170 | 3.7% |
| $50,000 to $74,999 | 4,633 | 7.9% |
| $75,000 to $99,999 | 4,633 | 7.9% |
| $100,000 to $149,999 | 9,149 | 15.6% |
| $150,000 to $199,999 | 8,035 | 13.7% |
| $200,000+ | 25,100 | 42.8% |
Household Income by Householder Age in Sunnyvale
The median household income in Sunnyvale is $174,506, with the highest median household income of $209,471 found in the 25 to 44 years age bracket for the primary householder. A total of 28,763 households (49.0%) fall into this category. Meanwhile, the 65+ years age bracket for the primary householder has the lowest median household income of $82,553, with 10,551 households (18.0%) in this group.
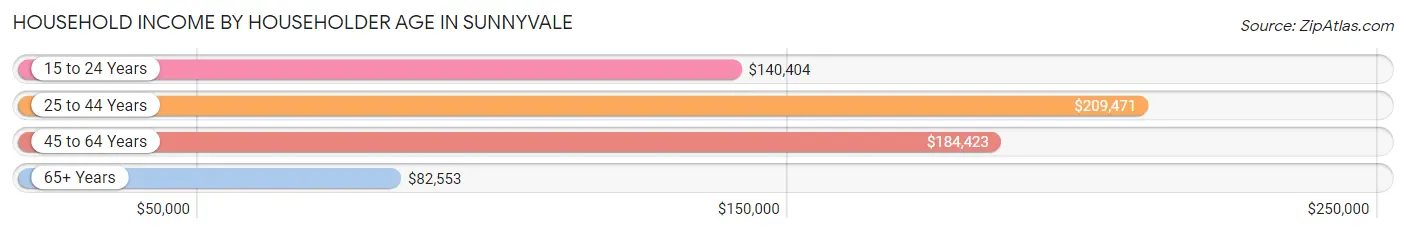
| Income Bracket | # Households | Median Income |
| 15 to 24 Years | 1,683 (2.9%) | $140,404 |
| 25 to 44 Years | 28,763 (49.0%) | $209,471 |
| 45 to 64 Years | 17,649 (30.1%) | $184,423 |
| 65+ Years | 10,551 (18.0%) | $82,553 |
| Total | 58,646 (100.0%) | $174,506 |
Poverty in Sunnyvale
Income Below Poverty by Sex and Age in Sunnyvale
With 4.4% poverty level for males and 6.2% for females among the residents of Sunnyvale, 15 year old males and 75 year old and over females are the most vulnerable to poverty, with 85 males (12.8%) and 792 females (15.7%) in their respective age groups living below the poverty level.
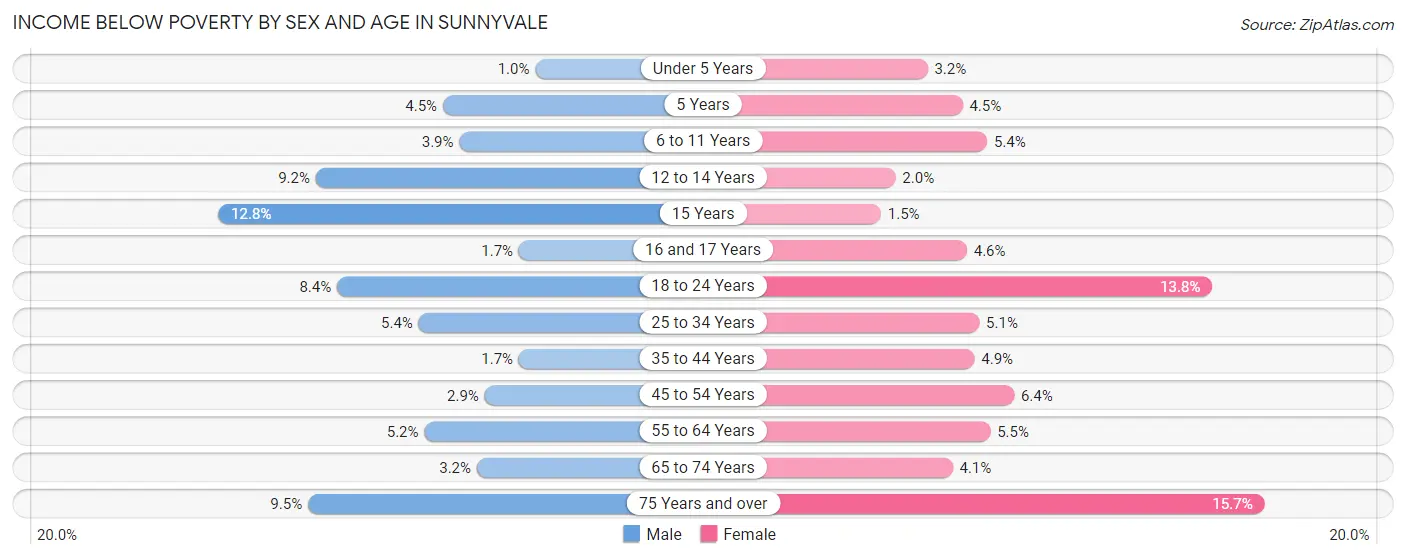
| Age Bracket | Male | Female |
| Under 5 Years | 59 (1.0%) | 145 (3.2%) |
| 5 Years | 44 (4.5%) | 43 (4.5%) |
| 6 to 11 Years | 177 (3.9%) | 265 (5.4%) |
| 12 to 14 Years | 240 (9.2%) | 45 (2.0%) |
| 15 Years | 85 (12.8%) | 7 (1.5%) |
| 16 and 17 Years | 23 (1.7%) | 71 (4.6%) |
| 18 to 24 Years | 447 (8.4%) | 657 (13.8%) |
| 25 to 34 Years | 1,069 (5.4%) | 829 (5.1%) |
| 35 to 44 Years | 220 (1.7%) | 526 (4.9%) |
| 45 to 54 Years | 268 (2.9%) | 561 (6.4%) |
| 55 to 64 Years | 432 (5.2%) | 422 (5.5%) |
| 65 to 74 Years | 149 (3.2%) | 226 (4.1%) |
| 75 Years and over | 348 (9.5%) | 792 (15.7%) |
| Total | 3,561 (4.4%) | 4,589 (6.2%) |
Income Above Poverty by Sex and Age in Sunnyvale
According to the poverty statistics in Sunnyvale, males aged under 5 years and females aged 15 years are the age groups that are most secure financially, with 99.0% of males and 98.6% of females in these age groups living above the poverty line.
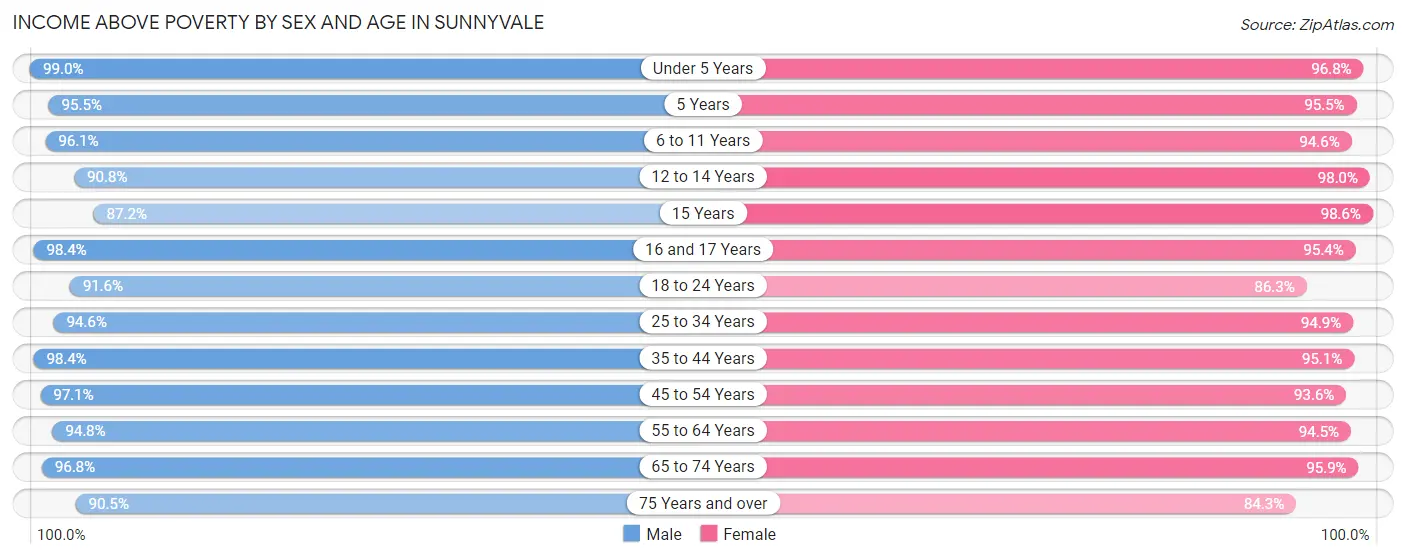
| Age Bracket | Male | Female |
| Under 5 Years | 5,622 (99.0%) | 4,410 (96.8%) |
| 5 Years | 941 (95.5%) | 917 (95.5%) |
| 6 to 11 Years | 4,413 (96.1%) | 4,653 (94.6%) |
| 12 to 14 Years | 2,371 (90.8%) | 2,214 (98.0%) |
| 15 Years | 578 (87.2%) | 476 (98.6%) |
| 16 and 17 Years | 1,368 (98.4%) | 1,458 (95.4%) |
| 18 to 24 Years | 4,873 (91.6%) | 4,120 (86.3%) |
| 25 to 34 Years | 18,856 (94.6%) | 15,441 (94.9%) |
| 35 to 44 Years | 13,101 (98.4%) | 10,159 (95.1%) |
| 45 to 54 Years | 8,897 (97.1%) | 8,224 (93.6%) |
| 55 to 64 Years | 7,940 (94.8%) | 7,236 (94.5%) |
| 65 to 74 Years | 4,487 (96.8%) | 5,273 (95.9%) |
| 75 Years and over | 3,321 (90.5%) | 4,255 (84.3%) |
| Total | 76,768 (95.6%) | 68,836 (93.8%) |
Income Below Poverty Among Married-Couple Families in Sunnyvale
The poverty statistics for married-couple families in Sunnyvale show that 1.9% or 589 of the total 31,026 families live below the poverty line. Families with 3 or 4 children have the highest poverty rate of 2.5%, comprising of 34 families. On the other hand, families with 5 or more children have the lowest poverty rate of 0.0%, which includes 0 families.
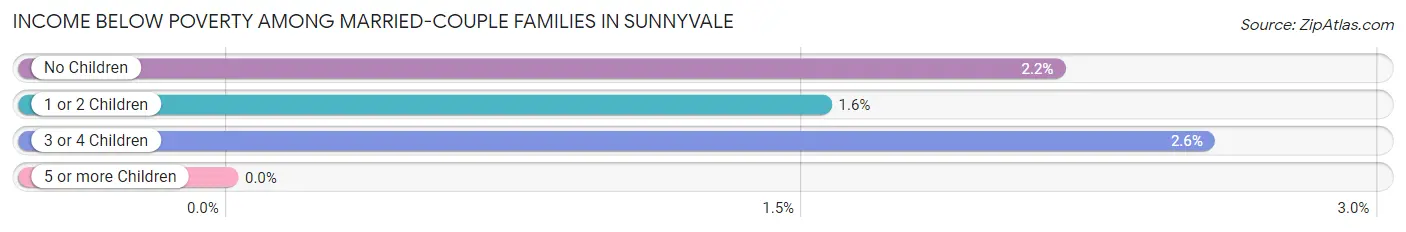
| Children | Above Poverty | Below Poverty |
| No Children | 15,293 (97.8%) | 337 (2.2%) |
| 1 or 2 Children | 13,829 (98.5%) | 218 (1.5%) |
| 3 or 4 Children | 1,298 (97.5%) | 34 (2.5%) |
| 5 or more Children | 17 (100.0%) | 0 (0.0%) |
| Total | 30,437 (98.1%) | 589 (1.9%) |
Income Below Poverty Among Single-Parent Households in Sunnyvale
According to the poverty data in Sunnyvale, 3.1% or 72 single-father households and 13.2% or 577 single-mother households are living below the poverty line. Among single-father households, those with 3 or 4 children have the highest poverty rate, with 16 households (8.6%) experiencing poverty. Likewise, among single-mother households, those with 1 or 2 children have the highest poverty rate, with 420 households (24.5%) falling below the poverty line.
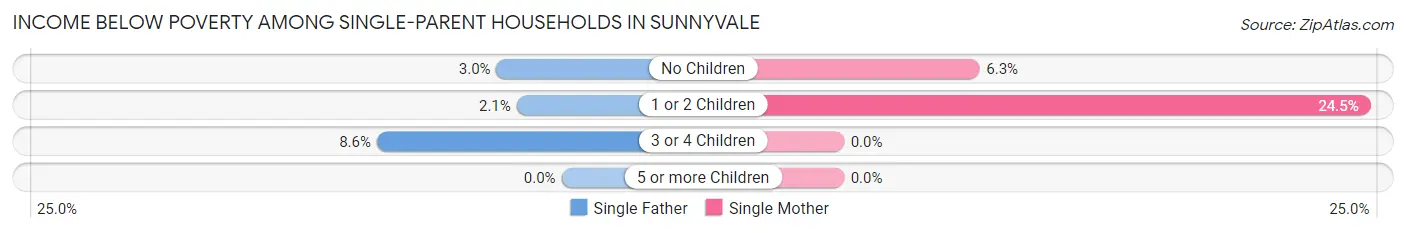
| Children | Single Father | Single Mother |
| No Children | 38 (3.0%) | 157 (6.3%) |
| 1 or 2 Children | 18 (2.1%) | 420 (24.5%) |
| 3 or 4 Children | 16 (8.6%) | 0 (0.0%) |
| 5 or more Children | 0 (0.0%) | 0 (0.0%) |
| Total | 72 (3.1%) | 577 (13.2%) |
Income Below Poverty Among Married-Couple vs Single-Parent Households in Sunnyvale
The poverty data for Sunnyvale shows that 589 of the married-couple family households (1.9%) and 649 of the single-parent households (9.7%) are living below the poverty level. Within the married-couple family households, those with 3 or 4 children have the highest poverty rate, with 34 households (2.5%) falling below the poverty line. Among the single-parent households, those with 1 or 2 children have the highest poverty rate, with 438 household (17.0%) living below poverty.
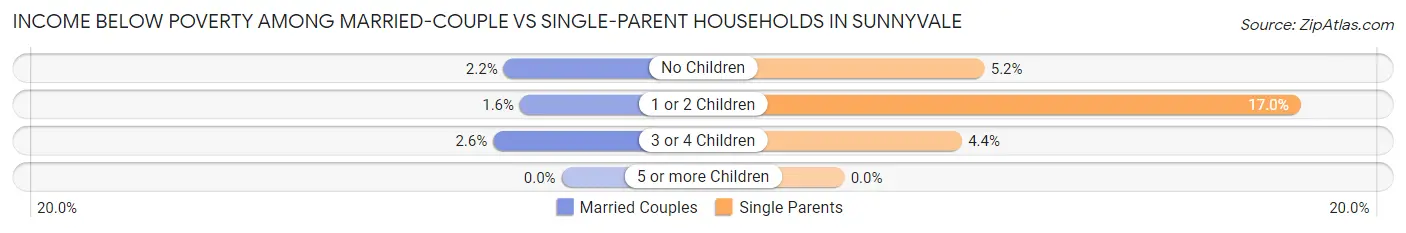
| Children | Married-Couple Families | Single-Parent Households |
| No Children | 337 (2.2%) | 195 (5.2%) |
| 1 or 2 Children | 218 (1.5%) | 438 (17.0%) |
| 3 or 4 Children | 34 (2.5%) | 16 (4.4%) |
| 5 or more Children | 0 (0.0%) | 0 (0.0%) |
| Total | 589 (1.9%) | 649 (9.7%) |
Race in Sunnyvale
The most populous races in Sunnyvale are Asian (76,656 | 49.6%), White / Caucasian (48,824 | 31.6%), and Hispanic or Latino (25,795 | 16.7%).
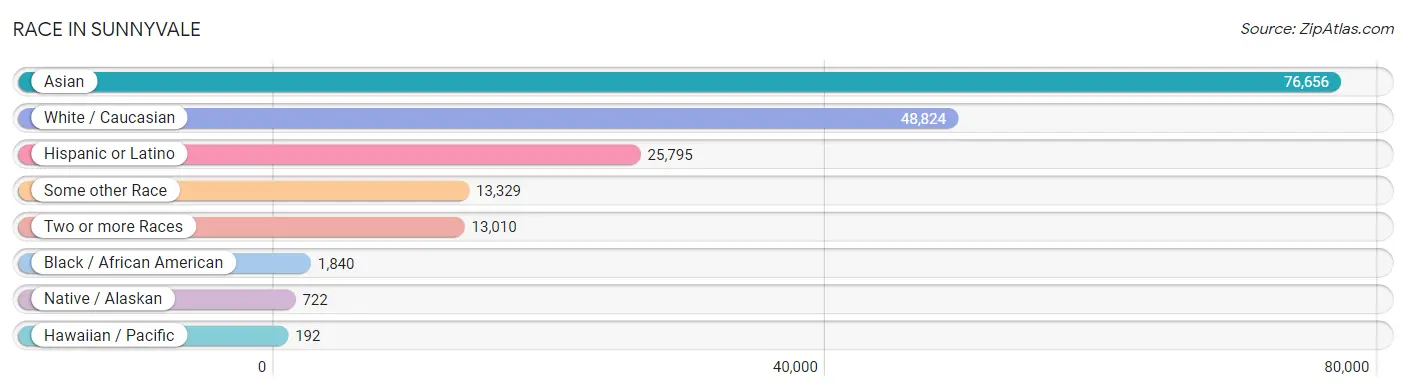
| Race | # Population | % Population |
| Asian | 76,656 | 49.6% |
| Black / African American | 1,840 | 1.2% |
| Hawaiian / Pacific | 192 | 0.1% |
| Hispanic or Latino | 25,795 | 16.7% |
| Native / Alaskan | 722 | 0.5% |
| White / Caucasian | 48,824 | 31.6% |
| Two or more Races | 13,010 | 8.4% |
| Some other Race | 13,329 | 8.6% |
| Total | 154,573 | 100.0% |
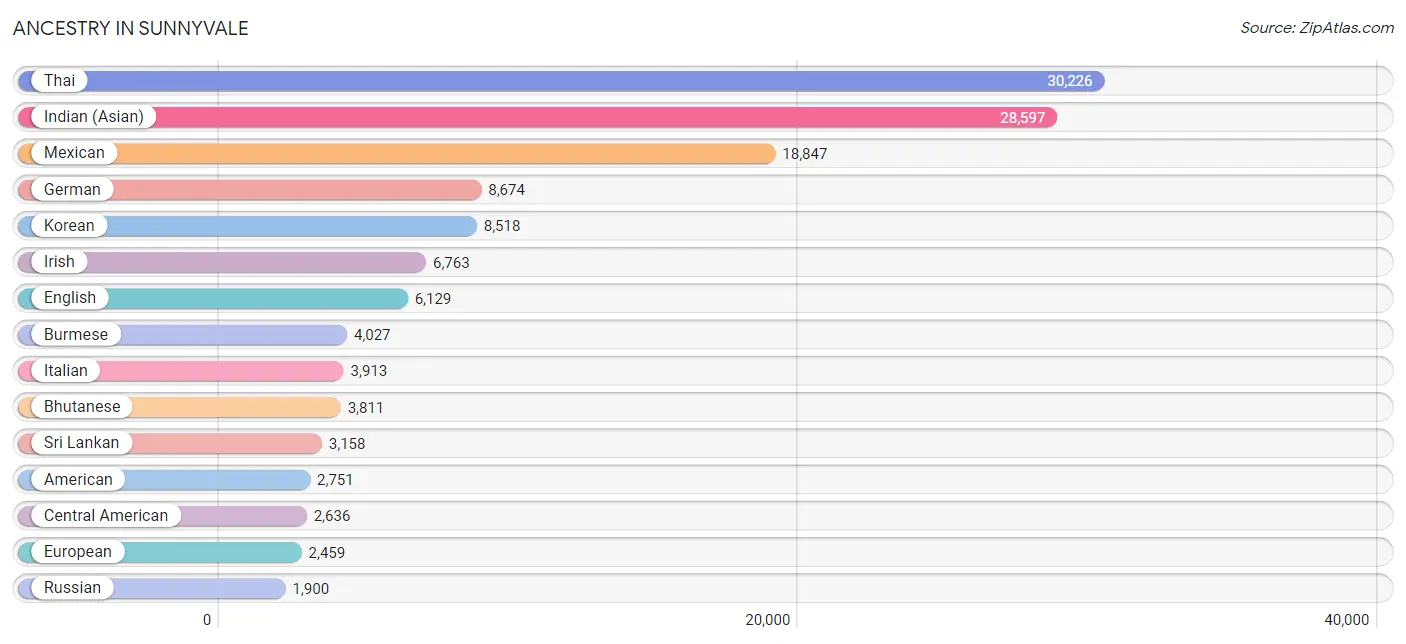
Ancestry in Sunnyvale
The most populous ancestries reported in Sunnyvale are Thai (30,226 | 19.6%), Indian (Asian) (28,597 | 18.5%), Mexican (18,847 | 12.2%), German (8,674 | 5.6%), and Korean (8,518 | 5.5%), together accounting for 61.4% of all Sunnyvale residents.
| Ancestry | # Population | % Population |
| Afghan | 77 | 0.1% |
| African | 147 | 0.1% |
| Alaska Native | 13 | 0.0% |
| Albanian | 50 | 0.0% |
| American | 2,751 | 1.8% |
| Apache | 15 | 0.0% |
| Arab | 893 | 0.6% |
| Argentinean | 246 | 0.2% |
| Armenian | 326 | 0.2% |
| Assyrian / Chaldean / Syriac | 71 | 0.1% |
| Australian | 48 | 0.0% |
| Austrian | 650 | 0.4% |
| Bangladeshi | 43 | 0.0% |
| Basque | 13 | 0.0% |
| Belgian | 44 | 0.0% |
| Bhutanese | 3,811 | 2.5% |
| Bolivian | 36 | 0.0% |
| Brazilian | 382 | 0.3% |
| British | 1,163 | 0.7% |
| Bulgarian | 153 | 0.1% |
| Burmese | 4,027 | 2.6% |
| Canadian | 435 | 0.3% |
| Cape Verdean | 16 | 0.0% |
| Celtic | 6 | 0.0% |
| Central American | 2,636 | 1.7% |
| Central American Indian | 72 | 0.1% |
| Cherokee | 229 | 0.2% |
| Chickasaw | 12 | 0.0% |
| Chilean | 51 | 0.0% |
| Choctaw | 54 | 0.0% |
| Colombian | 481 | 0.3% |
| Costa Rican | 55 | 0.0% |
| Creek | 23 | 0.0% |
| Croatian | 91 | 0.1% |
| Cuban | 401 | 0.3% |
| Czech | 389 | 0.3% |
| Czechoslovakian | 10 | 0.0% |
| Danish | 335 | 0.2% |
| Dominican | 5 | 0.0% |
| Dutch | 551 | 0.4% |
| Eastern European | 644 | 0.4% |
| Ecuadorian | 55 | 0.0% |
| Egyptian | 31 | 0.0% |
| English | 6,129 | 4.0% |
| Ethiopian | 28 | 0.0% |
| European | 2,459 | 1.6% |
| Filipino | 1,848 | 1.2% |
| Finnish | 166 | 0.1% |
| French | 1,874 | 1.2% |
| French American Indian | 11 | 0.0% |
| French Canadian | 389 | 0.3% |
| German | 8,674 | 5.6% |
| Greek | 333 | 0.2% |
| Guamanian / Chamorro | 50 | 0.0% |
| Guatemalan | 1,032 | 0.7% |
| Guyanese | 77 | 0.1% |
| Haitian | 24 | 0.0% |
| Honduran | 82 | 0.1% |
| Hungarian | 505 | 0.3% |
| Indian (Asian) | 28,597 | 18.5% |
| Indonesian | 210 | 0.1% |
| Iranian | 1,082 | 0.7% |
| Iraqi | 180 | 0.1% |
| Irish | 6,763 | 4.4% |
| Israeli | 1,287 | 0.8% |
| Italian | 3,913 | 2.5% |
| Jamaican | 52 | 0.0% |
| Japanese | 257 | 0.2% |
| Jordanian | 224 | 0.1% |
| Kenyan | 22 | 0.0% |
| Korean | 8,518 | 5.5% |
| Laotian | 242 | 0.2% |
| Latvian | 115 | 0.1% |
| Lebanese | 222 | 0.1% |
| Lithuanian | 135 | 0.1% |
| Lumbee | 19 | 0.0% |
| Luxembourger | 5 | 0.0% |
| Macedonian | 17 | 0.0% |
| Malaysian | 150 | 0.1% |
| Maltese | 21 | 0.0% |
| Mexican | 18,847 | 12.2% |
| Mexican American Indian | 404 | 0.3% |
| Mongolian | 86 | 0.1% |
| Moroccan | 84 | 0.1% |
| Native Hawaiian | 133 | 0.1% |
| Navajo | 67 | 0.0% |
| Nicaraguan | 79 | 0.1% |
| Nigerian | 331 | 0.2% |
| Northern European | 336 | 0.2% |
| Norwegian | 677 | 0.4% |
| Okinawan | 75 | 0.1% |
| Pakistani | 263 | 0.2% |
| Palestinian | 42 | 0.0% |
| Pennsylvania German | 8 | 0.0% |
| Peruvian | 743 | 0.5% |
| Polish | 1,622 | 1.1% |
| Portuguese | 808 | 0.5% |
| Potawatomi | 13 | 0.0% |
| Puerto Rican | 622 | 0.4% |
| Romanian | 493 | 0.3% |
| Russian | 1,900 | 1.2% |
| Salvadoran | 1,388 | 0.9% |
| Samoan | 126 | 0.1% |
| Scandinavian | 399 | 0.3% |
| Scotch-Irish | 414 | 0.3% |
| Scottish | 969 | 0.6% |
| Serbian | 41 | 0.0% |
| Sioux | 32 | 0.0% |
| Slavic | 57 | 0.0% |
| Slovak | 54 | 0.0% |
| Slovene | 80 | 0.1% |
| Somali | 25 | 0.0% |
| South American | 1,803 | 1.2% |
| South American Indian | 191 | 0.1% |
| Spaniard | 588 | 0.4% |
| Spanish | 320 | 0.2% |
| Spanish American Indian | 20 | 0.0% |
| Sri Lankan | 3,158 | 2.0% |
| Subsaharan African | 620 | 0.4% |
| Sudanese | 17 | 0.0% |
| Swedish | 1,284 | 0.8% |
| Swiss | 610 | 0.4% |
| Syrian | 28 | 0.0% |
| Taiwanese | 23 | 0.0% |
| Thai | 30,226 | 19.6% |
| Tongan | 37 | 0.0% |
| Trinidadian and Tobagonian | 63 | 0.0% |
| Tsimshian | 9 | 0.0% |
| Turkish | 306 | 0.2% |
| Ukrainian | 736 | 0.5% |
| Venezuelan | 115 | 0.1% |
| Vietnamese | 147 | 0.1% |
| Welsh | 474 | 0.3% |
| Yaqui | 4 | 0.0% |
| Yugoslavian | 106 | 0.1% |
| Yuman | 14 | 0.0% |
| Zimbabwean | 14 | 0.0% | View All 137 Rows |
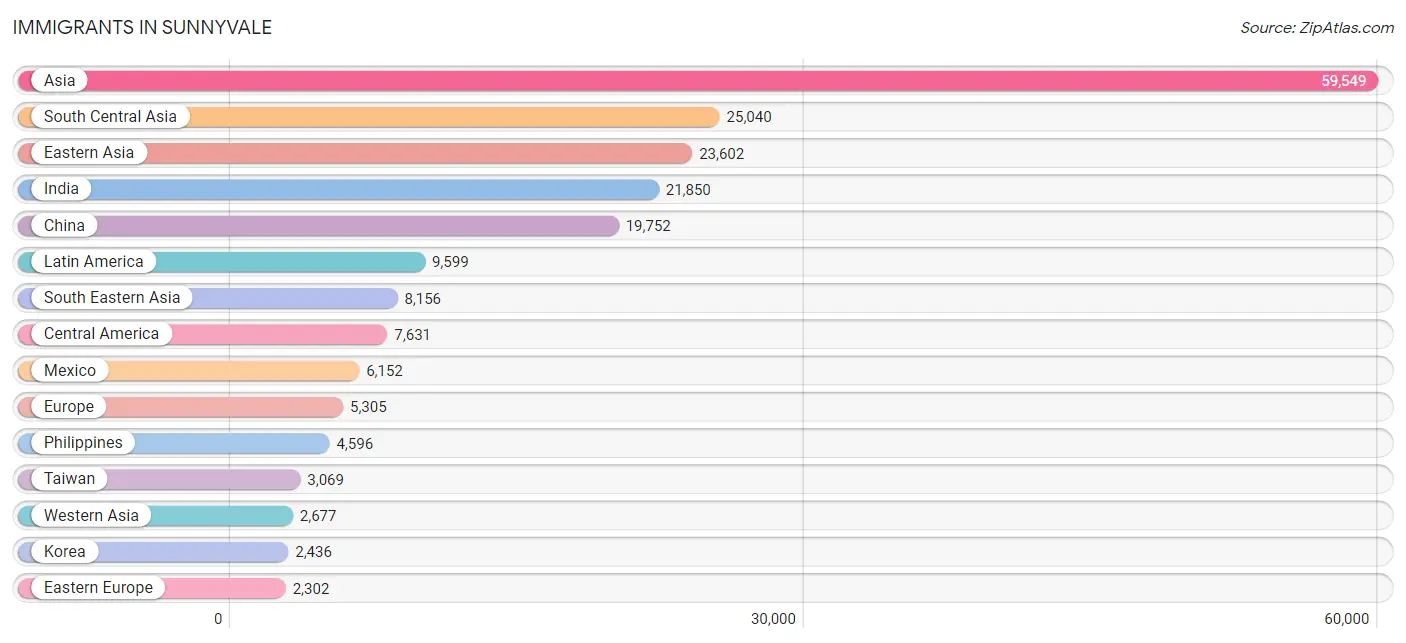
Immigrants in Sunnyvale
The most numerous immigrant groups reported in Sunnyvale came from Asia (59,549 | 38.5%), South Central Asia (25,040 | 16.2%), Eastern Asia (23,602 | 15.3%), India (21,850 | 14.1%), and China (19,752 | 12.8%), together accounting for 96.9% of all Sunnyvale residents.
| Immigration Origin | # Population | % Population |
| Afghanistan | 34 | 0.0% |
| Africa | 404 | 0.3% |
| Albania | 10 | 0.0% |
| Argentina | 207 | 0.1% |
| Armenia | 68 | 0.0% |
| Asia | 59,549 | 38.5% |
| Australia | 90 | 0.1% |
| Austria | 107 | 0.1% |
| Bangladesh | 330 | 0.2% |
| Belarus | 263 | 0.2% |
| Belgium | 12 | 0.0% |
| Bolivia | 65 | 0.0% |
| Bosnia and Herzegovina | 48 | 0.0% |
| Brazil | 395 | 0.3% |
| Bulgaria | 94 | 0.1% |
| Cambodia | 104 | 0.1% |
| Canada | 1,321 | 0.9% |
| Caribbean | 194 | 0.1% |
| Central America | 7,631 | 4.9% |
| Chile | 56 | 0.0% |
| China | 19,752 | 12.8% |
| Colombia | 389 | 0.3% |
| Croatia | 46 | 0.0% |
| Cuba | 121 | 0.1% |
| Czechoslovakia | 33 | 0.0% |
| Denmark | 42 | 0.0% |
| Eastern Africa | 151 | 0.1% |
| Eastern Asia | 23,602 | 15.3% |
| Eastern Europe | 2,302 | 1.5% |
| Ecuador | 7 | 0.0% |
| Egypt | 59 | 0.0% |
| El Salvador | 932 | 0.6% |
| England | 255 | 0.2% |
| Ethiopia | 15 | 0.0% |
| Europe | 5,305 | 3.4% |
| France | 429 | 0.3% |
| Germany | 536 | 0.4% |
| Greece | 89 | 0.1% |
| Grenada | 9 | 0.0% |
| Guatemala | 386 | 0.3% |
| Guyana | 37 | 0.0% |
| Haiti | 7 | 0.0% |
| Honduras | 93 | 0.1% |
| Hong Kong | 1,023 | 0.7% |
| Hungary | 53 | 0.0% |
| India | 21,850 | 14.1% |
| Indonesia | 239 | 0.2% |
| Iran | 833 | 0.5% |
| Iraq | 127 | 0.1% |
| Ireland | 102 | 0.1% |
| Israel | 1,749 | 1.1% |
| Italy | 280 | 0.2% |
| Jamaica | 27 | 0.0% |
| Japan | 1,402 | 0.9% |
| Jordan | 120 | 0.1% |
| Kazakhstan | 30 | 0.0% |
| Kenya | 71 | 0.1% |
| Korea | 2,436 | 1.6% |
| Kuwait | 5 | 0.0% |
| Laos | 104 | 0.1% |
| Latin America | 9,599 | 6.2% |
| Latvia | 31 | 0.0% |
| Lebanon | 44 | 0.0% |
| Malaysia | 558 | 0.4% |
| Mexico | 6,152 | 4.0% |
| Moldova | 39 | 0.0% |
| Nepal | 878 | 0.6% |
| Netherlands | 85 | 0.1% |
| Nicaragua | 68 | 0.0% |
| Nigeria | 77 | 0.1% |
| North Macedonia | 17 | 0.0% |
| Northern Africa | 76 | 0.1% |
| Northern Europe | 967 | 0.6% |
| Norway | 10 | 0.0% |
| Oceania | 122 | 0.1% |
| Pakistan | 404 | 0.3% |
| Peru | 389 | 0.3% |
| Philippines | 4,596 | 3.0% |
| Poland | 138 | 0.1% |
| Portugal | 66 | 0.0% |
| Romania | 207 | 0.1% |
| Russia | 855 | 0.5% |
| Saudi Arabia | 108 | 0.1% |
| Scotland | 22 | 0.0% |
| Serbia | 8 | 0.0% |
| Sierra Leone | 17 | 0.0% |
| Singapore | 156 | 0.1% |
| Somalia | 25 | 0.0% |
| South Africa | 67 | 0.0% |
| South America | 1,774 | 1.1% |
| South Central Asia | 25,040 | 16.2% |
| South Eastern Asia | 8,156 | 5.3% |
| Southern Europe | 537 | 0.4% |
| Spain | 102 | 0.1% |
| Sri Lanka | 429 | 0.3% |
| Sudan | 17 | 0.0% |
| Sweden | 128 | 0.1% |
| Switzerland | 272 | 0.2% |
| Syria | 40 | 0.0% |
| Taiwan | 3,069 | 2.0% |
| Thailand | 242 | 0.2% |
| Trinidad and Tobago | 30 | 0.0% |
| Turkey | 192 | 0.1% |
| Uganda | 27 | 0.0% |
| Ukraine | 392 | 0.3% |
| Uzbekistan | 180 | 0.1% |
| Venezuela | 176 | 0.1% |
| Vietnam | 2,001 | 1.3% |
| Western Africa | 94 | 0.1% |
| Western Asia | 2,677 | 1.7% |
| Western Europe | 1,441 | 0.9% |
| Zimbabwe | 8 | 0.0% | View All 112 Rows |
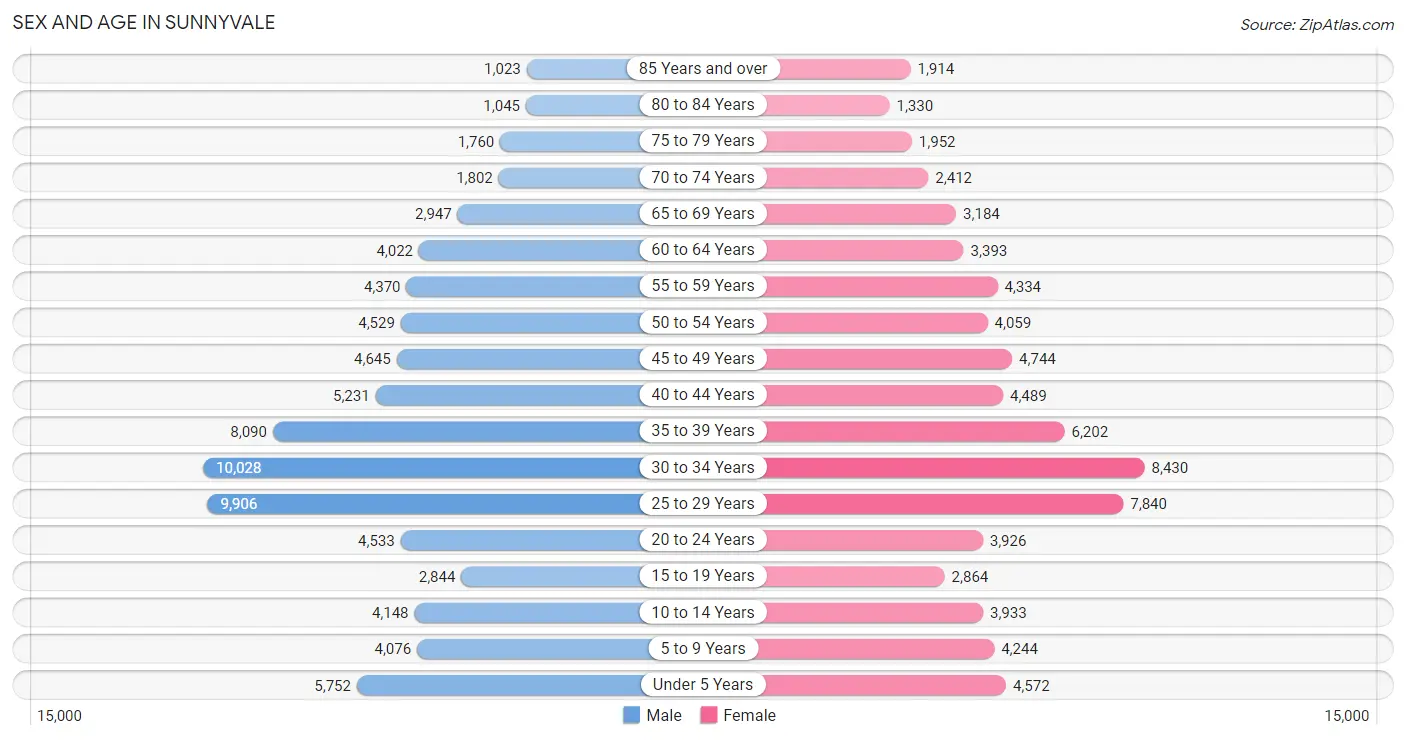
Sex and Age in Sunnyvale
Sex and Age in Sunnyvale
The most populous age groups in Sunnyvale are 30 to 34 Years (10,028 | 12.4%) for men and 30 to 34 Years (8,430 | 11.4%) for women.
| Age Bracket | Male | Female |
| Under 5 Years | 5,752 (7.1%) | 4,572 (6.2%) |
| 5 to 9 Years | 4,076 (5.1%) | 4,244 (5.8%) |
| 10 to 14 Years | 4,148 (5.1%) | 3,933 (5.3%) |
| 15 to 19 Years | 2,844 (3.5%) | 2,864 (3.9%) |
| 20 to 24 Years | 4,533 (5.6%) | 3,926 (5.3%) |
| 25 to 29 Years | 9,906 (12.3%) | 7,840 (10.6%) |
| 30 to 34 Years | 10,028 (12.4%) | 8,430 (11.4%) |
| 35 to 39 Years | 8,090 (10.0%) | 6,202 (8.4%) |
| 40 to 44 Years | 5,231 (6.5%) | 4,489 (6.1%) |
| 45 to 49 Years | 4,645 (5.8%) | 4,744 (6.4%) |
| 50 to 54 Years | 4,529 (5.6%) | 4,059 (5.5%) |
| 55 to 59 Years | 4,370 (5.4%) | 4,334 (5.9%) |
| 60 to 64 Years | 4,022 (5.0%) | 3,393 (4.6%) |
| 65 to 69 Years | 2,947 (3.6%) | 3,184 (4.3%) |
| 70 to 74 Years | 1,802 (2.2%) | 2,412 (3.3%) |
| 75 to 79 Years | 1,760 (2.2%) | 1,952 (2.6%) |
| 80 to 84 Years | 1,045 (1.3%) | 1,330 (1.8%) |
| 85 Years and over | 1,023 (1.3%) | 1,914 (2.6%) |
| Total | 80,751 (100.0%) | 73,822 (100.0%) |
Families and Households in Sunnyvale
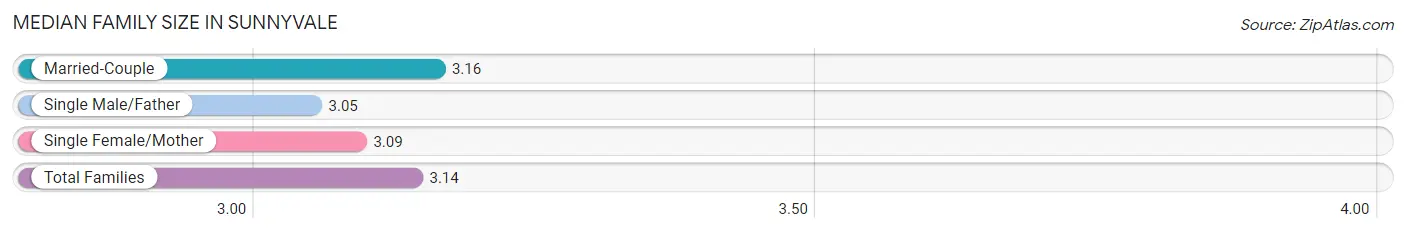
Median Family Size in Sunnyvale
The median family size in Sunnyvale is 3.14 persons per family, with married-couple families (31,026 | 82.3%) accounting for the largest median family size of 3.16 persons per family. On the other hand, single male/father families (2,302 | 6.1%) represent the smallest median family size with 3.05 persons per family.
| Family Type | # Families | Family Size |
| Married-Couple | 31,026 (82.3%) | 3.16 |
| Single Male/Father | 2,302 (6.1%) | 3.05 |
| Single Female/Mother | 4,374 (11.6%) | 3.09 |
| Total Families | 37,702 (100.0%) | 3.14 |
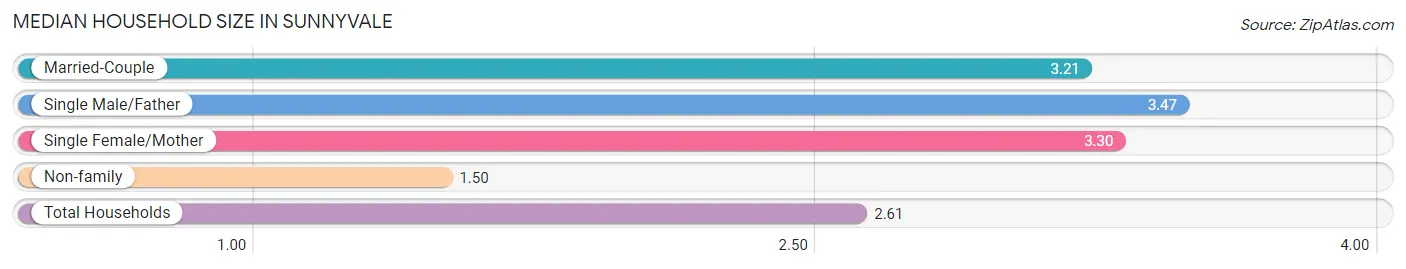
Median Household Size in Sunnyvale
The median household size in Sunnyvale is 2.61 persons per household, with single male/father households (2,302 | 3.9%) accounting for the largest median household size of 3.47 persons per household. non-family households (20,944 | 35.7%) represent the smallest median household size with 1.50 persons per household.
| Household Type | # Households | Household Size |
| Married-Couple | 31,026 (52.9%) | 3.21 |
| Single Male/Father | 2,302 (3.9%) | 3.47 |
| Single Female/Mother | 4,374 (7.5%) | 3.30 |
| Non-family | 20,944 (35.7%) | 1.50 |
| Total Households | 58,646 (100.0%) | 2.61 |
Household Size by Marriage Status in Sunnyvale
Out of a total of 58,646 households in Sunnyvale, 37,702 (64.3%) are family households, while 20,944 (35.7%) are nonfamily households. The most numerous type of family households are 2-person households, comprising 13,858, and the most common type of nonfamily households are 1-person households, comprising 13,638.
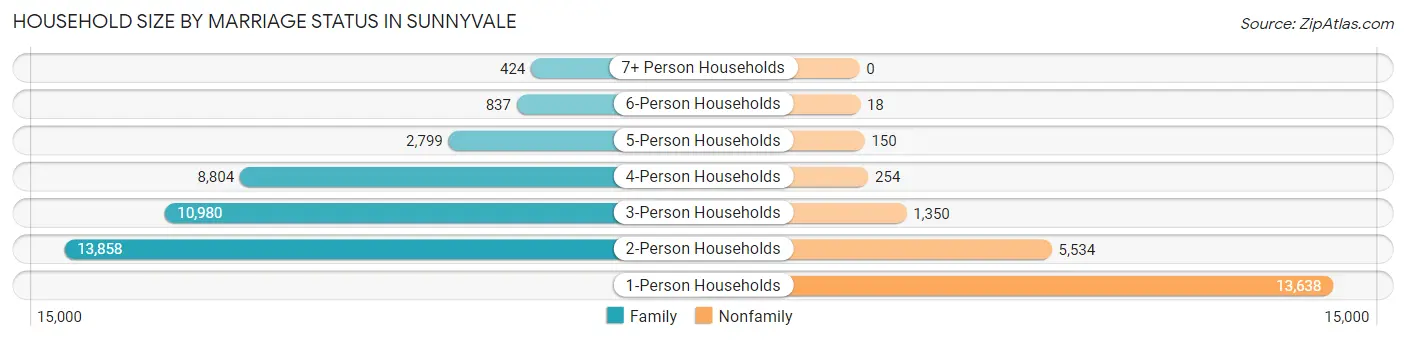
| Household Size | Family Households | Nonfamily Households |
| 1-Person Households | - | 13,638 (23.3%) |
| 2-Person Households | 13,858 (23.6%) | 5,534 (9.4%) |
| 3-Person Households | 10,980 (18.7%) | 1,350 (2.3%) |
| 4-Person Households | 8,804 (15.0%) | 254 (0.4%) |
| 5-Person Households | 2,799 (4.8%) | 150 (0.3%) |
| 6-Person Households | 837 (1.4%) | 18 (0.0%) |
| 7+ Person Households | 424 (0.7%) | 0 (0.0%) |
| Total | 37,702 (64.3%) | 20,944 (35.7%) |
Female Fertility in Sunnyvale
Fertility by Age in Sunnyvale
Average fertility rate in Sunnyvale is 54.0 births per 1,000 women. Women in the age bracket of 20 to 34 years have the highest fertility rate with 66.0 births per 1,000 women. Women in the age bracket of 20 to 34 years acount for 63.4% of all women with births.
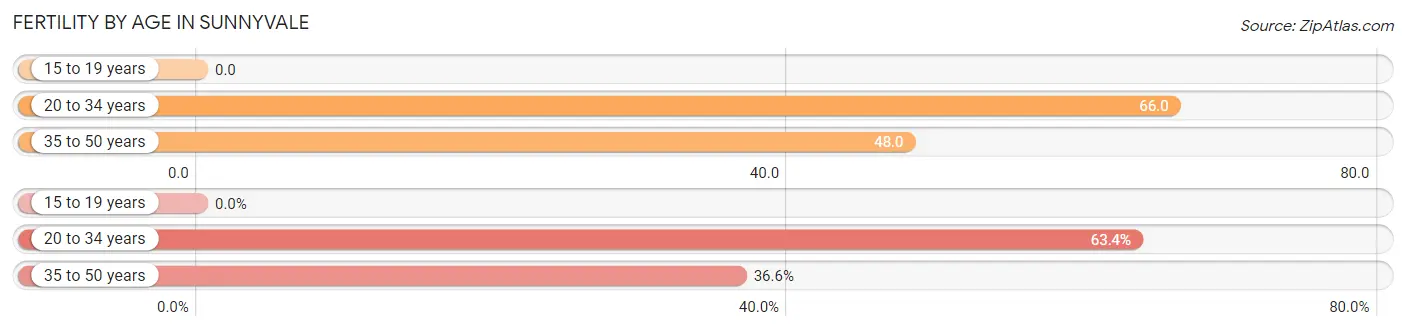
| Age Bracket | Women with Births | Births / 1,000 Women |
| 15 to 19 years | 0 (0.0%) | 0.0 |
| 20 to 34 years | 1,331 (63.4%) | 66.0 |
| 35 to 50 years | 767 (36.6%) | 48.0 |
| Total | 2,098 (100.0%) | 54.0 |
Fertility by Age by Marriage Status in Sunnyvale
85.8% of women with births (2,098) in Sunnyvale are married. The highest percentage of unmarried women with births falls into 35 to 50 years age bracket with 18.6% of them unmarried at the time of birth, while the lowest percentage of unmarried women with births belong to 20 to 34 years age bracket with 11.6% of them unmarried.
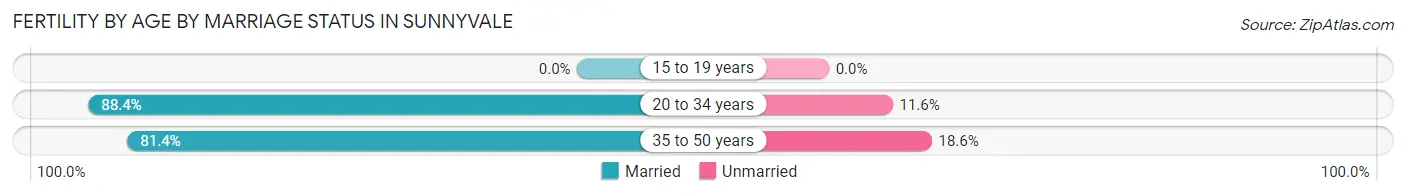
| Age Bracket | Married | Unmarried |
| 15 to 19 years | 0 (0.0%) | 0 (0.0%) |
| 20 to 34 years | 1,177 (88.4%) | 154 (11.6%) |
| 35 to 50 years | 624 (81.4%) | 143 (18.6%) |
| Total | 1,800 (85.8%) | 298 (14.2%) |
Fertility by Education in Sunnyvale
Average fertility rate in Sunnyvale is 54.0 births per 1,000 women. Women with the education attainment of college or associate's degree have the highest fertility rate of 69.0 births per 1,000 women, while women with the education attainment of less than high school have the lowest fertility at 7.0 births per 1,000 women. Women with the education attainment of graduate degree represent 45.3% of all women with births.
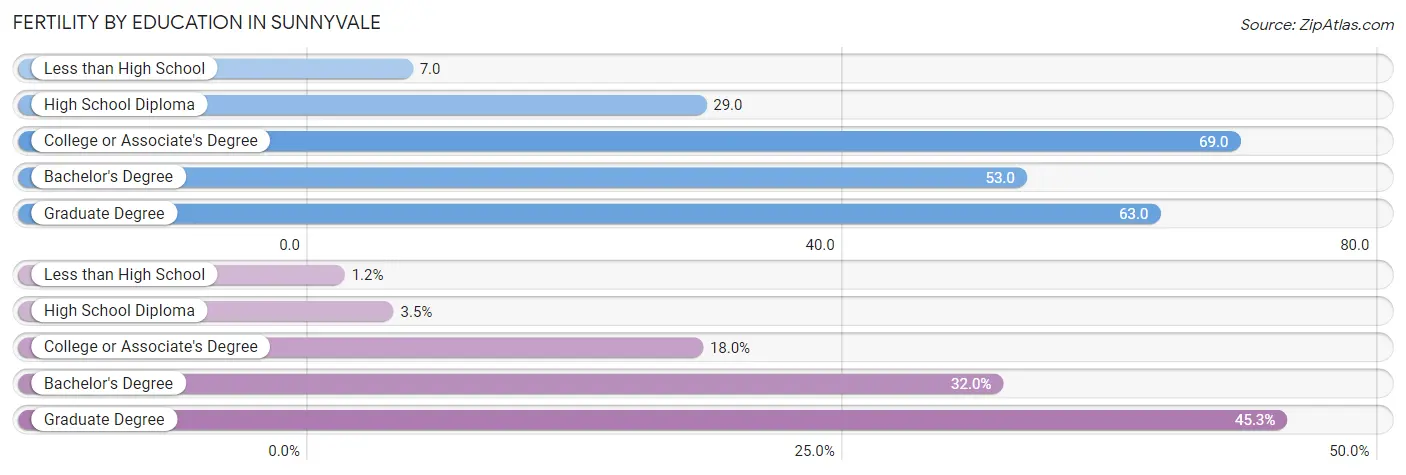
| Educational Attainment | Women with Births | Births / 1,000 Women |
| Less than High School | 25 (1.2%) | 7.0 |
| High School Diploma | 73 (3.5%) | 29.0 |
| College or Associate's Degree | 377 (18.0%) | 69.0 |
| Bachelor's Degree | 672 (32.0%) | 53.0 |
| Graduate Degree | 951 (45.3%) | 63.0 |
| Total | 2,098 (100.0%) | 54.0 |
Fertility by Education by Marriage Status in Sunnyvale
14.2% of women with births in Sunnyvale are unmarried. Women with the educational attainment of graduate degree are most likely to be married with 92.6% of them married at childbirth, while women with the educational attainment of college or associate's degree are least likely to be married with 29.4% of them unmarried at childbirth.
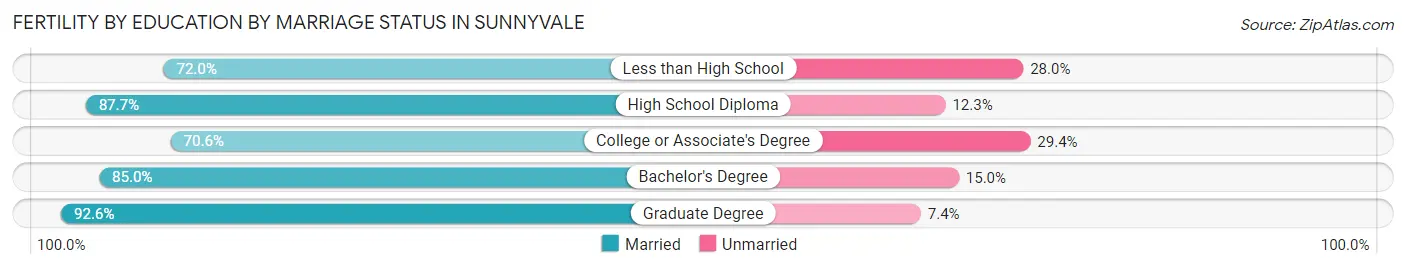
| Educational Attainment | Married | Unmarried |
| Less than High School | 18 (72.0%) | 7 (28.0%) |
| High School Diploma | 64 (87.7%) | 9 (12.3%) |
| College or Associate's Degree | 266 (70.6%) | 111 (29.4%) |
| Bachelor's Degree | 571 (85.0%) | 101 (15.0%) |
| Graduate Degree | 881 (92.6%) | 70 (7.4%) |
| Total | 1,800 (85.8%) | 298 (14.2%) |
Employment Characteristics in Sunnyvale
Employment by Class of Employer in Sunnyvale
Among the 85,803 employed individuals in Sunnyvale, private company employees (70,045 | 81.6%), not-for-profit organizations (4,995 | 5.8%), and local government employees (3,296 | 3.8%) make up the most common classes of employment.
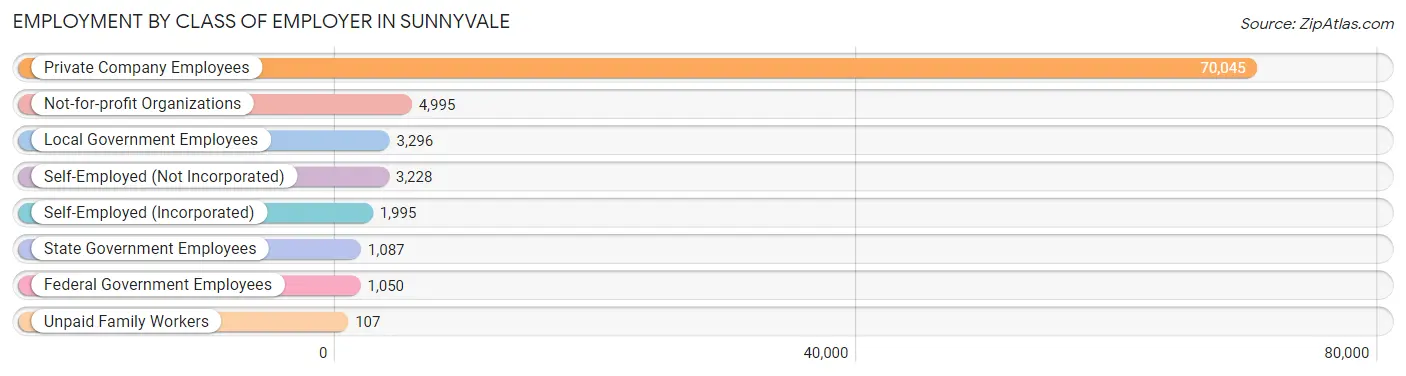
| Employer Class | # Employees | % Employees |
| Private Company Employees | 70,045 | 81.6% |
| Self-Employed (Incorporated) | 1,995 | 2.3% |
| Self-Employed (Not Incorporated) | 3,228 | 3.8% |
| Not-for-profit Organizations | 4,995 | 5.8% |
| Local Government Employees | 3,296 | 3.8% |
| State Government Employees | 1,087 | 1.3% |
| Federal Government Employees | 1,050 | 1.2% |
| Unpaid Family Workers | 107 | 0.1% |
| Total | 85,803 | 100.0% |
Employment Status by Age in Sunnyvale
According to the labor force statistics for Sunnyvale, out of the total population over 16 years of age (126,701), 71.8% or 90,971 individuals are in the labor force, with 4.1% or 3,730 of them unemployed. The age group with the highest labor force participation rate is 25 to 29 years, with 88.2% or 15,652 individuals in the labor force. Within the labor force, the 20 to 24 years age range has the highest percentage of unemployed individuals, with 10.8% or 699 of them being unemployed.
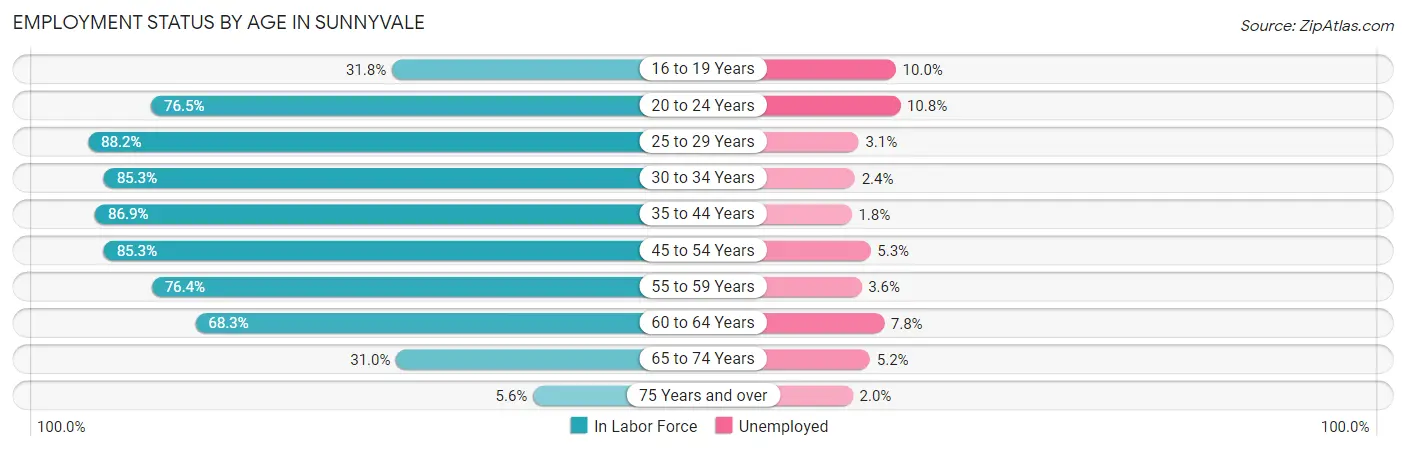
| Age Bracket | In Labor Force | Unemployed |
| 16 to 19 Years | 1,450 (31.8%) | 145 (10.0%) |
| 20 to 24 Years | 6,471 (76.5%) | 699 (10.8%) |
| 25 to 29 Years | 15,652 (88.2%) | 485 (3.1%) |
| 30 to 34 Years | 15,745 (85.3%) | 378 (2.4%) |
| 35 to 44 Years | 20,866 (86.9%) | 376 (1.8%) |
| 45 to 54 Years | 15,334 (85.3%) | 813 (5.3%) |
| 55 to 59 Years | 6,650 (76.4%) | 239 (3.6%) |
| 60 to 64 Years | 5,064 (68.3%) | 395 (7.8%) |
| 65 to 74 Years | 3,207 (31.0%) | 167 (5.2%) |
| 75 Years and over | 505 (5.6%) | 10 (2.0%) |
| Total | 90,971 (71.8%) | 3,730 (4.1%) |
Employment Status by Educational Attainment in Sunnyvale
According to labor force statistics for Sunnyvale, 84.1% of individuals (79,316) out of the total population between 25 and 64 years of age (94,312) are in the labor force, with 3.4% or 2,697 of them being unemployed. The group with the highest labor force participation rate are those with the educational attainment of bachelor's degree or higher, with 86.1% or 59,406 individuals in the labor force. Within the labor force, individuals with college / associate degree education have the highest percentage of unemployment, with 6.3% or 672 of them being unemployed.
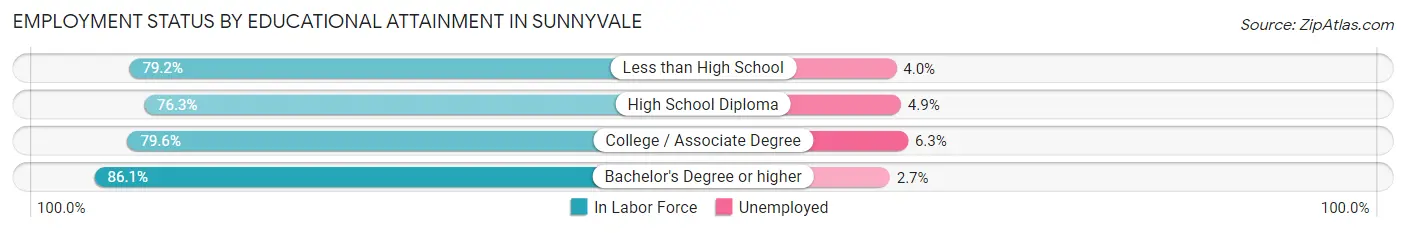
| Educational Attainment | In Labor Force | Unemployed |
| Less than High School | 3,593 (79.2%) | 181 (4.0%) |
| High School Diploma | 5,629 (76.3%) | 361 (4.9%) |
| College / Associate Degree | 10,668 (79.6%) | 844 (6.3%) |
| Bachelor's Degree or higher | 59,406 (86.1%) | 1,863 (2.7%) |
| Total | 79,316 (84.1%) | 3,207 (3.4%) |
Employment Occupations by Sex in Sunnyvale
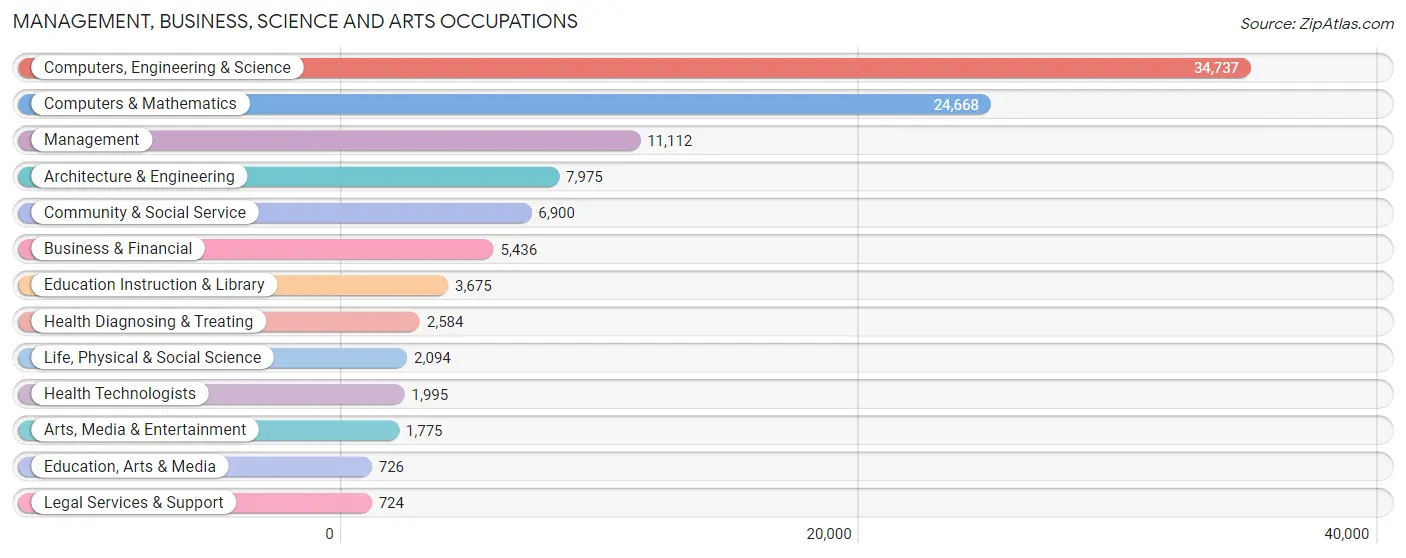
Management, Business, Science and Arts Occupations
The most common Management, Business, Science and Arts occupations in Sunnyvale are Computers, Engineering & Science (34,737 | 39.9%), Computers & Mathematics (24,668 | 28.3%), Management (11,112 | 12.8%), Architecture & Engineering (7,975 | 9.1%), and Community & Social Service (6,900 | 7.9%).
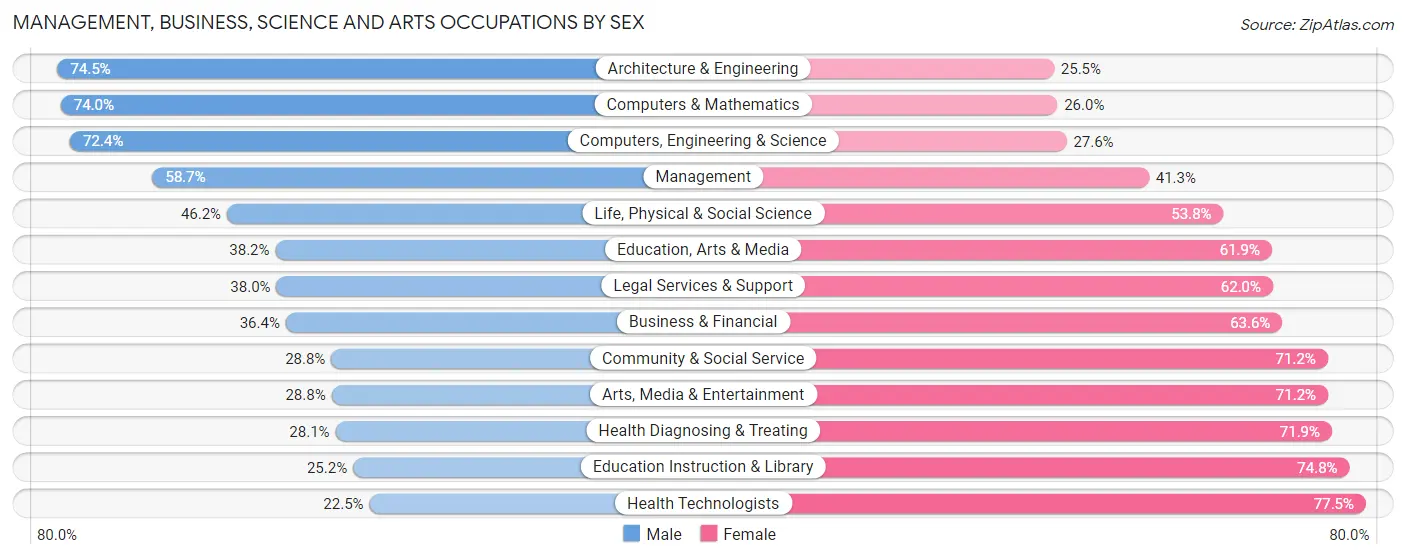
Management, Business, Science and Arts Occupations by Sex
Within the Management, Business, Science and Arts occupations in Sunnyvale, the most male-oriented occupations are Architecture & Engineering (74.5%), Computers & Mathematics (74.0%), and Computers, Engineering & Science (72.4%), while the most female-oriented occupations are Health Technologists (77.5%), Education Instruction & Library (74.8%), and Health Diagnosing & Treating (71.9%).
| Occupation | Male | Female |
| Management | 6,521 (58.7%) | 4,591 (41.3%) |
| Business & Financial | 1,980 (36.4%) | 3,456 (63.6%) |
| Computers, Engineering & Science | 25,155 (72.4%) | 9,582 (27.6%) |
| Computers & Mathematics | 18,244 (74.0%) | 6,424 (26.0%) |
| Architecture & Engineering | 5,943 (74.5%) | 2,032 (25.5%) |
| Life, Physical & Social Science | 968 (46.2%) | 1,126 (53.8%) |
| Community & Social Service | 1,989 (28.8%) | 4,911 (71.2%) |
| Education, Arts & Media | 277 (38.2%) | 449 (61.9%) |
| Legal Services & Support | 275 (38.0%) | 449 (62.0%) |
| Education Instruction & Library | 926 (25.2%) | 2,749 (74.8%) |
| Arts, Media & Entertainment | 511 (28.8%) | 1,264 (71.2%) |
| Health Diagnosing & Treating | 727 (28.1%) | 1,857 (71.9%) |
| Health Technologists | 448 (22.5%) | 1,547 (77.5%) |
| Total (Category) | 36,372 (59.9%) | 24,397 (40.2%) |
| Total (Overall) | 50,610 (58.1%) | 36,530 (41.9%) |
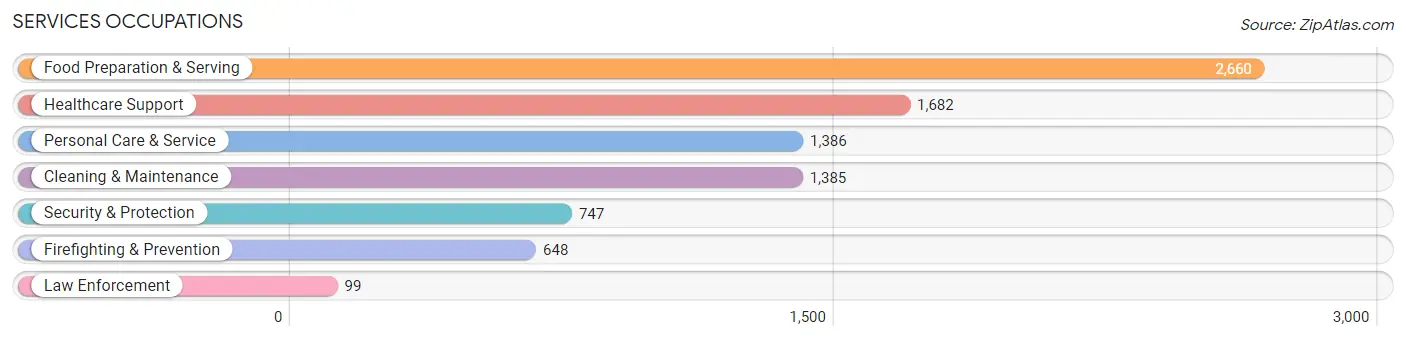
Services Occupations
The most common Services occupations in Sunnyvale are Food Preparation & Serving (2,660 | 3.0%), Healthcare Support (1,682 | 1.9%), Personal Care & Service (1,386 | 1.6%), Cleaning & Maintenance (1,385 | 1.6%), and Security & Protection (747 | 0.9%).
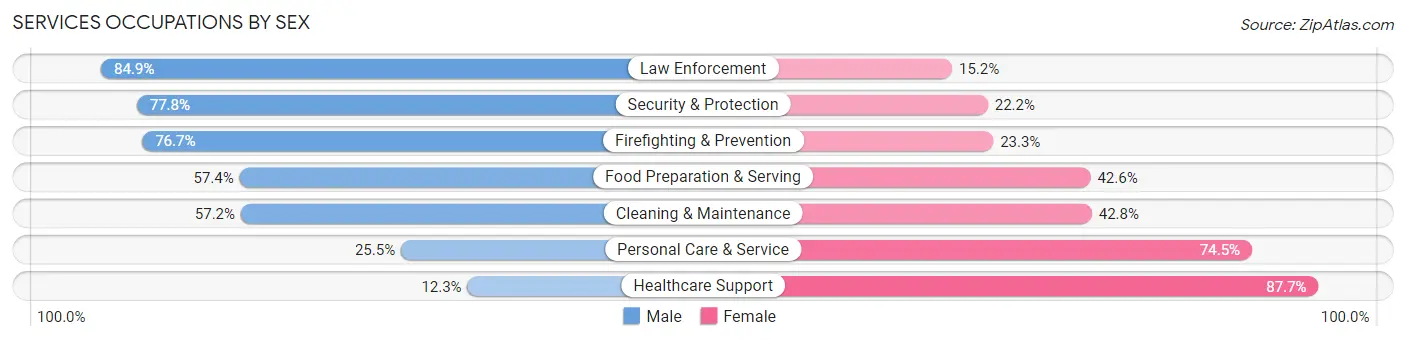
Services Occupations by Sex
Within the Services occupations in Sunnyvale, the most male-oriented occupations are Law Enforcement (84.9%), Security & Protection (77.8%), and Firefighting & Prevention (76.7%), while the most female-oriented occupations are Healthcare Support (87.7%), Personal Care & Service (74.5%), and Cleaning & Maintenance (42.8%).
| Occupation | Male | Female |
| Healthcare Support | 207 (12.3%) | 1,475 (87.7%) |
| Security & Protection | 581 (77.8%) | 166 (22.2%) |
| Firefighting & Prevention | 497 (76.7%) | 151 (23.3%) |
| Law Enforcement | 84 (84.9%) | 15 (15.1%) |
| Food Preparation & Serving | 1,528 (57.4%) | 1,132 (42.6%) |
| Cleaning & Maintenance | 792 (57.2%) | 593 (42.8%) |
| Personal Care & Service | 353 (25.5%) | 1,033 (74.5%) |
| Total (Category) | 3,461 (44.0%) | 4,399 (56.0%) |
| Total (Overall) | 50,610 (58.1%) | 36,530 (41.9%) |
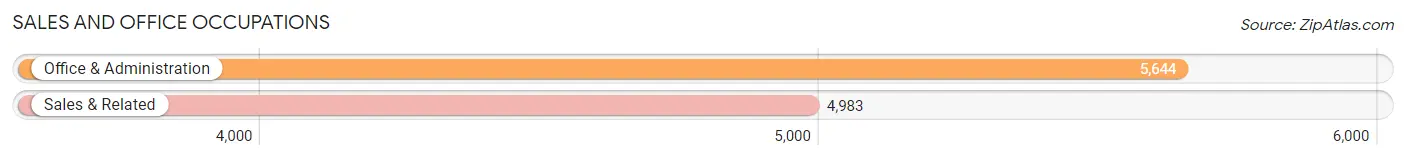
Sales and Office Occupations
The most common Sales and Office occupations in Sunnyvale are Office & Administration (5,644 | 6.5%), and Sales & Related (4,983 | 5.7%).
Sales and Office Occupations by Sex
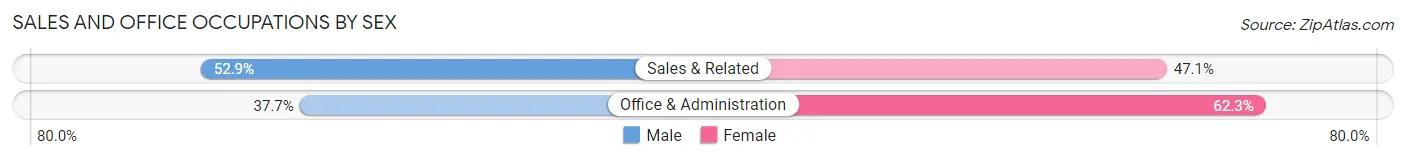
| Occupation | Male | Female |
| Sales & Related | 2,635 (52.9%) | 2,348 (47.1%) |
| Office & Administration | 2,127 (37.7%) | 3,517 (62.3%) |
| Total (Category) | 4,762 (44.8%) | 5,865 (55.2%) |
| Total (Overall) | 50,610 (58.1%) | 36,530 (41.9%) |
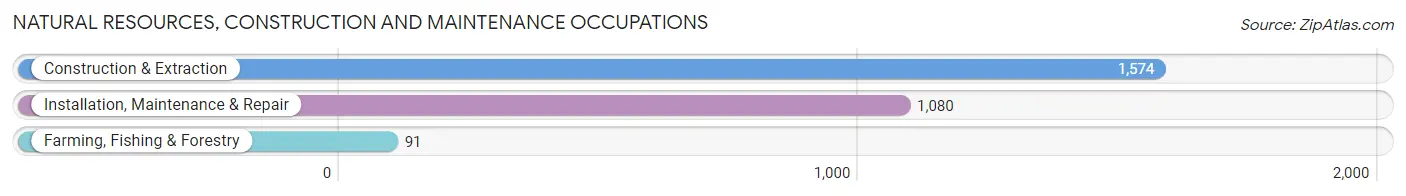
Natural Resources, Construction and Maintenance Occupations
The most common Natural Resources, Construction and Maintenance occupations in Sunnyvale are Construction & Extraction (1,574 | 1.8%), Installation, Maintenance & Repair (1,080 | 1.2%), and Farming, Fishing & Forestry (91 | 0.1%).
Natural Resources, Construction and Maintenance Occupations by Sex
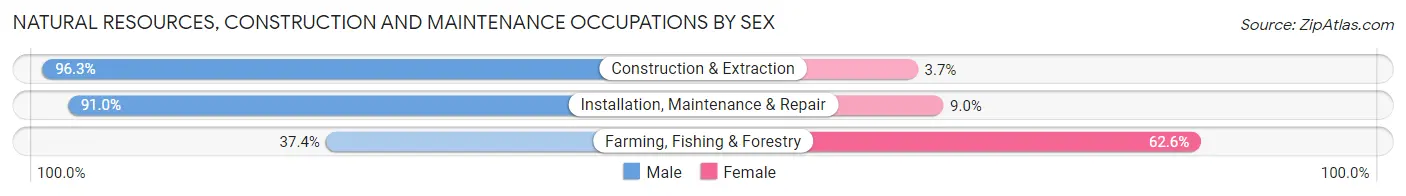
| Occupation | Male | Female |
| Farming, Fishing & Forestry | 34 (37.4%) | 57 (62.6%) |
| Construction & Extraction | 1,516 (96.3%) | 58 (3.7%) |
| Installation, Maintenance & Repair | 983 (91.0%) | 97 (9.0%) |
| Total (Category) | 2,533 (92.3%) | 212 (7.7%) |
| Total (Overall) | 50,610 (58.1%) | 36,530 (41.9%) |
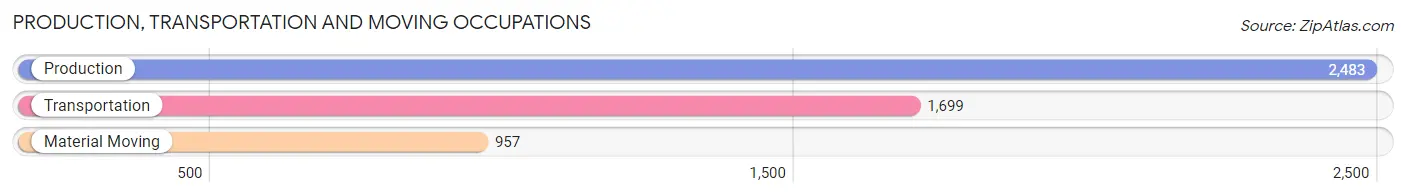
Production, Transportation and Moving Occupations
The most common Production, Transportation and Moving occupations in Sunnyvale are Production (2,483 | 2.9%), Transportation (1,699 | 1.9%), and Material Moving (957 | 1.1%).
Production, Transportation and Moving Occupations by Sex
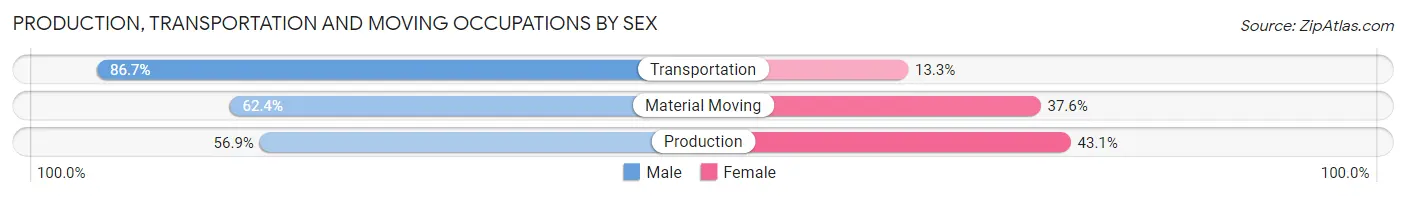
| Occupation | Male | Female |
| Production | 1,412 (56.9%) | 1,071 (43.1%) |
| Transportation | 1,473 (86.7%) | 226 (13.3%) |
| Material Moving | 597 (62.4%) | 360 (37.6%) |
| Total (Category) | 3,482 (67.8%) | 1,657 (32.2%) |
| Total (Overall) | 50,610 (58.1%) | 36,530 (41.9%) |
Employment Industries by Sex in Sunnyvale
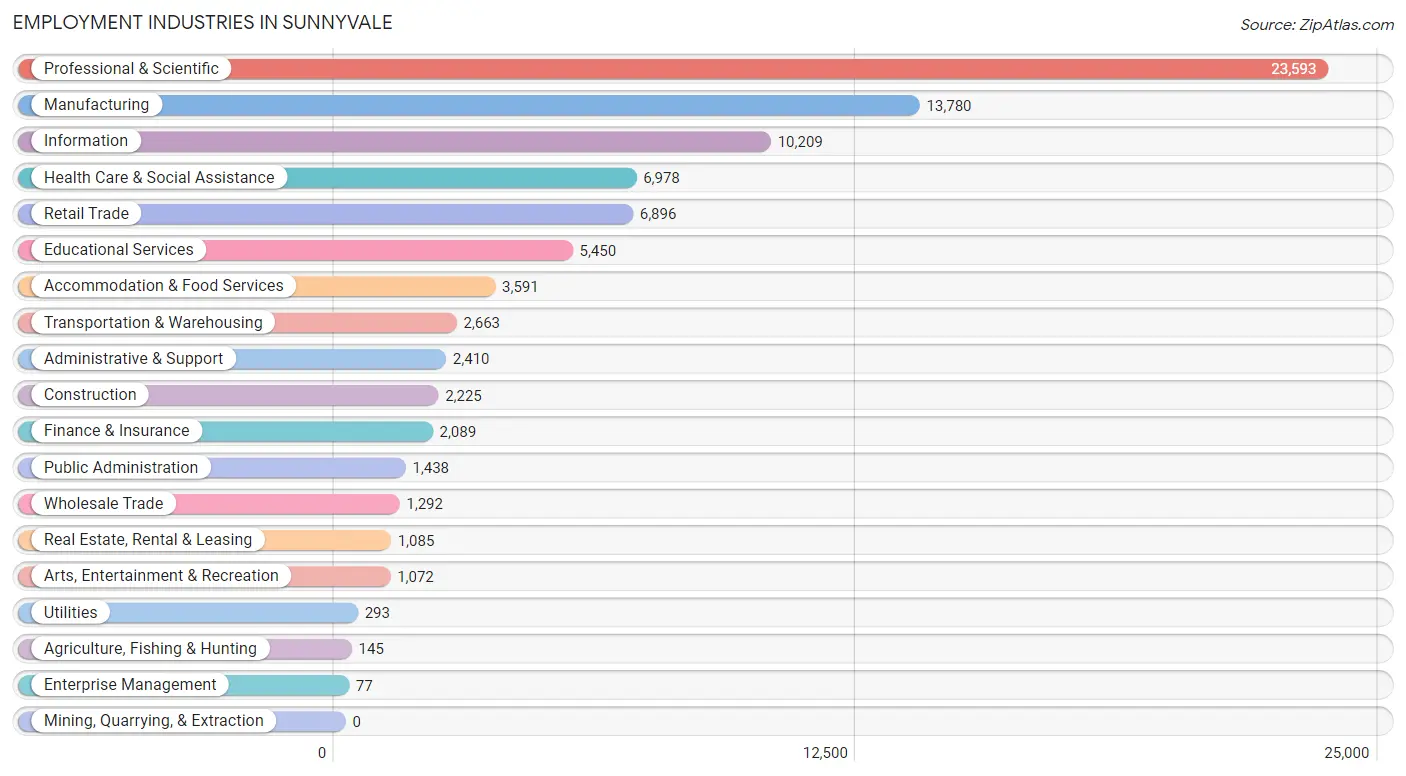
Employment Industries in Sunnyvale
The major employment industries in Sunnyvale include Professional & Scientific (23,593 | 27.1%), Manufacturing (13,780 | 15.8%), Information (10,209 | 11.7%), Health Care & Social Assistance (6,978 | 8.0%), and Retail Trade (6,896 | 7.9%).
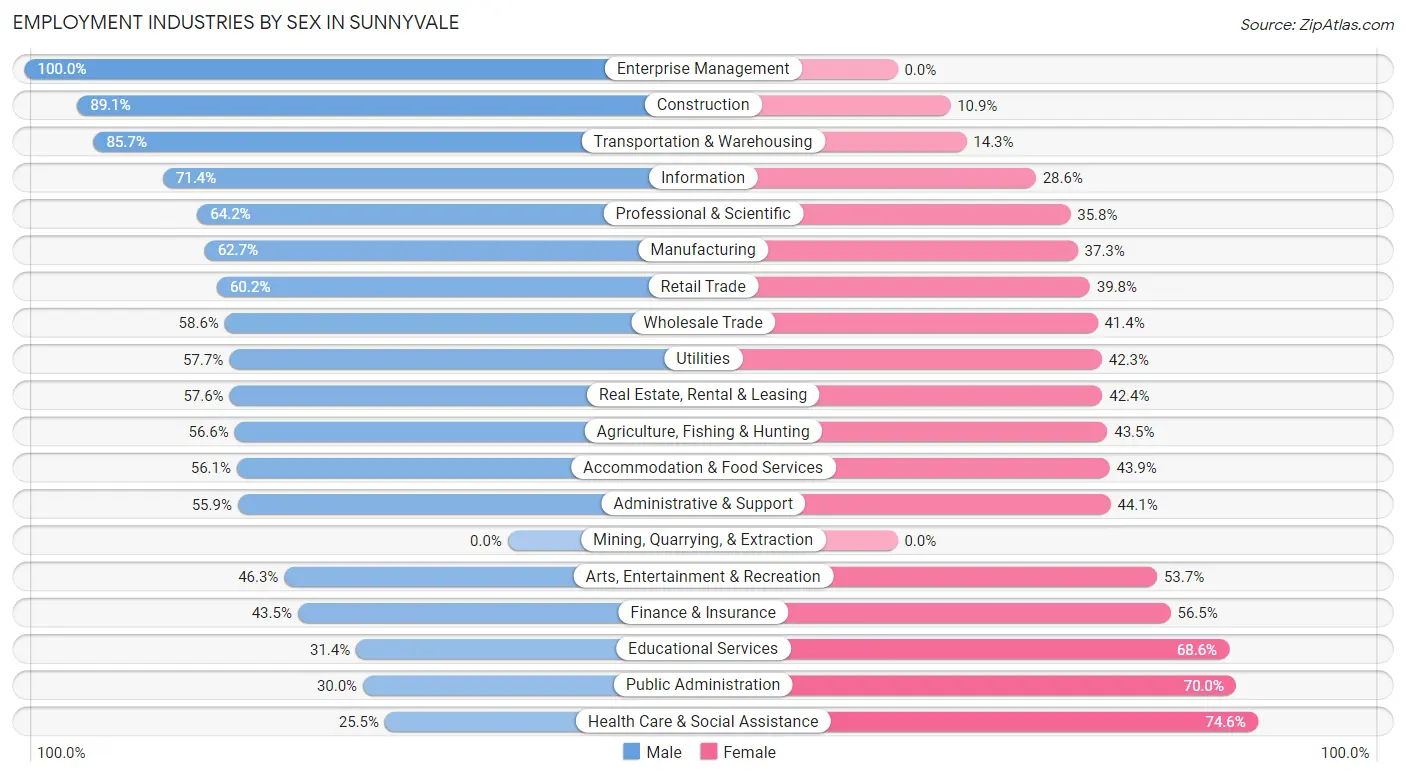
Employment Industries by Sex in Sunnyvale
The Sunnyvale industries that see more men than women are Enterprise Management (100.0%), Construction (89.1%), and Transportation & Warehousing (85.7%), whereas the industries that tend to have a higher number of women are Health Care & Social Assistance (74.6%), Public Administration (70.0%), and Educational Services (68.6%).
| Industry | Male | Female |
| Agriculture, Fishing & Hunting | 82 (56.6%) | 63 (43.4%) |
| Mining, Quarrying, & Extraction | 0 (0.0%) | 0 (0.0%) |
| Construction | 1,982 (89.1%) | 243 (10.9%) |
| Manufacturing | 8,641 (62.7%) | 5,139 (37.3%) |
| Wholesale Trade | 757 (58.6%) | 535 (41.4%) |
| Retail Trade | 4,149 (60.2%) | 2,747 (39.8%) |
| Transportation & Warehousing | 2,283 (85.7%) | 380 (14.3%) |
| Utilities | 169 (57.7%) | 124 (42.3%) |
| Information | 7,287 (71.4%) | 2,922 (28.6%) |
| Finance & Insurance | 908 (43.5%) | 1,181 (56.5%) |
| Real Estate, Rental & Leasing | 625 (57.6%) | 460 (42.4%) |
| Professional & Scientific | 15,151 (64.2%) | 8,442 (35.8%) |
| Enterprise Management | 77 (100.0%) | 0 (0.0%) |
| Administrative & Support | 1,347 (55.9%) | 1,063 (44.1%) |
| Educational Services | 1,711 (31.4%) | 3,739 (68.6%) |
| Health Care & Social Assistance | 1,776 (25.5%) | 5,202 (74.6%) |
| Arts, Entertainment & Recreation | 496 (46.3%) | 576 (53.7%) |
| Accommodation & Food Services | 2,014 (56.1%) | 1,577 (43.9%) |
| Public Administration | 431 (30.0%) | 1,007 (70.0%) |
| Total | 50,610 (58.1%) | 36,530 (41.9%) |
Education in Sunnyvale
School Enrollment in Sunnyvale
The most common levels of schooling among the 32,545 students in Sunnyvale are middle school (6,226 | 19.1%), elementary school (6,079 | 18.7%), and high school (5,879 | 18.1%).
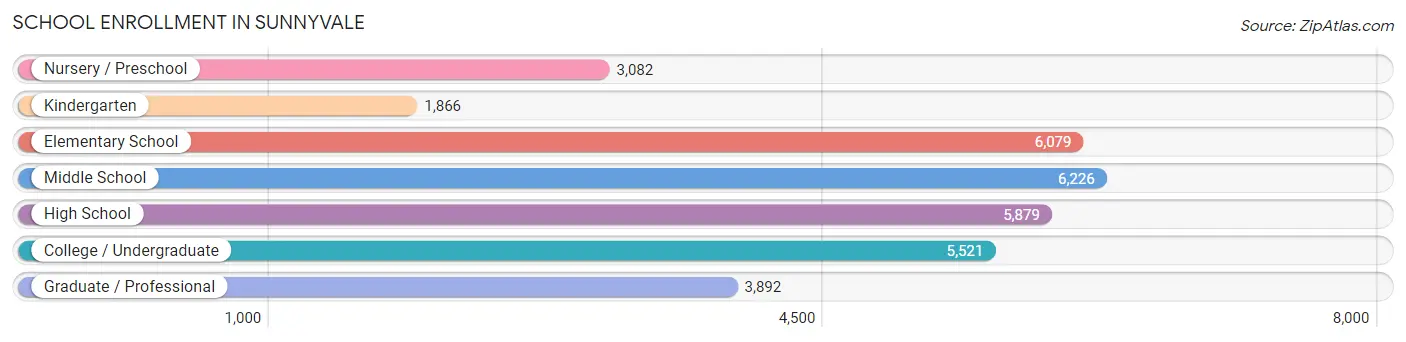
| School Level | # Students | % Students |
| Nursery / Preschool | 3,082 | 9.5% |
| Kindergarten | 1,866 | 5.7% |
| Elementary School | 6,079 | 18.7% |
| Middle School | 6,226 | 19.1% |
| High School | 5,879 | 18.1% |
| College / Undergraduate | 5,521 | 17.0% |
| Graduate / Professional | 3,892 | 12.0% |
| Total | 32,545 | 100.0% |
School Enrollment by Age by Funding Source in Sunnyvale
Out of a total of 32,545 students who are enrolled in schools in Sunnyvale, 8,397 (25.8%) attend a private institution, while the remaining 24,148 (74.2%) are enrolled in public schools. The age group of 3 to 4 year olds has the highest likelihood of being enrolled in private schools, with 1,737 (68.8% in the age bracket) enrolled. Conversely, the age group of 18 to 19 year olds has the lowest likelihood of being enrolled in a private school, with 1,230 (88.2% in the age bracket) attending a public institution.
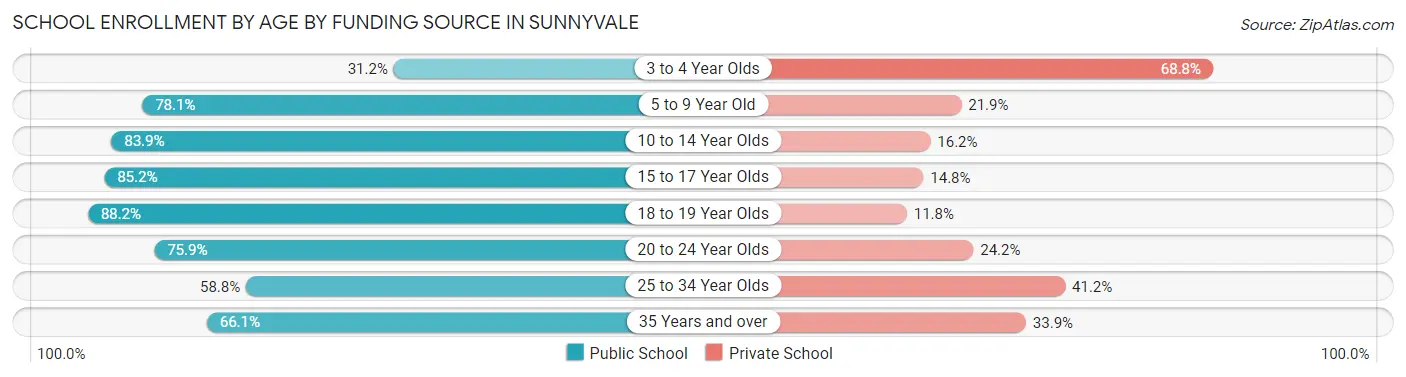
| Age Bracket | Public School | Private School |
| 3 to 4 Year Olds | 789 (31.2%) | 1,737 (68.8%) |
| 5 to 9 Year Old | 6,139 (78.1%) | 1,722 (21.9%) |
| 10 to 14 Year Olds | 6,730 (83.9%) | 1,296 (16.2%) |
| 15 to 17 Year Olds | 3,432 (85.2%) | 598 (14.8%) |
| 18 to 19 Year Olds | 1,230 (88.2%) | 164 (11.8%) |
| 20 to 24 Year Olds | 2,560 (75.8%) | 815 (24.1%) |
| 25 to 34 Year Olds | 2,100 (58.8%) | 1,474 (41.2%) |
| 35 Years and over | 1,162 (66.1%) | 597 (33.9%) |
| Total | 24,148 (74.2%) | 8,397 (25.8%) |
Educational Attainment by Field of Study in Sunnyvale
Engineering (25,020 | 30.5%), computers & mathematics (15,086 | 18.4%), business (9,149 | 11.2%), science & technology (4,805 | 5.9%), and social sciences (4,236 | 5.2%) are the most common fields of study among 81,992 individuals in Sunnyvale who have obtained a bachelor's degree or higher.
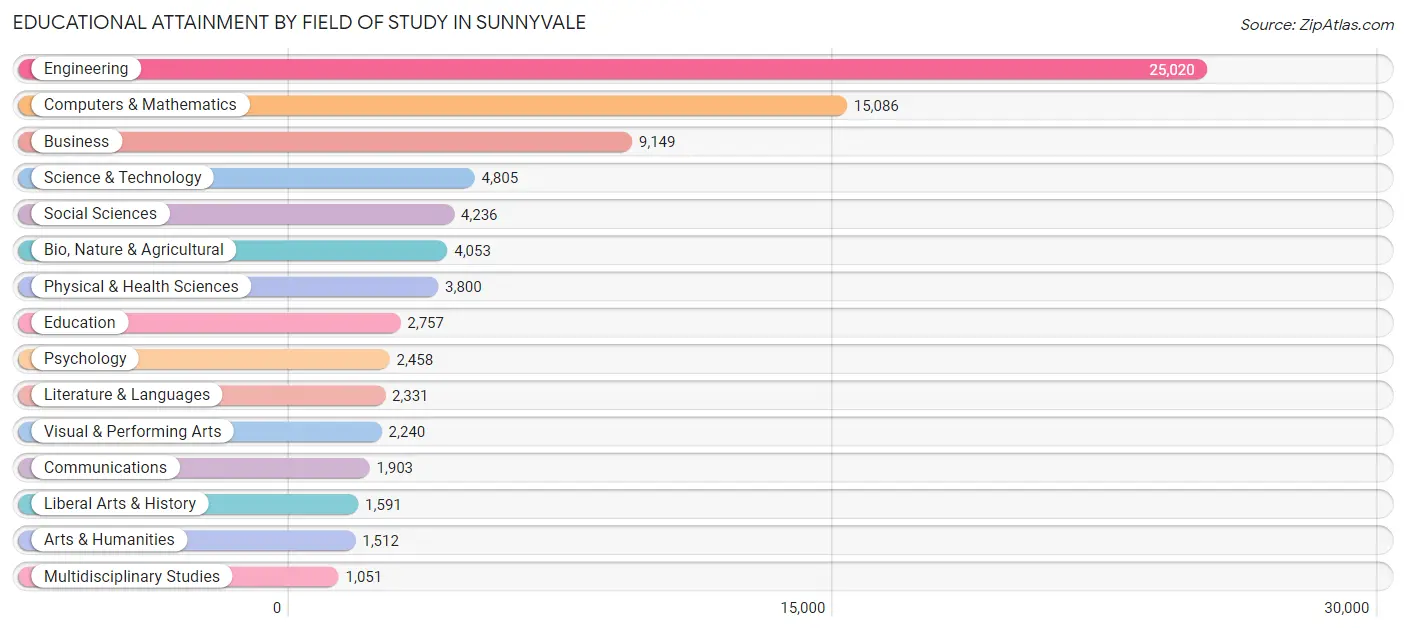
| Field of Study | # Graduates | % Graduates |
| Computers & Mathematics | 15,086 | 18.4% |
| Bio, Nature & Agricultural | 4,053 | 4.9% |
| Physical & Health Sciences | 3,800 | 4.6% |
| Psychology | 2,458 | 3.0% |
| Social Sciences | 4,236 | 5.2% |
| Engineering | 25,020 | 30.5% |
| Multidisciplinary Studies | 1,051 | 1.3% |
| Science & Technology | 4,805 | 5.9% |
| Business | 9,149 | 11.2% |
| Education | 2,757 | 3.4% |
| Literature & Languages | 2,331 | 2.8% |
| Liberal Arts & History | 1,591 | 1.9% |
| Visual & Performing Arts | 2,240 | 2.7% |
| Communications | 1,903 | 2.3% |
| Arts & Humanities | 1,512 | 1.8% |
| Total | 81,992 | 100.0% |
Transportation & Commute in Sunnyvale
Vehicle Availability by Sex in Sunnyvale
The most prevalent vehicle ownership categories in Sunnyvale are males with 2 vehicles (20,706, accounting for 41.3%) and females with 2 vehicles (15,019, making up 58.5%).
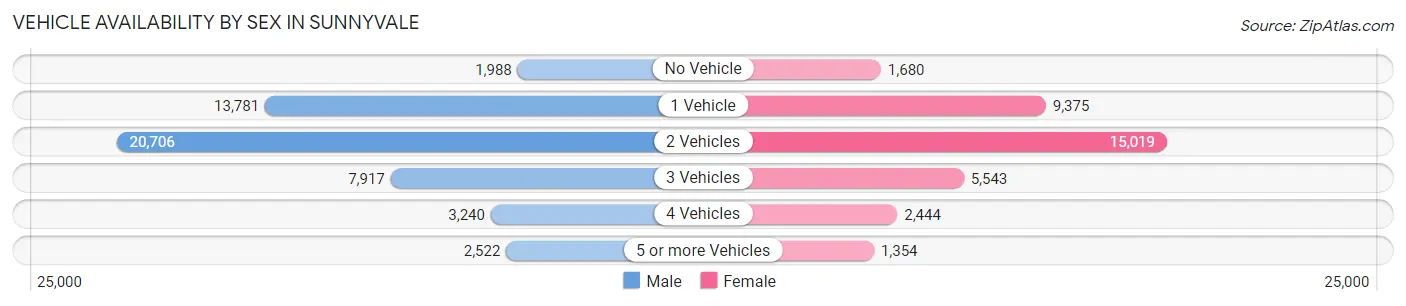
| Vehicles Available | Male | Female |
| No Vehicle | 1,988 (4.0%) | 1,680 (4.7%) |
| 1 Vehicle | 13,781 (27.5%) | 9,375 (26.5%) |
| 2 Vehicles | 20,706 (41.3%) | 15,019 (42.4%) |
| 3 Vehicles | 7,917 (15.8%) | 5,543 (15.7%) |
| 4 Vehicles | 3,240 (6.5%) | 2,444 (6.9%) |
| 5 or more Vehicles | 2,522 (5.0%) | 1,354 (3.8%) |
| Total | 50,154 (100.0%) | 35,415 (100.0%) |
Commute Time in Sunnyvale
The most frequently occuring commute durations in Sunnyvale are 15 to 19 minutes (12,395 commuters, 19.2%), 20 to 24 minutes (11,789 commuters, 18.2%), and 30 to 34 minutes (10,328 commuters, 16.0%).
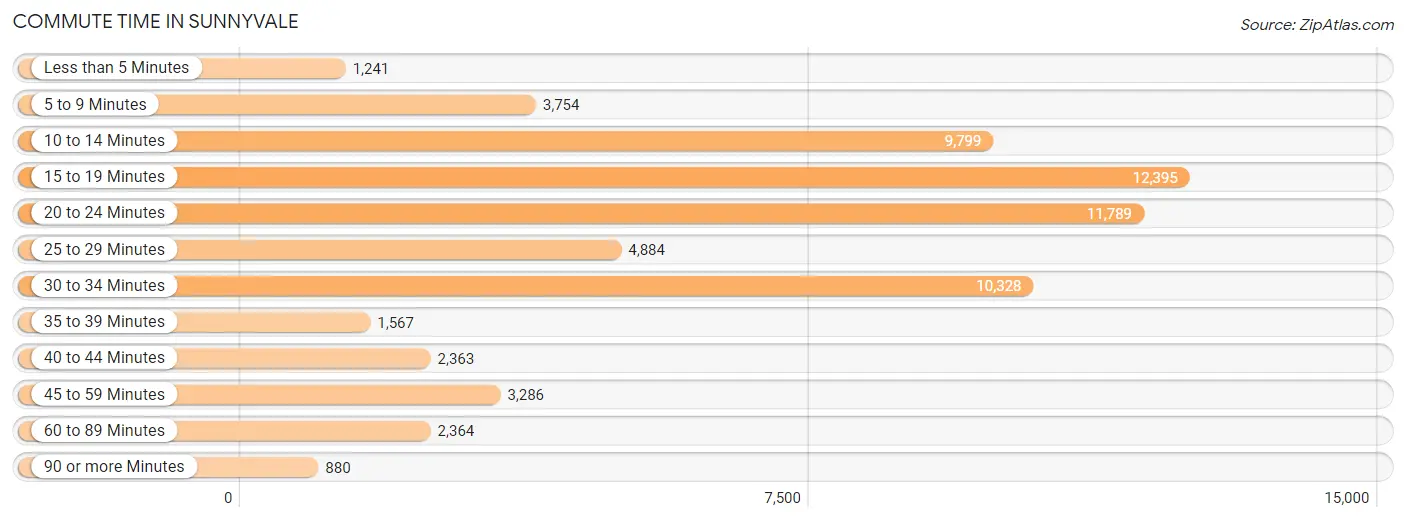
| Commute Time | # Commuters | % Commuters |
| Less than 5 Minutes | 1,241 | 1.9% |
| 5 to 9 Minutes | 3,754 | 5.8% |
| 10 to 14 Minutes | 9,799 | 15.2% |
| 15 to 19 Minutes | 12,395 | 19.2% |
| 20 to 24 Minutes | 11,789 | 18.2% |
| 25 to 29 Minutes | 4,884 | 7.5% |
| 30 to 34 Minutes | 10,328 | 16.0% |
| 35 to 39 Minutes | 1,567 | 2.4% |
| 40 to 44 Minutes | 2,363 | 3.7% |
| 45 to 59 Minutes | 3,286 | 5.1% |
| 60 to 89 Minutes | 2,364 | 3.7% |
| 90 or more Minutes | 880 | 1.4% |
Commute Time by Sex in Sunnyvale
The most common commute times in Sunnyvale are 15 to 19 minutes (7,710 commuters, 20.2%) for males and 20 to 24 minutes (4,755 commuters, 18.0%) for females.
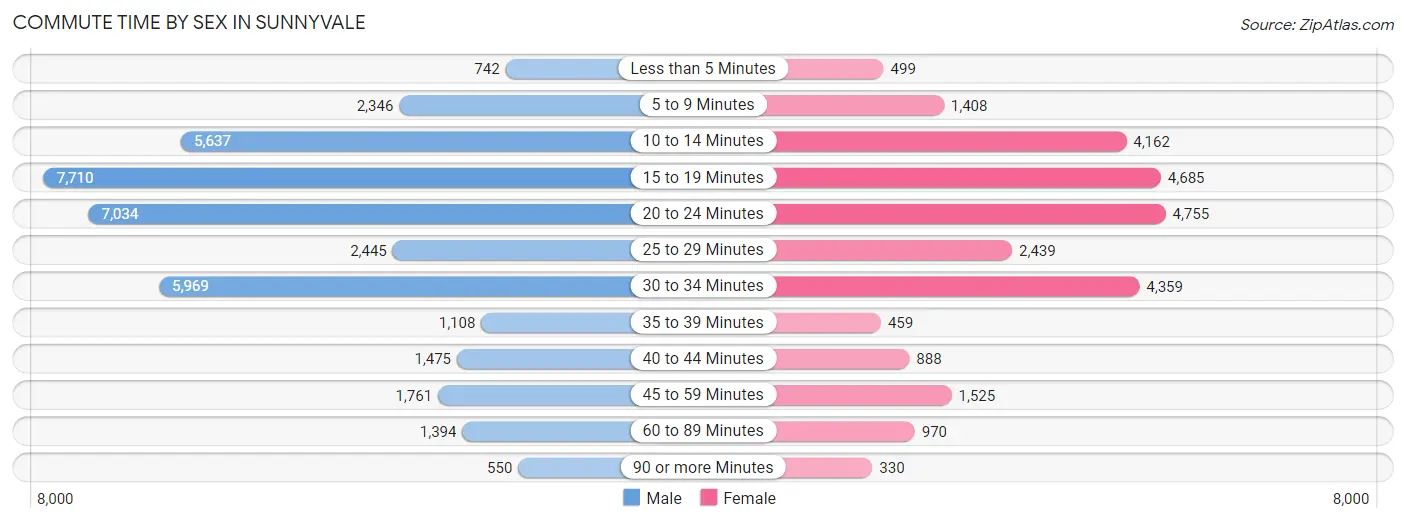
| Commute Time | Male | Female |
| Less than 5 Minutes | 742 (1.9%) | 499 (1.9%) |
| 5 to 9 Minutes | 2,346 (6.1%) | 1,408 (5.3%) |
| 10 to 14 Minutes | 5,637 (14.8%) | 4,162 (15.7%) |
| 15 to 19 Minutes | 7,710 (20.2%) | 4,685 (17.7%) |
| 20 to 24 Minutes | 7,034 (18.4%) | 4,755 (18.0%) |
| 25 to 29 Minutes | 2,445 (6.4%) | 2,439 (9.2%) |
| 30 to 34 Minutes | 5,969 (15.6%) | 4,359 (16.5%) |
| 35 to 39 Minutes | 1,108 (2.9%) | 459 (1.7%) |
| 40 to 44 Minutes | 1,475 (3.9%) | 888 (3.4%) |
| 45 to 59 Minutes | 1,761 (4.6%) | 1,525 (5.8%) |
| 60 to 89 Minutes | 1,394 (3.6%) | 970 (3.7%) |
| 90 or more Minutes | 550 (1.4%) | 330 (1.3%) |
Time of Departure to Work by Sex in Sunnyvale
The most frequent times of departure to work in Sunnyvale are 9:00 AM to 9:59 AM (9,368, 24.5%) for males and 9:00 AM to 9:59 AM (4,798, 18.1%) for females.
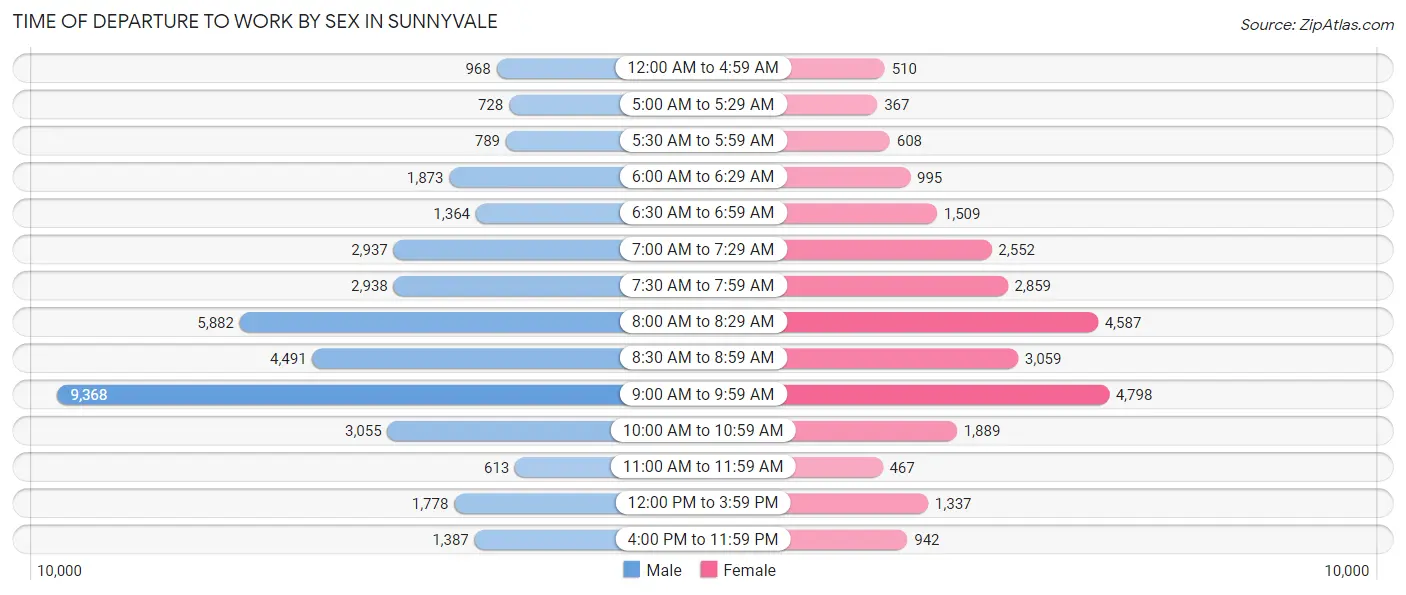
| Time of Departure | Male | Female |
| 12:00 AM to 4:59 AM | 968 (2.5%) | 510 (1.9%) |
| 5:00 AM to 5:29 AM | 728 (1.9%) | 367 (1.4%) |
| 5:30 AM to 5:59 AM | 789 (2.1%) | 608 (2.3%) |
| 6:00 AM to 6:29 AM | 1,873 (4.9%) | 995 (3.8%) |
| 6:30 AM to 6:59 AM | 1,364 (3.6%) | 1,509 (5.7%) |
| 7:00 AM to 7:29 AM | 2,937 (7.7%) | 2,552 (9.6%) |
| 7:30 AM to 7:59 AM | 2,938 (7.7%) | 2,859 (10.8%) |
| 8:00 AM to 8:29 AM | 5,882 (15.4%) | 4,587 (17.3%) |
| 8:30 AM to 8:59 AM | 4,491 (11.8%) | 3,059 (11.6%) |
| 9:00 AM to 9:59 AM | 9,368 (24.5%) | 4,798 (18.1%) |
| 10:00 AM to 10:59 AM | 3,055 (8.0%) | 1,889 (7.1%) |
| 11:00 AM to 11:59 AM | 613 (1.6%) | 467 (1.8%) |
| 12:00 PM to 3:59 PM | 1,778 (4.7%) | 1,337 (5.1%) |
| 4:00 PM to 11:59 PM | 1,387 (3.6%) | 942 (3.6%) |
| Total | 38,171 (100.0%) | 26,479 (100.0%) |
Housing Occupancy in Sunnyvale
Occupancy by Ownership in Sunnyvale
Of the total 58,646 dwellings in Sunnyvale, owner-occupied units account for 26,025 (44.4%), while renter-occupied units make up 32,621 (55.6%).
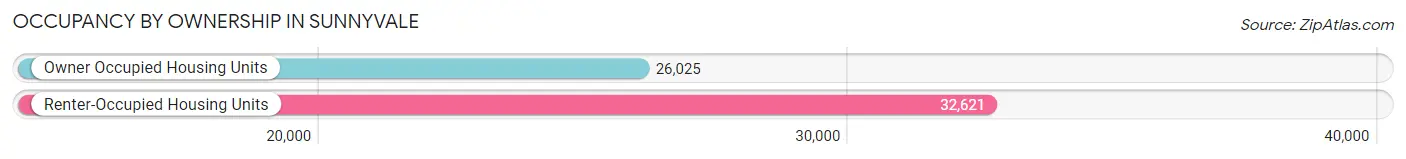
| Occupancy | # Housing Units | % Housing Units |
| Owner Occupied Housing Units | 26,025 | 44.4% |
| Renter-Occupied Housing Units | 32,621 | 55.6% |
| Total Occupied Housing Units | 58,646 | 100.0% |
Occupancy by Household Size in Sunnyvale
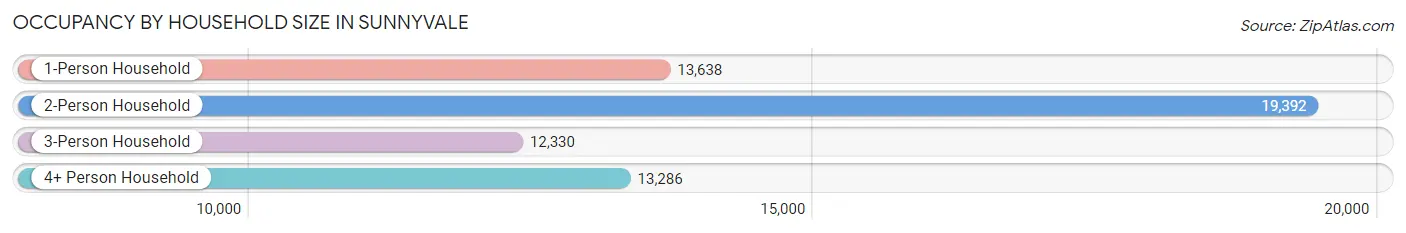
| Household Size | # Housing Units | % Housing Units |
| 1-Person Household | 13,638 | 23.3% |
| 2-Person Household | 19,392 | 33.1% |
| 3-Person Household | 12,330 | 21.0% |
| 4+ Person Household | 13,286 | 22.7% |
| Total Housing Units | 58,646 | 100.0% |
Occupancy by Ownership by Household Size in Sunnyvale
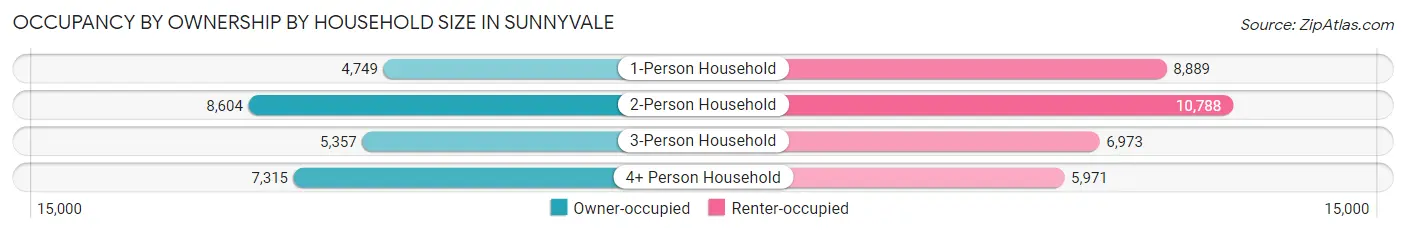
| Household Size | Owner-occupied | Renter-occupied |
| 1-Person Household | 4,749 (34.8%) | 8,889 (65.2%) |
| 2-Person Household | 8,604 (44.4%) | 10,788 (55.6%) |
| 3-Person Household | 5,357 (43.4%) | 6,973 (56.6%) |
| 4+ Person Household | 7,315 (55.1%) | 5,971 (44.9%) |
| Total Housing Units | 26,025 (44.4%) | 32,621 (55.6%) |
Occupancy by Educational Attainment in Sunnyvale
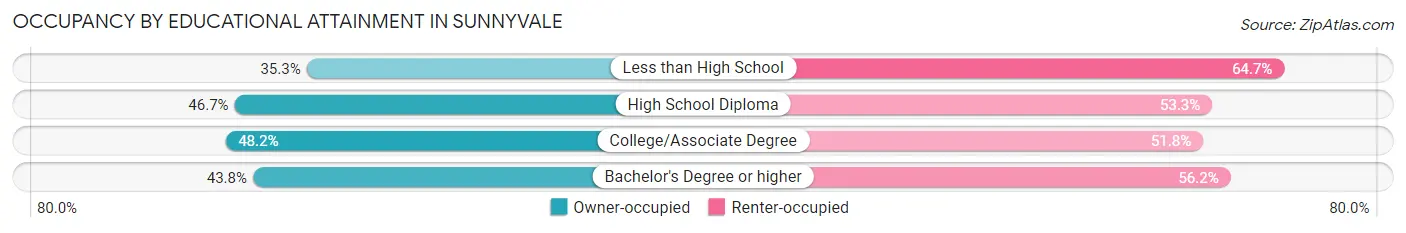
| Household Size | Owner-occupied | Renter-occupied |
| Less than High School | 890 (35.3%) | 1,632 (64.7%) |
| High School Diploma | 2,085 (46.7%) | 2,378 (53.3%) |
| College/Associate Degree | 4,595 (48.2%) | 4,945 (51.8%) |
| Bachelor's Degree or higher | 18,455 (43.8%) | 23,666 (56.2%) |
Occupancy by Age of Householder in Sunnyvale
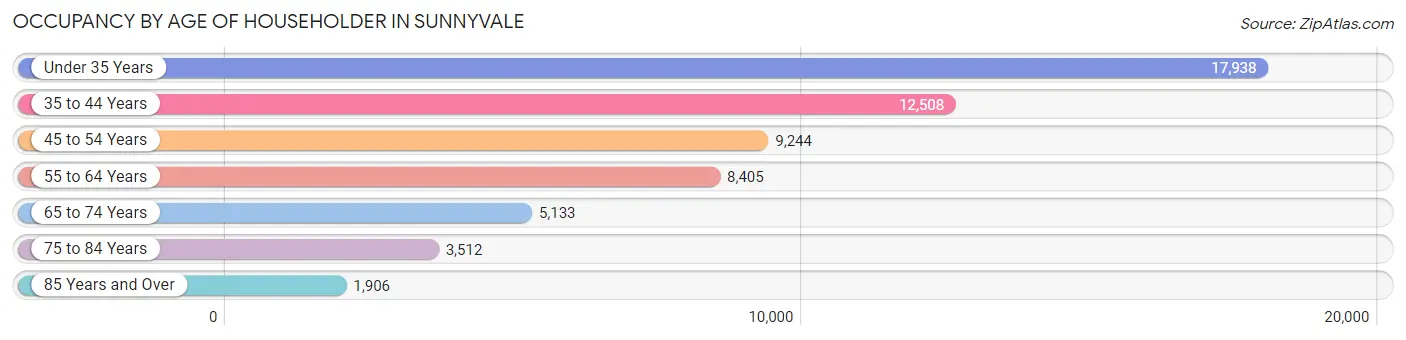
| Age Bracket | # Households | % Households |
| Under 35 Years | 17,938 | 30.6% |
| 35 to 44 Years | 12,508 | 21.3% |
| 45 to 54 Years | 9,244 | 15.8% |
| 55 to 64 Years | 8,405 | 14.3% |
| 65 to 74 Years | 5,133 | 8.7% |
| 75 to 84 Years | 3,512 | 6.0% |
| 85 Years and Over | 1,906 | 3.3% |
| Total | 58,646 | 100.0% |
Housing Finances in Sunnyvale
Median Income by Occupancy in Sunnyvale
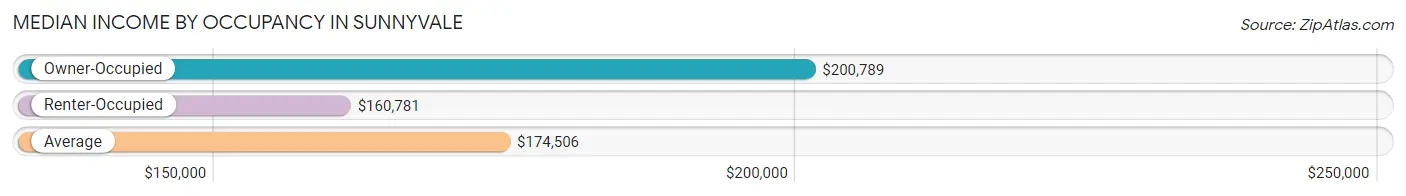
| Occupancy Type | # Households | Median Income |
| Owner-Occupied | 26,025 (44.4%) | $200,789 |
| Renter-Occupied | 32,621 (55.6%) | $160,781 |
| Average | 58,646 (100.0%) | $174,506 |
Occupancy by Householder Income Bracket in Sunnyvale
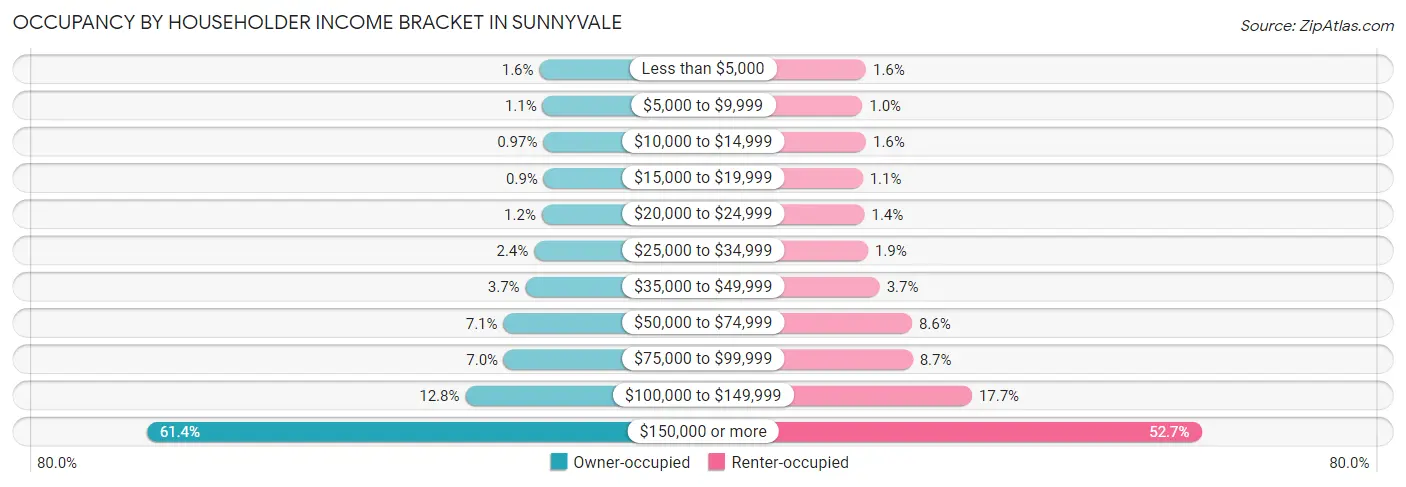
| Income Bracket | Owner-occupied | Renter-occupied |
| Less than $5,000 | 405 (1.6%) | 522 (1.6%) |
| $5,000 to $9,999 | 280 (1.1%) | 338 (1.0%) |
| $10,000 to $14,999 | 253 (1.0%) | 522 (1.6%) |
| $15,000 to $19,999 | 234 (0.9%) | 354 (1.1%) |
| $20,000 to $24,999 | 313 (1.2%) | 447 (1.4%) |
| $25,000 to $34,999 | 614 (2.4%) | 617 (1.9%) |
| $35,000 to $49,999 | 959 (3.7%) | 1,202 (3.7%) |
| $50,000 to $74,999 | 1,836 (7.0%) | 2,805 (8.6%) |
| $75,000 to $99,999 | 1,812 (7.0%) | 2,841 (8.7%) |
| $100,000 to $149,999 | 3,341 (12.8%) | 5,787 (17.7%) |
| $150,000 or more | 15,978 (61.4%) | 17,186 (52.7%) |
| Total | 26,025 (100.0%) | 32,621 (100.0%) |
Monthly Housing Cost Tiers in Sunnyvale
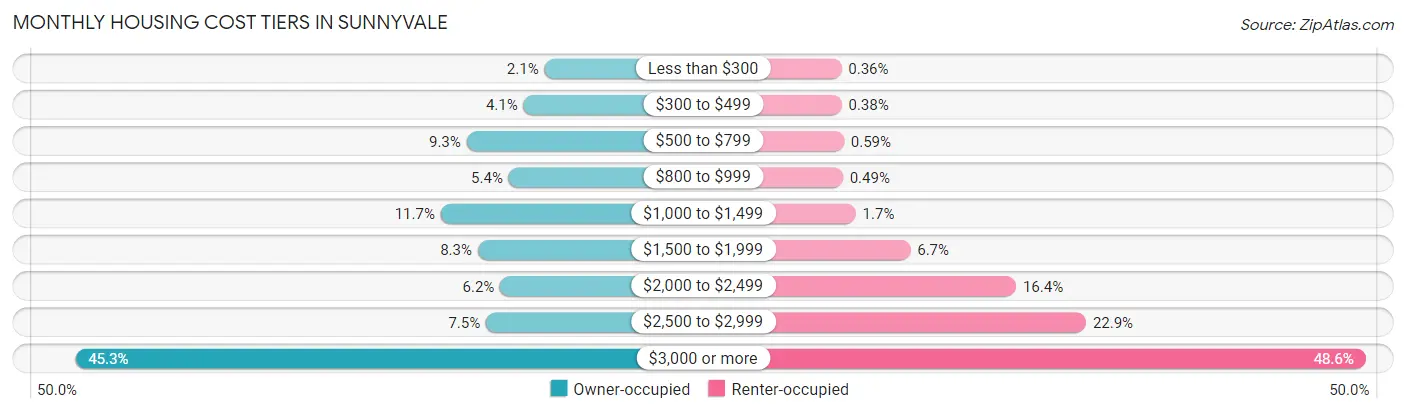
| Monthly Cost | Owner-occupied | Renter-occupied |
| Less than $300 | 556 (2.1%) | 117 (0.4%) |
| $300 to $499 | 1,059 (4.1%) | 125 (0.4%) |
| $500 to $799 | 2,423 (9.3%) | 192 (0.6%) |
| $800 to $999 | 1,414 (5.4%) | 159 (0.5%) |
| $1,000 to $1,499 | 3,043 (11.7%) | 549 (1.7%) |
| $1,500 to $1,999 | 2,155 (8.3%) | 2,188 (6.7%) |
| $2,000 to $2,499 | 1,618 (6.2%) | 5,362 (16.4%) |
| $2,500 to $2,999 | 1,957 (7.5%) | 7,463 (22.9%) |
| $3,000 or more | 11,800 (45.3%) | 15,863 (48.6%) |
| Total | 26,025 (100.0%) | 32,621 (100.0%) |
Physical Housing Characteristics in Sunnyvale
Housing Structures in Sunnyvale
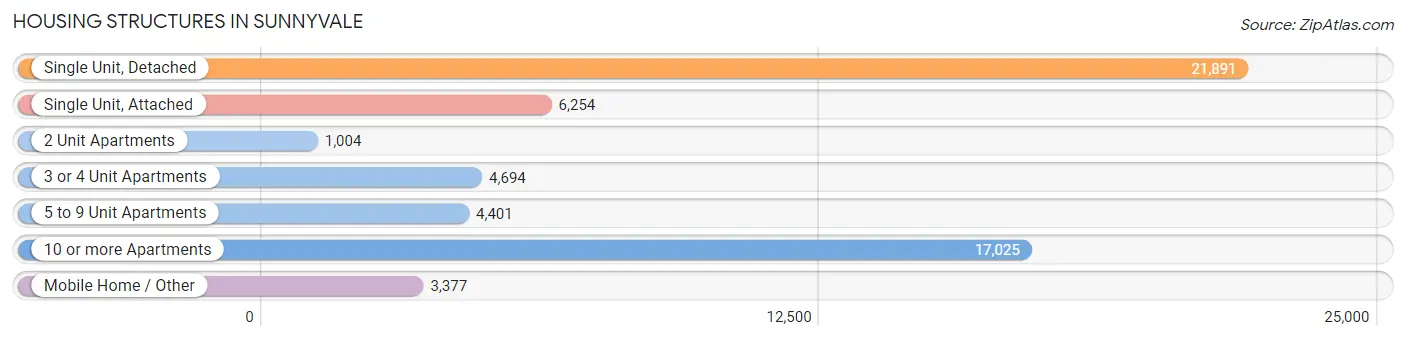
| Structure Type | # Housing Units | % Housing Units |
| Single Unit, Detached | 21,891 | 37.3% |
| Single Unit, Attached | 6,254 | 10.7% |
| 2 Unit Apartments | 1,004 | 1.7% |
| 3 or 4 Unit Apartments | 4,694 | 8.0% |
| 5 to 9 Unit Apartments | 4,401 | 7.5% |
| 10 or more Apartments | 17,025 | 29.0% |
| Mobile Home / Other | 3,377 | 5.8% |
| Total | 58,646 | 100.0% |
Housing Structures by Occupancy in Sunnyvale
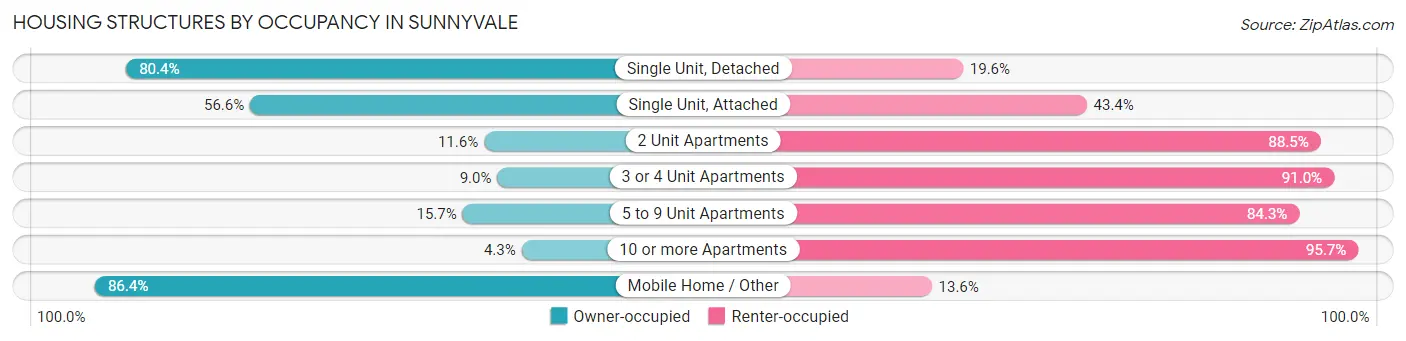
| Structure Type | Owner-occupied | Renter-occupied |
| Single Unit, Detached | 17,604 (80.4%) | 4,287 (19.6%) |
| Single Unit, Attached | 3,539 (56.6%) | 2,715 (43.4%) |
| 2 Unit Apartments | 116 (11.6%) | 888 (88.4%) |
| 3 or 4 Unit Apartments | 422 (9.0%) | 4,272 (91.0%) |
| 5 to 9 Unit Apartments | 690 (15.7%) | 3,711 (84.3%) |
| 10 or more Apartments | 735 (4.3%) | 16,290 (95.7%) |
| Mobile Home / Other | 2,919 (86.4%) | 458 (13.6%) |
| Total | 26,025 (44.4%) | 32,621 (55.6%) |
Housing Structures by Number of Rooms in Sunnyvale
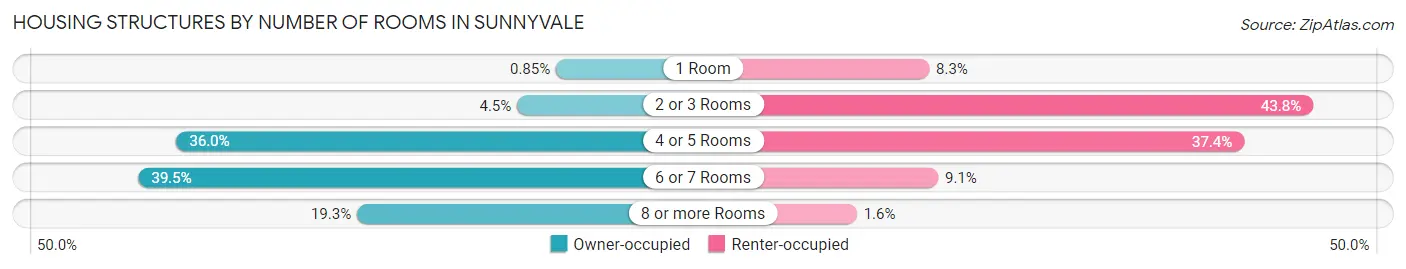
| Number of Rooms | Owner-occupied | Renter-occupied |
| 1 Room | 221 (0.9%) | 2,691 (8.3%) |
| 2 or 3 Rooms | 1,159 (4.4%) | 14,272 (43.8%) |
| 4 or 5 Rooms | 9,358 (36.0%) | 12,192 (37.4%) |
| 6 or 7 Rooms | 10,274 (39.5%) | 2,961 (9.1%) |
| 8 or more Rooms | 5,013 (19.3%) | 505 (1.5%) |
| Total | 26,025 (100.0%) | 32,621 (100.0%) |
Housing Structure by Heating Type in Sunnyvale
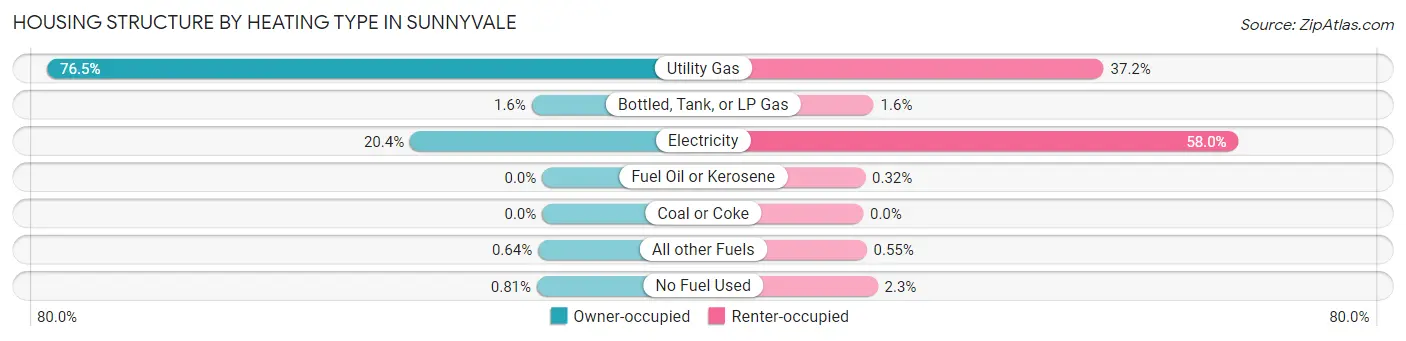
| Heating Type | Owner-occupied | Renter-occupied |
| Utility Gas | 19,911 (76.5%) | 12,133 (37.2%) |
| Bottled, Tank, or LP Gas | 422 (1.6%) | 536 (1.6%) |
| Electricity | 5,315 (20.4%) | 18,931 (58.0%) |
| Fuel Oil or Kerosene | 0 (0.0%) | 105 (0.3%) |
| Coal or Coke | 0 (0.0%) | 0 (0.0%) |
| All other Fuels | 167 (0.6%) | 181 (0.5%) |
| No Fuel Used | 210 (0.8%) | 735 (2.2%) |
| Total | 26,025 (100.0%) | 32,621 (100.0%) |
Household Vehicle Usage in Sunnyvale
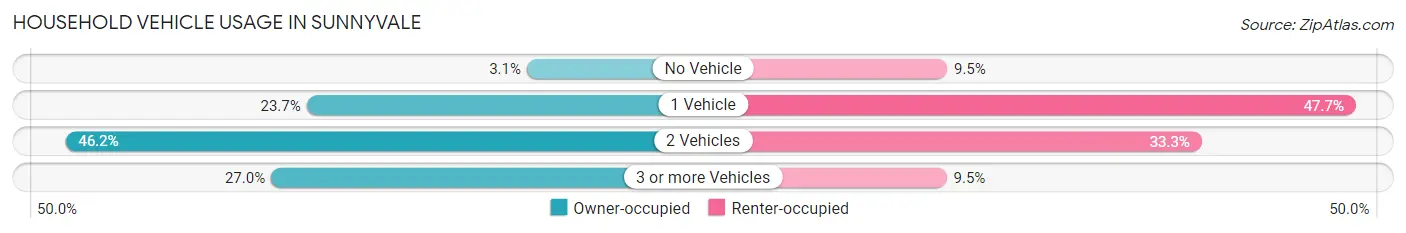
| Vehicles per Household | Owner-occupied | Renter-occupied |
| No Vehicle | 812 (3.1%) | 3,108 (9.5%) |
| 1 Vehicle | 6,162 (23.7%) | 15,554 (47.7%) |
| 2 Vehicles | 12,024 (46.2%) | 10,864 (33.3%) |
| 3 or more Vehicles | 7,027 (27.0%) | 3,095 (9.5%) |
| Total | 26,025 (100.0%) | 32,621 (100.0%) |
Real Estate & Mortgages in Sunnyvale
Real Estate and Mortgage Overview in Sunnyvale
| Characteristic | Without Mortgage | With Mortgage |
| Housing Units | 9,713 | 16,312 |
| Median Property Value | $1,463,500 | $1,772,200 |
| Median Household Income | $109,948 | $12,075 |
| Monthly Housing Costs | $959 | $11,748 |
| Real Estate Taxes | $4,664 | $410 |
Property Value by Mortgage Status in Sunnyvale
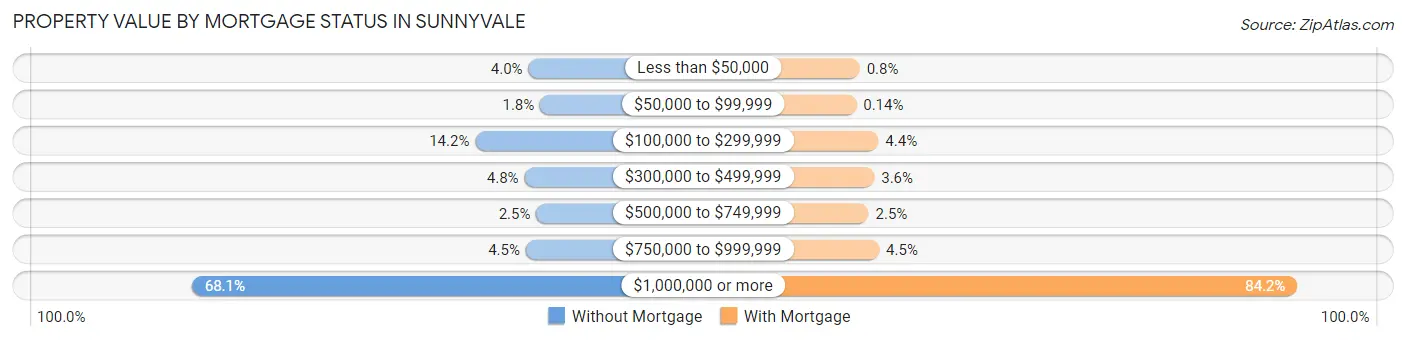
| Property Value | Without Mortgage | With Mortgage |
| Less than $50,000 | 392 (4.0%) | 130 (0.8%) |
| $50,000 to $99,999 | 176 (1.8%) | 23 (0.1%) |
| $100,000 to $299,999 | 1,375 (14.2%) | 712 (4.4%) |
| $300,000 to $499,999 | 465 (4.8%) | 582 (3.6%) |
| $500,000 to $749,999 | 247 (2.5%) | 404 (2.5%) |
| $750,000 to $999,999 | 440 (4.5%) | 734 (4.5%) |
| $1,000,000 or more | 6,618 (68.1%) | 13,727 (84.2%) |
| Total | 9,713 (100.0%) | 16,312 (100.0%) |
Household Income by Mortgage Status in Sunnyvale
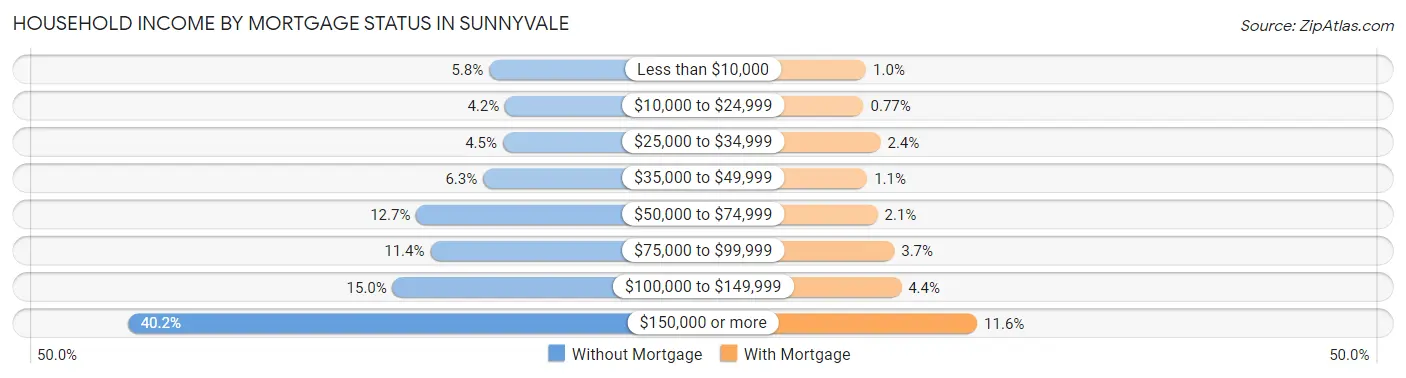
| Household Income | Without Mortgage | With Mortgage |
| Less than $10,000 | 560 (5.8%) | 164 (1.0%) |
| $10,000 to $24,999 | 412 (4.2%) | 125 (0.8%) |
| $25,000 to $34,999 | 433 (4.5%) | 388 (2.4%) |
| $35,000 to $49,999 | 616 (6.3%) | 181 (1.1%) |
| $50,000 to $74,999 | 1,234 (12.7%) | 343 (2.1%) |
| $75,000 to $99,999 | 1,103 (11.4%) | 602 (3.7%) |
| $100,000 to $149,999 | 1,452 (14.9%) | 709 (4.3%) |
| $150,000 or more | 3,903 (40.2%) | 1,889 (11.6%) |
| Total | 9,713 (100.0%) | 16,312 (100.0%) |
Property Value to Household Income Ratio in Sunnyvale
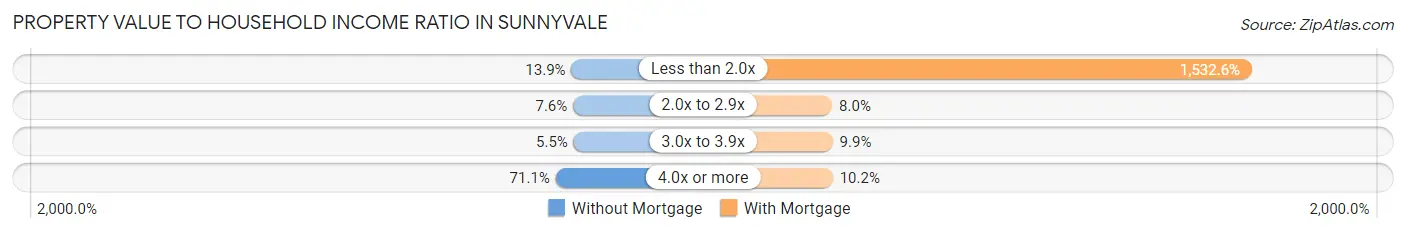
| Value-to-Income Ratio | Without Mortgage | With Mortgage |
| Less than 2.0x | 1,352 (13.9%) | 250,001 (1,532.6%) |
| 2.0x to 2.9x | 742 (7.6%) | 1,312 (8.0%) |
| 3.0x to 3.9x | 531 (5.5%) | 1,617 (9.9%) |
| 4.0x or more | 6,910 (71.1%) | 1,663 (10.2%) |
| Total | 9,713 (100.0%) | 16,312 (100.0%) |
Real Estate Taxes by Mortgage Status in Sunnyvale
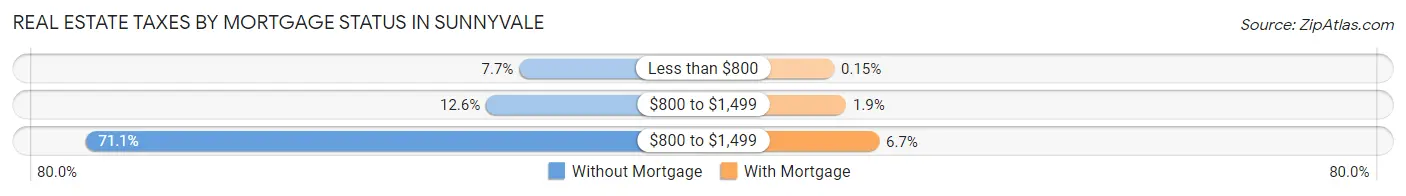
| Property Taxes | Without Mortgage | With Mortgage |
| Less than $800 | 751 (7.7%) | 25 (0.2%) |
| $800 to $1,499 | 1,221 (12.6%) | 308 (1.9%) |
| $800 to $1,499 | 6,908 (71.1%) | 1,097 (6.7%) |
| Total | 9,713 (100.0%) | 16,312 (100.0%) |
Health & Disability in Sunnyvale
Health Insurance Coverage by Age in Sunnyvale
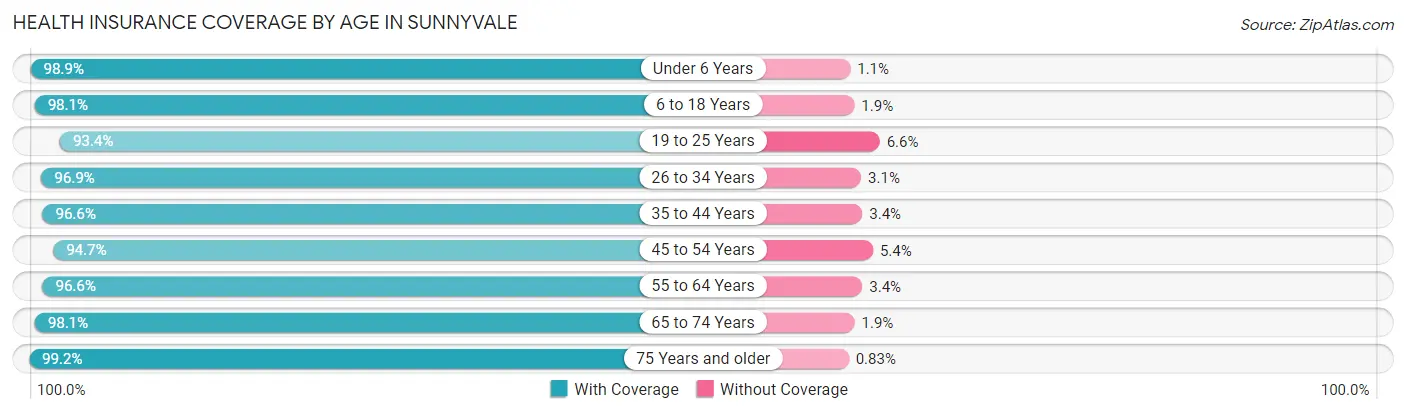
| Age Bracket | With Coverage | Without Coverage |
| Under 6 Years | 12,166 (98.9%) | 138 (1.1%) |
| 6 to 18 Years | 19,006 (98.1%) | 366 (1.9%) |
| 19 to 25 Years | 11,809 (93.4%) | 836 (6.6%) |
| 26 to 34 Years | 31,723 (96.9%) | 1,030 (3.1%) |
| 35 to 44 Years | 23,109 (96.6%) | 803 (3.4%) |
| 45 to 54 Years | 16,990 (94.7%) | 960 (5.3%) |
| 55 to 64 Years | 15,492 (96.6%) | 538 (3.4%) |
| 65 to 74 Years | 9,940 (98.1%) | 195 (1.9%) |
| 75 Years and older | 8,644 (99.2%) | 72 (0.8%) |
| Total | 148,879 (96.8%) | 4,938 (3.2%) |
Health Insurance Coverage by Citizenship Status in Sunnyvale
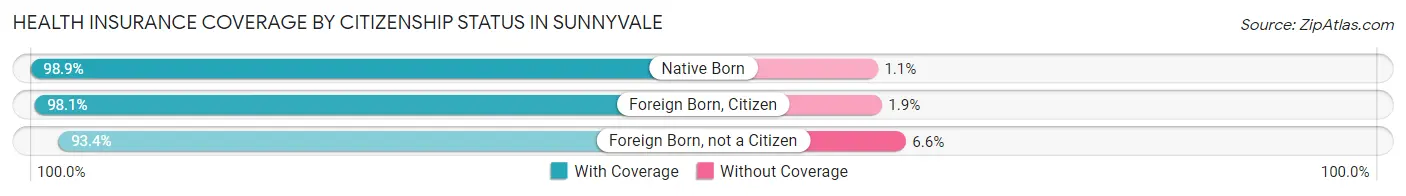
| Citizenship Status | With Coverage | Without Coverage |
| Native Born | 12,166 (98.9%) | 138 (1.1%) |
| Foreign Born, Citizen | 19,006 (98.1%) | 366 (1.9%) |
| Foreign Born, not a Citizen | 11,809 (93.4%) | 836 (6.6%) |
Health Insurance Coverage by Household Income in Sunnyvale
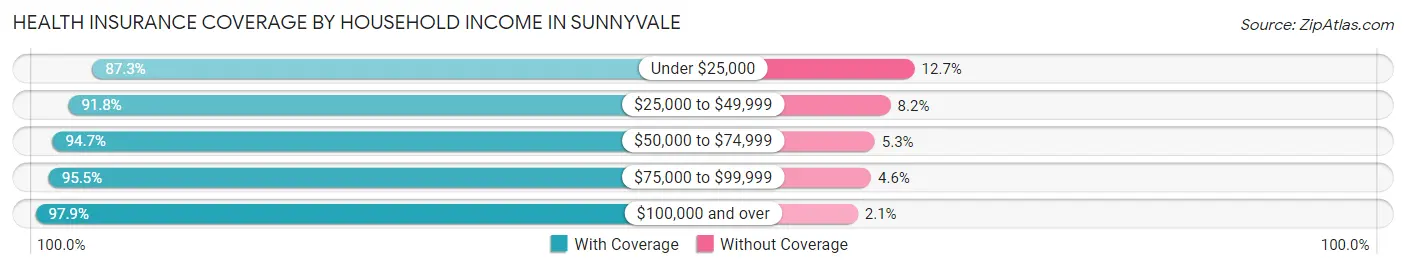
| Household Income | With Coverage | Without Coverage |
| Under $25,000 | 5,304 (87.3%) | 772 (12.7%) |
| $25,000 to $49,999 | 6,222 (91.8%) | 557 (8.2%) |
| $50,000 to $74,999 | 9,876 (94.7%) | 548 (5.3%) |
| $75,000 to $99,999 | 11,223 (95.5%) | 535 (4.5%) |
| $100,000 and over | 115,714 (97.9%) | 2,447 (2.1%) |
Public vs Private Health Insurance Coverage by Age in Sunnyvale
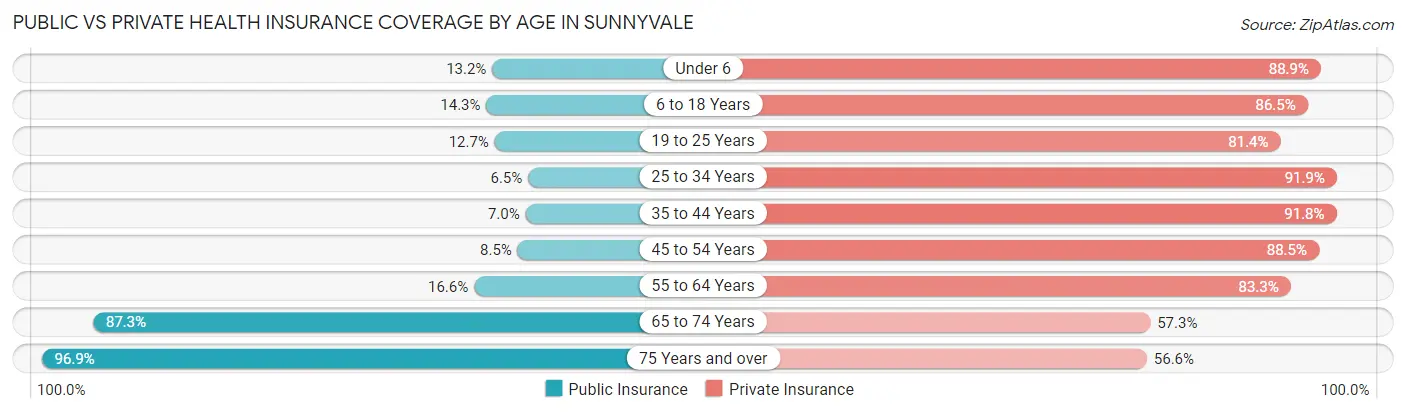
| Age Bracket | Public Insurance | Private Insurance |
| Under 6 | 1,625 (13.2%) | 10,940 (88.9%) |
| 6 to 18 Years | 2,768 (14.3%) | 16,747 (86.5%) |
| 19 to 25 Years | 1,611 (12.7%) | 10,293 (81.4%) |
| 25 to 34 Years | 2,142 (6.5%) | 30,088 (91.9%) |
| 35 to 44 Years | 1,678 (7.0%) | 21,949 (91.8%) |
| 45 to 54 Years | 1,522 (8.5%) | 15,891 (88.5%) |
| 55 to 64 Years | 2,658 (16.6%) | 13,353 (83.3%) |
| 65 to 74 Years | 8,851 (87.3%) | 5,802 (57.3%) |
| 75 Years and over | 8,443 (96.9%) | 4,935 (56.6%) |
| Total | 31,298 (20.3%) | 129,998 (84.5%) |
Disability Status by Sex by Age in Sunnyvale
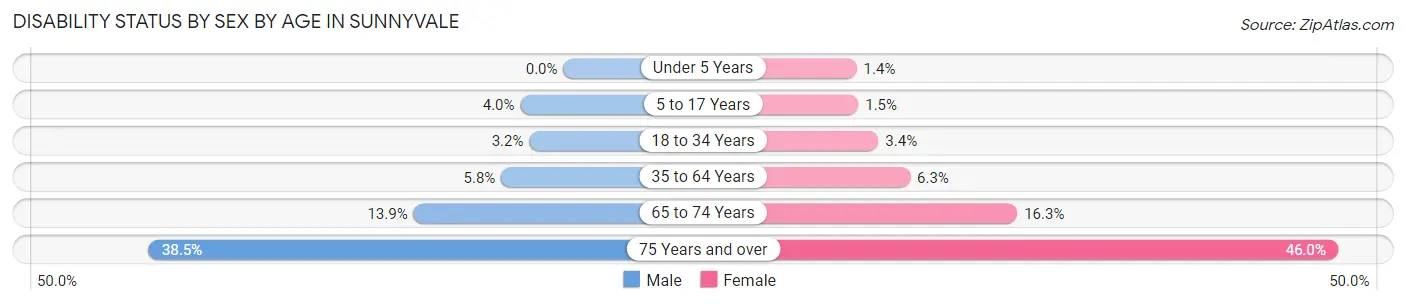
| Age Bracket | Male | Female |
| Under 5 Years | 0 (0.0%) | 63 (1.4%) |
| 5 to 17 Years | 410 (4.0%) | 156 (1.5%) |
| 18 to 34 Years | 798 (3.2%) | 716 (3.4%) |
| 35 to 64 Years | 1,778 (5.8%) | 1,719 (6.3%) |
| 65 to 74 Years | 645 (13.9%) | 895 (16.3%) |
| 75 Years and over | 1,411 (38.5%) | 2,323 (46.0%) |
Disability Class by Sex by Age in Sunnyvale
Disability Class: Hearing Difficulty
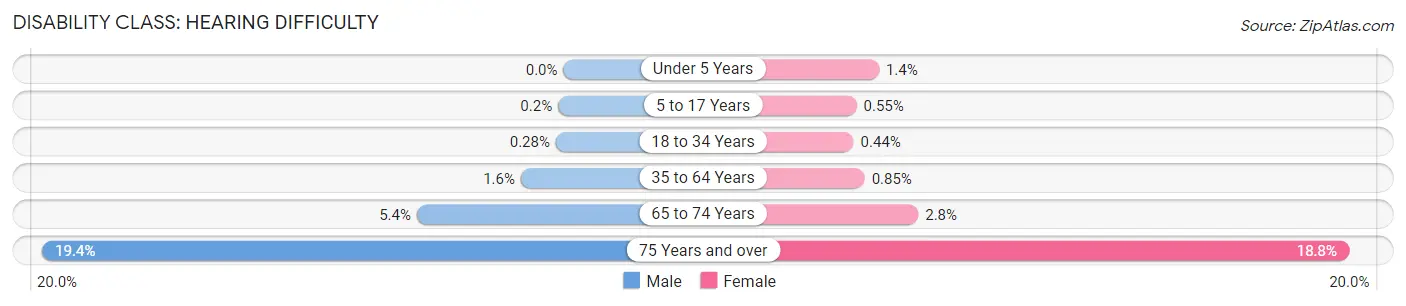
| Age Bracket | Male | Female |
| Under 5 Years | 0 (0.0%) | 63 (1.4%) |
| 5 to 17 Years | 21 (0.2%) | 56 (0.5%) |
| 18 to 34 Years | 71 (0.3%) | 93 (0.4%) |
| 35 to 64 Years | 487 (1.6%) | 229 (0.9%) |
| 65 to 74 Years | 252 (5.4%) | 156 (2.8%) |
| 75 Years and over | 710 (19.4%) | 950 (18.8%) |
Disability Class: Vision Difficulty
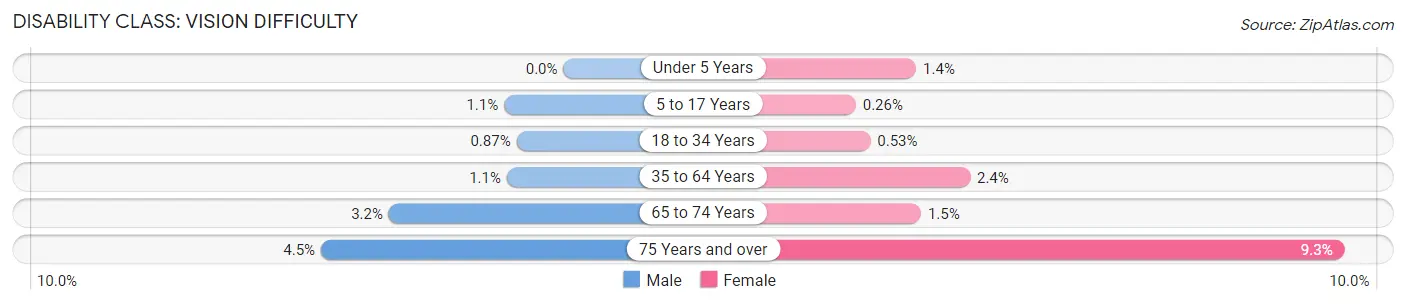
| Age Bracket | Male | Female |
| Under 5 Years | 0 (0.0%) | 63 (1.4%) |
| 5 to 17 Years | 113 (1.1%) | 27 (0.3%) |
| 18 to 34 Years | 220 (0.9%) | 112 (0.5%) |
| 35 to 64 Years | 323 (1.1%) | 644 (2.4%) |
| 65 to 74 Years | 150 (3.2%) | 81 (1.5%) |
| 75 Years and over | 165 (4.5%) | 471 (9.3%) |
Disability Class: Cognitive Difficulty
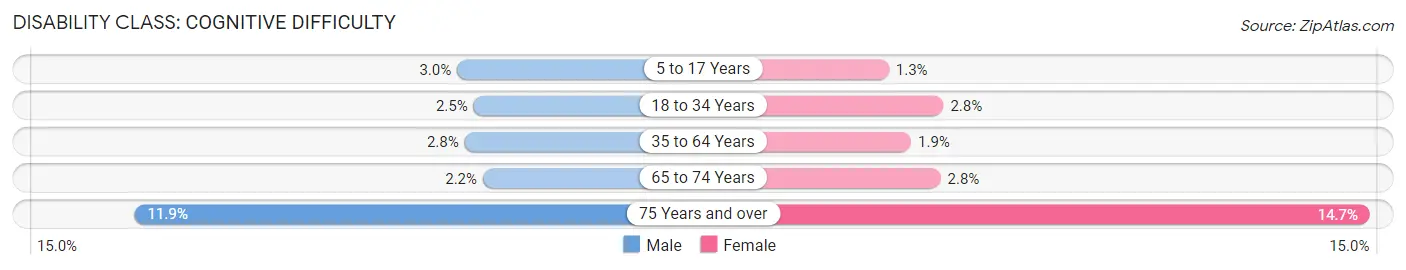
| Age Bracket | Male | Female |
| 5 to 17 Years | 304 (3.0%) | 133 (1.3%) |
| 18 to 34 Years | 631 (2.5%) | 596 (2.8%) |
| 35 to 64 Years | 847 (2.8%) | 523 (1.9%) |
| 65 to 74 Years | 104 (2.2%) | 151 (2.8%) |
| 75 Years and over | 438 (11.9%) | 742 (14.7%) |
Disability Class: Ambulatory Difficulty
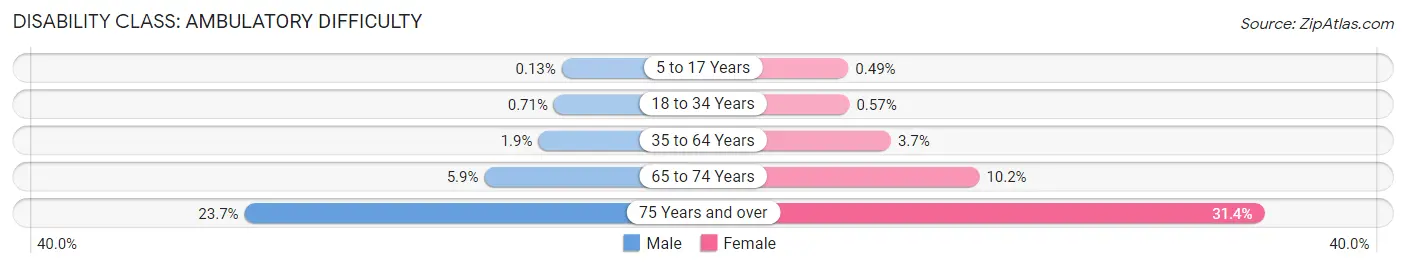
| Age Bracket | Male | Female |
| 5 to 17 Years | 13 (0.1%) | 50 (0.5%) |
| 18 to 34 Years | 179 (0.7%) | 119 (0.6%) |
| 35 to 64 Years | 573 (1.9%) | 990 (3.6%) |
| 65 to 74 Years | 272 (5.9%) | 562 (10.2%) |
| 75 Years and over | 869 (23.7%) | 1,583 (31.4%) |
Disability Class: Self-Care Difficulty
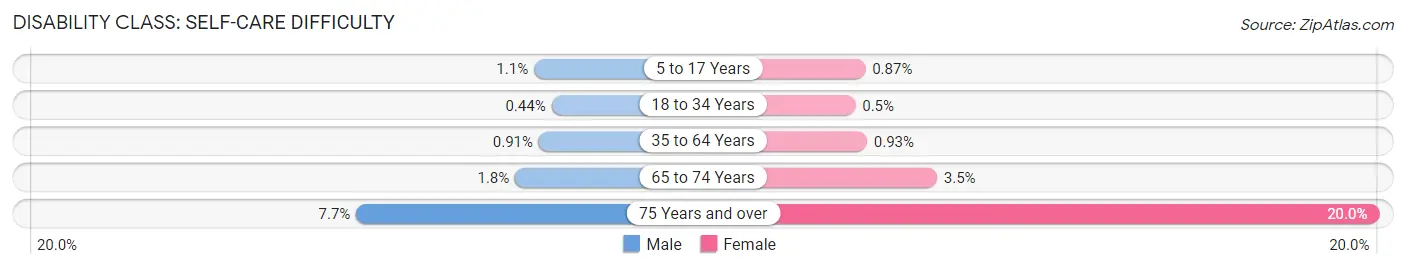
| Age Bracket | Male | Female |
| 5 to 17 Years | 112 (1.1%) | 89 (0.9%) |
| 18 to 34 Years | 112 (0.4%) | 106 (0.5%) |
| 35 to 64 Years | 279 (0.9%) | 253 (0.9%) |
| 65 to 74 Years | 83 (1.8%) | 194 (3.5%) |
| 75 Years and over | 282 (7.7%) | 1,007 (20.0%) |
Technology Access in Sunnyvale
Computing Device Access in Sunnyvale
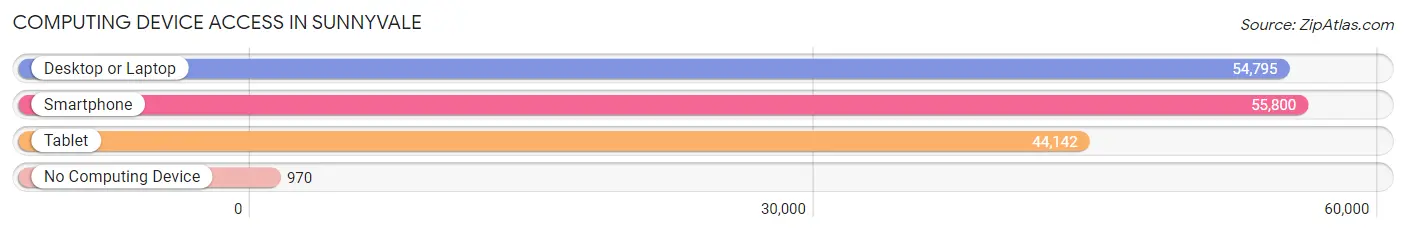
| Device Type | # Households | % Households |
| Desktop or Laptop | 54,795 | 93.4% |
| Smartphone | 55,800 | 95.2% |
| Tablet | 44,142 | 75.3% |
| No Computing Device | 970 | 1.7% |
| Total | 58,646 | 100.0% |
Internet Access in Sunnyvale
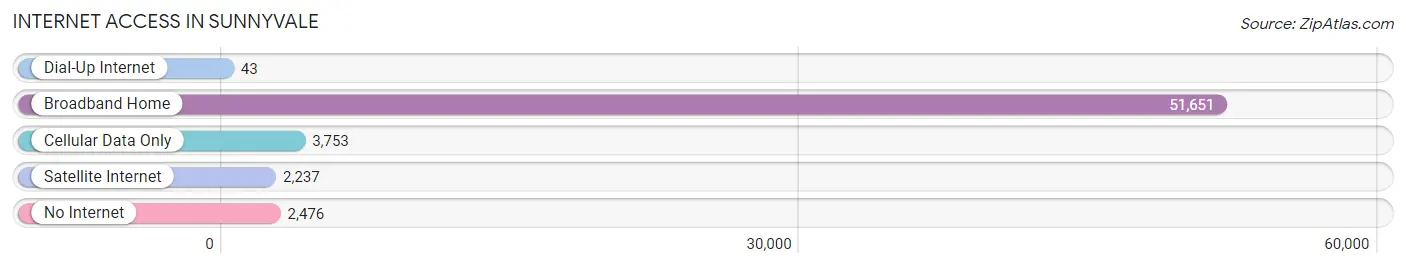
| Internet Type | # Households | % Households |
| Dial-Up Internet | 43 | 0.1% |
| Broadband Home | 51,651 | 88.1% |
| Cellular Data Only | 3,753 | 6.4% |
| Satellite Internet | 2,237 | 3.8% |
| No Internet | 2,476 | 4.2% |
| Total | 58,646 | 100.0% |
Sunnyvale Summary
Sunnyvale, California is a city located in the heart of Silicon Valley, in Santa Clara County. It is bordered by the cities of Mountain View, Santa Clara, Cupertino, and San Jose. Sunnyvale is home to a population of approximately 150,000 people, making it the seventh largest city in the San Francisco Bay Area.
History
Sunnyvale was originally inhabited by the Ohlone Native Americans, who lived in the area for thousands of years before the arrival of Europeans. The first Europeans to settle in the area were the Spanish, who established the Mission Santa Clara de Asís in 1777. The area was then part of the Rancho Pastoria de las Borregas, which was granted to the Sanchez family in 1844. In 1868, Martin Murphy Jr. purchased the land and founded the town of Murphy’s Station. The town was renamed Sunnyvale in 1912, and incorporated as a city in 1914.
Geography
Sunnyvale is located in the southern portion of the San Francisco Bay Area, in Santa Clara County. It is bordered by the cities of Mountain View, Santa Clara, Cupertino, and San Jose. The city covers an area of approximately 25 square miles, and is located at the intersection of US Highway 101 and State Route 237. The city is situated in a valley, with the Santa Cruz Mountains to the west and the Diablo Range to the east.
Economy
Sunnyvale is home to a diverse economy, with a variety of industries represented. The city is home to many technology companies, including Apple, Google, LinkedIn, and Yahoo. Other major employers in the city include Lockheed Martin, Northrop Grumman, and Juniper Networks. The city is also home to a number of retail and dining establishments, as well as a variety of other businesses.
Demographics
As of the 2010 census, the population of Sunnyvale was 140,095. The racial makeup of the city was 57.2% White, 24.2% Asian, 8.3% Hispanic or Latino, 6.2% African American, 0.5% Native American, and 3.6% from other races. The median household income was $90,837, and the median family income was $106,722. The per capita income was $41,945. The city’s population is well-educated, with over 50% of the population having a bachelor’s degree or higher.
Common Questions
What is Per Capita Income in Sunnyvale?
Per Capita income in Sunnyvale is $89,432.
What is the Median Family Income in Sunnyvale?
Median Family Income in Sunnyvale is $190,031.
What is the Median Household income in Sunnyvale?
Median Household Income in Sunnyvale is $174,506.
What is Income or Wage Gap in Sunnyvale?
Income or Wage Gap in Sunnyvale is 35.9%.
Women in Sunnyvale earn 64.1 cents for every dollar earned by a man.
What is Family Income Deficit in Sunnyvale?
Family Income Deficit in Sunnyvale is $10,529.
Families that are below poverty line in Sunnyvale earn $10,529 less on average than the poverty threshold level.
What is Inequality or Gini Index in Sunnyvale?
Inequality or Gini Index in Sunnyvale is 0.45.
What is the Total Population of Sunnyvale?
Total Population of Sunnyvale is 154,573.
What is the Total Male Population of Sunnyvale?
Total Male Population of Sunnyvale is 80,751.
What is the Total Female Population of Sunnyvale?
Total Female Population of Sunnyvale is 73,822.
What is the Ratio of Males per 100 Females in Sunnyvale?
There are 109.39 Males per 100 Females in Sunnyvale.
What is the Ratio of Females per 100 Males in Sunnyvale?
There are 91.42 Females per 100 Males in Sunnyvale.
What is the Median Population Age in Sunnyvale?
Median Population Age in Sunnyvale is 35.1 Years.
What is the Average Family Size in Sunnyvale
Average Family Size in Sunnyvale is 3.1 People.
What is the Average Household Size in Sunnyvale
Average Household Size in Sunnyvale is 2.6 People.
How Large is the Labor Force in Sunnyvale?
There are 90,971 People in the Labor Forcein in Sunnyvale.
What is the Percentage of People in the Labor Force in Sunnyvale?
71.8% of People are in the Labor Force in Sunnyvale.
What is the Unemployment Rate in Sunnyvale?
Unemployment Rate in Sunnyvale is 4.1%.